Download Quantized Cooperative Control

Transcript
MANGO Classes-Modelica Classes of the
Norvegian Grid for iTesla and
Software-to-Software Validation
August 18, 2014
MENGJIA ZHANG
Master’s Degree Project
Stockholm, Sweden 2014
XR-EE-EPS 2014:009
School of Electrical Engineering, KTH Royal
Institute of Technology, Sweden
Electrical Power Systems Division
MANGO Classes-Modelica Classes of the Norvegian
Grid
for iTesla and Software-to-Software Validation
— Diploma Thesis —
Supervisor:
Maxime Baudette
Examiner
Dr. Luigi Vanfretti
February 2014 to August 2014
ii
Abstract
Recent efforts of collaboration between the European transmission system operators have led to
an increased interest in common research projects concerning power system analysis. The iTesla
project is an example of European collaboration that focus on developing common tools for the
simulation and analysis of large scale power systems. The work carried out during the thesis is a
part of the iTesla project in which Modelica has been selected as a common simulation platform.
The work encompasses the development of Modelica classes for power grid components used in
different Norwegian grid dynamic Models.
The simulation platform PSS/E is used as a reference software for the developed power system
models. In this thesis power system models have been implemented in Modelica. The performance of these Modelica classes have been validated through comparing between the behavior of
the developed and reference models in dynamic simulations. The validation process simulating
several small scale power system models and a subset of the Norwegian grid model that have been
identically implemented in both simulation platforms. The results from the dynamic simulation
under different perturbation have been compared in accuracy to validate the work.
iii
iv
Acknowledgments
There are a lot of people I would like to thank for help me during this thesis work. Firstly, I’d
like to thank my supervisor and examiner Prof. Luigi Vanfretti for giving me the opportunity to
carry out a small project to build Modelica SVC models last summer and then further providing
me the chance to work on this project. I’d like thank him also for trusting me and providing me
with the necessary training about Modelica and PSS/E in order to carry out this thesis’s work.
Further more, I’d like to thank him for being patient with me, providing guidance generously, and
encouraging me to explore and carry out my own idea during working.
Secondly, I’d like to thank my direct supervisor Maxime Baudette for keeping good track and
providing good advices for my work. His suggestions towards the my report and presentation of
the project are really appreciate.
Finally, I’d like to thank Statnett for their help in the project by providing information and resources of the power grid models. Also I’d like to thank my colleagues in SmarTS Lab group at
EPS ( Electrical Power System )department of KTH (The Royal Institute of Sweden)for having
good discussion with me which helps me to organize my analysis. Also I would like to thank my
parents and all of my friends. Thank them for providing good accompany encouragement.
Mengjia Zhang
June
v
vi
Contents
Notation
1 Introduction
1.1 Background .
1.2 iTesla . . . .
1.3 Objectives . .
1.4 The outline of
ix
.
.
.
.
.
.
.
.
.
.
.
.
.
.
.
.
.
.
.
.
.
.
.
.
.
.
.
.
.
.
.
.
.
.
.
.
.
.
.
.
.
.
.
.
.
.
.
.
.
.
.
.
.
.
.
.
.
.
.
.
.
.
.
.
1
1
1
2
2
2 Software Environment
2.1 Introduction to PSS/E . . . . . . . . . . . . . . . . . . .
2.1.1 Power System Models and Simulation Procedure
2.1.2 Integration Algorithm . . . . . . . . . . . . . . .
2.2 Introduction to Modelica . . . . . . . . . . . . . . . . . .
2.2.1 Modelica Langange Specification . . . . . . . . .
2.3 Dymola, the Modelica simulation environment . . . . . .
2.3.1 solvers . . . . . . . . . . . . . . . . . . . . . . . .
.
.
.
.
.
.
.
.
.
.
.
.
.
.
.
.
.
.
.
.
.
.
.
.
.
.
.
.
.
.
.
.
.
.
.
.
.
.
.
.
.
.
.
.
.
.
.
.
.
.
.
.
.
.
.
.
.
.
.
.
.
.
.
.
.
.
.
.
.
.
.
.
.
.
.
.
.
.
.
.
.
.
.
.
.
.
.
.
.
.
.
.
.
.
.
.
.
.
.
.
.
.
.
.
.
3
3
3
4
5
5
7
9
3 Model Development and Implementation
3.1 Electrical Components . . . . . . . . . . .
3.1.1 Basic Composite Load . . . . . . .
3.1.2 Frequency dependent load . . . . .
3.1.3 Transformer Models . . . . . . . .
3.1.4 Synchronous generator . . . . . . .
3.2 Nonelectrical Element . . . . . . . . . . .
3.2.1 Excitation System . . . . . . . . .
3.2.2 Power System Stabilizer . . . . . .
3.2.3 Governor System . . . . . . . . . .
. . . . . .
. . . . . .
. . . . . .
the thesis
.
.
.
.
.
.
.
.
.
.
.
.
.
.
.
.
.
.
.
.
.
.
.
.
.
.
.
.
.
.
.
.
.
.
.
.
.
.
.
.
.
.
.
.
.
.
.
.
.
.
.
.
.
4 Model Validation
4.1 Small-Scale Power System Tests . . . . . . .
4.1.1 Validation of Genrou . . . . . . . . .
4.1.2 Validation of Gensal . . . . . . . . .
4.1.3 Validation of IEEET2 and IEESGO
4.1.4 Validation of SCRXS and HYGOV .
4.1.5 Validation of IEEET1, STAB2A and
4.1.6 Validation of OLTC . . . . . . . . .
4.2 Real World Power System . . . . . . . . . .
4.3 AKD . . . . . . . . . . . . . . . . . . . . . .
4.3.1 System Setup . . . . . . . . . . . . .
4.3.2 Validation result . . . . . . . . . . .
5 Conclusion
.
.
.
.
.
.
.
.
.
.
.
.
.
.
.
.
.
.
.
.
.
.
.
.
.
.
.
.
.
.
.
.
.
.
.
.
.
.
.
.
.
.
.
.
.
.
.
.
.
.
.
.
.
.
.
.
.
.
.
.
.
.
.
.
.
.
.
.
.
.
.
.
.
.
.
.
.
.
.
.
.
.
.
.
.
.
.
.
.
.
.
.
.
.
.
.
.
.
.
.
.
.
.
.
.
.
.
.
.
.
.
.
.
.
.
.
.
.
.
.
.
.
.
.
.
.
.
.
.
.
.
.
.
.
.
.
.
.
.
.
.
.
.
.
.
.
.
.
.
.
.
.
.
.
.
.
.
.
.
.
.
.
.
.
.
.
.
.
.
.
.
.
.
.
.
.
.
11
12
12
14
15
20
24
24
30
32
. . . . . .
. . . . . .
. . . . . .
. . . . . .
. . . . . .
LFDRAL
. . . . . .
. . . . . .
. . . . . .
. . . . . .
. . . . . .
.
.
.
.
.
.
.
.
.
.
.
.
.
.
.
.
.
.
.
.
.
.
.
.
.
.
.
.
.
.
.
.
.
.
.
.
.
.
.
.
.
.
.
.
.
.
.
.
.
.
.
.
.
.
.
.
.
.
.
.
.
.
.
.
.
.
.
.
.
.
.
.
.
.
.
.
.
.
.
.
.
.
.
.
.
.
.
.
.
.
.
.
.
.
.
.
.
.
.
.
.
.
.
.
.
.
.
.
.
.
.
.
.
.
.
.
.
.
.
.
.
.
.
.
.
.
.
.
.
.
.
.
.
.
.
.
.
.
.
.
.
.
.
.
.
.
.
.
.
.
.
.
.
.
.
.
.
.
.
.
.
.
.
.
.
.
.
.
.
.
.
.
.
.
.
.
37
38
42
45
47
50
51
56
58
58
58
58
.
.
.
.
.
.
.
.
.
.
.
.
.
.
.
.
.
.
.
.
.
.
.
.
.
.
.
.
.
.
.
.
.
.
.
.
.
.
.
.
.
.
.
.
.
61
vii
viii
CONTENTS
A Appendix
A.1 Dynamic parameter . . . . . . . . . . . . . . . . . . . . . . . . . . . . . . . . . . .
63
63
Notation
∆ω
per unit speed deviation from synchronous
δ
angle between quadrature axis and terminal voltage
ω
per unit speed of generator
ψd0
direct axis flux linkages
ψq0
quadrature axis flux linkages
Ed0
Voltage proportional to quadrature axis flux linkages
Eq0
Voltage proportional to direct axis flux linkages
ed , eq
Armature voltage, direct and quadrature axis components
Ef d
generator field voltage(one per unit is the value for 1 per unit terminal voltage on the air
gap line, open circuit)
id , iq
Armature current, direct and quadrature axis components
P
active power
Pe
electrical power
Q
reactive power
Te
electrical torque
Tm
mechanical torque
vt
terminal voltage
x(t),x vector of differential variables
y(t),y vector of differential variables
BDF
Backward Differentiation formula
DAE
Differential and Algebraic Equations
ODE
Ordinary Differential Equations
PSAT Power System Analysis Toolbox
PSS/E Power System Analysis for Engineer
SMIB Single Machine Infinite Bus
SPS
SimPowerSystem
ix
x
Notation
1
1.1
Introduction
Background
Over the past decades the European electricity networks have changed drastically. The environmental impact of the energy production has become a major driver of the extension of the
European grids. Thus, the share of renewable energy sources is increasing, bringing always more
intermittent energy sources. Also, the progressive construction of a single European electricity
market leads to more power exchanges across Europe. As a results the Pan-European electricity
networks are becoming more and more complex to be operated. This has led to an increased need
of collaboration between the different European transmission system operators (TSOs), which in
turn motivated more common research projects in the power system domain.
The harmonization of this domain is indeed a key factor for the success of the operation of the
future grid. However, nowadays, most TSOs use different simulation software for carrying out
system analyses. This fact introduces the obstacle on the way towards harmonizing operation
procedure since models and data format can not be transferred easily from one software to another.
Numerous efforts have been made by power system community on facilitating the model exchange
between different simulation platforms. But all the dynamical aspect of the modes is left apart
for now.
1.2
iTesla
The Innovation Tools for Electrical System Security within Large Area, iTesla project[1], is an
example of such research collaboration between European institutes and TSOs. The goal of the
project is to develop and validate an open inter-operable toolbox which will be able to support the
future operation of the Pan-European grid[1]. One of the challenge which the tool box has to take
up is to perform accurate security assessments taking into account the dynamics of the system
using time-domain simulations. This will be achieved through the development of different tolls
and algorithms that will be validated with reference power system network models. This work
requires, however, a simulation platform for power system models that is both common among
the participants of the project, and extensible enough for being used by the tools to be developed.
In the contexts of this project, the Modelica language was selected to be the common simulation
environment. The different models for power system networks will be developed in Modelica language, which will require the development of all the power system components as dynamic models.
All of the models developed will contribute to creating a library. Modelica, as a multi-domain,
equation base, declarative programming language, satisfies all the requirements for modeling complex power system with such consistent format of dynamic power grid models. By utilizing equations, the causality of the models are eliminated and by adopting the declarative programming
method, the modeling and simulation algorithm are completely separated [14]. Thanks to these
features of Modelica, the work of modelers remain only deriving mathematical representation of
1
2
CHAPTER 1. INTRODUCTION
the models instead of building the equations as well as designing the computation procedure of
the them. Also, Modelica language is very easy for one to understand which will facilitate the
reuse of modeling knowledge and speed up the procedure of building new models and verification
the old ones.
Currently, Modelica community continues making more effort on releasing Modelica as a standard
language. As it is a standardized language, model exchange will never be a problem as long as
every modeler build models according to Modelica specification. There are now several simulation
platforms which can support Modelica language both commercially and free of charge. Such as
OpenModelica, JModelica, Dymola, MapleSim, SimulationX, Mathematica, SystemModeler etc.
The Modelica code can also be exported and be simulated in other software which is widely used
in today’s industry such as MATLAB thanks to the function of Flexible Mock-up Interface (FMI).
This feature enables future optimization and the on-line identification of power system models.
1.3
Objectives
This thesis was carried out as a collaboration with the Norwegian grid, Statnett, as part of their
involvement in the iTesla project. Statnett will provide some of the reference models for iTesla.
These models were correctly developed in the PSS/E software and will need to be implemented
in the Modelica language. The work was divided into two projects: MANGO classes, whcih if
focusing on the development of Modelica classes for each component model used in the Norwegian
grid models; and MANGO models, which is focusing on the development of the grid models in
Modelica. The work presented here is related to the first projects.
The work in this thesis is further divided into two parts: implementation and validation. There
are two problems should be solved during the stage of implementation. The first one is to derive
the correct mathematical representation of the models and the second one is to solve the initialization problem of them. Once all of the models are ready, different simulation tests should be
performed in order to validate the performance of the developed models. The procedure contains
four steps: building small scale power system models in reference software PSS/E, finding proper
scenario and recording simulation results, setting up the same test systems in Dymoal and finally
comparing the performance from two software.
1.4
The outline of the thesis
The remaining parts of the thesis is organized as follows. Firstly, a brief introduction of the
software PSS/E and the specification of Modelica language are given in Chapter 2. Chapter 3
covers the mathematic representation of the dynamic Norwegian grid components. After that,
the readers are supposed to have the basic idea of how the implementation should be performed.
Chapter 4 describes some examples to further explain the detail of implementation method of the
components. The results of validation are analyzed in Chapter 5. The discussion based on the
validation results will be presented in Chapter 6. The thesis is ended by the conclusion and future
work in Chapter 7.
2
Software Environment
This chapter gives a brief introduction to the main software environments used in this thesis. As
explained in the introduction, the work will utilize two different software environments, namely
Power System Simulator for Engineer (PSS/E) and Modelica. The first part of this Chapter
provides a brief introduction of PSS/E including a general explanation of the network modeling
method, the simulation engine algorithm and the dynamic analysis procedure of the software.
Secondly, the Modelica language together with Dymola will be introduced. A brief explanation
of the layout and basic function of Dymola and a brief summary of the key specification of the
Modelica language will be provided.
2.1
Introduction to PSS/E
PSS/E is an integrated set of computer programs for studies of power system transmission network
and generation performance in both steady-state and dynamic conditions. Considering timescale,
PSS/E focuses on the analysis of electromechanical transient behavior of the generators and their
controls named transient stability analysis.
2.1.1
Power System Models and Simulation Procedure
Power systems in PSS/E are modeled by a set of algebraic equations for the voltages and currents
phasors at the fundamental frequency. The dynamic behavior of the system depends on the differential equations of the flux linkage, rotor speed, and controllers of generators. The transmission
system of the network is modeled by linear algebraic equations of the voltage and current phasors
derived from Kirchhoff’s laws. The nonlinearity is introduced by the characteristics of generators
and loads such as the magnetic saturation function of generators. The interface between the electrical components and the network uses the specific voltage-current characteristics determined by
each dynamic components.
The software PSS/E has several power flow routines, where the equations of the network are expressed as constant admittance matrix. Both transmission lines and transformers are modeled by
equivalent series and shunt admittance, but the difference is that a complex nominal tap ratio introduced by transformers can allow modification of voltage phasors at both ends. During dynamic
simulation, however, the dynamic of the generators and the loads demands are included, which
requires a conversion step. The synchronous generators are modeled by a Norton equivalent of
which the instantaneous values are governed by the differential equations of rotor speed and flux
linkages. Loads are modeled as a adjustable mix of constant current characteristic and constant
impedance characteristic. After conversion of loads and generators, the admittance matrix is updated and the power flow solution is update for compensating the small mismatches introduced
by the conversion step.
3
4
CHAPTER 2. SOFTWARE ENVIRONMENT
The dynamic simulation begin by an initialization step using the power flow data. The internal
initialization of every components is performed using the algebraic equations of the models and
the new set of equations derived from the differential equations of the models by setting the time
derivate of the state variables to be zero. Thus the dynamic simulation starts from a point of
steady state operation.
The main skeleton of PSS/E only contains logic for data input, output, numerical integration,
and electric network solution, but contains no logic related to differential equations of dynamic
equipments. They are written in subroutines. Whenever there are needs to calculate the numerical values of time derivatives for one dynamic equipment, the corresponding subroutine which
contains such calculation logic is then called by the main skeleton for initialization stage or for
dynamic simulation within each time step. The procedure is shown as in Fig 2.1.
PSS/E allows user-defined models, but the development procedure is rather complicated. It
Figure 2.1: PSS/E simulation procedure[9].
implies to identify the different state variables of the model and derive the equations for their integration. The model should also include the interfacing code defining the causality of the system
as well as handling the data input. However, all models are to be developed in FORTRAN or
FLECS and compiled for their integration into PSS/E preventing any future editing.
2.1.2
Integration Algorithm
The integration technique applied in PSS/E is an explicit method belonging to the family of the
Second-Order Runge-Kutta method[9]. PSS/E solver applies integration algorithm to the values
taken from the last iteration to calculate the new values. The nature of this computation process
is discrete and can be viewed as a transfer function. Thus, it was expressed in a Z-transform form
shown below.
F (Z) =
h(3Z − 1)
2Z(Z − 1)
Applying the inverse Z-transform leads to the time domain equation which yields a Two-step
Adams-Bashforth method shown here.
xk = xk−1 +
h
(3fk−1 − fk−2 )
2
2.2. INTRODUCTION TO MODELICA
2.2
5
Introduction to Modelica
Modelica is an equation-based object-oriented modeling language which is capable to describe both
continuous and discrete dynamics of physical systems in a convenient way by a set of differential,
algebraic and discrete equations. Modelica enables the acausal equation-based description of the
complete physical systems by a set of interconnected multi-domain subsystems, which include the
dynamic description with a set of mathematical equations, and the interconnection equations[14].
The language is built by an independent association, the Modelica Association [2], who releases
the specifications. The specifications give the details of the supported functions, the syntax and
the dedicated syntax for graphical representation of the model.
Figure 2.2: Translation stages from Modelica code to executing simulation[12]
2.2.1
Modelica Langange Specification
The modelica language is an object-oriented language. Thus, any model is built as a class with a
set of attributes and a set of equations. The following sections will present the fundamentals of
the language.
2.2.1.1
Class/ Attributes
The Modelica languages defines a set of build-in classes and types that can be used as attributes
in addition to all the other user-defined classes. The attributes of a Modelica class contains: constants, parameters, and variables. By default, all of the variables are continuous time variables
which might evolves their values continuously during simulation. The specific time variability for
variables can be declared by prefixes constant, parameter, discrete. Constants will never change
their value once they have been defined,e.g.,π = 3.1415926....... The value of the variables declared
as parameter can be assigned by users before simulation or after the stage of initialization, but
will remain constant during time-dependent simulation. The discrete variables can change their
values only at event instants during simulation. Furthermore, time is a global built-in variable,
which can be used without declaration.[13]. There are four types of variable by default which are
6
CHAPTER 2. SOFTWARE ENVIRONMENT
shown in Table 2.1:
Table 2.1: Available default variable types
Types
Real
Integer
Boolean
String
Description
floating point,e.g.1.0, −2.3e − 5
integer,e.g.1, −4, 333
boolean,e.g. false, true
string, e.g. ”from file:”
For the sake of making the code more readable and easier to maintain, special keywords as shown
in Table 2.2 are utilized to describe specific class[13].
Table 2.2: Modelica Classes Overview
Types
type
connector
model
block
function
package
record
2.2.1.2
Description
Class to define variable types
Class to define interfaces
Class to define model components
Like model class, but only public input, output or parameter
no internal states, with algorithm section and function-call syntax
Class to define library, no equations
Class to group variable declarations, no equations
Equations/ Algorithm
Equations are added in the equation section after the equation keyword. Differential equations
are expressed with the der-operator. It denotes the time derivative of the expression following in
brackets, the state variable. The states are integrated by the numerical solver to find the solution
ot the problem. Each state requires an initial condition. As the solver will proceed to a symbolic
manipulation of the equation set, there is no requirement on their order nor on their form (e.g.
a + bx = x0 is equivalent to x0 − a = bx). Each component must have a set of equations that
uniquely define its behavior based on its interfaces and initial conditions. There are the following
types of equations:
Table 2.3: Equation Types
Type
initial equation
Equality equation
Connection equation
Conditional equation
Example
der(w)=0
V =R×I
connect(pwpin1.n,pwpin2.p)
if-then; when-end when
Connectors are special types of Modelica classes defining an interface to a model which rules the
physical properties at the boundaries of the models. A connection between two connectors will
generate equations based on two types of connection rules: equality and sum-to-zero. For all
connector variables declared with prefix flow, only one equation will be generated per connection
set i.e.i1 + i2 + i3 = 0. Those without prefix by default is set to be potential variables, and n − 1
equations based on equality rule will be generated per set. Connection between connectors are
regards as equations. The direction of data flow in the connection is treated without causality. But
when the flow directs towards inside of the component, the sign of the variables are considered as
2.3. DYMOLA, THE MODELICA SIMULATION ENVIRONMENT
7
positive by convention. Additionally, one can also specify causal connection by declaring connector
as input or output.
2.2.1.3
Modelica libraries
Modelica like any other object-oriented language is built to reuse existing code. Thus, any collection of models can be gathered as package that are commonly referred to as libraries. These can be
imported in the modeling environment and used in the models being developed. In this work, two
libraries were mainly used, namely, the Modelica Standard Library and the PowerSystem library.
Modelica standard library
The Modelica standard library (MSL) is a free library developed by Modelica Association. The
overview of the library is shown in the left side of Fig. 2.3. The elements in the library can be
used to model multi-domain systems including mechanical (1D/3D), electrical (analog, digital,
machines), thermal, fluid, control systems and hierarchical state machines. To build a system, one
can drag-and-drop the components from the library to the graphical edit screen. Also numerical
functions and functions for strings, files and streams are included[2]. This thesis utilize several
basic blocks such as transfer functions and some numerical functions to build the component
models for control and protection systems.
PowerSystems library
The PowerSystems library is developed within iTesla project shown in Fig. 2.3. The elements
in the library can support phasor time-domain simulation of power system models. The dynamic
components models developed in this thesis project will finally be integrated into this library.
Some of the simple models such as Pwline and Pwpin are utilized in this thesis. Pwline is a
pi-equivalent model of transmission line. And Pwpin is the connector for setting up connection
between electrical components.
PwPin defines voltage and current as complex variables. Four variables are declared within
PwPin connector, and they are real and imaginary part of potential variables voltage and flow
variables current. For other components like synchronous machines regulator, Realinput from
Modelica library are adopted, and only potential variables are declared for signal communication.
2.3
Dymola, the Modelica simulation environment
As the Modelica is developed as a language with detailed specification, several tolls have been
developed by different vendors to support it. The development and simulation environment used
in this work is Dymola, the Dynamic Modeling Laboratory, from Dynasim company[3]. Dymola
incorporates a set of advanced solvers that can perform simulations of complex hybrid systems.
The tool’s interface is divided into two tabs, one dedicated to the models development, and the
other dedicated to the simulations. The modeling environment is shown in Fig. 2.4. In this
mode, models can be explored, edited or created. It features a package browser for drag-and-drop
interactions for building more complex models from single blocks.
The simulation model is activated when clicking on the simulation tab in the Power-right corner
of the interface. Thus, the interface switches to an environment for carrying out simulations and
analyzing of the results, as depicted on Fig. 2.5. The first step is the syntax check, that will
ensure that the model is correct regarding the syntax itself, the balance in number of variables
and equations and the number of initialization equations. The next step is the simulation that
will perform all the steps of equation set analysis, simplification, flattening and compilation to
8
CHAPTER 2. SOFTWARE ENVIRONMENT
(a) Modelica standard
library.
(b) PowerSystems Library.
Figure 2.3: Overview of MSL and PowerSystems Library.
executable C-code before starting the simulation.
The information about these intermediary steps can be shown in the translation log, with for
example, the number of linear and non-linear equations. Note that the simulation settings can be
configured in this interface through a configuration dialog shown on Fig. 2.6. The default settings
use the DASSL solver with a tolerance of 0.0001 and retain 500 intervals to plot.
After performing the simulation, the variables are accessible through variable browser which contains parameters and variables of the simulated model. Except those defined with prefix protected, all of the variables will be listed hierarchal in the browser and can be plotted by dragand-drop the variables to the plot diagram. Up to 99 different simulation results can be shown
simultaneously in the Variable Browser. Furthermore, the information about the executed simulations such as CPU time, function and Jacobian evaluations, and the number of events and result
points are available in the prompt up simulation log.
2.3. DYMOLA, THE MODELICA SIMULATION ENVIRONMENT
9
Figure 2.4: Screen shot of the Interface of Dymola (Modeling mode)
Figure 2.5: Screen shot of the Interface of Dymola (Simulation mode)
2.3.1
solvers
Currently, Dymola provides ten different integration methods with fixed step size and variable
step size. An integration method approximates the solution internally by a polynomial of order
k. Some methods such as Euler, Rkfix use a fixed order while other methods such as DASSL,
LSODAR vary the order during simulation. In this work, only the Rkfix 2 and DASSL integration
method were used.
Rkfix2 is a 2nd order Runge-kutta fixed step solver. This method can only handle the ordinary
differential equation type, no stiff system models. Although power system models contain DAEs,
Dymola converts the model to explicit ODE form first before the simulation. All of the tests in
this thesis project have used Rkfix2 as solver since this is the most similar one to the PSS/E solver.
The equation of the algorithm is shown as below.
10
CHAPTER 2. SOFTWARE ENVIRONMENT
Figure 2.6: Over view of Dymola
1
1
xk+1 = xk + hf (tk + h, xk + hf (tk , xk ))
2
2
DASSL is a variable-step, variable-order method which implements the backward differentiation
formula (BDF) from order one to five in DAE format. Since the integration method used by the
DASSL solver differ strongly from the one used by PSS/E. It will only by used during development
phases in this thesis.
3
Model Development and Implementation
The goal of the this thesis is to build a corresponding Modelica class for each component model
used in the Norwegian grid. There are seventeen models in total was developed in this project.
The models include synchronous machines and its regulators, transformers and composite load
models. The detail of modeling method was described in this chapter.
The models were originally developed in PSS/E. Thus it is necessary to fully study the documentations of PSS/E to first understand the modeling background and usage of each component
model and then implement the model in Modelica language srespect to the model specification.To
implement the model in Modelica, it is suggested that one should follow the following two steps:
1. Define the input/output interface of the model. The power grid components will finally
be connected and integrate to different system models. Each components take information from
system and influence the system’s behavior by varying its output respect to its own dynamics.
There are two different types of interface are available for power system modeling: electrical connector and nonelectrical connector. Electrical connector is a special type of Modelica class which
contains four variables to represent the voltage and current phasor. The power flow information
is transferred from one electrical connector to another. Nonelectrical connectors are mainly real
input/output connectors which are utilized to connect different blocks of control system.
2. Declare the attributions of each model. The parameters and input/output variables
should be declared respect to the model specification. The equations of could be declared as normal equations or connection equations which depends on the modeling method of the models. In
this these, all electrical components were modeled textually where normal equations were utilized
while nonelectrical components were modeled graphically where connection equations were applied.
3. Solve the initialization problem of the model. A start value should be provided for each
state variable in order to give a start point for the integrator of the software to process calculation.
The whole start value set are called the equilibrium of the system. Generally, the equilibrium are
calculated by power flow which omits the detailed dynamics of the devices. Thus extra calculation
should be performed within the model to obtain the initial value of each state.
The rest of this chapter will go through the modeling procedures of all the models. The models are
characterized into two categories: electrical components and nonelectrical components. Electrical
components are models which participate in power flow directly such as synchronous machines,
transformers, composite loads, and static-var-compensator. Nonelectrical components are models
which are signal process systems working to control the system such as excitation system, governor
system, stabilization system and on-load-tap-changer.
11
12
CHAPTER 3. MODEL DEVELOPMENT AND IMPLEMENTATION
3.1
3.1.1
Electrical Components
Basic Composite Load
The composite load model from PSS/E includes a load conversation procedure and special dynamic
variation function. Although there are already load models in the PowerSystem library, none of
them was matching the load mode available in PSS/E. Since the load model plays a crucial role
in power exchange, it is necessary to implement the same load model in order to have the same
test system in both software. The focus are first implement the model to represent the mentioned
special feature of the composite loadd in PSS/E and then further developed the model to include
the frequency dependent characteristic and the function of load varying.
The PSS/E load model is defined by a constant MVA load for steady-state studies. The value
is then converted for the dynamic studies into a mix of constant power, constant current, and
constant admittance load components with user defined portion ratio. After that the resulted
constant current and constant admittance load is added to any existing load represented by those
characteristics.
The converting process following the rules below:
aSp
V
bSp
SY = Sy + 2
V
SP = Sp × (1 − a − b)
SI = Si +
(3.1)
where:
Sp
Original constant M V A load
Si
Original constant current load
Sy
Original constant shunt admittance load
SP
Final constant M V A load
SI
Final constant current load
SY
Final constant shunt admittance load
a, b
V
Load transfer fractions,(a + b) < 1
Magnitude of bus voltage when load conversion is made
The PSS/E models also include a shedding factor for the constant power load share when the voltage level goes under a predetermined threshold. This threshold is set in the solution parameter
PQBRAK. The resulting characteristic is shown in Fig. 3.1(a) which describes the behavior of
the constant power load as functions of bus voltage respecting to different PQBRAK with values
of 0.6, 0.7, 0.8 p.u.. Similarly, the amount for constant current load share should be reduced when
the bus voltage goes below 0.5 p.u. as shown in Fig. 3.1(b). These feature are represented by a
shedding factor that is multiplied to the normal values.
Even thought the PSS/E documentation provides the figures 3.1(a)and 3.1(b), the exact equations
of these curves is not documented. The figures were therefore used in MATLAB to find the best
fitting expressions that will be used for the Modelica models. In this thesis, only two curves are
extracted, one is the shedding factor function KP = f (V ) for constant power load with PQBRAK
of 0.7, the other is that of constant current load, KI = f (V ).
3.1. ELECTRICAL COMPONENTS
(a) Constant Power Load Characteristic
(b) Constant Current Load Characteristic
Figure 3.1: PSS/E Specified Load Characteristic
13
14
CHAPTER 3. MODEL DEVELOPMENT AND IMPLEMENTATION
KP =
KI =
0.4881 − 0.4999 cos(3.964V ) + 0.1389 sin(3.964V ) V < 0.7
1
V > 0.7
(3.2)
2.657V 0.769 exp (−1.502V 1.769 ) V < 0.5
1
V > 0.5
(3.3)
The model developed in Modelica for a composite load adopts the same strategy as the PSS/E
model, but includes also all the function related to the conversion and saturation. Therefore, the
user is offered the possibility to configure the following parameters shown in Table 3.1:
Table 3.1: Composite Load Parameters
Parameter
Sp
Si
Sy
a
b
P QBRAK
Type
Comp.
Comp.
Comp.
Comp.
Comp.
Real
Description
Original constant power load
Original constant current load
Original constant shunt admittance load
Coverting fraction for constant I load
Coverting fraction for constant Z load
Constant power characteristic threshold
Unit
p.u
p.u
p.u
p.u.
The voltage and current characteristics for the load should be then specified as following:
~ I~
P + jQ = V
P = KP <(SP ) + KI <(SI )V + <(SY )V 2
Q = KI =(SP ) + KI =(SI )V + =(SY )V
3.1.2
(3.4)
2
Frequency dependent load
In addition to the composite load model presented previously, the Norwegian grid model includes a
frequency dependent model. The model used in PSS/E is LDFRAL. The model makes the constant
current and MVA components of all loads dependent on bus frequency according to following rules:
ω m
)
ωo
ω
Q = Qo ( )n
ωo
ω
Ip = Ipo ( )r
ωo
ω
Iq = Iqo ( )s
ωo
P = Po (
(3.5)
where the frequency is derived from the derivative of the load bus angle. wbase in the equation is
the base frequency.
˙ = wbase × ω
Angle
In the above equations, P, Q, Ip , Iq stand for the value of the load respect to constant power and
constant characteristic respectively. The power share of the load depends on the original value
multiplies the power of nominal frequency with user defined power factor for different load share.
Thus for LDFRAL, there are four additional parameter need to be configured.
3.1. ELECTRICAL COMPONENTS
15
Table 3.2: Frequency Dependent Composite Load Parameters
Parameter
m
n
r
s
3.1.3
Type
Real
Real
Real
Real
Description
Real power load frequency exponent
Reactive power load frequency exponent
Real current load frequency exponent
Reactive current load frequency exponent
Unit
-
Transformer Models
In this section two transformer models will be presented; a two-winding transformer model and
a three-winding transformer model. Both models are capable to include a phase shift function
and an on load tap changer (OLTC) function. The detail of derivation procedure of the per-unit
transformer equivalent circuit will not be covered, for further information, one can refer to [6][9].
3.1.3.1
Two Windings Transformer
The standard PSS/E two-winding transformer represent the equivalent one line diagram shown
in Fig. 3.2. This is the standard positive sequence transformer model as recognized by the great
majority of utility databases and by the IEEE Common Format for Exchange of Solved Load
Flow Cases. The quantities from the primary side are indicated with the subscript ”i” and the
quantities from the secondary side with the subscript ”j”. Users can specify the per-unit equivalent
resistance R and reactant X.
Figure 3.2: Two Winding Transformer Model[9]
The equations of two-winding transformers are similar with those of transmission line model in
PowerSystems library if the tap ratio is unit one. But user can also specified the per-unit winding
ratio other than one t. The connector one primary side was named as n and that of secondary
side as p then the equations for the transformer models could be decried as:
t × (R × n.ir − X × n.ii) = n.vr − p.vr × t;
t × (R × n.ii + X × n.ir) = n.vi − p.vi × t;
− (R × p.ir − X × p.ii) = n.vr − p.vr × t;
(3.6)
− (R × p.ii + X × p.ir) = n.vi − p.vi × t;
3.1.3.2
Three Windings Transformer
The three windings transformer is modeled as three two-winding transformers connected their
secondary winding side together at a common star point bus as shown in Fig. 3.3. Users should
16
CHAPTER 3. MODEL DEVELOPMENT AND IMPLEMENTATION
specified the per-unit between windings leakage impedances obtained from short circuit tests and
the model will automatically calculate the three equivalent leakage impedances of each windings.
n
The calculation follows the Equation 3.7. The complex off-nominal taps tjφ
n (n = 1, 2, 3) only
associate with the primary side winding which is connected to network bus, while the secondary
winding side always has a tap ratio with its value equals to 1.
Figure 3.3: Three-Winding Transformer Model[22]
Z12 + Z13 − Z23
2
Z12 + Z23 − Z13
(3.7)
Z2 =
2
Z23 + Z13 − Z12
Z3 =
2
In Modelica, this construction is achieved easily, the three-winding transformer can be built by
directly connecting the secondary side of three two-winding transformers together and the corresponding equations will be generated automatically.
Z1 =
3.1.3.3
Phase shift
The power flow through the transformer can be controlled by controlling the phase shift angle of a
transformer. Introducing a shift angle to both voltage and current components in the same direction can be interpreted as viewing the original voltage and current phasor from a new coordinate
which is rotated with the shift angle in reverse direction. That means, it is the same as changing
the reference frame. To make it more clear, it is shown in Fig. 3.4. As a consequence, the phase
shift transformer was modeled by adding the equations of Park’s transformation for changing the
coordinate.
V jr
V ji
Ijr
Iji
π
π
A = (−θshif t ×
)+
180
2 sin(A) cos(A)
V ir
=
×
−cos(A) sin(A)
V ii
sin(A) cos(A)
Iir
=−
×
−cos(A) sin(A)
Iii
3.1. ELECTRICAL COMPONENTS
17
Figure 3.4: Phase shift function of transformer
3.1.3.4
On load tap changer OLTC
The tap changer function introduced in the transformer models presented previously was only
statically described. By introduction on-load-tap-changer (OLTC) to the original transformer
model, the bus voltage can be controlled by varied the tap ratio.
The OLTC model in this work, implements a well-established model presented in [24] [23]. It
describes the tap ratio as a function of the time and of the controlled bus voltage. Only minor
modification have been added to fully comply with the PSS/E model, the resulting model is
described by the block diagram in Fig.3.5. It contains a dead zone block, two delay blocks, a sum
block, and a quantization block.
Figure 3.5: Diagram of ULTC Tap Logic[22]
The model is used to control the bus voltage to stay within the controlling band. The measured
voltage is compared with the limits of the controlling band. If the voltage are out of the band by
the user defined tolerance, DB, and lasting more than the delay TD , the tap changer will react to
step the tap ratio to rise or lower the voltage. The mechanical delay, TC , for the tap changer is
also considered which makes the tap ratio changes discretely. The user can define the value for a
extra delay, TSD . Note that delay TSD must be greater than TC to be effective. The corresponding
mathematical representation is provided in the list.
18
CHAPTER 3. MODEL DEVELOPMENT AND IMPLEMENTATION
Listing 3.1: Example of Parameter Decleration
1
2
3
4
5
6
7
8
// Detect the tap action direction
if Vmin - u > dV then
p1 = -1;
elseif u - Vmax > dV then
p1 = 1;
else
p1 =0;
end if ;
9
10
11
12
13
14
15
16
17
18
19
// Count the eclipse time
if n1 > - tau and n1 < tau then
der ( n1 ) = p1 ;
elseif n1 <= - tau and p1 > 0 then
der ( n1 ) = p1 ;
elseif n1 >= tau and p1 < 0 then
der ( n1 ) = p1 ;
else
der ( n1 ) = 0;
end if ;
20
21
22
23
24
25
26
// if the eclipse time is longer then the specified delay , take tap action
if n1 >= tau or n1 <= - tau then
action = true ;
else
action = false ;
end if ;
27
28
29
30
31
32
33
34
35
36
37
// Refresh the timer if direction index change its value
x1 = integer ( p1 );
if change ( x1 ) then
action1 = true ;
else
action1 = false ;
end if ;
when action1 then
reinit ( n1 ,0);
end when ;
38
39
40
41
42
43
44
45
46
47
48
49
50
51
52
53
// take action every TC second according to the mechanical delay
when action then
Timer2 = time ;
end when ;
x2 = integer (( time - Timer2 ) / TC );
when change ( x2 ) and action then
m = pre ( m ) + dtap * pre ( p1 );
end when ;
if m >= Rmax then
y = Rmax ;
elseif m <= Rmin then
y = Rmin ;
else
y=m;
end if ;
Up to now, the transformer models are completed. The parameter configuration for a simple twowinding transformer and three-winding transformer are shown as in Table 3.3 and 3.4 respectively.
If the user enable the OLTC function of the transformer then there are several extra parameters
need to be configured which are shown in Table 3.5.
3.1. ELECTRICAL COMPONENTS
19
Table 3.3: Two-winding Transformer Parameters
Parameter
Zeq
t
θ
Type
Comp.
Real
Real
Description
Equivalent impedance
Off-nominal tap ratio
Phase shift angle
Unit
p.u
degree
Table 3.4: Three-winding Transformer Parameters
Parameter
Z12
Z23
Z13
t1
θ1
t2
θ2
t3
θ3
Type
Comp.
Comp.
Comp.
Real
Real
Real
Real
Real
Real
Description
Leakage impedance between winding 1 and 2
Leakage impedance between winding 3 and 2
Leakage impedance between winding 1 and 3
Off-nominal tap ratio of winding 1
Phase shift angle of winding 1
Off-nominal tap ratio of winding 2
Phase shift angle of winding 2
Off-nominal tap ratio of winding 3
Phase shift angle of winding 3
Unit
p.u
p.u
p.u
degree
degree
degree
Table 3.5: OLTC model Parameters
Parameter
DB
Vmax
Vmin
Rmax
Rmin
TD
TM
TC
TSD
Type
Real
Real
Real
Real
Real
Real
Real
Real
Real
Description
Dead-band of regulator
Upper limit of the voltage control band
lower limit of the voltage control band
Upper limit of the off-nominal turns ratio
lower limit of the off-nominal turns ratio
Time delay of the regulator
Mechanical time delay of the motor
Time delay of the regulator to avoid voltage vibration
Extra user define time delay
Unit
p.u
p.u
p.u
s
s
s
s
20
3.1.4
CHAPTER 3. MODEL DEVELOPMENT AND IMPLEMENTATION
Synchronous generator
Synchronous machine plays an essential role in power system as most of the energy is produced
by different kinds of synchronous generators. In this thesis, two synchronous machine models are
developed. Same assumptions with PSS/E were applied to the models. There are two kinds of
synchronous generators are used in the Norwegian grid models used to represent salient pole and
round pole generator.
Model Genrou represents a solid rotor generator while Gensal models the salient pole generator.
Both of the two models include the effect of saturation. The equations explained in Section 3.1.4.1
to 3.1.4.3 are common for both Genrou and Gensal, but the differential equations described in
Section 3.1.4.4 are different.
Every synchronous machine is modeled in its individual rotor reference frame which is rotate at
the rotor speed and thus the machine quantities became static. On the other hand, all the network
variables are expressed in the reference frame rotates at the synchronous speed, and this coordinate
is named synchronous reference frame. The relationship is indicated in Fig. 3.6.
Figure 3.6: Synchronous and Rotor Coodinate
In the above figure, where generator is represented by a voltage source E behind a dynamic
impedance Xs and angular spatial positions of the generator rotor shaft is defined to be the rotor
angle. The synchronously rotating reference axes <-= axes leading the dq-axes by angle θ = π2 − δ.
The relationship between the quantities expressed in <-= axes and dq-axes are as following:
Vr
sin(δ) cos(δ)
ed
=
×
Vi
−cos(δ) sin(δ)
eq
When the system is subjected to a disturbance, individual machine’s rotating speed deviates
from synchronous speed which causes the unbalance between power generation and consumption.
The dynamic behavior of the machines are mainly affected by rotor flux linkage transients and
magnetic saturation during non-steady-state with 0 to 10HZ. The reference model from PSS/E
are inherently correct representation of electromagnetic synchronizing and damping effects over
the entire frequency band.
3.1. ELECTRICAL COMPONENTS
3.1.4.1
21
Equation of Motion
The electromagnetic torque Te induced by the stator three phase currents can be expressed by the
current and flux linkages in the dq axis:
Te = ψd iq − ψq id
While mechanical torque Tm can take the initial value or provided by corresponding turbine governor. Since Te revolves the rotor, a unbalance between Te and Tm can result in increasing (or
decreasing) rotating energy of generator rotor and thus cause the speed deviation of the generator. To include the effect from damping torque, a term proportional to speed deviation is added.
Hence, the equation of motion is:
2H
dωr
dωr
=Tm − Te − De
dt
ωr
dδ
=ω0 dωr
dt
Tm = mechanical torque in p.u
Te = electromagnetic torque in p.u
ωr = angular velocity of the rotor,electrical. rad/s
δ = rotor angle in p.u
t = time, s
3.1.4.2
Stator voltage Equations
The elect-magnetic relationship between the generator terminal voltage, current and flux linkage
is set up by stator voltage equations. With the flux transients are neglected in the models and
the stator voltage is as following:
ud = −ψq ωr − Ra id
uq =
+ψd ωr − Ra iq
The armature resistance Ra hasn’t been taken into account in the reference models from PSS/E
while the parameter is adjustable in the newly developed models but with a default value zero of
Ra .
3.1.4.3
Magnetic Saturation
The input requirements for characterizing generator saturation for most commercial-grade stability
programs are in terms of a parameter called S. The saturation factor is assumed to have the
quadratic relation with the input voltage (or flux) as shown in Figure 3.7:
The y axis can stand for induced voltage or the flux by the field current represented by x axis,
and A and B are such that the points (1.0, S1.0 ) and (1.2, S1.2 ) lie on the curve as shown in Figure
3.7. With the method of undetermined coefficients, the value of A and B can be calculated by
solving the equations of the two points (1.0, S1.0 ) and (1.2, S1.2 ). Where S1.0 , S1.2 are considered
to be constant parameter for the generator used to determined certain saturation behavior when
the stator terminal voltage is at 1.0 and 1.2 p.u. as in Figure 3.7.
3.1.4.4
Electro-magnetic Equations
The difference between model Genrou and Gensal mainly lies on the differential equations which
describe the electro-magnetic behavior of the models.
22
CHAPTER 3. MODEL DEVELOPMENT AND IMPLEMENTATION
Figure 3.7: Saturation mine function
The following equations corresponding to solid rotor generator, while the equations of Gensal will
be discussed later. The following equations are expressed with standard synchronous machine
parameters shown in Table3.6.
Table 3.6: Standard Synchronous machine parameters of Genrou
Variable
D
H
ra
xl
xd
x0d
x00d
xq
x0q
x00q
0
Td0
00
Td0
0
Tq0
00
Tq0
s10
s12
Description
Damping coefficient
Inertia constant
Armature resistance
Leakage reactance
d-axis synchronous reactance
d-axis transient reactance
d-axis sub-transient reactance
q-axis synchronous reactance
q-axis transient reactance
q-axis sub-transient reactance
d-axis open circuit transient time constant
d-axis open circuit sub-transient time constant
q-axis open circuit transient time constant
q-axis open circuit sub-transient time constant
saturation behavior parameter
Unit
pu
s
pu
pu
pu
pu
pu
pu
pu
pu
s
s
s
s
-
3.1. ELECTRICAL COMPONENTS
23
1
0 (Ef d − Xad If d )
Td0
1
= 0 (−1)(Xaq I1q )
Tq0
1
= 00 (Eq0 − ψkd − (Xd0 − Xl )id )
Td0
1
= 00 (Ed0 − ψkq + (Xq0 − Xl )iq )
Tq0
Ėq0 =
E˙d0
ψ˙kd
ψ˙kq
Xad If d =
(Xd0 − Xd00 )(Xd − Xd0 ) 0
[Eq − ψkd − id (Xd0 − Xl )]
(Xd0 − Xl )2
+ id (Xd − Xd0 ) + Eq0 + Se (|ψ 00 |)ψd00
(Xq0 − Xq00 )(Xq − Xq0 ) 0
[Ed − ψkq + iq (Xq0 − Xl )]
(Xq0 − Xl )2
Xq − Xl 00
− iq (Xq − Xq0 ) + Ed0 − Se (|ψ 00 |)
ψ
Xd − Xl q
Eq0 (Xd00 − Xl ) + ψkd (Xd0 − Xd00 )
ψd00 =
Xd0 − Xl
−Ed0 (Xq00 − Xl ) − ψkq (Xq0 − Xq00 )
ψq00 =
Xq0 − Xl
q
|ψ 00 | = (ψd00 )2 + (ψq00 )2
Xaq Ilq =
ψd = ψd00 − Xd00 id
ψq = ψq00 − Xq00 iq
For salient pole generator, there are in total three rotor circuits. In order to represent the model
in detail, one state variable is introduced for each of the rotor circuit. Additionally, the magnetic
saturation is only account for d axis. The following equations can is the correct representation of
its electro-magnetic behavior. The standard parameters is shown in Table3.7.
Table 3.7: GENSAL
Variable
0
Tdo
00
Tdo
00
Tqo
H
D
Xd
Xq
Xd0
Xd00
Xl
S(1.0)
S(1.2)
Description
d-axis transient open-circuit time constant
d-axis sub-transient open-circuit time constant
q-axis sub-transient open-circuit time constant
Inertial,H
Speed damping
d-axis reactance
q-axis reactance
d-axis transient reactance
d-axis sub-transient reactanc
leakage reactance
Saturation factor
Saturation factor
Unit
sec
sec
sec
sec
p.u.
p.u.
p.u.
s
s
p.u.
p.u.
24
CHAPTER 3. MODEL DEVELOPMENT AND IMPLEMENTATION
1
0 (Ef d − Xad If d )
Td0
1
ψ˙kd = 00 (Eq0 − ψkd − (Xd0 − Xl )id )
Td0
−1
ψ˙q00 = 00 (ψq00 + (Xq0 − Xq00 )iq )
Tq0
Ėq0 =
Xad If d =
(Xd0 − Xd00 )(Xd − Xd0 ) 0
[Eq − ψkd − id (Xd0 − Xl )]
(Xd0 − Xl )2
+ id (Xd − Xd0 ) + Eq0 + Se (Eq0 )Eq0
ψd00 =
Eq0 (Xd00 − Xl ) + ψkd (Xd0 − Xd00 )
Xd0 − Xl
ψd = ψd00 − Xd00 id
ψq = ψq00 − Xq00 iq
3.2
Nonelectrical Element
A grid model contains not only the electrical components which participate in the power flow
directly but also different control systems which regulate the control signal of the generator and
therefore have a strong influence on the dynamic behavior of the system.
3.2.1
Excitation System
The direct field current of the generator has a directly impact on its terminal bus voltage. This
field current is supplied and controlled by the excitation system. This system take the measured
voltage magnitude from generator’s terminal bus and compare it with the set point, and then it
will modify the field current of the generator to get desire output voltage from the generator.
There are different types of exciter models. According to the structure of their power-supply circuit, they could be sorted into three main branches: Direct Current Commutator Exciters (DC
exciter), Alternator Supplied Rectifier Excitation Systems (AC exciter) and Static Excitation Systems.
While DC exciter can be future identified as separately excited exciter or shunt excited
exciter. The circuits of these two types of DC exciters are shown in the following figures. In the
figures R is the field resistance, L is the unsaturated inductance and V is the output from voltage
regulator. On the other hand, normally AC exciters are separated exited exciters, and because
their only load is a rectifier, their magnetic behavior can be modeled in the same way as that of
DC exciters with acceptable accuracy. Thus the following discussion would mainly focus on DC
exciter, since AC exciter can be represented by the same model used to describe separately excited
DC exciter.
The equations for the separately excited exciter is shown as in Equation 3.8. To take into
account the saturation effect, the saturation factor is included in the equation. The calculation of Se follows the same definition as it is described in Section 3.1.4.3, the only difference
is that the Se is now a function of field voltage Ef d instead of the flux linkage. To specified
the certain saturation behavior, two points lying along the saturation curve must be specified as
parameters(E1 , Se (E1 )), (E2 , Se (E2 )).
V
L dEf d
=
− Ef d − Se Ef d
R dt
R
(3.8)
3.2. NONELECTRICAL ELEMENT
25
(a) separately excited exciter
(b) shunt excited exciter
Figure 3.8: Equivalent excited circuit for Exciter
By setting:
L
R
Ke =1
Te =
Practically, field resistance R is an adjustable value but is assumed that the adjustment has been
done for each new per-event steady-state condition. Thus the recalculation of R must be included
in the initialization stage and then it is considered to remain constant during dynamic simulation.
Since the value of R might vary little around unity, Te can be taken as constant.
For shunt excited exciter, since the power source provide the power to both field and armature
circuit of the excitation system, the equation remains almost the same as before but with an
additional term in the right hand side and it is shown as in Equation 3.9.
V
1
L dEf d
=
− (1 − )Ef d − Se Ef d
R dt
R
R
To simply the equation, we set:
Te =
(3.9)
L
R
Ke =1 −
1
R
Since R is around unity, thus Ke will be significantly influenced by R so that it must be adjusted
to an appropriate value during initializing. The models developed in this work adopt the same
configuration as the PSS/E model. It is possible to specify the value manually or let the model
calculate the value itself. The model can handle the calculation of Ke automatically and also the
relative parameters Vrmax and Vrmin if they are specified as zero by users. The logic for calculation
is shown as below.
Vrmax
− Se (Ef d )
Ke =
10Ef d
Vrmax = Se (E2 )E2 + Ke
Vrmax = Se (E2 )E2
Ke = 0
Ke > 0, Vrmax = 0
Ke <= 0, Vrmax = 0
The equations derived in previous section only cover the part of exciter model for excitation system, however, there are also voltage sensor and regulator should be modeled. But the way of
modeling them are typical and relative simpler then that of exciter, thus the discussion of them
are dropped. The models developed in this thesis are IEEET1, IEEET2, SEXS and SCRXS.
26
CHAPTER 3. MODEL DEVELOPMENT AND IMPLEMENTATION
The equations can be simplified and be expressed as transfer block diagrams.
IEEET1 is an IEEE standard excitation system model which could represent either a DC or a AC
type system depends on the value of parameter Ke . The model also take into account the power
supply limit, the stabilization feedback loop and the saturation effect. The transfer diagram of
the model is shown in Fig. 3.9
Figure 3.9: Block Diagram of IEEET1
When it is used to represent DC type excitation system, it is recommended that Ke , Vrmax , Vrmin
should be set to be zero and left the model calculate the values automatically. On the other hand,
when it is used to model a AC type excitation system, Ke should be set to unity while still it is
recommended to let the model itself calculate the values for Vrmax , Vrmin . The parameters of the
model is shown in the Table 3.8.
Table 3.8: IEEET1
Variable
TR
KA
TA
VRM AX
VRM IN
KE
TE
KF
TF
E1
SE (E1 )
E2
SE (E2 )
Description
Voltage sensor time constant
Voltage regulator gain
Voltage regulator time constant
Power source upper limit
Power source lower limit
Exciter equivalent gain
Exciter equivalent time constant
Feedback loop equivalent gain
Feedback loop equivalent time constant
Field voltage value
Saturation factor
Field voltage value
Saturation factor
Unit
sec
sec
sec
sec
p.u.
p.u.
p.u.
s
p.u.
p.u.
p.u.
p.u.
As we have discussed previously, the system mode should be initialized before switching to dynamic analysis. After the initialization of the generator, we can get the initial values of variables
at the boundary of a generator which interfaces with the excitation system. As a result, each block
is initialized by assign a initial value to its state which contributes to make the whole excitation
system satisfies the boundary conditions. In order to properly initialize the states, it is needed
to apply inverse Laplace transformation on the given block diagram. For the sake of analysis,
the input and output of each block is identified by a letter. After transformation, the following
equations is obtained:
3.2. NONELECTRICAL ELEMENT
27
a = b + TR ḃ
KA c = d + TA d˙
e = TE f˙
KF ġ = h + TF ḣ
When it is steady state, the time derivative of all the states are zero,and the output of the exciter
should be the same as the field voltage at steady state. Without compensate circuit, the input of
the exciter should be the initial value of measured generator bus voltage.
a0 = b0 = Vt0
KA c0 = d0
e0 = h0 = 0
f0 = Ef d0
d0 which is the initial regulator output VR0 can be calculated as following. And the reference
voltage is set as:
VR0 = (Se (Ef d0 ) + 1 + KE )Ef d0
VR0
− VS0 + Vt0
Vref =
KA
IEEET2 is also an IEEE standard excitation system model. Differing from IEEET1, IEEET2
take the source used for the excitation system stabilizing feedback as proportional to the control
element output, while IEEET1 takes a stabilization signal proportional to the main output Ef d of
the exciter. The block diagram for the IEEET2 is shown in Figure3.10. And the parameter sheet
is shown in Table3.9.
Figure 3.10: Block Diagram of IEEET2
IEEET2 can be initialized by following the same calculation procedure as before and the initial
value of each states are:
a0 = b0 = Vt0
K A c0 = d 0
e0 = h0 = i0 = 0
f0 = Ef d0
VR0 = (Se (Ef d0 ) + 1 + KE )Ef d0
VR0
Vref =
− VS0 + Vt0
KA
28
CHAPTER 3. MODEL DEVELOPMENT AND IMPLEMENTATION
Table 3.9: IEEET2
Variable
TR
KA
TA
VRM AX
VRM IN
KE
TE
KF
TF 1
TF 2
E1
SE (E1 )
E2
SE (E2 )
Description
Voltage sensor time constant
Voltage regulator gain
Voltage regulator time constant
Power source upper limit
Power source lower limit
Exciter equivalent gain
Exciter equivalent time constant
Feedback loop equivalent gain
Feedback loop equivalent time constant
Field voltage value
Saturation factor
Field voltage value
Saturation factor
Unit
sec
sec
sec
sec
p.u.
p.u.
p.u.
s
s
p.u.
p.u.
p.u.
p.u.
SEXS is a good presentation of general well tuned excitation system without focusing on any
specific types, if the detail design of the excitation system is unknown. It include a basic representation of the excitation power source (with the gain K, time constant Te and limits Emax and
Emin ) and the transient gain reduction (with time constant TA and TB ). TA and TB are used to
specified desired dynamic behavior with high steady-state gain. The The transfer block of SEXS
is quite simple which is shown as in Figure3.11. The parameter is in Table3.10. Similarly, by
substitute all time derivatives to be zero, the initial values are obtained:
a0 = b0 =
c0
K
c0 = Ef d0
Ef d0
Vref =
− VS0 + Vt0
K
Figure 3.11: Block Diagram of SEXS
3.2. NONELECTRICAL ELEMENT
29
Table 3.10: SEXS
Variable
TA /TB
TB
K
TE
EM AX
EM IN
Description
ratio of Power source transient gain reduction
Power source transient gain reduction
Power source gain
Power source time constant
Power source upper limit
Power source lower limit
Unit
p.u.
sec
sec
sec
p.u.
p.u.
SCRX is also a general representation of the excitation system. But compare to SEXS, model
SCRX can be better representation of those AC excitation system connected the power supply
thought a rectifier bridge. The power supply can come from a generator terminal voltage or a
auxiliary power plan, and model SCRX can distinguish between these two. Further more model
SCRX include a logic named ”Negative current logic” to represent different protect strategies for
the forward rectifier bridge, and it could be either a reversed bypassing diode or a controlled
rectifier excitation systems. The circuit for the system with a bypassing diode is shown in Fig.
3.12.
Figure 3.12: Equivalent circuit of SCRX with crowbar
The equation below describe the above circuit in the situation where the field voltage of the
generator is higher than the AC power supply leading to a negative current flowing through the
bypassing diode.
RC
Xad If d
(3.10)
rf d
On the other hand, the circuit for the system equipped with controlled rectifier excitation system
can also be represented as in Fig. 3.12 but without the resistance which means rc equals to zero.
Thus under the situation discussed above, for this circuit it becomes:
Ef d =
Ef d = 0
(3.11)
Thus for SCRX, negative current logic can be summarized as:
Vcrow
VR
(
RC
rf d Xad If d
Ef d =
Vcrow =
0
Xad If d < 0
otherwise
RC
rf d
RC
rf d
>0
=0
The block diagram of the model is shown in the Fig. 3.13 and the parameters are listed in the
following table.
30
CHAPTER 3. MODEL DEVELOPMENT AND IMPLEMENTATION
Figure 3.13: Block Diagram of SCRX
Table 3.11: SCRX
Variable
TA /TB
TB
K
TE
EM AX
EM IN
Cswitch
rc /rf d
Description
ratio of Power source transient gain reduction
Power source transient gain reduction
Power source gain
Power source time constant
Power source upper limit
Power source lower limit
Indicator shows generator bus fed mode or separately power supply)
ratio of crowbar and field winding resistor
Unit
p.u.
sec
sec
p.u.
sec
p.u.
When calculate the initial states of the model, it is reasonable to eliminate the ”Negative current
logic”, If the rectifier system is fed by an auxiliary bus plan, then the initialization procedure
of SCRX is the same as that of model SEXS. However, when it is used to represent a generator
terminal bus fed rectifier system, the initialization should also consider the initial value of the bus
fed signal.
Ef d0
Et0
Ef d0
=
− VS0 + Vt0
KEt0
c0 =
Vref
3.2.2
(3.12)
(3.13)
Power System Stabilizer
To compensate the negative effect of the excitation systems on the damping torque, a power system
stabilizer (PSS) is added to the generator. The function of PSS is to introduce a supplementary
signal into the voltage regulator with appropriate phase and gain adjustments to provide additional damping which will be sufficient to cancel the negative effect of the exciters.
IEEEST is a quite general model, a wild range of information can be pick up as input signal,
e.g., active power, speed deviation, or voltage magnitude. In P SS/E the user should specified the
source for input signal with which quantity. It can be either from generator terminal or a remote
bus. However in Dymola, one just need to put a sensor to measure the desired information, and
input it to IEEEST through connector directly.
The transfer function of IEEEST is shown in Fig. 3.14 which consists of a notch filter, two lead-lag
blocks and a washout block. The parameter used in the diagram is explained in Table 3.12. By
appropriately specifying the time constants of the two lead-lay blocks, desired phase lead can be
introduced to that of the input signal. Except the block of wash-out, all of the other block can be
3.2. NONELECTRICAL ELEMENT
31
bypassed by setting the relative parameters to be zero. The effect of the washout block may be
canceled by setting T5 =T6 =20.
Figure 3.14: Block Diagram of IEEEST
a0 = Pt0 , Vt0 or∆ω(= 0)
a0 = b0
b0 = c0
d0 = 0
Table 3.12: IEEEST
Variable
A1
A2
A3
A4
A5
A6
T1
T2
T3
T4
T5
T6
KS
LSM AX
LSM AX
VCU
VCL
Description
Filter coefficient
Filter coefficient
Filter coefficient
Filter coefficient
Filter coefficient
Filter coefficient
Lead time constant
Lag time constant
Lead time constant
Lag time constant
Washout time constant
Stabilizer gain
Upper limit
Lower limit
Upper limit(if zero then ignored)
Lower limit(if zero then ignored)
Unit
sec
sec
sec
sec
sec
sec
p.u.
p.u.
p.u.
p.u.
p.u.
STAB2A is designed specially for modeling the stabilizer which take the generator electrical
power as supplementary signal. The block diagram and the parameter is provided as following.
Following the same initialization procedure, one can find that the initial values of all of the states
are zero.
32
CHAPTER 3. MODEL DEVELOPMENT AND IMPLEMENTATION
Figure 3.15: Block Diagram of STAB2A
Table 3.13: STAB2A
Variable
K2
T2
K3
T3
K4
K5
T5
HLIM
3.2.3
Description
Block gain
Block time constant
Block gain
Block time constant
Block gain
Block gain
Block time constant
Output limit
Unit
sec
sec
sec
p.u.
Governor System
In power system network, a balance between the real power generation and the load demand should
be maintained continuously. The frequency or the rotational speed of the generator is influenced
by the power generation directly and the relation is ruled by the swing equation. Therefore, any
increase in load demand would tend to cause the frequency to decrease while any decrease in load
would tend to cause the frequency to increase.
It has been mentioned that each generator has its own frequency, and during normal operation it
is required that all the generators should stay synchronous. As a result, there is a need to equip
a governor with generator. A governor is a device used to measure and regulate the frequency
(speed) of a generator. Basically it contains two system the first one is the speed governing system
which will detect the speed deviation and react to control the vales or the gates in turns the input
source energy to the second part the turbine system which will transfer the mechanical power to
the electrical power.
Figure 3.16: Hydro Turbine Diagram[25]
3.2. NONELECTRICAL ELEMENT
h0
33
static head of water column
l
penstock length
A
penstock area
q
urbine flow rate
h
head at the turbine admission
ωG
generator speed
The diagram of a hydraulic turbine system is shown in the above figure. The water in the reservoir falls down from the penstock from which it gains kinetic energy. This energy is harvested by
the hydro turbine and converted into mechanical power and then transmitted to the shaft of the
generator. The governor of the turbine control the gate and thus the water flow.
Due to the inertia of the water, opening the gate will not immediately results in an increased flow
of water when reaching the turbine. It is because that at the instance of opening the gate, there
will be a transient reduction of the water pressure which will cause a decrease in mechanical power
output. This phenomenon is called the water column characteristic. The acceleration of water
column can accounted as a nonlinear function between the velocity of the water and the change
in the head. [6]. The block diagram in Fig. 3.17 completely describe the nonlinear water column
and turbine characteristic.
Figure 3.17: Hydro Turbine Diagram 2[25]
Different representations of the hydraulic system result in various models for hydroelectric plans.
In this thesis two of them have been developed. One is a linear model which is an IEEE standard
governor model, IEEESGO and another is a nonlinear model HYGOV.
Figure 3.18: Block Diagram of HYGOV
34
CHAPTER 3. MODEL DEVELOPMENT AND IMPLEMENTATION
HYGOV represents a straightforward hydroelectric plant governor, with a simple hydraulic representation of the penstock with unrestricted head race and tail race, and no surge tank [9]. The
diagram of the model is shown in Fig. 3.18 which drops the part representing The head loss due
to friction hf .
Table 3.14: HYGOV
Variable
R
r
Tr
Tf
Tg
± VELM
GM AX
GM IN
TW
At
Dturb
qN L
Description
Permanent droop
Temporary droop
Governor time constant
Filter time constant
Servo time constant
Gate velocity limit
Maximum gate limit
Minimum gate limit
Water time constant
Turbine gain
Turbine damping
No load flow
Unit
p.u
p.u
sec
sec
sec
p.u.
p.u.
p.u.
sec
p.u.
p.u.
p.u.
At is the turbine gain which relate the ideal gate opening (from no load to full load) to real gate
opening (from fully closed to fully open). The water starting time Tw represents the time required
for the water to reach a flow rate q in the penstock starting from the height h at zero speed. The
value is depending on the loading level which is inconvenient for performing the simulation. As
a result, the parameter Tw instead of Tw is used in the model which is the value of Tw but
calculated using per unit base flows and heads. Different from Tw, Tw is a fixed value for a given
turbine-penstock unit and at the same time taking into account the dynamic changes automatically. For detail of the changing base procedure, one can refer to [6].
To initialize the model, following calculation should be performed. Where at steady state, there is
no speed deviation and the model should provided the desired mechanical power to the generator
which is obtained from initialization of the machine. By substituting the time derivatives of the
variables to be zero:
a0 = e0 = d0 = 0
c0 = g0
q0
( )2 = 1
g0
h0 = 1
f0 = 0
Pmech0
q0 =
+ qN L
At h
The it is possible to calculate the desired set value of the speed reference by following equation.
nref = R(
Pmech0
+ qN L )
At h
IEEESGO is a general-purpose turbine-governor model. It either be a good representation of
a reheat steam turbine or an approximate representation of a simplified hydro plant. The block
diagram, parameter sheet and initial procedure are:
3.2. NONELECTRICAL ELEMENT
35
Figure 3.19: Block Diagram of IEESGO
a0 =0
b0 =K1 a0
c0 =P0
d0 =c0
e0 =K2 d0
f0 =K3 e0
Table 3.15: IEESGO
Variable
T1
T2
T3
T4
T5
T6
K1
K2
K3
PM AX
PM IN
Description
Controller lag
Controller lead compensation
Governor lag
Delay due to steam inlet volumes
associated with steam chest and
inlet piping
Re-heater delay including hot
and cold leads
Delay due to IP-LP turbine,
crossover pipes,and LP end
hoods
Maximum gate limit
Minimum gate limit
Water time constant
Upper power limit
lower power limit
Unit
sec
sec
sec
sec
sec
sec
p.u.
p.u.
sec
p.u.
p.u.
36
CHAPTER 3. MODEL DEVELOPMENT AND IMPLEMENTATION
4
Model Validation
It is necessary to perform complete validation tests in order to check that there are high degree
of similarity between the performance of the models and the reference models. The validation
procedure and the analysis of the results are described in the chapter. The validation steps could
be summarized as three steps:
1. Design the structure and the perturbation of the test system in PSS/E The test
system should be designed as simple as possible for the sake of control variables, however, at the
same time the system should be as complete as possible thus the dynamic of which can reflect all
the feature of the components needed to be validated.
2. Record the power flow results and dynamic responds of the test system in PSS/E
As it has be mentioned previously, all the components are initialized to match the equilibrium
calculated from power flow. Power flow is not available in Dymola, thus it is necessary to take the
PSS/E PF results as input parameter for the system in Dymola. It is recommended to record the
power and voltage information for all the bus which equipped with generator or composite load.
After that, simulate the system to get the dynamic responds. For the electrical components, the
focus should be put on complex power and voltage information, while for the control system, the
focus should be put on the real input and output of the components.
3. Build the identical system in Dymola and putting in the parameter for each component It is recommended that an individual data record should be built for each test model
especially for large test system. Since typing parameters for the whole system manually would be
time consuming and problematic, and it would be difficult for one to check if there is any mistake.
For the part of data management, one can refer to Dymola manual, and it will not be repeated here.
4. Implement the same perturbation cases in Dymola It is the critical step during the validation that the same perturbation should be implemented for the system in Dymola. To achieve
it, detail of the method of applying perturbation in PSS/E should be fully studied. For example,
the way of applying load variation, step respond test of control devices etc.
5. Simulation the system in Dymola and record the system response. During this step,
it is recommended that the same simulation parameters are applied. The essential parameters
are the simulation interval and the solver method. Simulation interval is the sampling interval of
the system response, with different interval, different points from system response curve will be
recorded. While different solver methods apply various order of Taylor series to approximate the
real solution of the system response which will influence the accuracy of the simulation results.
The transient behavior of the dynamic components are of prime interest thus the focus is put on
the transient response of different perturbations. The setup of the test systems and the applied
disturbance are explained in turns. The parameters used in the test systems are provided in
Appendix.
37
38
4.1
CHAPTER 4. MODEL VALIDATION
Small-Scale Power System Tests
As it has been mentioned that, for the sake of controlling variables, the validation tests should
start from the simplest system contained the lowest degree of dynamics. A single generator model
is first validated and then the tests processed by introduced the control devices. The basic scenario
used for study the transient performance of generator and its regulator is shown in the diagram
4.1
Figure 4.1: Test system diagram
where the generator is delivering power through one transmission line to a composite load and
then through two parallel lines to a large system in remote area. The power flow results are shown
in Table 4.1. The frequency and the system base used in all test system is 50Hz and 100MVA
respectively. The unit of the angle is degree, while all of the other value are expressed in per unit
on system base. Since each generator and its regulators are on machine base, there is needed for
changing base. This is achieved by explicitly introducing the bus which changing base for current
components directly at the terminal of generators. Note that positive sign is used when the power
is injected into the bus node.
Table 4.1: Power Flow Result
Bus
1
3
Voltage
0.999999
1
Angle
4.0463
-3.00563e-7
Active power
0.399989
0.100184
Reactive power
0.054165
0.080064
The power flow results are picked up from PSS/E. As it has been described in section ??, the
generator terminal quantities such as the phasor of voltage and apparent power served as input
variables for initialization calculation. The accuracy of the power flow results have a direct affect
on the correctness of the initialization. The more the complexity of the system, the higher the
tolerance of power flow input values are required.
Validation results of the components should demonstrate both the correctness of the initialization
and the transient behavior of the dynamic components under disturbance. In order to check
the initialization results, all of the system are running under stationary state for two seconds.
After that, different perturbations are applied to force the systems into transient. The transient
disturbances are illustrated in Fig. 4.2(a) to 4.2(d), they could be a three phase to ground fault in
the middle of the transmission lines or at the terminal bus of generator. One can also apply load
variational or a step change of regulator’s reference value to the system. All of the perturbation
were modeled in the same way as they are in PSS/E.
Within in a period of a few seconds after the disturbance, the system might suffer from large
excursions of generator rotor angles, power flows, bus voltages, and other system variables. The
dynamic behavior of the power system during this time range related to the dynamic introduced
4.1. SMALL-SCALE POWER SYSTEM TESTS
39
(a) Apply three phase to ground fault 1.
(b) Apply three phase to ground fault 2.
(c) Apply load variation.
(d) Apply regulator referenc step.
Figure 4.2: Different perturbation cases.
by the rotor inertia storage energy, the field electromagnetic transients, and the controls of generators. Thus the signal such as generator speed deviation ∆ω, the bus voltage magnitude, and the
injected active and reactive power P and Q of generator are recored and compared.
When there exist regulators in the system, the output quantities of those equipments are compared and analyzed. Specially, the limit of regulation should be broken if there exist one, so that
one can make sure that the system react in the same way when regulators hits their limits. The
simulations were continuing until the transient period of the system dies out completely in order
to make sure that when transient has died out, the test systems built in Dymola and PSS/E can
return to the same equivalent operation point. But in most of the cases, the new steady state is
achieved around 20s, thus the simulation time length could be set to 20s. The figures attached in
this chapter were shown with zoom in action where the time length in the figures might be less
than 20s.
Since in PSS/E, except generator, all the dynamic devices can not be tested individually, thus
different components are combined and tested in groups. Certain perturbation from Fig. 4.2 are
applied to active the specific functions of the components such as the saturation function of detail
exciter model (IEEET1 and IEEET2), the negative current logic of SCRX, and the no-windup
and windup limits within HYGOV. The combinations are summarized as in Table 4.2.
Table 4.2: Combination of Dynamic Devices
No.
1
2
3
4
5
6
7
Dynamic Device
Genrou
Gensal with two-winding transformer
Genrou+IEEET2+IEESGO
Gensal+SCRX+HYGOV
Gensal+IEEEST+SEXS
Genrou+IEEET1+STAB2A+LFDRAL
Genrou+IEEET1+STAB2A with three-winding transformer
For the sake of controlling variables, the setting of all simulations performed in PSS/E and Dymola
are chosen to be as similar as possible. The settings are listed as below, beside that all the variables
which were picked up to be recorded and compared are also listed out. The error in percentage
40
CHAPTER 4. MODEL VALIDATION
the normal distribution of the absolute difference are also plotted. But due to the limit of the
space, only the plots of error for 3rd case are attached in this chapter.
Table 4.3: Dynamic setting in PSS/E version 33
Acceleration
Network solution iterations
Tolerance
Island frequency acceleration
Island frequency tolerance
Time step
Frequency filter
Delta threshold intermediate
Delta threshold Island frequency
Network frequency dependence
Plot every time step
0.5
25
0.0001
1.000
0.0005
5ms
0.0333
0.04
0.016667
off
-
Table 4.4: Dynamic setting in Dymola
Quantities at generator terminal
Algorithm
Tolerance
Time step
Output interval length
Number of output interval
Quantities at generator terminal
Algorithm
Tolerance
Time step
Number of output interval
Part 1
Rkf ix2
0.0001
5ms
0.005
5000
Part 2
Rkf ix4
0.0001
5ms
6000
Table 4.5: Variables to be recorded
Quantities at generator terminal
speed deviation
terminal voltage
generated active
generated reactive power
Quantities at load bus
the magnitude of bus voltage
the angle of bus voltage
consumed active power
consumed reactive power
output of regulators
governor output, the mechanical power of generator
exciter output, the field voltage of generator
stabilizer output
symbol
ω
Vt
Pgen
Qgen .
symbol
θload
V
Pload
Qload .
symbol
Pm .
Ef d .
Vothsg .
The test system for components like two-winding and three-winding transformers are different
from the basic one.
4.1. SMALL-SCALE POWER SYSTEM TESTS
41
Figure 4.3: Test system diagram for two-winding transformer with phase-shift
Table 4.6: Power flow result for the system including three-winding transformer
Bus
1
2
3
Voltage
1
0.977048
1
Angle
0.293027
-0.569458
0
Active power
0.10083
0.49253
0.105725
Reactive power
0.20187
0.097037
0.231136
Figure 4.4: Test system diagram for three-winding transformer with OLTC
Table 4.7: Power flow result for the system including two-winding transformer
Bus
1
2load
2Generator
3
Voltage
1
0.9978
0.9978
0.9962
Angle
0
0.08
0.08
-0.12
Active power
0.10083
0.4
0.1
0.4
Reactive power
0.20187
0.4
0.5
0.1
42
4.1.1
CHAPTER 4. MODEL VALIDATION
Validation of Genrou
In this section, validation results of round role generator model were analysis. Below are the
diagram for the test used in Dymola and a list of the simulations performed during testing. Since
the initialization of generator model is the start point of dynamic simulation, the accuracy of the
initial values should be check carefully. The results of initialization were recorded in Table 4.9.
Figure 4.5: Diagram in Dymola of the GENROU test system.
Table 4.8: List of simulations
Step
1.
2.
3.
4.
5.
6.
7.
Scenarios
running under steady state for 2 seconds.
Vary the system load with constant P/Q ratio Fig. 4.2(c).
After 0.1s later, the load was restored to its original value .
Run simulation to 10s.
Apply three phase to ground fault as shown in Fig. 4.2(a).
After 0.15s later, the fault was cleared by tripping the line.
Run simulation until 20 seconds.
Table 4.9: Initialization
No.
1
2
3
4
5
Quantities
Ef d0
Pm0
ID0
IQ0
Angle
PSS/E
1.327474832534790
0.4
0.2169
0.3404
28.85
Dymola
1.327474594116211
0.4
0.216949
0.340392
28.846
From the results we can see that, two software agreed with each other during initialization state.
The error were less than the set tolerance. After that, the dynamic simulation was performed, and
the results were shown as in Fig. 4.6(a) to 4.8. Beside the quantities at generator and the load
bus,the values of the sub-transient flux linkages and transient voltages were recored and compared.
It is significantly that the performances of the Modelica models agreed with the PSS/E reference
models in high degree.
From the figures we can see that, during steady state, the load consumption are supplied partly
by the generator and partly by the infinite bus. When the additional load was added into the system, there occurred a negative mismatch between the mechanical and consumed electrical power
which forced the generator to slow down. But since the equivalent impedance at the load bus was
reduced, thus the field current of the generator merged instantaneously.
4.1. SMALL-SCALE POWER SYSTEM TESTS
(a) Generator terminal quantities.
(b) Load bus quantities.
Figure 4.6: GENROU validation results: node bus quantities
43
44
CHAPTER 4. MODEL VALIDATION
As there were neither exciter nor governor equipped in the generator unit, the field voltage and mechanical power remained their initial value during the whole simulation. Due to the infinite inertia
of the remote system, the transient of the generator would die out and return to its steady state.
Follow the first perturbation, at 10s the three phase fault was applied, due to the low impedance
of the fault, other electrical components were short circuited which are reflected as magnitude
of all bus voltage reduced abruptly. The calculated generator reactive power was higher which
attempted to maintain the voltage level of the system.
Since the magnetic fluxes in the air-gap can not change their value instantaneously, the resultant
equivalent electrical force remained the same value at the instance when the fault was applied.
The short circuit current from the generator flowed through line impedance to the fault. Because
of the low impedance of the transmission system, the value of short circuit current was very high
compared to normal operation. This is shown in Fig. 4.8, where there existed a surge of generator
current directly followed the fault.
The electrical torque kept its pre-disturbance value as well as the power. Due to the low resistance
of the post fault system, the delivered active power dropped significantly, hence there exist a
unbalance between the generation and consumption. The result was increasing of the generator
speed shown in Fig. 4.6(a).
Figure 4.7: GENROU validation results: Generator transient and subtransient electric voltage
and flux.
4.1. SMALL-SCALE POWER SYSTEM TESTS
45
Figure 4.8: GENROU validation results: Generator terminal current.
4.1.2
Validation of Gensal
Figure 4.9: Diagram in Dymola of GENSAL test system.
The validation of Gensal model has been proved by the same test system used when testing
Genrou. For the sake of saving space the plots were not shown here. The results shown in this
section were those from a test system with some modification introduced to the basic scenario.
The diagram used in the test system is the one in Figure4.9. The purpose for the modification
are that on one hand to confirm the function of bus with changing base, and on the other hand
the function of two winding transformer with phase shift. The network data were attached in Appendix. The parameters for generator were entered on machines’ base (60 MVA and 1000 MVA)
which were different from the power rating of the system (100 MVA). Meanwhile the network were
expressed on system base.
When connecting bus with different nameplate voltage, an transformer should be introduced to
adjust the voltage. Different connection of the transformer will result in a phase shift between
the sending and receiving end bus voltage phasor. There were two transformers equipped in
the test system, the upper one connected in a way which will not introduce phase shift, but
lower one can result in 30 degree lead at primary side. The impedance and other parameters for
the transformers are provided in the Appendix. In order to validate the phase shift function of
the transformers, the angle difference between the sending and receiving ends were plotted and
compared in Figure4.10(b).
46
CHAPTER 4. MODEL VALIDATION
(a) Generator terminal quantities.
(b) Bus voltage’s angle shift between sending and receiving ends of the transformer.
Figure 4.10: GENSAL validation results
Figure 4.10(b) shows us that, the angle shift of transformer from two software matches each
other very well. The system in Dymola is identical to the reference PSS/E test system both in
initialization and dynamic state. The results proved the behavior of model Gensal and the actions
of changing power and voltage base. By including these changing base action, it is possible to use
the developed library to present larger system which might include several machines with different
power rating connected by step-up or set-down transformers with phase shift. Since the changing
base action has been proved, for the sake of convenient, the following test were performed with all
parameters on system base.
4.1. SMALL-SCALE POWER SYSTEM TESTS
4.1.3
47
Validation of IEEET2 and IEESGO
Figure 4.11: Diagram in Dymola of the 3rd test system.
The test system is used to validate the transient response of exciter IEEET2 and governor
IEESGO. Below is a list of simulations to be performed and diagram of the test system in Dymola. The results are shown in Figure4.12 to ??. The three phase to ground fault was applied at
same location with the same range as the two previous cases.
The regulators contributed new dynamics to the system and they will be discussed later. After
the fault was cleared, the reference step changes were applied. The results shown us that the
regulators modeled in Modelica functioned very well since the system behavior in two software
confirmed each other. The further comparison are done by plotting the percentage error of the
records.
Table 4.10: List of simulations
Step
1.
2.
3.
4.
5.
6.
7.
Scenarios
running under steady state for 2 seconds.
Apply three phase to ground fault as shown in Figure4.2(a).
After 0.15s later, the fault was cleared by tripping the line.
Run simulation to 10s.
Apply −0.002p.u. step in governor reference.
Apply 0.01p.u. step in exciter reference.
Run simulation until 20 seconds.
First, the system are compared in general by comparing the generator speed, voltage and power
transfer information. There are shown in Fig. 4.12. From the figure, we can see that, with the
added control devices, the behavior of the generator in Dymola is matching with that from PSS/E.
It indicate that, the system and the applied perturbation are similar.
But in order to validate each control device, the input and output of the device were also compared.
The input of the excitation system are the generator terminal voltage while that of the governor
system are the speed of the machine. The absolute different of these two variables from two
software are plotted. The results were shown in Fig. 4.13.
When the three phase to ground fault was applied, regulators of the generator detected the changes
caused by the faults. The increasing of the speed activated the governor system, and the mechanical
power was then reduced in order to decrease the accelerate power which can be seen in Fig. 4.14.
48
CHAPTER 4. MODEL VALIDATION
Figure 4.12: Validation result of IEEET2 and IEEESGO test system
(a) Absolute different of the generator terminal voltage, input of
IEEET2:
(b) Absolute different of the generator speed input IEEESGO:
Figure 4.13: Validation result of IEEET2 and IEEESGO
4.1. SMALL-SCALE POWER SYSTEM TESTS
49
Figure 4.14: Output of IEEESGO: Generator mechanical power
While the drop in generator terminal voltage alarmed the excitation system to increase the field
voltage. By doing this the excitation system attempted to increase the induced voltage in the
armature windings in order to compensate the big drop. The reaction of exciter was shown in
Fig. 4.15(a). However, due to the limit of power supply, the output of the exciter regulator was
saturated and remained its upper limit 4p.u. during the fault.
(a) Output of IEEET2: Generator field Voltage
(b) Inner state of IEEET2: Output of voltage regulator
Figure 4.15: Validation result of IEEET2
0.15s later, the fault was clear by tripping the line. The impedance of the network recovered
and as a result the current flowed out of the generator drop suddenly. But the value are still
higher than its normal operation value because the electric magnetic force were lifted up by the
exciter during the fault, and hence still kept its instant value when the fault was cleared. The
50
CHAPTER 4. MODEL VALIDATION
active power consumption were then lifted up, remind that at this time the mechanical output
from the governor system has been decreased which now resulted in a negative power unbalance. The generator was then slowed down. And following the clearing of the fault, the current
fed by the generator reduced thus the system bus voltage recovered. But they were a bit higher
than the steady state values. The overshoot of the bus voltage was caused by the regulator system.
As a result of rising swing of the bus voltage, the generator is delivering more power to the
system which can be confirmed by the similar overshoot in the plots of power. The generator
was then further slow downed. Once again the governor detected the speed deviation, and then
raised the mechanical power. The governor attempted to cancel the speed varying of the generator.
The transient of the system had almost died out at around 10s, the system would return to its
steady state if not more perturbation was applied. But at this time, the reference step changes
were applied to both governor and exciter. The regulators tried to meet the requirements thus
instead of returning to its original equivalent point, the system would finally return to the new
stationary state as set by the new reference. The Figures in 4.12 showed that, the final value of
generator bus voltage was 0.01 pu higher then the original steady state value. And the mechanical
output of the governor is 0.002 lower than the previous equivalent point. The system reacted
in the same way before, during, and after all the perturbation, it is fair to conclude that, the
Modelica models, IEEET2 and IEESGO have been proved.
4.1.4
Validation of SCRXS and HYGOV
Figure 4.16: Diagram in Dymola of the test system.
The dynamic components in this test are model SCRXS and HYGOV. In order to completely
validate the transient behavior of the two models, the simulation scenario was selected as list
below. The specific scenario could active the ”Negative current logic” inside model SCRXS and
made the governor HYGOV hits its no-windup limit. Thus beside the those quantities shown in
previous tests the variables such as the water velocity and desired gate position had been plotted
as well. Specific attention should be paid to the validation of model SCRXS, since as it would
behavior differently according to a zero or no-zero value of the parameter rrfcd .
Table 4.11: List of simulations
Step
1.
2.
3.
7.
Scenarios
running under steady state for 2 seconds.
Apply three phase fault as shown in Figure4.2(b) with conductance X = −0.5.
After 0.15s later, the fault was self cleared.
Run simulation until 20 seconds.
To force the generator current to be negative, which means the generator is forced to consumed
4.1. SMALL-SCALE POWER SYSTEM TESTS
51
reactive power. The perturbation could be a fault which was modeled by connecting an admittance
directly to the generator terminal bus. Since the analysis of the fault have been covered in previous
example and the focus of this thesis is not the fault analysis, thus from now on for the rest of
the tests, only the comparison results will be shown without explanation of the behavior of the
variables.
Figure 4.17: Validation result of SCRX and HYGOV test system: Generator quantities
From the figures we can see that once the unbalance between mechanical and electrical power
cause the speed to drop. The governor detected the decreasing of the speed then opened the gate
immediately. Initially, the power was used to speed up the water at the gate thus there was a some
mechanical power drop at the beginning. After that, it is clearly that more mechanical power has
been injected into the system. The behavior of the models in two software are similar in high
degree thus the model HYGOV can be considered to be validated.
From Fig. 4.17 and 4.19(b), we can see that SCRX detected the high voltage at the terminal of the
generator and attempted to lower down the field voltage immediately. However, from Fig. 4.19(a)
and 4.19(b) we can see that, the output of SCRX reached the limit of zero once the generator
field current went lower than zero. This illustrate that the protect circuit in SCRX was active.
If rrfcd was set to be 10, then the SCRX responses as shown in Fig. 4.19(d). In the figure we see
that, the output of SCRX was proportionally to that of generator field current. All the results
from both software matches each other perfectly thus we can concluded that, the model SCRX
was validated.
4.1.5
Validation of IEEET1, STAB2A and LFDRAL
The system used to validate components IEEET1, STAB2A and LFDRAL are shown in Fig.
4.20. The generator GENROU was equipped with an excitation system IEEET1 with a stabilizer
STAB2A. The load is a frequency dependent composite load. The simulation are listed in Table
4.12. IEEET1 works to keep the voltage of generator bus at desired value by providing suitable
field voltage to the generator. STAB2A takes the information of system oscillation by measuring
the electric power output of the generator. Base on that, it works to provided compensation signal
to IEEET1 in order to wipe out unnecessary oscillation caused by the excitation system.
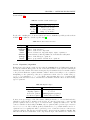
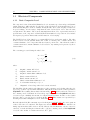
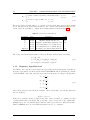
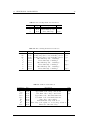
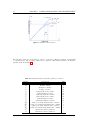
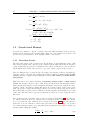
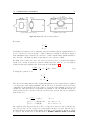
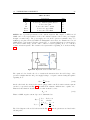
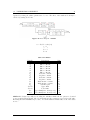
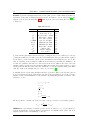
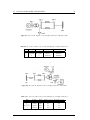
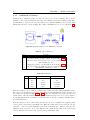
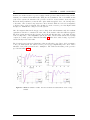
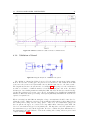
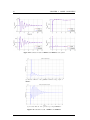
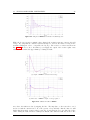
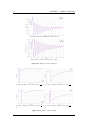
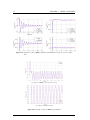
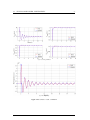
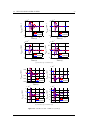
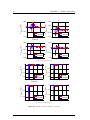
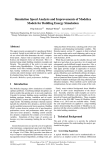
52
CHAPTER 4. MODEL VALIDATION
(a) Output of HYGOV: Generator mechanical power
(b) Inner state of HYGOV: Desired gate position
Figure 4.18: Validation result of HYGOV
(a) Input of SCRX: Generator field current
rc
rf d
(c) Input of SCRX: Generator field current
10
= 0 (b) Output of SCRX: Generator field voltage
0
rc
rf d
= (d) Output of SCRX: Generator field voltage
10
Figure 4.19: Validation result of SCRX
rc
rf d
=
rc
rf d
=
4.1. SMALL-SCALE POWER SYSTEM TESTS
53
Figure 4.20: Diagram in Dymola of the test system.
In this test, a fault was applied to force the system into transient stage. Besides that, the intensity
of the fault was designed to force the model STAB2A to hit its limits. The goal was to see the
system behavior when the limitation of the components was hit thus to validate the system as a
whole.
Table 4.12: List of simulations
Step
1.
2.
3.
4.
Scenarios
running under steady state for 2 seconds.
Apply three phase to ground fault as shown in Figure4.2(a).
After 0.15s later, the fault was self cleared.
Run simulation until 20 seconds.
From the figure above we can see that the three phase to ground fault caused the voltage at the
terminal bus of the generator to drop severely. Thus IEEET1 reacted immediately by raising up
the field voltage by which it attempted to level up the dropping bus voltage which was shown in
Fig. 4.22(a). Figure 4.22(b) shows us that STAB2A detected the change of electric power from the
generator and took action to rise the its output. However, the limitation was hit and insufficient
compensation failed to damp out effect of the fault, the system remained oscillating. Thus it is
fair enough to conclude that these two components was validated.
In order to validate the component LFDRAL, the quantities at load bus was plotted and compared.
The following figures show that the results from two software match with each other perfectly thus
we can conclude that LFDRAL was validated.
54
CHAPTER 4. MODEL VALIDATION
Figure 4.21: Validation result of IEEET1, STAB2A and LFDRAL test system: Generator quantities
(a) Output of IEEET1: Generator field voltage
(b) Output of STAB2A: Vothsg
Figure 4.22: Validation result of IEEET1 and STAB2A
4.1. SMALL-SCALE POWER SYSTEM TESTS
(a) Load bus quantities
(b) Bus frequency
Figure 4.23: Validation result of LFDRAL
55
56
4.1.6
CHAPTER 4. MODEL VALIDATION
Validation of OLTC
Figure 4.24: Diagram in Dymola of the 5th test system.
The test system used to validate OLTC are shown in Fig. 4.24 and the parameters are given
in Appendix. The system model presented that there are three areas connected through a threewinding transformer. The remote power plan was modeled by a infinite bus. The local power
plan is modeled by a generator unit which was a GENROU model equipped with IEEET1 and
STAB2A. There are mainly consumption in the third zone thus it was modeled by a composite load.
The remote and the local were connected by a three-winding transformer where the infinite bus
was connected to the primary side of the transformer, the local unit was to the secondary side of
a three winding and a composite load was connected to the tertiary side of the transformer.
The power consumption at zone third was supported by the remote and local power plan together.
The voltage at tertiary winding of the transformer is controlled by the OLTC model at primary
side. In order to validate the performance of OLTC, the list of simulation were conducted. During
the test, the reactive power load were stepped artificially in order to force the OLTC to react.
Table 4.13: List of simulations
Step
1.
2.
3.
4.
5.
6.
5.
Scenarios
Running under steady state for 20 seconds.
Increasing the Q load to 1.5 p.u. in PSS/E
it means to add Q load approximately by 1.42 p.u. in Dymola
Simulating to 40 seconds.
Increasing the Q load to 2.2 p.u. in PSS/E
it means to add Q load approximately by 0.85 p.u. in Dymola
Simulating to 80 seconds.
Increasing the Q load to 2.5 p.u. in PSS/E
it means to add Q load approximately by 0.7 p.u. in Dymola
Simulating to 200 seconds.
There are three stage in total, and the validation results are shown here. From the following
figures we can see that, after the first step of the Q load, the tertiary side voltage dropped out
of the control band at first but recovered to stay in the control band in a short time. The time
period was less then the control delay thus OLTC didn’t react.
The second stepping-up of the Q load force the voltage to drop further, and this time it didn’t
manage to go back to the control band thus after delay for TC = 17s, OLTC took action to increase the tap ratio thus the voltage at the primary side was stepped down while the voltage on
4.1. SMALL-SCALE POWER SYSTEM TESTS
57
Figure 4.25: Validation results of OLTC
the secondary side was stepped up.
The third stepping-up of the Q load cause the voltage to drop so sever thus the OLTC hit its
limits and failed to bring the voltage back to the control band. From the figure we can see clearly
that, there was a TD = 5s delay for OLTC to perform a tap change. Beside that, we can see that,
there were 16 steps in total before OLTC hit its limits. Thus it proved that, the OLTC model
in Dymola applied the desired delay during changing the tap ratio and the tap was put at the
middle of the total 33 step position. From these test results, we can conclude that, the model was
validated successfully.
58
4.2
4.2.1
CHAPTER 4. MODEL VALIDATION
Real World Power System
AKD
System model AKD is a subset model of Norwegian grid. The system setup is shown in Fig.4.26.
It contains five detail generator models All of them are Model Gensal. The three generators on
the upper side are the equivalent models of remote grid and the rest two generators which are
connected to the network through transformers are the equivalent models of the local grid. These
two generators are equipped with regulators. They are governor HYGOV, exciter IEEET2, and
stabilizer IEEEST.
Figure 4.26: Test system diagram
The performed simulations are listed here. Since all of the components have been validated through
the small scale systems in previous section, the goal of the test here is only to check the simulation
results of the system with more complex structure. From the test system diagram we can see
that, there is a power flow loop and there are two transformer are introducing phase shift. This
structure increase the complexity of the calculation.
Table 4.14: List of simulations
Step
1.
1.
1.
1.
Scenarios
Running under steady state for 1s.
Open the line for 0.15s.
Apply 3phtgf at 7.5s; 0.15s later, clear the fault.
Run simulation until steady state.
However, the simulation results in the following figures show that, the Modelica model can represent the similar dynamic of the reference PSS/E model. There are not problem for Dymola to
perform the simulation for this system model. Thus it is fair to say that now, the models can
replace the original PSS/E model when performing analysis of Norwegian power grid.
4.2. REAL WORLD POWER SYSTEM
59
−3
−3
x 10
2
0
−1
PSSE
Dymola
−2
0
2
ωgen53 (p.u.)
ωgen66 (p.u.)
1
x 10
0
−2
PSSE
Dymola
−4
0
4
2
Time (s)
−3
−3
x 10
1
2
0
−2
PSSE
Dymola
−4
0
2
ωgen73 (p.u.)
ωgen83 (p.u.)
4
4
Time (s)
x 10
0.5
0
−0.5
PSSE
Dymola
−1
0
4
2
Time (s)
4
Time (s)
(a) Generator speed variation(1).
−3
0.01
0
−0.01
−0.02
PSSE
Dymola
−0.03
6
8
10
12
ωgen53 (p.u.)
ωgen66 (p.u.)
x 10
0
−2
−4
PSSE
Dymola
−6
6
14
8
10
12
14
Time (s)
x 10
−3
−3
x 10
0
0
−5
PSSE
Dymola
−10
6
8
10
12
14
ωgen73 (p.u.)
ωgen83 (p.u.)
5
−2
−4
−6
PSSE
Dymola
−8
6
8
10
(b) Generator speed variation(2).
Figure 4.27: Validation result of AKD test system(1).
12
14
60
CHAPTER 4. MODEL VALIDATION
(p.u.)
1.004
1.002
1
gen53
1
0.995
PSSE
Dymola
0.99
0
2
Vt
Vt
gen66
(p.u.)
1.005
0.998
PSSE
Dymola
0.996
0
4
2
4
Time (s)
(p.u.)
1.005
1
gen73
0.995
0.99
PSSE
Dymola
0.985
0
2
Vt
Vt
gen83
(p.u.)
1.005
1
0.995
PSSE
Dymola
0.99
0
4
2
4
(a) Generator bus voltage (1).
1
(p.u.)
gen53
0.8
0.6
PSSE
Dymola
0.4
6
8
10
12
0.8
0.6
Vt
Vt
gen66
(p.u.)
1
PSSE
Dymola
0.4
14
6
8
10
12
14
Time (s)
1
(p.u.)
PSSE
Dymola
0.6
6
8
10
12
14
Vt
Vt
gen73
0.8
gen83
(p.u.)
1
0.8
0.6
6
PSSE
Dymola
8
10
(b) Generator bus voltage (2).
Figure 4.28: Validation result of AKD test system(1).
12
14
5
Conclusion
In this project, the main objective was to develop and validate Modelica models for each of the
grid components included in a predetermined list of subset of the Norwegian grid. The work has
been carried out in several steps, with first a study of the reference models in PSS/E, the implementation in the Modelica languages and finally the validation by comparing dynamic simulations
between the reference platform (PSS/E) and Modelica.
All simulation show results with a high degree of similarity between the dynamic behavior of the
developed models and the reference model. The main objective of the project is thus achieved
successfully
In chapter one, a brief introduction about the background of this project and the motivation to
use Modelica in power system analysis has been discussed. In chapter two, the difference between
two software Dymola and PSS/E has been studied. It can serve as a reference for one who intend
to carry out similar project or to work with these two software.
The modeling method for each components model has been explained in detail in chapter three.
For those models which was explained vaguely in PSS/E documents, revisions have been carried
out and the performance of them have been proved by validation tests. Thus I can conclude
that, the models are now ready to be used in iTesla project. And all future user can have the
access to both the source code and modeling methods of the models. This will facilitate the reuse
of the models. The models can be utilized in all software which can support Modelica language.
Furthermore, the models can be simulated in Matlab through Function Mock Unit (FIM) tool box.
All of the data file concerning the validation tests have been documented properly which can be
sued to check the work of the project. The procedures of performing validation tests have been
explained step by step in previous chapter. Thus it is easy for one to follow up the work if there
is any need to carry out more tests.
Finally, for those who are working with building Modelica models, the Some suggestion towards
debugging procedures have been summarized as following. Basically, to ask the following questions
can help one debug the models efficiently.
1. Has the model been initialized correctly ?
For example, if the records of one variable from PSS/E and Dymola starts from the same
points which means the power flow records are entered correctly. Further more, if the results
agree with each other during a few second before applying the faults. It means the model is
initialized correctly. It is better to make sure that the initialization are correct and then go
further to dynamic simulation.
2. Are the applied faults in both systems the same or not ?
61
62
CHAPTER 5. CONCLUSION
It is easier to check the perturbation cases before going through the equations of the models.
For example, during load variation, there are several options available in PSS/E, the one
with varying the load with constant P Q ratio was applied in the tests. Also, there are some
trivial issues might introduce the differences, like the load will be shed down by a factor
when the bus voltage goes lower then 0.8 p.u.. To reach good similarity, this particular
assumption should also be implement during tests.
3. Is there anything wrong in the model expression (equations or parameters) ?
Typically, the problems can be caused by the parameters or mathematic equations. If the
records show the same tendency but difference in magnitude or frequency then most of time
it is caused by typing the wrong parameters. On the other hand, if the tendency is not
the same, then some of mathematic equations must be wrong. they could either be typed
wrongly, or be implemented in a way where Modelica has different interpretation of them.
The suggestions are that to study the equations carefully, highlight the suspected ones, and
test them separately.
4. Are the set up of two systems are identical or not ?
The solution results from different solvers might show different inertia. That’s why we said
it is better to start with the same solvers. One the other hand, attentions should be paid
to the plot interval and the time step if a fix step solver is applied, because the model could
behavior wrongly when too large time step is applied.
A
A.1
Appendix
Dynamic parameter
Listing A.1: Dynamica parameters of Genrou test
1
2
3
4
1 ' GENROU ' 1
4.0000
0.60000
3 ' GENCLS ' 1
5.0000
0.0000
0.20000
0.0000
0.50000 E -01
1.4100
0.12000
0.0000/
0.70000
1.3500
0.10000
0.10000
0.30000
0.50000/
Listing A.2: Dynamica parameters of GENROU+IEEET2+IEESGO test
1
2
3
4
5
6
7
8
9
10
1 ' GENROU '
4.2800
0.60000
1 ' IEEET2 '
-4.0000
0.10000
1 ' IEESGO '
5.0000
0.98000
3 ' GENCLS '
1
5.0000
0.0000
0.2000
0.0000
1.0000
2.3100
0.20000
0.50000
0.0000
0.0000
1
1
1
0.70000 E -01 0.90000
0.90000 E -01
1.8400
1.7500
0.41000
0.12000
0.11000
0.39000 /
100.00
0.14000 E -01
4.0000
0.62000
0.12000
1.0000
0.80000 E -01
3.0800
0.30000/
0.0000
0.50000
0.12000
20.000
0.59000
0.43000
/
0.0000
/
Listing A.3: Dynamica parameters of GENROU+STAB2A+IEEET1+LDFRAL test
1
2
3
4
5
6
7
8
9
1 ' GENROU '
4.0000
0.60000
1 ' STAB2A '
1.0000
1 ' IEEET1 '
-3.0000
0.0000
3 ' GENCLS '
1
1
1
1
5.0000
0.0000
0.20000
1.0000
1.4100
0.0000
0.0000
2.4000
0.0000
0.50000 E -01
1.4100
0.12000
4.4000
0.10000 E -01
50.000
0.80000
0.30000 E -01
0.0000
/
0.70000
1.3500
0.10000
10.000
0.50000 E -01/
0.50000
0.78000 E -01
5.0000
0.10000
0.30000
0.50000/
1.8000
3.0000
0.72600
0.50000/
Listing A.4: Dynamica parameters of GENSAL+IEEEST+SEXS test
1
2
3
4
5
6
7
1 ' GENSAL ' 1
0.0000
0.12200
1 ' IEEEST ' 1
0.0000
0.05060
15
6.7000
1.2200
0.18600
1
0.0000
0.8971
0.1
0.28000 E -01 0.35000 E -01
4.4100
0.76000
0.29700
0.24000
0.80200
/
0
0.0000
0.0000
0.0000
0.0000
0.1535
1
1.5
1.5
-0.0500
0.0000
0.00000/
63
64
APPENDIX A. APPENDIX
8
9
10
1 ' SEXS '
1
0.0000
3 ' GENCLS ' 1
0.10000
4.7300
0.0000
10.000
/
0.0000
/
100.00
0.0200
Listing A.5: Dynamica parameters of GENSAL+SCRX+HYGOV test (rcrfd 0)
1
2
3
4
5
6
7
8
9
1 ' GENSAL '
0.0000
0.12000
1 ' SCRX '
0.0000
1 ' HYGOV '
0.50000
1.2000
3 ' GENCLS '
1
1
1
1
6.7000
1.2200
0.18600
0.10000
5.0000
0.50000 E -01
0.20000 E -01
0.20000
0.0000
0.28000 E -01 0.35000 E -01
4.4100
0.76000
0.29700
0.20000
0.80200
/
10.000
100.00
0.50000 E -01
0.0000
0.0000
/
0.30000
5.0000
0.50000 E -01
0.41500
0.0000
1.2500
0.80000 E -01/
0.0000
/
Listing A.6: Dynamica parameters of GENSAL+SCRX+HYGOV test (rcrfd 10)
1
2
3
4
5
6
7
8
9
1 ' GENSAL '
0.0000
0.12000
1 ' SCRX '
0.0000
1 ' HYGOV '
0.50000
1.2000
3 ' GENCLS '
1
1
1
1
6.7000
1.2200
0.18600
0.10000
5.0000
0.50000 E -01
0.20000 E -01
0.20000
0.0000
0.28000 E -01 0.35000 E -01
4.4100
0.76000
0.29700
0.20000
0.80200
/
10.000
100.00
0.50000 E -01
0.0000
10.000
/
0.30000
5.0000
0.50000 E -01
0.41500
0.0000
1.2500
0.80000 E -01/
0.0000
/
Listing A.7: Dynamica parameters of GENSAL test
1
2
3
4
1 ' GENSAL ' 1
0.0000
0.12000
3 ' GENCLS ' 1
5.0000
1.4100
0.10000
0.0000
0.50000 E -01 0.10000
1.3500
0.30000
0.50000/
0.0000/
4.0000
0.20000
Listing A.8: Dynamica parameters of test including three windings transformer
1
2
3
4
5
6
7
8
9
3 ' GENCLS '
102 ' GENROU '
4.0000
0.60000
102 ' STAB2A '
1.0000
102 ' IEEET1 '
-3.0000
0.0000
1
1
1
1
0.0000
5.0000
0.0000
0.20000
1.0000
1.4100
0.0000
0.0000
2.4000
0.0000/
0.50000 E -01
1.4100
0.12000
4.4000
0.10000 E -01
126.00
0.80000
0.30000 E -01
0.70000
1.3500
0.10000
10.000
0.50000 E -01/
0.50000
0.78000 E -01
5.0000
0.10000
0.30000
0.50000/
1.8000
3.0000
0.72600
0.50000/
References
[1] iTesla,url=http://www.itesla-project.eu/.
[2] Modelica,url=https://www.modelica.org.
[3] Dymola, Dynasim,url=www.dynasim.se.
[4] Dymola Manual Version 5.3a, Dynamic Modeling Laboratory, Dynasim AB, Sweden.
[5] Panciatici, P.; Chieh, AS., ”Equation-based hybrid modeling of power systems for time-domain
simulation,” Power and Energy Society General Meeting, 2011 IEEE , vol., no., pp.1,9, 24-29
July 2011. doi: 10.1109/PES.2011.6039155
[6] P.Kundur,Power System Stability and Control, McGraw-Hill, 1993.
[7] Federico Milano, Power System Modelling and Scripting, Springer, 2010.
[8] IEEE Standard Board, “IEEE Guide for Synchronous Generator Modeling Practices in Stability Analyses”, IEEE Inc 1991.
[9] Siemens PTI, “PSSE Program Application Guide v.30.2”,Siemens Power Transmission & Distribution Inc.,Power Technologies International, 2005.
[10] Siemens PTI, “PSSE Program Operation Manual v.30.2”,Siemens Power Transmission &
Distribution Inc.,Power Technologies International, 2005.
[11] Siemens PTI, “PSSE User Manual v.30.2”,Siemens Power Transmission & Distribution
Inc.,Power Technologies International, 2005.
[12] Fritzson, Peter. “Principles of object-oriented modeling and simulation with Modelica 2.1,”
John Wiley & Sons, 2010.
®
[13] Modelica Association,“Modelica - A Unified Object-Oriented Language for Physical Systems Modeling,Version 3.2,March 24, 2010.
[14] Panciatici, P.; Chieh, A.S., “Equation-based hybrid modeling of power systems for timedomain simulation,” Power and Energy Society General Meeting, IEEE , vol., no., pp.1,9,
24-29 July 2011 doi: 10.1109/PES.2011.6039155
[15] Chieh, A.S., Panciatici, P., Picard, J., “Power system modeling in Modelica for time-domain
simulation,”PowerTech,2011 IEEE Trondheim, vol., no., pp.1,8, 19-23 June 2011.
[16] Vanfretti, L., Li, W., Bogodorova, T., “Panciatici, P., unambiguous power system dynamic
modeling and simulation using modelica tools,” Power and Energy Society General Meeting
(PES), 2013 IEEE, pp.1,5, 21-25 July 2013.
[17] Richard P.Schulz, “Synchronous Machine Modeling”, General Electric Company, Schenectady, N.Y. IEEE 1975.
65
66
REFERENCES
[18] IEEE Standard Board, “IEEE Guide for Synchronous Generator Modeling Practices in Stability Analyses”, IEEE Inc 1991.
[19] IEEE African, “Assessment of Commercially Available Software Tools for Transient Stability
: Experience Gained in an Academic Environment”, IEEE Inc, 2004.
[20] “IEEE Recommended Practice for Excitation System Models for Power System Stability
Studies,” IEEE Std 421.5-2005(Revision of IEEE Std 421.5-1992) , vol., no., pp.0 1,85, 2006,
doi=10.1109/IEEESTD.2006.99499.
[21] Klempner,
G. and Kerszenbaum,
I.,“Operation and
Turbo-Generators”,IEEE
Press
Series
on
Power
url=http://books.google.se/books?id=DPdkLp crLAC
Maintenance of Large
Engineering,Wiley,2004,
®
[22] Carlos Grande-Moran,“Modeling of Three-Winding Voltage Regulating Transformers for Positive Sequence Load Flow Analysis in PSS E”,Siemens Energy, Inc.,no.106,pp.1-11,July 2010.
[23] Milano, F., “Hybrid Control Model of Under Load Tap Changers,” Power Delivery, IEEE
Transactions on, vol.26, no.4, pp.2837,2844, Oct. 2011.doi=10.1109/TPWRD.2011.2167521 .
[24] Calovic, M.S., “Modeling and Analysis of Under-Load Tap-Changing Transformer Control Systems,” Power Apparatus and Systems, IEEE Transactions on, vol.PAS-103, no.7,
pp.1909,1915, July 1984, doi=10.1109/TPAS.1984.318657.
[25] Turbine
&
Turbine
Governor
modeling,
url=http://64.190.51.133/Programs/Blacksea/Dynamic.
Istanbul,
May
2011,
[26] IEEE Committee Report.“Dynamic Models for Steam and Hydro Turbines in Power System
Studies”, IEEE Trans., Vol. PAS-92. pp. 1904-1905, November/ December 1973.
[27] IEEE Working Group Report. “Hydraulic Turbine and Turbine Control Models for System
Dynamic Studies ”, IEEE Trans., Vol. PWRS-7, No.1, pp.167-179, February 1992.