1
Event Correlated Usage Mapping
in an Embedded Linux System A Data Mining Approach
Anton Norell
Oscar Linde
Department of Automatic Control
MSc Thesis
ISRN LUTFD2/TFRT--5988--SE
ISSN 0280-5316
Department of Automatic Control
Lund University
Box 118
SE-221 00 LUND
Sweden
© 2015 by Anton Norell & Oscar Linde. All rights reserved.
Printed in Sweden by Tryckeriet i E-huset
Lund 2015
Abstract
A software system composed of applications running on embedded devices
could be hard to monitor and debug due to the limited possibilities to extract
information about the complex process interactions. Logging and monitoring
the systems behavior help in getting an insight of the system status. The information gathered can be used for improving the system and helping developers
to understand what caused a malfunctioning behavior. This thesis explores the
possibility of implementing an Event Sniffer that runs on an embedded Linux
device and monitors processes and overall system performance to enable mapping between system usage and load on certain parts of the system. It also
examines the use of data mining to process the large amount of data logged by
the Event Sniffer and with this find frequent sequential patterns that cause a
bug to affect the system’s performance. The final prototype of the Event Sniffer
logs process cpu usage, memory usage, process function calls, interprocess communication, system overall performance and other application specific data. To
evaluate the data mining of the logged information a bug pattern was planted
in the interprocess communication, that caused a false malfunctioning. The
data mining analysis of the logged interprocess communication was able to find
the planted bug-patterna that caused the false malfunctioning. A search for a
memory leak with the help of data mining was also tested by mining function
calls from a process. This test found sequential patterns that was unique when
the memory increased.
Keywords: Data mining, Generalized Sequential Pattern, Debugging, Embedded Linux, Logging
1
Acknowledgement
We would like to extend a big thank you to Martina Maggio who has been
our supervisor at LTH and has provided us with a lot of feedback and support
during our master’s thesis.
We also want to thank all the people at the department of New Business at Axis
Communication. A special thanks to Rickard Andersson and Marcus Johansson
who has been our supervisors at Axis and helped us during the development
process.
We would also like to thank Karl-Erik Årzen for being our examiner at LTH.
2
Acronyms
A1001 Axis network door controller.
GSP General Sequential Pattern.
KDD Knowledge discovery in databases.
PACS Physical Access Control System.
PID Process identification.
PST Probabilistic Suffix Trees.
vPST vectorized Probabilistic Suffix Trees.
3
Contents
1 Introduction
7
1.1
Background . . . . . . . . . . . . . . . . . . . . . . . . . . . . . . . .
1.2
Problem definition . . . . . . . . . . . . . . . . . . . . . . . . . . . .
8
1.3
Scope . . . . . . . . . . . . . . . . . . . . . . . . . . . . . . . . . . .
8
1.4
Related work . . . . . . . . . . . . . . . . . . . . . . . . . . . . . . .
9
1.5
Outline . . . . . . . . . . . . . . . . . . . . . . . . . . . . . . . . . .
13
1.6
Individual Contributions . . . . . . . . . . . . . . . . . . . . . . . . .
14
2 Approach
7
15
2.1
Embedded Linux . . . . . . . . . . . . . . . . . . . . . . . . . . . . .
15
2.2
Proc Filesystem . . . . . . . . . . . . . . . . . . . . . . . . . . . . . .
16
2.3
Real-Time Systems . . . . . . . . . . . . . . . . . . . . . . . . . . . .
17
2.4
Physical Access Control System . . . . . . . . . . . . . . . . . . . . .
19
2.4.1
Input/Output - ports . . . . . . . . . . . . . . . . . . . . . .
20
2.4.2
2.5
The Event2 system . . . . . . . . . . . . . . . . . . . . . . . .
21
Data Mining . . . . . . . . . . . . . . . . . . . . . . . . . . . . . . .
22
2.5.1
Association rules . . . . . . . . . . . . . . . . . . . . . . . . .
25
2.5.2
General Sequential Pattern . . . . . . . . . . . . . . . . . . .
26
2.5.3
The Process of Data Mining . . . . . . . . . . . . . . . . . . .
27
2.5.4
RapidMiner . . . . . . . . . . . . . . . . . . . . . . . . . . . .
30
3 Evaluation
3.1
3.2
31
Design . . . . . . . . . . . . . . . . . . . . . . . . . . . . . . . . . . .
31
3.1.1
Purpose of the Event Sniffer . . . . . . . . . . . . . . . . . . .
31
3.1.2
Developer Questionnaire . . . . . . . . . . . . . . . . . . . . .
32
Implementation . . . . . . . . . . . . . . . . . . . . . . . . . . . . . .
33
3.2.1
Structure . . . . . . . . . . . . . . . . . . . . . . . . . . . . .
33
3.2.2
The Collection of Data . . . . . . . . . . . . . . . . . . . . . .
35
4
3.2.3
Data Filtering . . . . . . . . . . . . . . . . . . . . . . . . . .
37
3.2.4
Data Storage . . . . . . . . . . . . . . . . . . . . . . . . . . .
38
3.2.5
Data Retrieved . . . . . . . . . . . . . . . . . . . . . . . . . .
39
3.2.6
The Presentation of Data . . . . . . . . . . . . . . . . . . . .
41
3.2.7
The Preparation of Data . . . . . . . . . . . . . . . . . . . . .
42
3.2.8
The Mining of Data . . . . . . . . . . . . . . . . . . . . . . .
45
3.2.9
The Evaluation of the Mined Data . . . . . . . . . . . . . . .
46
4 Experimental Results
4.1
4.2
4.3
48
Test 1 - Finding Deployed Bug . . . . . . . . . . . . . . . . . . . . .
48
4.1.1
Purpose . . . . . . . . . . . . . . . . . . . . . . . . . . . . . .
48
4.1.2
Setup . . . . . . . . . . . . . . . . . . . . . . . . . . . . . . .
48
4.1.3
Execution . . . . . . . . . . . . . . . . . . . . . . . . . . . . .
50
4.1.4
Result . . . . . . . . . . . . . . . . . . . . . . . . . . . . . . .
50
4.1.5
Comment . . . . . . . . . . . . . . . . . . . . . . . . . . . . .
51
Test 2 - Bad Access Time . . . . . . . . . . . . . . . . . . . . . . . .
52
4.2.1
Purpose . . . . . . . . . . . . . . . . . . . . . . . . . . . . . .
52
4.2.2
Setup . . . . . . . . . . . . . . . . . . . . . . . . . . . . . . .
52
4.2.3
Execution . . . . . . . . . . . . . . . . . . . . . . . . . . . . .
53
4.2.4
Result . . . . . . . . . . . . . . . . . . . . . . . . . . . . . . .
53
4.2.5
Comment . . . . . . . . . . . . . . . . . . . . . . . . . . . . .
53
Test 3 - Finding Memory Leak . . . . . . . . . . . . . . . . . . . . .
53
4.3.1
Purpose . . . . . . . . . . . . . . . . . . . . . . . . . . . . . .
53
4.3.2
Setup . . . . . . . . . . . . . . . . . . . . . . . . . . . . . . .
54
4.3.3
Execution . . . . . . . . . . . . . . . . . . . . . . . . . . . . .
54
4.3.4
Result . . . . . . . . . . . . . . . . . . . . . . . . . . . . . . .
55
4.3.5
Comment . . . . . . . . . . . . . . . . . . . . . . . . . . . . .
56
5 Conclusion
58
5
5.1
Discussion . . . . . . . . . . . . . . . . . . . . . . . . . . . . . . . . .
58
5.2
Future Work . . . . . . . . . . . . . . . . . . . . . . . . . . . . . . .
59
6
1
1.1
Introduction
Background
Today one is often surrounded by hundreds of digital devices that make everyday
life easier. Many of them are hidden and not even noticeable or intractable. These
devices are often referred to as embedded devices and serve a single purpose such as
controlling a dishwasher, an alarm clock or access to a door. An embedded device
often consists of a processing unit, that can execute some program, other hardware
and surrounding electronics mounted on a circuit board. The most simple devices
will run a single program line by line, while others are much more complex running
operating systems with support for multithreaded real time applications.
A software system running on an embedded device is in many cases hard to monitor
and understand since different processes interact in a complex way and it may lack a
graphical user interface. Some programming environments offer debugging support.
There, the code can be tested, executing it line by line and inspecting the effect
of each operation. Automated tests can also be created to see if the result of the
execution is the expected one.
However, as the scale and complexity of the software grows, containing thousands
of lines of code, those ways of finding errors become time consuming and can miss
errors, because these errors are due to the interaction of multiple devices and may
occur only when specific time conditions verify. Due to this, debugging a device for
a critical error might slow down the delivery time of a release. Other problems with
this approach is that some bugs depend on timing, synchronization and communication between different processes running on the system. To get an insight of the
system behavior and to be able to find those hidden errors, one can use different
techniques to log and monitor the system. The information gathered is useful for
improving the system’s performance and can help developers to understand what
caused a malfunctioning.
7
This thesis explores different techniques of logging and will investigate the possibility to analyze logs with the use of data mining, on a complex system consisting
of multiple interconnected devices. The test system is based on the product Axis
network door controller (A1001) from Axis Communication. This is an embedded
Linux device running applications for physical access control.
1.2
Problem definition
There are two main goals for this master’s thesis. The first one is to explore what
is the relevant information needed to analyze a complex embedded Linux system
composed of interconnected devices, running a specific application consisting of
multiple daemon processes. We will study how to extract the information in a smart
and efficient way without affecting the overall performance of the system. For this
first part, relevant data is data that gives information about the system performance
and data related to the executing applications that can be interesting for detecting
errors and their causes. For example, did the memory usage of a process change
when a certain sequences of events were generated.
The second part is to investigate if it is possible to apply data mining theory on
information extracted from the system to gain a better understanding of how the
system is behaving under certain circumstances.
We will create a prototype of a daemon to collect the data and log it in a smart
and compact way. The logged data will then be analyzed to gain knowledge and
information about the system. The main approach to this analysis will be to apply
the theory of Data Mining.
1.3
Scope
There are some existing tools for collecting and logging performance on Linux, e.g.
top, kernelshark and vmstat. The problem for the scope of this thesis is that most
of these tools are unnecessarily large and collect data that is not needed. This
8
might not be a problem on a desktop computer with lots of resources available. On
an embedded system, on the other hand, the resources are often limited to fit the
needs of the running application and to be cost efficient. Given this remark, the
use of existing tools will be limited in this work. Another aspect is that the Axis
A1001, is running a MIPS architecture processor which means that not all existing
software is usable or easy to install. Except for logging the relevant general system
information in Linux, we will focus on logging the behavior of the Physical Access
Control System (PACS) specific applications running on the system. To do this
the logging daemon has to be tailor made and integrated into the PACS process
communication system. This would be hardly achievable with a standard logging
framework.
This work does not cover any hardware or electrical related debugging, nor is any
hardware used for debugging such as JTAG [1]. All the intelligence is coded at the
application level in Linux, meaning that the prototype runs as a standard application
that is compiled and executed. This thesis does not involve programming of the
Linux kernel, such as writing kernel modules for logging nor any logging of the
events in the kernel.
Data Mining is here explored and investigated. The focus will be on using existing
tools and frameworks to apply Data Mining for finding troublesome conditions in
distributed systems.
1.4
Related work
Software debugging is the act of troubleshooting and inspecting a software application to find and locate bugs. As technology evolves and computer systems become
more complex, with multi-core hardware and multithreaded applications, containing thousands to millions of lines of code, the complexity of debugging increases.
This complexity introduces new types of bugs that are different from bugs such as
obvious code errors and race conditions. A race condition is a phenomenon where
9
the output of a software is dependent on the timing and sequences of events that
are not necessarily controlled by the software itself. Errors can depend upon timing
of events, multiple applications communicating and accessing the same data. The
timing might be so crucial that the bug disappears when the system is altered for
debugging, also known as a “Heisenbug” [2]. There are different methods to debug a
system. The most common approach is to run multiple static test cases and observe
the system’s behavior. If an error occurs, one can then step through the execution
to see where the system fails.
Some bugs might be hard to find and locate. Due to this, there has been some
research about applying techniques from the data mining domain to help developers
in finding bugs. Data mining is a process that consists of applying data analysis and
discovery algorithms on provided data [3]. If executed properly, this will produce
patterns or models of the data. The data to be analyzed in the case of locating bugs
can be trace-logs from a system or application. This approach of debugging software
systems has been applied and evaluated in some earlier published work [4][5][6].
Data mining has proved to identify different types of software bugs. In [7] the
following types of bugs are mentioned:
• Design bugs - For example, the design of a communication protocol is triggering a bug.
• Accumulative effect bugs - Includes bugs like memory leakage or overflows.
• Race condition bugs - Common bugs that occur when there is a large amount
of concurrency in the system and the output of the system is depending on
events that are out of control of the system itself or only controlled by a part
of it.
• Assumptions mismatch bugs. - When protocols that interact with the physical
environment are not designed properly.
10
The techniques to find the above mentioned bugs were applied in the analysis of
Wireless Sensor Networks, since in this case many interacting entities and bizantine failures can occur, with non-deterministic behaviors. It is very difficult, if not
impossible, to replicate the behavior of a large system composed of interconnected
devices. In this case, it is necessary to rely on log files. By collecting data logs from
systems and then processing them with the help of Data Mining it can be possible
to gain useful information about what caused the failure.
The research on debugging wireless sensor networks with data mining has been quite
extensive [8][9][10][7]. These articles present ways to find patterns in logs generated
by the system. Since these are bugs that appear in large non-deterministic real-time
systems, like the ones described in the articles, they are hard to replicate. The
actual bugs can in fact be observed when a lot of units are operating together on
a network. In the above mentioned articles the authors present ways of looking at
sequences of events to determine what could be the reason of the faulty behavior.
The tool Dustminer, mentioned in [8] describes one of the most common approach
of using discriminative frequent pattern mining on logs generated by the system.
Before the mining starts, the logs are divided in two parts, separating bad logs (logs
of situations when the system has shown “bad behavior”) and good logs (logs of
situations when the system has shown “good behavior”). It is up to the developer
to decide what determines bad/good behavior. It is important that the logging tool
knows what signifies a good and bad log and marks them so it is possible for a human
to separate the logs without analyzing them in detail. When the tool finds patterns
in the log files these patterns are analyzed in order to find correlations between the
sequences. The purpose is to catch anomalies that could be the cause of a certain
problem in the system. The base algorithm used by many tools including Dustminer is called Apriori [11], which is an algorithm created for finding association
patterns between different sets of large data. Dustminer extends Apriori to better
serve the purpose of debugging a sensor network. The authors also present case
11
studies showing that their technique actually works. For example, they successfully
found a kernel bug in LiteOS using their tool.
In [9] the authors continue their work with Dustminer but they now present an
improved version that performs better in terms of finding the “culprit” sequence
which was the tipping point that caused the system to fail. The basic idea of this
improved version is that you extract less sequences of events from the system logs.
This prevents the user of the tool to miss something due to the fact that the most
important sequences are being swallowed by the huge amount of sequences that
usually come out of the original version of the tool (a few hundred compared to
thousands coming out of the old version). They have solved this by implementing
a count function that not only count the occurrence of a certain sequence inside a
single log file, but in multiple log files as well. They then use both of these estimates
to generate the support for the sequence. What they mean by support is how many
times the sequence is present in the logs. The result is a more limited amount of
relevant sequences. The authors prove this by running it on the same cases as they
did in [8] and showing successful runs where they found sequences they did not find
with the original tool.
A different approach of using basically the same principle as in Dustminer is presented in [10]. The author presents a different way to mine sequences of traces
and logs. By using vectorized vectorized Probabilistic Suffix Trees (vPST), which
is a Probabilistic Suffix Trees (PST) (a PST is simply a probabilistic model with
variable memory length for modeling sequences) that has been vectorized by simply
combining all the probability vectors on each node in the PST to one single vector.
It is then much easier to analyze it since it is now a vector instead of a suffix tree.
Together with a support vector machine, which is a way to construct a hyperplane
that is optimal for separating different patterns, the author introduce a more effective way of finding bugs in wireless sensor networks. This paper obtains better
results with respect to Dustminer, since Dustminer is limited to frequent pattern
12
mining. In fact, Dustminer can miss some rare sequence of events that could be of
interest, as mentioned in [9]. Dustminer requires the developer to define “good” and
“bad” patterns in order to work properly and that it could be difficult to determine
what is bad/good behavior. This can also cause some overhead. The author also
mentions that frequent pattern mining is usually very expensive with long sequences
of events. From the case studies that is provided in the paper one can see that it
is possible to find bugs in a wireless sensor network application by only doing a
few iteration of the techniques that were developed. If the bug is more complex, it
is found by just doing more iterations with the help of feedback from developers,
making the tool smarter and better in recognizing what is actually a bug. The
author claims that this is the first flexible and iterative debugger for wireless sensor
network applications.
There has also been some research related to finding bugs in operating systems
and applications by applying data mining [5][12]. In [5], a tool called StackMiner
is presented which has been used to locate performance (bad response time) bugs
in operating systems and applications. The authors discuss the problem of finding
flaws in systems when it consists of millions of lines of code and how data mining
can help to significantly reduce the time spent on locating the problems. The tool
has been used to mine stack-trace data collected from real-world users and been
able to help developers to locate previous unknown bugs.
1.5
Outline
This thesis is structured as follows:
Approach
This section describes the different areas and material that is used in the work and
its theoretical background. This lies as a base for the research and explores the
things that are useful to solve the task. The knowledge and experienced gained
from this support the choices of techniques and the development of the prototype
13
for logging and the data mining.
Evaluation
This section describes the implementation of the prototype application, how it is
designed and its functional use. The process of how the Data Mining is applied is
also described here.
Experimental results
The testing of the prototype is described and which test cases that will be executed
in order to generate logs that can be processed. The setup for the data mining and
its process is also explained within this section. This section present the results
from the different test cases.
Conclusion
A summary and discussion of the work and the results from the experimental testing.
What knowledge could be gained and how well did the data mining work is discussed
as well as future work.
1.6
Individual Contributions
The work of this thesis has mostly been divided equally between the two authors,
Anton Norell and Oscar Linde. However, Oscar Linde has had the overall responsibility of the Data Mining process. Anton Norell has had the overall responsibility
of the development of the prototype.
14
2
Approach
During the course of our thesis we developed a prototype to help debug complex
distributed embedded systems with data mining. The theoretical background that
constitutes the foundation for this thesis will be reviewed in this section. We start
with explaining embedded Linux and the subset of its features that we have used
in our implementation and continue describing real-time systems in general and the
data mining theory used for finding patterns of events that correspond to bugs. In
the end, we provide a description of the physical access system that our solution is
developed for.
2.1
Embedded Linux
Our implementation runs an embedded version of Linux as its operating system.
When talking about Linux in an embedded system it is important to understand the
difference between the Linux kernel, a Linux system and a Linux distribution. Usually, when people talk about Linux, they mean the Linux kernel which is developed
and maintained by Linus Torvalds. The kernel provides the core functionalities of
the system and is, after the bootloader, the first piece of software to be run on any
embedded Linux system [13]. Since the kernel is constantly updated, a numbering
scheme has evolved, which looks like: x.y.z, where x, y indicates the version and
z indicates the release number. A common case when working with Linux is that
one is developing on a custom made release for the specific product that a team is
working with. This was the case during our work at Axis. This case falls under
the definition of a Linux system. A Linux system includes the kernel and also other
software such as real-time additions and libraries [13]. Last but not least, a Linux
distribution is basically a package which includes all the files and other necessary
software to provide a working Linux solution to a certain type of product to a certain purpose. For example, Debian is a Linux distribution intended for a personal
computer.
15
With this in mind, what distinguishes embedded Linux? An embedded Linux system is simply an embedded system based on a Linux kernel without any other tools
or libraries used for developing and an embedded Linux distribution [13] usually
includes development tools and applications designated for Linux systems. It is
important to keep these apart since the meaning of them is different. During this
thesis we have been working on a Linux system custom made at Axis with a Linux
kernel running version 2.6.35.
2.2
Proc Filesystem
The proc file system (procfs for short) is a pseudo filesystem in Linux that presents
information about the kernel and the processes that currently are running. Pseudo
means that the file system does not really exist. This can be demonstrated by
looking at the size of the files in /proc. They appear to be zero, but still seem to
have information inside them when they are opened. Procfs is usually mounted at
/proc and is a reflection of the state that the kernel is in. One can look at the
procfs as an interface that makes the state of the kernel humanly readable. The
proc file system contains info such as memory usage of the system, how many ticks
the CPU has been in idle or in running mode for both the overall system and for a
specific process. These CPU fields are read from /proc/stat and /proc/[PID]/stat.
By dividing the ticks that the system/process has been in running mode with the
total amount of ticks passed since the last measurement, we get the CPU utilization.
Shell applications such as ‘ps’ and ‘top’ use procfs when presenting CPU load and
memory utilization and can be seen as reliable as long as the calculations are done
in a correct way.
Mainly, the procfs consists of two parts. The first part consists of the numerical
directories. The name of the directory is the Process identification (PID) of the
process that the directory describes. In these directories one can find extensive runtime information that is process specific. The second part consists of directories that
16
are non numerical and which present information about the kernel. For example,
/proc/version describes the revision of the kernel that is currently operating [14].
Procfs contains both read-only and read-write files. The read-only files only presents
information and the read-write files enables changes to be made to the kernel during
runtime. A good example is the /proc/sys/net/ipv4/ip forwarding file [14]. Based
on the content, one can see that the system currently is forwarding IP datagrams
between networks. This could easily be changed by making modifications to the file.
This is the case with most of the files in procfs with read-write permission.
There are dozen of different information that one can extract from from the procfs
and during our approach to our problem we have considered the following information to extract: /proc/stat which presents various information about the kernel [15].
We have especially looked at the information about how the CPU has been working
to be able to log the CPU utilization. The information consists of numbers represented in ticks describing how many ticks the CPU has been occupied executing
user, niced1 and kernel processes. This gives us the ability to calculate an overall
utilization percentage of the CPU load of the entire system. We have also considered
/proc/meminfo which present memory utilization of the entire system. Some of the
fields that we have looked at are MemTotal, which presents the total usable ram
and MemFree that presents the free, usable memory. Process wise, we use procfs
to check if processes are alive and indirectly the /proc/[PID]/statm which presents
the memory status of each process since we are using the function pmap to retrieve
the information from that file.
2.3
Real-Time Systems
In real-time systems there are mainly three types of constraints that have to be
considered, which is a distinct difference compared to traditional software, e.g soft1
A process given low priority
17
ware that is not running on a real-time system [16]. The most important constraint
is time. A task must be scheduled and executed before a certain deadline for the
result to be usable. In a non real-time system, the only matter of interest is that the
system produces a logical correct result. In real-time systems that is not enough. If
the result is not presented in time, there could be severe consequences. The second
aspect to be considered is reliability. A real-time system must, at every cost, be able
to deliver what it is supposed to, due to the fact that in many environments where
real-time systems are operating, a failure could become a hazard for the humans
working with the system. The environment is the third and last aspect in real-time
systems because the environment can be an active component in a real-time system.
Almost every real-time system have in- and output ports that the system calculations are based on. In our case, these are the doors and numerical panels connected
to the access control unit.
Real-time systems are divided into two categories based on the impact of missing
a deadline. A system that generates a complete failure due to a deadline miss is
considered hard real-time. A system where only the quality of service is degraded
due to a deadline miss, but the result is still of value, is considered soft real-time.
Our case study falls under the category soft, since missing deadlines only generates
consequences like slower access time, which does not cause a severe failure but is
degrading the quality of the product.
Real-time systems are triggered by something that indicates to the system that it is
time to execute. Different systems are triggered in different ways and usually these
kind of systems have two different approaches: event-triggered and time-triggered
[17]. A system is called event triggered when the system is triggered to execute on
the occurrence of an event. There are events of significance, which the system is
reacting on and there are insignificant events that are not of interest to the system. The significant events consist of predictable events, which can be predicted
by applying, for example, known laws of physics to determine if the event will oc-
18
cur. There is also chance events which cannot be predicted in the same way as
predictable events. Since the chance events are generated randomly they can only
be probabilistically predicted.
Time-triggered systems are periodically observing its own state. This means that
independent of how often events are occurring in the environment where the realtime system is operating, the system can only react to these events with the same
pace as the period which the system is polling. Due to the fact that these kinds of
time-triggered systems are polling at a given periodic rate, they are more predictable
than event-triggered systems [17].
2.4
Physical Access Control System
During the work of this thesis we have looked at a PACS that has been developed
at Axis Communications AB. The purpose of the PACS is to provide a system that
controls who may or may not gain access to a certain area such as an office space,
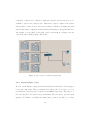
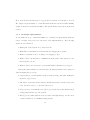
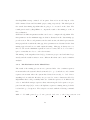
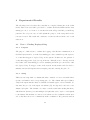
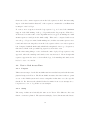
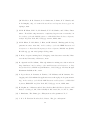
laboratories or warehouses. An overview of a typical PACS system is shown in Figure 1. The way that the system grants access is based on access groups, user rights
and time schedules [18]. The system has to make sure that a given person with a
given access to a given area is granted the right kind of access at a given time.
The main difference between this system and older similar systems is that the PACS
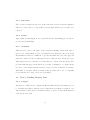
can consist of many units that forms a network via ethernet. Each unit, in our case
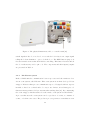
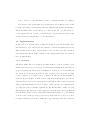
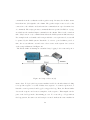
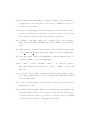
is the actual physical product, the A1001, which is a network door controller (see
Figure 2). The units are connected via ethernet and all the information that exists
in one unit is spread to every other unit with the help of a distributed database.
This enables the end user to connect to any unit that is included in the system if a
configuration is needed or some information has to be extracted. This also enables
the system to continue being operational even if one unit goes offline, is malfunctioning or even if the entire network goes down [18].
Every time a user wants to gain access to a resource controlled by a PACS setup,
19
a database lookup is done. This is to make sure that the user has the proper credentials to gain access to that resource. When the lookup is completed, the system
either grants or denies access to the user depending on which access rights and what
the schedule that is configured at that system is indicating for that particular user.
An example of a scheduled access right could be that staff at company can only
enter their office building during office hours.
Figure 1: An overview of a PACS system [19]
2.4.1
Input/Output - ports
In order for the PACS to support interactions with its environment , it has support
for several components. These are mainly card readers, pin code readers, door contact switches, lock relays and a request-for-exit (REX) button [21]. The purpose of
the card- and pin code reader is easy to understand. They are used to generate input
signals to the PACS to tell which user that wants to gain access. The door contact
20
Figure 2: The physical A1001 network door controller unit [20]
switch signals if the door is closed or not and the lock relay is an output signal
telling the lock mechanism to open or lock the door. The REX-buttons purpose is
if a user is inside an area that the PACS is controlling. This button lets user unlock
the door without any card or pin code. The components and their inputs/outputs
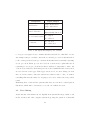
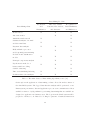
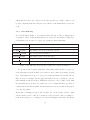
are presented in Table 1.
2.4.2
The Event2 system
Inside a PACS unit the communication between processes and other units are done
via an event system, called Event2. This event system is an Axis developed d-bus
wrapper. D-bus is a Interprocess communication protocol designed with two aspects
in mind: to have low overhead and to be easy to use. In fact, it is a binary protocol
that uses messages instead of byte streams when sending data [22]. By constructing
the event wrapper, Axis has achieved a tailor made event system for their PACS.
A process that uses the event system can be a producer of events, a consumer of
events, or both in some cases. The producer process generates events that are sent
21
Component
Card Reader
Input/Output
Swipe Invalid Card
Swipe Valid Card
Pin Code Reader
Enter Valid Pin Code
Enter Invalid Pin Code
Door Contact Switch
Door Open
Door Closed
Lock Relay
Door Locked
Door Unlocked
REX-button
Unlock door
Table 1: The Input and Output ports of PACS
to every process registered as a consumer that have subscribed to that kind of event.
An example is the process that controls the access rules, process A. A has subscribed
to the events generated by the process that checks what user is currently requesting
access, process B. When process A receives an event from B, a particular user is
requesting for access, process A knows that a database lookup must be made. An
event is created whenever the PACS gets some form of stimuli and all events created
are stored in an event logger. This logger was, however, not used during our work
since we did not want to affect the system more than we had to. Also, we wanted
something that was tailor made for our purpose in order to achieve the best possible
result.
Evaluating these events and the patterns that they are sent in is a crucial part in
this theses, which will be extensively covered in our evaluation section.
2.5
Data Mining
As the amount of information stored digitally from systems like shops, banks, social
media, websites and other computer systems is growing, the question of what this
22
data can be used for has arisen. This has lead to a new subfield of computer science
often referred to as Data Mining or Knowledge discovery in databases (KDD). Data
mining is a term referring to multiple methods and algorithms for extracting patterns and information from large data sets (i.e. large databases). Data mining is the
main core of the term Knowledge Discovery in Databases, which was coined during
the KDD workshop in 1989 [3] and widely used in the community. KDD is a wider
term including preparation, selection and analysis of the data. All these terms have
evolved during the last decades and do not have any exact definition of their actual
content and meaning. Data mining is more commonly used as the umbrella name
in the field, but is interchangeably used with KDD. In the rest of this report data
mining is used as the common term.
The field of data mining is continuously being investigated and new methods and
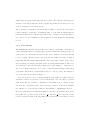
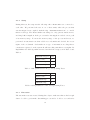
algorithms are being developed to improve performance and the results of the analysis. In [23], the main classes of algorithms are described as shown in Table 2. The
table provides a short overview of the different classes and what sort of problems
they can be used for. The classes do not specify any specific algorithms and there
are many versions and types of algorithms that fit within each class.
Data mining is already used and applied in many fields today in real world
applications, were big data is analyzed to gain more knowledge [3]. Association rule
mining is one of most common methods were relationship and patterns of frequently
occurring items are searched for (described in [11]). A classic example of association
rule mining is the mining of customer basket data. If a customer buys potatoes, she
is likely to buy salad too. The algorithm might then find e.g. that this is true for 82%
of the cases. This sort of patterns can be found with association rules mining of sales
data. To motivate the extra effort for mining the data, this information can be used
to increase profit by directed advertising and product placement. Another usage is
to find anomaly behavior and classify behaviors. This can be used to identify outliers
of data and be applied to e.g. detect bank frauds or errors in text. This master
23
Data Mining Problem
Data Mining Class
Decision trees
Predication
Discovery of Data
Recognition of
and
Patterns, Associations,
Data Similarities
Classification
and Structure
and Differences
X
X
X
Association rules
Artificial neural network
Statistical analysis of normal
X
X
X
X
X
X
and abnormal data
Bayesian data analysis
X
Hidden Markov processes
X
X
X
X
X
X
X
X
X
X
X
X
and Sequential pattern mining
Prediction and classification
X
models
Principal components analysis
Psychometric methods of
X
latent variable modeling
Scalable clustering
Time series similarity/indexing
X
Nonlinear time series analysis
X
X
X
X
Table 2: The main classes of Data mining algorithms, source [23]
thesis explores the application of data mining on data collected from the software of
the Axis PACS system. The logged data that the analysis will be performed on are
Linux system performance data and application process event communication. Most
available software tools/algorithms for performing data mining that are available are
designed for application in business cases. The logs from the PACS system will be
prepared to fit these tools. Instead of looking for patterns of business transactions
24
the target will be to find patterns in logged events and performance data. Mining the
data, we should be able to discover new knowledge about the system, but to make
this happen there has to be a structured approach of how it is applied and an idea of
what sort of pattern that is being mined for. The way the data is presented is of great
importance and will be discussed in Section 2.5.3. The main algorithms that will
be tested for mining the data are association rules and sequential pattern mining.
With the association rules the patterns that are being searched for are patterns like,
what type of events that are causing heavy load on the system performance and
which processes are being loaded the most. The sequential pattern mining can be
used to find sequence of events that lead to different system performance issues. For
example if a process keeps crashing during a test, these event logs can be collected
and mined to find frequent sequence of events that may be the cause of the crash.
The algorithm that will be used to perform the sequential data mining is General
Sequential Pattern (GSP) [24].
2.5.1
Association rules
Association rules is one of the classes in data mining that is widely used. It is used
to find relations between items in large databases. For example in shop transaction
data, an association rule might be that; a minimum percentage of all the transactions containing the item apple also contains the item banana. This apple/bananna
correlation is then called an association rule. There are a number of solutions to
Association rule problems. One of them is introduced by Rakesh Agrwal et. al [25].
Quoting from [25], the formal problem statement of association rule mining is: Let
I = {i1 , i2 , . . . , im } be a set of literals, called items. Let D be a set of transactions,
where each transaction T is a set of items such that T ⊆ I. Associated with each
transaction is a unique identifier, called its T ID. We say that a transaction T contains X, a set of some items in I, if X ⊆ T . An association rule is an implication
of the form X ⇒ Y , where X ⊂ I, Y ⊂ I, and X ∩ Y = ∅. The rule X ⇒ Y
25
holds in the transaction set D with confidence c if c% of the transactions in D that
contain X also contain Y . The rule X ⇒ Y has support s in the transaction set
D if s% of the transactions in D contain X ∪ Y . In the statement above support
of an item is defined as the percentage of how many transactions that contains
the item, i.e. supp(X) =
[numberof transactionscontainingX]
[totalnumberof transactions]
The confidence of a rule
X ⇒ Y is defined as the support for the rule X ⇒ Y divided by the support for X.
conf (X ⇒ Y ) = supp(X ∪ Y )/supp(X).
2.5.2
General Sequential Pattern
GSP is a data mining algorithm developed to find frequent sequential patterns of
items in large data. It is based on the concept of the Apriori algorithm and developed
versions like AprioriAll [24][26]. The motivation for GSP was to discover sequential
patterns that frequently occur in the database, where the minimum limit of the
frequency of the pattern sequence is called the minimum support of the sequence.
An example of a sequential pattern would be multiple customers exceeding the
minimum support of the data set that bought a TV and a TV-bench. In a later
transaction the same customer bought a video game and in a third transaction after
that a joystick. The GSP algorithm basic structure is as follows. The algorithm
goes through the data several times and builds up sequences. In the first iteration
the support of each item is calculated, the support is the frequency of an item
that exist in all the item sets. In the next iteration all the items that exceeded the
minimum support is used to build sequences of two items. Then the support of all the
sequences with length two is counted and those that exceeds the minimum support
continues to the next iteration. The algorithm continues with iterating over the data
increasing the length of the sequences with one item each time until there are no
more sequences exceeding the minimum support. Except for the minimum support,
the algorithm has some rules when it combines items to build sequences. The other
parameters are window, minGap and maxGap, which can be set to obtain different
26
properties. The maxGap specifies the maximum time gap between two items, if the
time between the two elements exceeds the maxGap they will not be combined as
a sequence. In the same way, the minGap can be used to specify a minimum time
gap between two items (e.g. two items have to be separated with time minGap to
be in a sequence). The window parameter allows items close to each other in time
to be grouped together as one item.
A simple example of the GSP would be the following. Given the following data of
four transactions; (A,C,B,E,D), (B,E,A,D,F), (A,E,B,E,C), (A,B,B,F,F), a window
size of 0, a minGap of 0, a maxGap of 1 and a minimum support of 75%. In the first
iteration the algorithm would find that A, B and E exceeds the minimum support
(exists in 75% or more of the transactions). In the second iteration the algorithm
look for combinations of sequences of A, B and E that exceeds the minimum support.
In these transactions the only sequence of A, B or E that exceeds the minimum
support is (B, E). In a third iteration the algorithm will not be able to find any
combination of (B, E) and A, B, E that exceeds the minimum support and stop
looking. The only sequential pattern found by the GSP in this case is then (B, E).
2.5.3
The Process of Data Mining
The process of data mining can be divided into several steps. Extracting data from a
database and trying to push the data into an algorithm to mine it for patterns would
not work by itself. The data has to be preprocessed and the goal of the data mining
has to be decided. The process is iterative and requires some innovative thinking
as there is not only one way to solve the problem or a single formula for choosing
the right algorithm. The book Data Mining and Knowledge Discovery handbook
[27], presents a process divided into nine step that describes the necessary steps
from extracting the data to interpret the results. A summary of the process and the
steps are given below:
1. Developing an understanding of the application The initial step where ev27
erything is prepared and information about the task is gathered. This is to
get an understanding of the task and what results that might be expected.
The goals of data mining should be determined and chose appropriate tools
and algorithms.
2. Selecting and creating a data set on which discovery will be performed
This step includes finding out which data is available and determining if there
is any additional attributes that have to be added to the data. This part is
very important since the data that is chosen is the base for the study and if
some important attributes are missing the entire data mining process might
fail. As the process of data mining is iterative, one might have to go back to
this step to add additional data if the first results of the data mining are not
satisfying.
3. Preprocessing and cleaning In this part the data that was chosen is controlled and cleaned. This includes handling missing values, removing corrupt
data and removing data that is considered wrong. Handling missing values
can be done by removing that data or using models to predict the missing
value to make the data complete.
4. Data transformation In this stage the data is transformed in different ways
to better fit the data mining task. This step might include discretization of
numerical attributes, were a numerical attribute is divided into different classes
depending on its value. If possible, dimension reduction, were redundant or
irrelevant data can be reduced or removed [28] is performed. It is important to
understand how the data mining algorithm will interpret different attributes
and with the understanding of the application select the most relevant.
5. Choosing the appropriate Data Mining task Depending on the goals of the
data mining and the results from the previous steps, it is now time to choose
which class of data mining technique that should be used. Some examples of
28
classes are association rules to find relations between data, clustering to find
groups and structures in the data, classification to build a model to predict
and classify new data or regression to find a function that tries to model the
data. The goal of the data mining process can be divided into two main types,
description and prediction. Description tries to describe and visualize the data
and prediction is used to build models that can predict future data.
6. Choosing the Data Mining algorithm With all the information from the
previous steps an algorithm for performing the actual data mining shall be
chosen.
7. Employing the Data Mining algorithm In this step the data mining algorithm is applied to the data. This can be done by using a pre-existing tool
or by implementing the algorithm. The algorithm might be executed several
times with different algorithm-specific parameters to get as good results as
possible. A parameter in the algorithm might be to change the minimum support of an association algorithm to get more or less number of patterns. This
is an iterative process that requires some understanding of the task and how
different parameters changes the result.
8. Evaluation Evaluation of the result from the data mining and interpretation
of the patterns that was found. Did the knowledge gained fulfill the goals of
the data mining or do one need to go back some steps to improve the results?
This is also the stage where all the knowledge gained is documented.
9. Using the discovered knowledge In this step the knowledge gained for the
mining result is applied to the system/task the was researched. This to improve the old system, make it more efficient and measure if the changes has
the expected effect. This can be challenging as the data that was used for
the mining might be different from the latest data from the same system e.g.,
attributes might have been removed or added.
29
2.5.4
RapidMiner
During the work of this thesis we will explore the data mining tool RapidMiner.
RapidMiner is a user friendly, open source data mining tool that provides a comfortable way to use common data mining techniques [29]. It provides a graphical
interface where one can create processes that take a provided data set as input and
then process this data according to the chosen data mining model and then presents
the result in a human readable way.
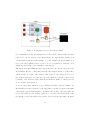
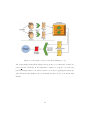
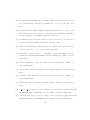
Figure 3: An example of how a process could look like in RapidMiners graphical
user interface.
When importing data to RapidMiner, the tool supports several different formats,
such as .csv, excel sheet, XML files or it can be connected to a database, making it
possible to import data dynamically. RapidMiner also provides data preprocessing
functionality in order for the data set to fit the modeling process which the data is
supposed to be used for. In Figure 3 an example of how a process could look like
in RapidMiner is given where square marked 1 is the data set, the square marked 2
is a data transforming operation fitting the data according to how the actual data
mining operation wants it, marked with a 3. This is the operation that actually
performs the data mining.
30
3
Evaluation
Here we provide a complete description of our implementation. We also discuss a
questionnaire, that we sent out to people involved with the A1001. Most of the
design decisions are made keeping in mind the answers received from the questionnaire.
3.1
Design
This section will present the idea behind the design of the implementation. First,
Subsection 3.1.1 gives a description of what the purpose of the Event Sniffer is.
Next, Subsection 3.1.2 includes the questionnaire used to gather useful information
of what a logging tool for a product like the A1001 should include according to the
engineers working with the product.
3.1.1
Purpose of the Event Sniffer
The main purpose of the Event Sniffer is to help people working with the A1001 gain
a deeper understanding of how the A1001 behaves under different kinds of usage
and to provide a possibility to correlate usage of the A1001 to loads of certain parts
and potential bugs. The Event Sniffer should provide data to be used as input for
a data mining tool, so that certain patterns of events and/or system load can be
identified as the potential cause of problems. The data mining procedure would
guide the process of determining what part/parts of the A1001 are the source of
failure or malfunctionings.
During the design phase of the Event Sniffer we had some concerns. First, the
Event Sniffer should not put a significant load on the rest of the system, in order to
make sure that the Event Sniffer was not itself the cause of any malfunctioning or
simply too resource hungry. Another aspect was what kind of information is relevant
when logging and debugging, an embedded Linux system. Should the data consist
of only kernel information or should more user space domain data be included?
31
How often should relevant data be logged and how much of it should be stored?
We designed a questionnaire to obtain information intended as an aid when making
design decisions about the Event Sniffer. The questionnaire is presented in the next
section.
3.1.2
Developer Questionnaire
To determine the scope of the Event Sniffer, we constructed a questionnaire that was
sent to relevant developers before the start of the implementation. The following
questions were included:
• What part of the system are you involved in?
• What kind of information is relevant when debugging those parts?
• What tools/methods are you using for debugging today?
• What could be an indication of malfunction in the parts of the system you are
knowledgeable about?
• What would be the best way to present information that has been logged?
Among the answers that were sent back, the following information was considered
when designing the prototype:
• System and process information such as memory usage and CPU utilization
should be logged often.
• The latest events sent via the Axis specific Event2 system, described in section
2.4.2, should be able to be presented if needed.
• Proper sources of information are gdb, logs generated from the Linux kernel,
debug prints and the proc file system.
• Wrong access, units stuck in between states and high latency are the most
common indicators of a malfunctioning system.
32
• A good way to log the information could be a dynamic list that one can filter.
The answers of the questionnaire gave an indication on how this prototype would
look like and what it would include when the implementation phase was finished.
Given the limited time for the thesis, we could not take into account all the received suggestions, but focused on system and process information, latest events
from Event2 and a dynamic list to log the information.
3.2
Implementation
In this section we present a more technical description of the Event Sniffer. The
first Subsection, 3.2.1, will describe the structure of the Event Sniffer and how the
different parts work together. Subsequently, Section 3.2, will go into more detail on
the parts that the Event Sniffer consists of and explain what is their role and how
they are implemented.
3.2.1
Structure
The Event Sniffer has been designed and implemented to run in real time on an
A1001. It is a daemon process, (a process that runs in background) with init.d as
its process parent [30]. The reason for making it a daemon process is that this was
the easiest way to integrate it in the product. A daemon process starts executing
on the occurrence of a certain event or condition. In this case the Event Sniffer is
awaken both periodically to poll the sources of information that is uses to present log
data and when it receives an event from the event2 system. The event2 system is an
Axis specific implementation based on dbus to enable interprocess communication
(see Subsection 2.4.2 for further explanation). The Event Sniffer consists of several
different parts. The first part of the logging process is the data collection, which is
the part that polls the sources of information that is interesting to log. An example
of such a source is the procfs (see Section 2.2). Each time the sources are polled,
necessary calculations are made to make sure logged data is presented in a way that
33
Figure 4: A flowchart overview of the Event Sniffer
is both humanly readable and interpretable for the system. The information is then
passed on to the second part of the Event Sniffer, the data filtering, which screen
out information that is not interesting to log. For example, the Event Sniffer does
not log the CPU utilization if it does not exceed a certain level. Otherwise, it is
simply not interesting to save that kind of information.
The information that fulfills the filter criteria is sent to the data storage part of the
Event Sniffer. Every log entry that passes the filter is then written to a ring buffer,
which is built on a sqlite3 [31] database that begins to add entries at the top of
the database and when it reaches the end of the database, it starts to write at the
beginning of the database again. This allows the Event Sniffer to always save the
most relevant log information.
To avoid losing data, which are logged during interesting events at runtime, the
Event Sniffer generates a snapshot of the ring buffer every time it registers something
critical in the system. This snapshot contains the current state of the ring buffer and
is associated with a debug message (written to a separate file) that indicates why
the snapshot of the ring buffer was generated. Aside from the ring buffer, the Event
34
Sniffer can also be configured to generate a snapshot of a function trace, tracing a
certain process. This function trace is an optional feature that can be turned on by
compiling with the compiler flag: -finstrument-functions. This compiler flag makes
it possible to print out every function that is called and what function that called
that particular function inside a process.
The generated snapshots are then downloaded to a PC with the help of a script
performed periodically by a Cronjob [32]. When downloaded, the data are processed
by bash scripts [33] and analyzed with the RapidMiner tool. This last part is
described in the Subsections 3.2.6, 3.2.7, 3.2.8 and 3.2.9
3.2.2
The Collection of Data
The Event Sniffer has three main sources of data. The first is the procfs. In order to make the Event Sniffer poll this periodically a function from glib called
g timeout add() [34] is used. Glib is a bundle of low level functions developed for
the C language to simplify development. It provides everything from linked list
infrastructures to streaming utilities. g timeout add() adds a function that is called
at a specified rate to something called the GMainContext [35]. The GMainContext basically contains everything that should be executed during a main loop. A
function added with the g timeout add() is called a callback function and enables
the Event Sniffer to poll sources at a given rate. In the callback function relevant
information from the procfs is read for both the entire system and processes that the
Event Sniffer are configured to log. Every process that should be logged is stored in
an individual struct containing information such as process name, process id (PID)
and other process specific information. All the structs are then stored in a linked
list, making it easy to modify or add additional processes which should be logged
as well.
The following information are logged from the procfs:
• CPU utilization for both the system and for each logged process
35
• Memory information for both the system and for each logged process including:
• Memory allocated for the process/Available for the system
• Memory used by the process/system
• The status of each process logged, alive or dead.
The second source of information is data explaining internal information of processes, such as the amount of credentials (access rights to a certain user) registered
on the system or how many units that are connected to a system. To extract this
kind of information, two other functions are called each time the callback function is
executed. The first one is called read var log messages() and its purpose is to parse
the /var/log/messages [36] for prints with the tag #EVENT SNIFFER#. These
are prints added to be able to extract information from other processes running
on the A1001 without having to deal with different processes trying to access the
same resource at the same time. The other function is called get nbr of peers() and
fetches the amount of A1001 units that are connected at the moment. This kind of
information could be relevant when it is desired to look at how the system load correlates to the amount of peers connected to each other. The information is retrieved
via an API call and not via the system log and /var/log/messages. This is due to
the fact that the data structure that contains this information actually contains two
lists, one which contains all the peers that are on the same network and one list of
the peers that are actually connected. And since it is the latter of the two lists that
are actually interesting and the most convenient way to fetch that list is via an API
call, we chose that way to extract it.
The third and last source of information are the Event2 system that Axis has developed for the A1001 product. The Event Sniffer subscribes to every event that are
generated by the unit that the Event Sniffer is operating on. This means that events
that are generated by other A1001 units, connected with the A1001 unit running
the Event Sniffer, are not logged. Every event has a source tag with a mac address,
36
which indicates where the event are from and can therefore easily be filtered out
by just comparing that mac address to the address of the A1001 that received the
event.
3.2.3
Data Filtering
To avoid the Event Sniffer to log an unnecessary amount of data, we implemented
a log filter to filter out information that is not of interest. Depending on what type
of information are about to be logged, the log filter behaves differently.
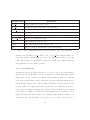
Information Tag
Characteristics
EVENT2
Information from the Event2 system implemented at Axis
SYSTEM USAGE
Information about the system in general
PROCESS USAGE
Process specific information
SYSLOG EVENT
Information parsed from the syslog
ACCESS TIME
A specific category used when measuring access time on the A1001
PROCESS CRASHED
Information involving a crashed process
Table 3: The different categories the log filter use to filter information
To specify for the log filter what kind of information that should be logged one
of the information tags from Table 3 are sent in to the log filter. Depending on what
type of information is about to be logged, necessary information is sent into the log
filter as well, for example, when logging information about a certain process, the
CPU utilization and the memory utilization is passed to the log filter, along with
the information tag. If these two values are over a certain threshold, specified at
compile time in the Event Sniffer, the information is seen as relevant and is passed
on to the ring buffer.
Every time something is logged, the log filter also check another criteria. This
criteria exists for some of the above mentioned categories and could for example be
if the memory usage of a certain process reaches its highest values since the Event
37
Sniffer started logging. If this happens, the log filter calls a function that triggers a
snapshot of the ring buffer and, if the compiler flag mentioned in Subsection 3.2.1
is used, a snapshot of the function trace.
The generating of snapshots enables the Event Sniffer to present how the system
behaved during a certain type of malfunctioning or event without risking that the
relevant information stored in the ring buffer being overwritten by new information,
not connected to the malfunction. The snapshots are used during the data mining
process.
3.2.4
Data Storage
Data fulfilling the filtering criteria is then stored inside a ring buffer. As mentioned
earlier, this ring buffer is a circular sqlite3 database that start writing the first log
entry at the top, and when it reaches the end of the database, it resets its writing
to the top again. This saves space and keeps the ring buffer up to date on what is
happening with the A1001 during runtime. The ring buffer consists of two tables.
One for system performance information and one for Event2 information. These two
were split up because the information that is stored was simply too different to be
able to store in the same table. To be able to relate Event2 information and system
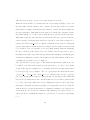
performance information, a timestamp is added to each log entry. An example of
one of the tables is presented in Figure 4.
The reason why we chose to implementing the ring buffer as a sqlite3 database
was that it enables an easy way to extract information. You can easily do searches
with criteria like process name or which kind of information tag a certain log entry
has. It is also convenient because of the easy way to extract .csv files from a SQLite
file, which is one of the file types that the data mining tool Rapidminer support.
Every log entry has two identification numbers. The first one identifies where in the
ring buffer the log entry is placed, the Row id. The Row id can only take a value
between 1 and the length of the ring buffer and is calculated by a modulus operation
38
Column name
Description
Log id
Unique number for each log entry
Row id
A number between 1-[length of the ring buffer]
Time stamp
Time when the information was logged
Credentials
The amount of credentials existing in the system when the logged occurred
Peers
The number of A1001 units connected
Process name
Which process that was logged
CPU
CPU utilization of the process
kbytes
Size of the memory map of the process
pss
The process proportional share of the memory map
Table 4: The column names in the system performance part of the ring buffer
with the other identifier, Log id. The second one, Log id is a unique number for
each entry which is incremented by one for each entry that is added to the ring
buffer. The length of the ring buffer is defined at compile time. During this thesis
the length has been set to 100 log entries.
3.2.5
Data Retrieved
As mentioned in the previous subsection, to be able to save logged data during a
critical event, the Event Sniffer generates a snapshot of both the ring buffer and the
function trace at the occurrence of a critical event. It is then possible to go back and
see how the system behaved, what events where generated and which functions were
called until the critical event occurred. What determines a critical event is decided
by the log filter. It compares predefined parameters to the data that are about to
get logged to determine if it satisfies the criteria of being a critical event. A critical
event could for example occur when the CPU utilization for a certain process is
high at the same time as the number of credentials registered at the A1001 is over
a particular value, when the time to get access to a door is more than expected or
39
when the memory usage of a process reaches an unforeseen peak.
What the Event Sniffer does during such an event is that it simply copies both
the ring buffer and the function trace output. It then gives them a new name
that includes a number that indicates the number of times the Event Sniffer has
generated snapshots. That number is the same for both the trace snapshot and the
ring buffer snapshot to be able to know which files were generated at the same time.
This number plus the date and time from when the files were generated and also
a short message describing what caused the generation of the files is written to a
separate file called dump reason.txt. This is a useful file if it is desired to hand pick
generated files with a certain criteria. For example, when looking at a memory leak
for a certain process, one can just look for every dump message that says “Dumping
file due to memory peak reached of process: xxxxxx” and use those files to try to
find what is the leak’s cause. This was especially useful during the data mining part
of this thesis, making it possible to know which generated files that most likely were
containing the bug that we were looking for.
Since the amount of storage space on the A1001 is rather limited (this is the case
for almost every embedded system) a script was made to be able to periodically
download the generated snapshots to a workstation PC. It is a script that is issued
by a Cronjob [32] every 5 minutes. The job copies all the files that has the name
“snapshot *” , “trace *” and “dump reason.txt” with the help of secure copy (scp)
[37]. Scp copies files from a target to a host, in this case the target is the A1001 and
the host is a workstation PC. Since the file transfer is done via ssh, a password had
to be fed to the script. This was solved by making the script an expect [38] script
that issues commands via spawn [39]. Expect is a script that can set up a dialogue
with another process and spawn issues a command by making a new child process
and let that process execute the command. After this step, the data is ready to be
either presented for manual investigation or prepared to be used in a data mining
tool.
40
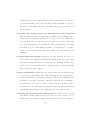
3.2.6
The Presentation of Data
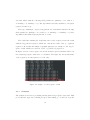
The database snapshots that is collected and stored at a PC can be viewed manually using SQLite and SQLite-commands. SQLite makes it possible to sort data and
only extract data that you are interested in. The “dump reason.txt” file makes it
possible to sort and collect all the snapshots that were created by the same reason,
e.g. collect all snapshots that was created due to a memory increase in a specific
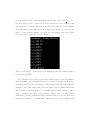
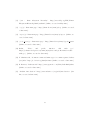
process. An example of how a snapshot of the system performance looks like when
Figure 5: The table system performance from a snapshot of the ring buffer
it has been sorted by log id and extracted with sqlite3 can be seen in figure 5. The
figure shows the logging of two processes together with the overall system performance.
The snapshots of the function tracer that is also collected from the A1001 can be
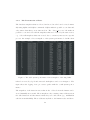
viewed manually as a text file. These snapshots only contains pointer addresses from
the called function and the function that they were called from (e.g. 0xAF87F34
called from 0x43A3AE9). These addresses say little to the human reader and there41
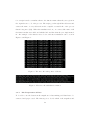
fore a script is used to translate them to the function names that they were given in
the original source code of the process. The script goes through all the addresses and
extract the name of every address from the compiled executable file of the process
that is being traced [40]. When the translation is done, one can read the name of all
the functions that was called and which C file and line that they are implemented
in. An example of the function trace before and after translation can be seen in
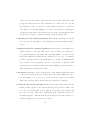
Figure 6 and Figure 7.
Figure 6: The trace file with pointer addresses
Figure 7: The trace file with function names
3.2.7
The Preparation of Data
To be able to use the data from the snapshots for data mining, said data has to be
extracted and preprocessed. The first step is to decide which of the snapshots and
42
which of the data in the snapshots that are interesting for the purpose of the specific
data mining task. This step corresponds to Step 2 in the process of data mining (see
Subsection 2.5.3). For example, if the target of the data mining is to find patterns of
events that occur when a process crashed, it is desirable to only choose the snapshots
that were created for this reason (filtered from the dump reason file). For this task
the performance data and event meta-data are not interesting and therefore only
the event numbers should be extracted from the chosen snapshots. Another aspect
when choosing the data is to consider how long history of data from each snapshot
that should be included in the data mining. In the case of data mining the function
traces e.g. the function trace history can be several thousands of function calls
long, but to increase the accuracy it might be desirable to just include some of the
hundred latest function calls.
The only cleaning and preparation of data corresponding to Step 3 in the process of
data mining, was to remove snapshots that in some way were corrupted. No missing
values were present in the collected data.
The next step after the selection of data is to parse the data to fit the data mining
tool, and different mining algorithms in the tool also has different prerequisites on
the input format of the data. This corresponds to Step 4 in the process. The process
in this thesis differs from the process described in the Subsection 2.5.3, because to
know the exact input format needed the algorithm has to be chosen first. Different
algorithms require different input format and therefore Step 5 & 6 from the data
mining process have to be completed first. Step 5 & 6 are described in the section
“The Mining of Data” below. The basic format for all the data that should be
imported is that it should be on comma separated vector format (CSV) [41]. To
simplify the setup in the tool, all the imported data from the snapshots should be
merged into the same file where a special id-field is used to identify the snapshots
inside the tool. All this parsing of the data is made on the PC with the help of
customized scripts. The script goes through all the snapshots that are collected. If
43
needed, it filters out the wanted snapshots with the help of the “dump reason.txt”
file. It is then possible to extract the specified attributes from the snapshots and
write them into a CSV file. Every line is labeled with a unique id for the snapshot
and a timestamp for the attribute(s). The scripts can be modified to read a specific
history of data from the snapshot or read all of it. An example of the merged CSV
file created by the script can be seen in Figure 8.
Figure 8: The merged .cvs file used for data mininig presented in a format adjusted
for the GSP algorithm
The data that is parsed into a specific CSV format is imported into RapidMiner.
Inside RapidMiner, the data is transformed a second time depending on which algorithm that is used. For the experiments of this thesis the GSP (General Sequential
Pattern) is used. GSP cannot take polynomial values, only binominal. This means
that each line in the CVS file has to be translated from text information to information containing only values of true and false. This is done by creating a table
with all the events as columns and all the transactions in order as rows. If the first
transaction contains e.g. event E12, this column will be set to true for that row (all
44
other set to false). RapidMiner has a built in tool called Nominal to Binominal that
converts the data into this format. Instead of each line containing e.g. a function
call, it now contains a line with all the available function calls in the file but all the
other fields are set to false, except the field with the original function of that line,
that is set to true. After this step the preprocessing of the data is finished and it is
possible to interpret by the data with the mining algorithm.
3.2.8
The Mining of Data
To know how to approach the data mining, the first step is to get an understanding
of the application and determine the goals. The overall goal in this thesis is to use
the log data from the Event Sniffer to identify bugs/problems. As discussed earlier
in the report and presented in the related work (see Section 1.4), the mining will
be applied on both snapshots containing a problem/bug (bad logs) and snapshots
where the problem/bug has not appeared (good logs). The target with this approach
is to remove the results from the good logs from the result from the bad logs and
thereby be able to pinpoint the cause of the problem.
The next step after the data is collected is to choose a specific data mining class.
As in the related work and based on research in the area of data mining, we decided
to use association rule mining to analyze the data to find patterns. This step corresponds to step 5 in the process of data mining. RapidMiner already implements
algorithms to do association rule mining. The first one is closely related to the
Apriori algorithm and is composed by two functions called FP-growth and Create
Association rules. These two blocks together count all the frequent item sets in the
data and creates association rules of them. The second implemented algorithm is
the GSP algorithm that finds frequent sequences in the data. We decided to use the
GSP algorithm, because it takes the order of which the events happen into account.
The first algorithm would not take the order and time into account and can create
patterns of events spread far in time and order.
45
Our RapidMiner setup consisted of four parts. Part 1 & 2 are the import of the
CSV formatted data and binominal preprocessing respectively. The third part is
the actual data mining algorithm that is going to be executed on the data. The
fourth part is used by RapidMiner to output the result of the mining to a file on
the workstation.
GSP has four different parameters that can be set to configure the algorithm. The
first parameter is the minimum support that is discussed in the data mining approach section. The second parameter is the windows size, the third represents the
max gap and the fourth is the min gap, these parameters are discussed in the data
mining approach and are set with empirical tuning. Min gap, is always set to 0,
since it denotes the minimum separation between events, and we do not want to
ignore events that are close to each other in time.
The mining of the snapshots from bad/good runs are preprocessed and mined separately and the result is written on two different files that can be used for further
analysis.
3.2.9
The Evaluation of the Mined Data
The result of the mining process are two generated files. One contains sequences
from runs where the system behaved as intended, i.e. good, and the second contains
sequences from runs where the system has behaved incorrectly, i.e. bad. Before
anything is done with the files they are processed to remove characters added by
RapidMiner that could potentially make two identical sequences look different. In
order to find all the unique sequences that exist among the bad sequences we prepared an awk script [42] to remove all duplicate sequences existing among both the
bad and the good sequences. The script is executed with the following command
line:
awk −f d e l . awk p a r s e d g o o d . t x t p a r s e d b a d . t x t > t h e b u g p a t t e r n . t x t .
46
Figure 9: A flowchart overview of the Data Mining process
The script simply prints all the unique lines from the second input file, in this case
parsed bad.txt. Each line in the input files contains one sequence. Now the bug
pattern candidates have been extracted and we are ready for applying the knowledge
gained from the data mining to the problem that was the reason to perform the data
mining.
47
4
Experimental Results
The following section describes the tests that we completed during the work of this
thesis. Three test cases will be presented to evaluate the Event Sniffer and the data
mining process, to see if the tool can unveil new knowledge and find potential bug
patterns. For every test case, we will explain the purpose of the setup and how the
test was executed. The result and comments of each test is shown at the end of each
subsection.
4.1
4.1.1
Test 1 - Finding Deployed Bug
Purpose
The purpose of this test is to evaluate the logging of the Event2 communication on
the PACS system and to see if the data mining procedure can find a specific sequence
of events that triggers a deployed bug on the system. In this case, the pattern of
events that triggers the deployed bug is known. This allow us to directly check if
the results of the data mining process are satisfying and if the process is able to find
the deployed bug. To trigger events on the system, an automatic testbed is used to
simulate random I/O inputs, such as swiping card and entering the pin code.
4.1.2
Setup
This test was setup with one A1001 unit that contained one user credential with a
specific card number and corresponding pin code. The A1001 will respond differently if the input matches that credentials card number/pin or if it is invalid. To
automate the process of the input, an Arduino [43] is setup and connected to the
A1001’s I/O pins. The Arduino is a microcontroller with surrounding hardware,
which has an ethernet port and multiple I/O pins that can be used to send signals
to the A1001. The Arduino is connected via ethernet to the workstation and hosts a
web socket that can receive commands from the workstation. We generated random
48
commands from the workstation with a python scrip. In turn, the Arduino translates them into I/O signals to the A1001. The python script creates a web socket
connection to the Arduino and sends random commands from a pre-determined set
of commands. The script generates commands that are specified in Table 1 on page
22, which are the standard input commands for the A1001. There is also a random
time delay between every command that affects the PACS system in different ways.
For example if the credentials card is swept with the correct pin entered, access will
be granted by the PACS system. But if the door is not opened within a period of
time, the access will time out and create other events on the system. An overview
of the setup is illustrated in Figure 10.
The Event Sniffer is running in a standard way, logging both events and perfor-
Figure 10: Setup of the test [18]
mance data. To deploy the bug, a state machine is added to the filter that is looking
for a specific sequence of events. If that exact sequence of events is experienced, a
last fake event is generated and logged to trigger the bug. Then, the Event Sniffer
detects the sequence and creates a snapshot of the sequence. This snapshot is the
part of the bad logs in the data mining process. To create the good logs without
the bug pattern, the same test and setup is executed without the state machine in
49
the Event Sniffer and no fake events are created.
We use the GSP algorithm with the parameters shown in Table 5 and Table 6.
Minimum Support:
0.9
Window Size:
4
Maximum Gap:
4
Minimum Gap:
0
Table 5: GSP parameters for the good logs during Test 1
Minimum Support:
0.3
Window Size:
4
Maximum Gap:
4
Minimum Gap:
0
Table 6: GSP parameters for the bad logs during Test 1
4.1.3
Execution
The test was executed twice, in both cases over a twelve hour period. In the first
run the Event Sniffer triggers if the bug sequence appears and in the second nothing
happened if the bug sequence was experienced. Both runs created roughly 2500
snapshots caused by the experiment randomness. All the snapshots from the run
that were created due to the bug patterns were collected, processed and data mined
for patterns. From the run without the deployed bug, all the snapshots were collected, processed and data mined to find as many “good” patterns as possible that
could be removed from the patterns in the bad snapshots.
4.1.4
Result
We experimented with different parameters in the data mining algorithm and with
different length of event history. The logs containing the deployed bug pattern
50
was data mined with the following GSP parameters: (minSup = 0.9, window =
4, maxGap = 4, minGap = 0.) The algorithm found 409 candidates of frequent
sequence in these logs.
The logs containing no deployed bug pattern were data mined with the following
GSP parameters: (minSup = 0.3, window = 4, maxGap = 3, minGap = 0.) The
algorithm found 81000 frequent patterns of events.
The result after running the script that removes the sequences from the result
with the bug pattern sequences, which also exist in the result of the good pattern
sequences, shows that 160 unique sequential patterns were unique for the bug sequence result, which is a reduction of 61% of possible bug sequences.
In Figure 11 some of the sequence are shown and the sequences marked with red is
the actual bug sequence that was to be identified. The figure also shows that many
of the sequences are subsequences of each other.
Figure 11: Sample of event sequence result
4.1.5
Comment
The result from test 1 were promising and the planted bug sequence was found. This
proves that the approach of finding a bug by data mining good- and bad- logs and
51
then remove the common sequences from the bad sequences worked. An interesting
aspect of the final result is that 61% of the sequences contains the event E998 that
is unique for the bad logs.
To remove more sequences from the bug sequence log, we lowered the minimum
support of the GSP mining of the good logs without the bug sequence. This led to
an increased execution time of the algorithm and we stopped at minSup=0.3 with
81000 sequences found (as in the final result). This can be compared with a test
were the good logs were mined with minSup=0.7, in this case 6000 sequences were
found and after removing these from the bad sequences there were 270 sequences
left. Compared with the final result, which had a magnitude of more good sequences,
this removed half of the potential bug sequences, from 270 to 160.
Another interesting thing to notice is that the entire deployed bug sequences only
appeared when the maxGap and window size was increased. Even though this
sequence appear in the exact order in all the logs, both maxGap and window size
had to be set to 4 to find it.
4.2
4.2.1
Test 2 - Bad Access Time
Purpose
This test was setup to let the Event Sniffer run in a standard way and with the same
physical setup as in Test 1. The Event Sniffer measures the time it takes to grant
access on the PACS system and creates a snapshot if that time exceeds a specific
threshold. For this test the threshold that determine if an access attempt is too
long was set to zero to log all the access attempts.
4.2.2
Setup
The setup of this test is basically the same as for Test 1. The difference here was
that no events were planted. The system was simply observed in an untouched state.
52
4.2.3
Execution
The execution of this test was done at the same time as Test 1 and the snapshots
that were created due to a successful access attempt with long access time were
collected.
4.2.4
Result
Approximately 5000 snapshots were generated and the data mining process did not
provide any useful insight.
4.2.5
Comment
This test never came to the phase of the actual data mining. In the first steps of
the process of data mining we discovered that the data that was collected from the
Event Sniffer would not be sufficient or give the information needed. One approach
that was considered but not implemented was to function trace all the processes.
These function traces could have been data mined, to extract some knowledge. The
problem with this approach is that it is very time consuming to recompile all the
processes on the A1001 and the amount of data collected would have been huge.
That kind of extensive function tracing would probably take a lot of computing
power and therefore cause even worse performance.
4.3
4.3.1
Test 3 - Finding Memory Leak
Purpose
The purpose of this test is to evaluate the Event Sniffer and the data mining process
to determine its ability to find the source behind memory leaks in a certain process.
The test aims to find sequences of function calls to be able to isolate which functions
cause the memory leak.
53
4.3.2
Setup
During this test, the setup was the following: three A1001 units were connected to
each other. We performed the test on one of these units, where the process that
was investigated was compiled with the flag “-finstrument-functions”, to enable
function call logs. The Event Sniffer was changed to only generate function trace
and ring buffer snapshots if the process under investigation reached a new peak
of its memory usage. To stress the memory usage of the process under test, we
performed an automatic test that added new credentials and checked the access
rights of the credentials. Credentials are a type of information encoding that a
certain user registered on the system should have this particular access rights. In
RapidMiner the GSP algorithm was used and had the setup seen in Table 7 and
Table 8.
Minimum Support:
0.43
Window Size:
2
Maximum Gap:
2
Minimum Gap:
0
Table 7: GSP parameters for the good logs during Test 3
Minimum Support:
0.51
Window Size:
2
Maximum Gap:
2
Minimum Gap:
0
Table 8: GSP parameters for the bad logs during Test 3
4.3.3
Execution
The automatic test was executed during three days to make sure that we had enough
data to be able to perform the data mining process and to be able to see tendencies
54
of memory increase over time. To split the function traces into good and bad logs
the first 300 function calls were extracted from each file and placed into a good log.
The 300 last function calls, which were the 300 most recent function calls during the
time the memory increase occurred, were extracted and placed into a bad log. Both
the logs were then formatted to the format mentioned in the Mining of Data section,
and processed by RapidMiner with the parameters stated in the setup section above.
4.3.4
Result
After experimenting with different parameters in the data mining algorithm and
with different length of event history, the final result shows that the logs mined with
the following GSP parameters (minSup = 0.43, window = 2, maxGap = 2, minGap
= 0.) contained 1927 frequent sequences that could be the cause of the memory
leak.
The logs of function traces that were from periods when there were no increase of
memory useage were data mined with the following GSP parameters (minSup =
0.51, window = 2, maxGap = 2, minGap = 0.) and had 260000 frequent sequences.
After running the script that removes the sequences from the result with the bug
pattern sequences, when they also appear in the result of the good pattern sequences,
the result are 1081 sequential patterns that are unique for the trace log from when
the memory increased. This is a reduction of 44% of possible sequences that one
should check to find the bug.
In Figure 12, a sample of the final result is shown as an illustration of the result.
55
Figure 12: Sample of function trace result
4.3.5
Comment
This test was made without any knowledge of what was causing the memory of the
process to increase. There was no prior knowledge of the exact structure of the
functions being called in the process or how many different functions that would be
traced.
In this test there were several arguments for keeping the minimum support of the
GSP low. There might be more than one memory leak which has different function
traces and there can be other things happening in the process that increase the
memory usage without being an error.
The result of this data mining gave 1100 sequences that could be the cause of the
memory leak. Without any knowledge about the process, the amount of sequences
makes it hard to locate the problem. But this information could still be useful for
a developer since it is possible to go through the sequences to see if there is any
interesting information to be gained.
In this case the minimum support of the GSP minings of the good logs was decreased
as much as possible, to remove as many common patterns from the bad sequences
as possible. We discovered that between two different GSP mining with different
minimum support, the number of sequences found increased from 160000 to 260000.
When these sequences were compared to the sequences from the bad logs, the result
with 260000 sequences could only remove 4 more sequences compared to the result
with 160000. When viewing the logs manually, it was found that a large amount of
56
the additional sequences were much longer than the sequences in the bad result and
therefore did not improve the result.
57
5
Conclusion
In this thesis we have thoroughly explored different sources of information about
the condition of an embedded device running a Linux operating system. We have
also investigated how it is possible to apply the theory of data mining to analyze
logs obtained on a complex distributed system composed of different interacting
components. An Event Sniffer has been implemented to be able to gather all this
information with limited overhead. When data was gathered we applied similar
data mining techniques as done with the Dustminer tool (mentioned in Section 1.4)
to be able to find unique fault sequences, extracted from the data mining process,
that only existed in the logs of when a bad behavior was experienced on the system
under test.
The Event Sniffer that we developed to monitor the A1001, proves that it is possible
to extract and log information from embedded devices based on Linux systems. We
also integrated the Event Sniffer with the A1001 system and we gathered information
that were specific for the access system in use at Axis. Our results show that it
is possible to find bugs by identifying sequences that cause failures. We have also
shown with this thesis that it is possible to isolate which function that could contain
and trigger a fault, such as a memory leak.
5.1
Discussion
Overall, we believe that the Event Sniffer and the application of data mining to bug
detection was successful. We did not perform any particular performance test of our
Event Sniffer. However, we occasionally observed the CPU load of the Event Sniffer.
There, we never saw any significant load. Also, during the test phase of this thesis,
we stressed the Event Sniffer for weeks at a time and it never crashed during any of
these tests. One of the main issues with the proposed solution is its sensitivity to
the mining parameters. Indeed, one of the largest challenges when data mining for
bug patterns has been to know which parameters to use for the data mining algo58
rithm. In our case the GSP algorithm was able to detect the known bug pattern for
the first test, but we knew what we were looking for beforehand and could adjust
the parameters until that exact sequence was found. On the other hand, several
subsequences of the actual bug could be found without having the best parameter
vector and in many cases this would probably be enough to locate the problem.
Another issue with the parameter choice was that for some settings the algorithm
found too many sequences and the execution time increased. When we lowered the
minimum support of one test by 0.01, the execution time of the GSP algorithm
increased from minutes to six days without finding the result.
Another thing we saw in every result we got from our data mining process was that
a lot of the sequences were subsequences of other each, so it would be interesting to
filter out unnecessary information.
Also, it was hard to understand what determines bad behavior and what levels of
different measurements is the most appropriate for the specific test. For example,
what is high CPU load or how long can an access attempt be before it is perceived
as too long?
5.2
Future Work
There are some improvements that would be beneficial for the developed tool. Since
we put our focus on the data mining the time was not enough to stress test the
Event Sniffer. Also, adding more feature to the Event Sniffer would make it more
valuable as a logging tool, such as making it possible to change parameters inside
the Event Sniffer during runtime instead of being forced to recompile.
If we were to continue developing our data mining process we would make the data
processing part more automated. At the moment, one has to execute these scripts
manually and know in which order they should be executed. We would probably
also try to execute our data mining algorithm with more computation power, to
59
be able to use more data and by that receiving more sequence which then could
potentially improve our results.
A customized GSP algorithm more suited for our purpose would also be something
that we would try to implement for the continuation of this project.
60
References
[1] “What is jtag and how can i make use of it?.” http://www.xjtag.com/supportjtag/what-is-jtag.php. [Online; accessed 17-June-2015].
[2] SIGSOFT ’83: Proceedings of the ACM SIGSOFT/SIGPLAN Software Engineering Symposium on High-level Debugging, (New York, NY, USA), ACM,
1983.
[3] U. M. Fayyad, G. Piatetsky-Shapiro, and P. Smyth, “Advances in knowledge
discovery and data mining,” ch. From Data Mining to Knowledge Discovery: An
Overview, pp. 1–34, Menlo Park, CA, USA: American Association for Artificial
Intelligence, 1996.
[4] D. Lo, H. Cheng, J. Han, S.-C. Khoo, and C. Sun, “Classification of software
behaviors for failure detection: A discriminative pattern mining approach,” in
Proceedings of the 15th ACM SIGKDD International Conference on Knowledge
Discovery and Data Mining, KDD ’09, (New York, NY, USA), pp. 557–566,
ACM, 2009.
[5] S. Han, Y. Dang, S. Ge, D. Zhang, and T. Xie, “Performance debugging in the
large via mining millions of stack traces,” in Proceedings of the 34th International Conference on Software Engineering, ICSE ’12, (Piscataway, NJ, USA),
pp. 145–155, IEEE Press, 2012.
[6] B. Livshits and T. Zimmermann, “Dynamine: Finding common error patterns
by mining software revision histories,” SIGSOFT Softw. Eng. Notes, vol. 30,
pp. 296–305, Sept. 2005.
[7] T. F. Abdelzaher, M. M. H. Khan, H. K. Le, H. Ahmadi, and J. Han, “Data
mining for diagnostic debugging in sensor networks: Preliminary evidence and
lessons learned.,” in KDD Workshop on Knowledge Discovery from Sensor Data
61
(M. M. Gaber, R. R. Vatsavai, O. A. Omitaomu, J. Gama, N. V. Chawla, and
A. R. Ganguly, eds.), vol. 5840 of Lecture Notes in Computer Science, pp. 1–24,
Springer, 2008.
[8] M. M. H. Khan, H. K. Le, H. Ahmadi, T. F. Abdelzaher, and J. Han, “Dustminer: Troubleshooting interactive complexity bugs in sensor networks,” in
Proceedings of the 6th ACM Conference on Embedded Network Sensor Systems,
SenSys ’08, (New York, NY, USA), pp. 99–112, ACM, 2008.
[9] M. M. Khan, T. Abdelzaher, J. Han, and H. Ahmadi, “Finding symbolic bug
patterns in sensor networks,” in Proceedings of the 5th IEEE International
Conference on Distributed Computing in Sensor Systems, DCOSS ’09, (Berlin,
Heidelberg), pp. 131–144, Springer-Verlag, 2009.
[10] L. Kefa, “Sequence mining based debugging of wireless sensor networks,” Master’s thesis, University of Tennessee, 2013.
[11] R. Agrawal and R. Srikant, “Fast algorithms for mining association rules in
large databases,” in Proceedings of the 20th International Conference on Very
Large Data Bases, VLDB ’94, (San Francisco, CA, USA), pp. 487–499, Morgan
Kaufmann Publishers Inc., 1994.
[12] P. López Cueva, A. Bertaux, A. Termier, J. F. Méhaut, and M. Santana, “Debugging embedded multimedia application traces through periodic pattern mining,” in Proceedings of the Tenth ACM International Conference on Embedded
Software, EMSOFT ’12, (New York, NY, USA), pp. 13–22, ACM, 2012.
[13] K. Yaghmour, J. Masters, and G. Ben, Building Embedded Linux Systems, 2Nd
Edition. Sebastopol, CA, USA: O’Reilly & Associates, Inc., second ed., 2008.
[14] J. Birnbaum, “The Linux /proc Filesystem as a Programmers’ Tool.”
[15] J. N. S. F. Terrehon Bowden, Bodo Bauer, “The /proc filesystem.”
62
[16] K. G. Shin and P. Ramanathan, “Realtime computing: A new discipline of
computer science and engineering,” in Proceedings of IEEE, Special Issue on
Real-Time Systems, 1994.
[17] H. Kopetz, “Event-triggered versus time-triggered real-time systems,” in Proceedings of the International Workshop on Operating Systems of the 90s and
Beyond, (London, UK, UK), pp. 87–101, Springer-Verlag, 1991.
[18] J. Klauber, “Automatic timing test of physical access control systems.”
http://sam.cs.lth.se/ExjobGetFile?id=704, 2014. [Online; accessed 18-May2015].
[19] “Axis network door controller system.” http://classic.www.axis.com/products/
access control/entry manager/show.htm/. [Online; accessed 25-August-2015].
[20] “The axis a1001.” http://www.psimagazine.co.uk/axis-a1001-network-doorcontroller/. [Online; accessed 25-August-2015].
[21] E.
Selinder,
“System
reliability
testing
of
http://sam.cs.lth.se/ExjobGetFile?id=585, 2013.
an
embedded
[Online;
system.”
accessed 18-
May-2015].
[22] A. L. S. H. S. M. D. Z. Havoc Pennington, Anders Carlsson, “D-bus Specification.” http://dbus.freedesktop.org/doc/dbus-specification.html, 2015. [Online;
accessed 18-May-2015].
[23] J. G. (ed. Nong Ye), Handbook of Data Mining, ch. 10, pp. 247–277. Lawrence
Ealbaum Assoc., 2003.
[24] R. Srikant and R. Agrawal, “Mining sequential patterns: Generalizations and
performance improvements,” in Proceedings of the 5th International Conference
on Extending Database Technology: Advances in Database Technology, EDBT
’96, (London, UK, UK), pp. 3–17, Springer-Verlag, 1996.
63
[25] R. Agrawal, T. Imieliński, and A. Swami, “Mining association rules between
sets of items in large databases,” SIGMOD Rec., vol. 22, pp. 207–216, June
1993.
[26] R. Agrawal and R. Srikant, “Mining sequential patterns,” in Proceedings of the
Eleventh International Conference on Data Engineering, ICDE ’95, (Washington, DC, USA), pp. 3–14, IEEE Computer Society, 1995.
[27] O. Maimon and L. Rokach, Data Mining and Knowledge Discovery Handbook.
Secaucus, NJ, USA: Springer-Verlag New York, Inc., 2005.
[28] I. Guyon and A. Elisseeff, “An introduction to variable and feature selection,”
J. Mach. Learn. Res., vol. 3, pp. 1157–1182, Mar. 2003.
[29] “RapidMiner Studio Manual - rapidminer.” https://rapidminer.com/wpcontent/uploads/2014/10/RapidMiner-v6-user-manual.pdf. [Online; accessed
3-June-2015].
[30] “Daemon Definition.” http://www.linfo.org/daemon.html, 2005. [Online; accessed 25-May-2015].
[31] “About sqlite.” https://www.sqlite.org/about.html. [Online; accessed 25-May2015].
[32] “Cron(8) - linux man page.” http://linux.die.net/man/8/cron. [Online; accessed 26-May-2015].
[33] “Gnu bash.” http://www.gnu.org/software/bash/. [Online; accessed 2-June2015].
[34] “g timeout add() - gnome developer.” https://developer.gnome.org/glib/stable/glibThe-Main-Event-Loop.htmlg-timeout-add. [Online; accessed 26-May-2015].
[35] “GMainContext - gnome developer.” https://developer.gnome.org/glib/stable/glibThe-Main-Event-Loop.htmlGMainContext. [Online; accessed 26-May-2015].
64
[36] “/var
-
linux
filesystem
hierarchy.”
http://www.tldp.org/LDP/Linux-
Filesystem-Hierarchy/html/var.html. [Online; accessed 26-May-2015].
[37] “scp(1) - linux man page.” http://linux.die.net/man/1/scp. [Online; accessed
5-June-2015].
[38] “expect(1) - linux man page.” http://linux.die.net/man/1/expect. [Online; accessed 5-June-2015].
[39] “posix spawn(3) - linux man page.” http://linux.die.net/man/3/posix spawn.
[Online; accessed 5-June-2015].
[40] Balau,
“Trace
and
profile
function
calls
with
gcc.”
https://balau82.wordpress.com/2010/10/06/trace-and-profile-function-callswith-gcc/. [Online; accessed 9-June-2015].
[41] Y. Shafranovich, “Common format and mime type for comma-separated values
(csv) files.” http://tools.ietf.org/html/rfc4180. [Online; accessed 5-June-2015].
[42] B. Barnett, “Awk tutorial.” http://www.grymoire.com/Unix/Awk.html#uh-0.
[Online; accessed 8-June-2015].
[43] “Arduino introduction.” http://www.arduino.cc/en/guide/introduction. [Online; accessed 9-June-2015].
65
Lund University
Department of Automatic Control
Box 118
SE-221 00 Lund Sweden
Document name
MASTER´S THESIS
Date of issue
August 2015
Document Number
ISRN LUTFD2/TFRT--5988--SE
Author(s)
Supervisor
Anton Norell
Oscar Linde
Marcus Johansson, Axis
Rickard Andersson, Axis
Martina Maggio, Dept. of Automatic Control, Lund
University, Sweden
Karl-Erik Årzén, Dept. of Automatic Control, Lund
University, Sweden (examiner)
Sponsoring organization
Title and subtitle
Event Correlated Usage Mapping in an Embedded Linux System - A Data Mining
Approach
Abstract
A software system composed of applications running on embedded devices could be hard to monitor
and debug due to the limited possibilities to extract information about the complex process
interactions. Logging and monitoring the systems behavior help in getting an insight of the system
status. The information gathered can be used for improving the system and helping developers to
understand what caused a malfunctioning behavior. This thesis explores the possibility of
implementing an Event Sniffer that runs on an embedded Linux device and monitors processes and
overall system performance to enable mapping between system usage and load on certain parts of the
system. It also examines the use of data mining to process the large amount of data logged by the
Event Sniffer and with this find frequent sequential patterns that cause a bug to affect the system's
performance. The final prototype of the Event Sniffer logs process cpu usage, memory usage, process
function calls, interprocess communication, system overall performance and other application specific
data. To evaluate the data mining of the logged information a bug pattern was planted in the
interprocess communication, that caused a false malfunctioning. The data mining analysis of the
logged interprocess communication was able to find the planted bug-patterna that caused the false
malfunctioning. A search for a memory leak with the help of data mining was also tested by mining
function calls from a process. This test found sequential patterns that was unique when the memory
increased.
Keywords
Data mining, Generalized Sequential Pattern, Debugging, Embedded Linux, Logging
Classification system and/or index terms (if any)
Supplementary bibliographical information
ISSN and key title
ISBN
0280-5316
Language
Number of pages
English
1-65
Security classification
http://www.control.lth.se/publications/
Recipient’s notes