1
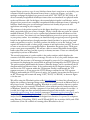
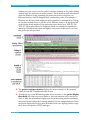
LAB0: GETTING UP TO SPEED
VERSION 1.6.2
Introduction to Wireshark1
Objective
In this lab, the student shall work individually to:
1. Learn about packet sniffers and see how they capture and analyze network traffic.
2. Install Wireshark and start to learn how it works.
Theory: Packet Sniffers
Packet sniffers are a basic tool for observing the messages on a network. As the name
suggests, a packet sniffer captures (“sniffs”) messages being sent/received from/by your
computer; it will also typically store and/or display the contents of the various protocol
fields in these captured messages. A packet sniffer itself is passive. It observes messages
being sent and received by applications and protocols running on your computer, but never
sends packets itself. Similarly, received packets are never explicitly addressed to the packet
sniffer. Instead, a packet sniffer receives a copy of packets that are sent/received from/by
application and protocols executing on your machine.
packet sniffer
application (e.g., browser,
ssh client, skype)
packet
analyzer
application
operating system
Transport (TCP/UDP)
packet
capture
(pcap)
Network (IP)
copy of all Ethernet
frames sent/recieved
Link (Ethernet)
Physical (CAT5, Radio)
to/from network
The figure above shows the structure of a packet sniffer. At the right are the protocols (in
this case, Internet protocols) and applications (such as a web browser or ftp client) that
normally run on your computer. The packet sniffer, shown within the dashed rectangle, is an
addition to the usual software in your computer, and consists of two parts. The packet
1
Substantial amounts of this lab instruction manual are borrowed from “Wireshark Lab: Getting Started”
by Kurose and Ross
PAGE 1 OF 9
LAB0: GETTING UP TO SPEED
VERSION 1.6.2
capture library receives a copy of every link-layer frame that is sent from or received by your
computer. Recall from the discussion from section 1.5 in the text (Figure 1.202) that
messages exchanged by higher layer protocols such as HTTP, FTP, TCP, UDP, DNS, or IP
all are eventually encapsulated in link-layer frames that are transmitted over physical media
such as an Ethernet cable. In the figure, the assumed physical media is an Ethernet, and so
all upper layer protocols are eventually encapsulated within an Ethernet frame. Capturing all
link-layer frames thus gives you all messages sent/received from/by all protocols and
applications executing in your computer.
The existence of the packet capture box in this figure should give you cause to pause and
think, particularly down two trains of thought. Firstly, it shows that any packet in a shared
medium (Ethernet, Wi-Fi, etc) can be captured and examined without notification of the
sender or receiver. You cannot rely on common link-layer protocols to protect your secrets
or your privacy online. At a minimum, you should be using encryption protocols (generally
buried in the application layer, though sometimes found elsewhere) to protect all network
traffic you generate or receive. Secondly, you have the ability to act as the “bad guy” and
capture the network traffic of other people, examine it and exploit what you find. You need
to learn to use this tool in a responsible fashion. Remember the movie quote: “With great
power comes great responsibility!” We will use a filter to ensure Wireshark doesn’t display
traffic other than your own, but this is purely a voluntary measure. Please act ethically and
responsibly in your use of Wireshark.
The second component of a packet sniffer is the packet analyzer, which displays the
contents of all fields within a protocol message. In order to do so, the packet analyzer must
“understand” the structure of all messages exchanged by protocols. For example, suppose we
are interested in displaying the various fields in messages exchanged by the HTTP protocol.
The packet analyzer understands the format of Ethernet frames, and so can identify the IP
datagram within an Ethernet frame. It also understands the IP datagram format, so that it
can extract the TCP segment within the IP datagram. Finally, it understands the TCP
segment structure, so it can extract the HTTP message contained in the TCP segment.
Finally, it understands the HTTP protocol and so, for example, knows that the first bytes of
an HTTP message will contain the string “GET,” “POST,” or “HEAD,” as shown in Figure
2.8 in the text.
We will be using the Wireshark packet sniffer [wireshark.org] for these labs, allowing us to
display the contents of messages being sent/received from/by protocols at different levels of
the protocol stack. (Technically speaking, Wireshark is a packet analyzer that uses a packet
capture library in your computer). Wireshark is a free network protocol analyzer that runs
on Windows, Linux/Unix, and Mac computers. It’s an ideal packet analyzer for our labs – it
is stable, has a large user base and well-documented support that includes a user-guide
(wireshark.org/docs/wsug_html_chunked), man pages (wireshark.org/docs/man-pages), and a
detailed FAQ (wireshark.org/faq.html), rich functionality that includes the capability to
analyze hundreds of protocols, and a well-designed user interface. It operates in computers
using Ethernet, Token-Ring, FDDI, serial (PPP and SLIP), 802.11 wireless LANs, and ATM
connections (if the OS on which it's running allows Wireshark to do so).
PAGE 2 OF 9
LAB0: GETTING UP TO SPEED
VERSION 1.6.2
Procedures
1. Get Wireshark
1. In order to run Wireshark, you will need to have access to a computer that supports
both Wireshark and the libpcap or WinPCap packet capture library. The libpcap
software will be installed for you, if it is not installed within your operating system,
when you install Wireshark.. See wireshark.org/download.html for a list of supported
operating systems and download sites
2. Download the Wireshark binary from wireshark.org/download.html and install it.
Make sure to also download the Wireshark user guide. Mac OS X users might want
examine this guide: josephhall.org/nqb2/index.php/wrshrkinstll. As an alternative to
using X11, Mac OS X users might consider installing the development release (version
1.99.9). The Wireshark development community is working towards a 2.0 release
which will use the Qt user interface library. The real advantage is that you will no
longer need to run an X-Windows server. The drawback to using a development
build is, of course, that it is a development build and may not have full
implementation and is likely to have some latent bugs. Consider carefully, Mac user!
3. The Wireshark FAQ has a number of helpful hints and interesting tidbits of
information, particularly if you have trouble installing or running Wireshark.
4. You may need to disable anti-virus protection software (McAffee, I'm looking at
you!) before your own IP address will show up in captured data.
2. Run Wireshark
1. When you run the Wireshark program, the Wireshark graphical user interface will be
displayed. Initially, no data will be displayed in the various windows.
2. The Wireshark interface has five major components:
1. The command menus are standard pulldown menus located at the top of the
window. Of interest to us now are the File and Capture menus. The File menu
allows you to save captured packet data or open a file containing previously
captured packet data, and exit the Wireshark application. The Capture menu
allows you to begin packet capture.
2. The packet-listing window displays a one-line summary for each packet
captured, including the packet number (assigned by Wireshark; this is not a
packet number contained in any protocol’s header), the time at which the packet
was captured, the packet’s source and destination addresses, the protocol type,
and protocol-specific information contained in the packet. The packet listing can
be sorted according to any of these categories by clicking on a column name. The
protocol type field lists the highest level protocol that sent or received this
packet, i.e., the protocol that is the source or ultimate sink for this packet.
3. The packet-header details window provides details about the packet selected
(highlighted) in the packet listing window. (To select a packet in the packet listing
PAGE 3 OF 9
LAB0: GETTING UP TO SPEED
VERSION 1.6.2
window, place the cursor over the packet’s one-line summary in the packet listing
window and click with the left mouse button.). These details include information
about the Ethernet frame (assuming the packet was sent/receiverd over an
Ethernet interface) and IP datagram that contains this packet. The amount of
Ethernet and IP-layer detail displayed can be expanded or minimized by clicking
on the plus-or-minus boxes to the left of the Ethernet frame or IP datagram line
in the packet details window. If the packet has been carried over TCP or UDP,
TCP or UDP details will also be displayed, which can similarly be expanded or
minimized. Finally, details about the highest level protocol that sent or received
this packet are also provided.
4. The packet-contents window displays the entire contents of the captured
frame, in both ASCII and hexadecimal format.
5. Towards the top of the Wireshark graphical user interface, is the packet display
filter field, into which a protocol name or other information can be entered in
order to filter the information displayed in the packet-listing window (and hence
the packet-header and packet-contents windows). In the example below, we’ll use
the packet-display filter field to have Wireshark hide (not display) packets except
those that correspond to HTTP messages.
PAGE 4 OF 9
LAB0: GETTING UP TO SPEED
VERSION 1.6.2
3. Take Wireshark for a “Test Run”
The best way to learn about any new piece of software is to try it out! Do the following:
1. Start up your favorite web browser, which will display your selected homepage.
2. If you are using a proxy (especially a host-based one), disable it if possible. You want
to examine uncached network traffic.
3. Start up the Wireshark software. You will initially see a window similar to that shown
above, except that no packet data will be displayed in the packet-listing, packetheader, or packet-contents window, since Wireshark has not yet begun capturing
packets.
4. To begin packet capture, select the Capture pull down menu and select Options.
This will cause the “Wireshark: Capture Options” window to be displayed, as shown
below.
5. You can use most of the default values in this window, but uncheck “Hide capture
info dialog” under Display Options. The network interfaces (i.e., the physical
connections) that your computer has to the network will be shown in the Interface
pull down menu at the top of the Capture Options window. In case your computer
has more than one active network interface (e.g., if you have both a wireless and a
PAGE 5 OF 9
LAB0: GETTING UP TO SPEED
VERSION 1.6.2
wired Ethernet connection), you will need to select an interface that is being used to
send and receive packets. After selecting the network interface (or using the default
interface chosen by Wireshark), click Start. Packet capture will now begin - all
packets visible to your network interface (including those being sent/received from/
by your computer) are now being captured by Wireshark!
6. Once you begin packet capture, a packet capture summary window will appear. This
is the window that you decided not to hide in the previous step. This window
summarizes the number of packets of various types that are being captured, and
(importantly!) contains the Stop button that will allow you to stop packet capture.
Don’t stop packet capture yet.
7. While Wireshark is running, enter the URL http://www.ece.cmu.edu/~ini740/Lab0/
lab0.html (Those are three zeros, not the letter o) and have that page displayed in
your browser. Make sure to clear your browser cache if you have previously displayed
this webpage -- you want to get it across the internet, not from your cache. In order
to display this page, your browser will contact the HTTP server at www.ece.cmu.edu
and exchange HTTP messages with the server in order to download this page, as
discussed in section 2.2 of the text. The Ethernet frames containing these HTTP
messages will be captured by Wireshark.
8. After your browser has displayed the lab0.html page, stop Wireshark packet capture
by selecting stop in the Wireshark capture window. This will cause the Wireshark
capture window to disappear and the main Wireshark window to display all packets
captured since you began packet capture. The main Wireshark window should now
look similar to the figure on page 3. You now have live packet data that contains all
protocol messages exchanged between your computer and other network entities!
The HTTP message exchanges with the www.ece.cmu.edu web server should appear
somewhere in the listing of packets captured. But there will be many other types of
packets displayed as well (see, e.g., the many different protocol types shown in the
PAGE 6 OF 9
LAB0: GETTING UP TO SPEED
VERSION 1.6.2
Protocol column in Figure 2). Even though the only action you took was to
download a web page, there were evidently many other protocols running on your
computer that are unseen by the user (as well as data sent via various protocols by
other computers on your network). We’ll learn much more about these protocols as
we progress through the text! For now, you should just be aware that there is often
much more going on than “meet’s the eye”!
9. Type in http (all protocol names are in lower case in Wireshark) into the display
filter specification window at the top of the main Wireshark window. Then select
“Apply” in the filter toolbar. This will cause only HTTP message to be displayed in
the packet-listing window. Add the filter ip.src == <your IP address> ||
ip.dst == <your IP address> to filter out traffic that isn’t going to or from your
computer. This will keep other people’s traffic private and get rid of lots of HTTP
exchanges from other computers that you don’t care about. Filters are combined
with C operators. For example, if your IP address is 169.1.19.87, then your filter
should be http && (ip.src == 169.1.19.87 || ip.dst == 169.1.19.87).
10.Select the first http message shown in the packet-listing window. This should be the
HTTP GET
message that was
sent from your
computer to the
www.ece.cmu.edu
HTTP server.2
When you select
the HTTP GET
message, the
Ethernet frame,
IP datagram, TCP
segment, and
HTTP message
header
information will
be displayed in the
packet-header
window.3 By
clicking plus- andminus boxes to the
left side of the
packet details
2
You may have other applications and services running on your computer that use HTTP. In such case,
you'll have to dig through them and figure out which was the first HTTP GET message.
3
Recall that the HTTP GET message that is sent to the www.ece.cmu.edu web server is contained
within a TCP segment, which is contained in an IP datagram, which is encapsulated in an Ethernet
frame. If this process of encapsulation isn’t quite clear yet, review section 1.5 in the text.
PAGE 7 OF 9
LAB0: GETTING UP TO SPEED
VERSION 1.6.2
window, minimize the amount of Frame, Ethernet, Internet Protocol, and
Transmission Control Protocol information displayed. Maximize the amount
information displayed about the HTTP protocol. Your Wireshark display should now
look roughly like this figure. (Note, in particular, the minimized amount of protocol
information for all protocols except HTTP, and the maximized amount of protocol
information for HTTP in the packet-header window).
11.To use Wireshark effectively, you need to learn how to filter the results so you aren’t
wading through too much data. Wireshark uses two different filters, one to filter the
results that get captured and another to filter the results that are displayed.
Unfortunately, both use different languages to specify the filter. You’ve already been
introduced to display filters, which use a C-like set of operators. You can also use a
more English-like term to describe the same operators. For instance, the filter you
used earlier http && (ip.src == 169.1.19.87 || ip.dst == 169.1.19.87)
can also be specified as http and (ip.src eq 169.1.19.87 or ip.dst eq
169.1.19.87). Another powerful operator you should know about is “contains”
which, you might have guessed, does a substring match. The actual values being
combined can come from any of the protocols and any of the protocol fields that
Wireshark knows about (called “dissector” in Wireshark lingo). So, you might search
for HTTP traffic from Macintosh computers with http.user_agent contains
AppleWebKit. Take a look at the Wireshark User Manual, section 6.3-6.5 for more
details about Display filters.
12.The display filter language is also used to define rules that Wireshark uses to assign
colors to particular packets in the user interface. Take a look in Chapter 10.3 of the
Wireshark User Guide to learn about coloring rules. Using the captured packets,
practice temporary color changes by selecting a packet and then pressing <ctrl> 1,
<ctrl> 2, etc. Also, examine the coloring rules dialog and experiment with defining
permanent coloring rules (you might want to export the default set of coloring rules
before messing around with them).
13.Capture filters are also quite useful. They let you restrict the amount of data you
collect in the first place. Whereas display filters don’t actually change the contents
of the data that Wireshark collects, merely which of the packets that have been
captured are displayed. Capture filters are entered in the “Filter” field of the
“Capture Options” dialog box. The capture language is based on tcpdump and
requires a bit more protocol knowledge to use. For now, simply experiment with
host <ip address> to ensure you don’t capture data from other network users.
14.Exit Wireshark
Congratulations! You’ve now completed setting up an important network engineering tool
and learning a bit about its operation.
Turn-in
The goal of this first lab was primarily to introduce you to Wireshark. The following
questions will demonstrate that you’ve been able to get Wireshark up and running, and have
PAGE 8 OF 9
LAB0: GETTING UP TO SPEED
VERSION 1.6.2
explored some of its capabilities. Answer the following questions, based on your Wireshark
experimentation.
1. List up to 10 different protocols that appear in the protocol column in the unfiltered
packet-listing window in step 7 above. As I don’t have control over the data flowing
over your network at the time of your lab, I don’t know exactly how many and what
protocols those will be. I do expect that you have a bunch (if less than 5, please look
harder). Just list out those that you see, but don’t bother to list more than 10.
2. How long did it take from when the HTTP GET message was sent until the HTTP OK
reply was received? (By default, the value of the Time column in the packet-listing
window is the amount of time, in seconds, since Wireshark tracing began. To display the
Time field in time-of-day format, select the Wireshark View pull down menu, then
select Time Display Format, then select Time-of-day.) Describe where you got the data
to answer this question.
3. What is the Internet address (IP address) of www.ece.cmu.edu? What is the Internet
address of your computer (This might be a private address, if you are behind a NAT
device. No worries, we’ll learn about that later)? Describe where you got the data to
answer this question.
4. How many packets did you capture (total of all protocols, not just HTTP)? Now, use
display filters to determine how many packets contain your ip address (hint: Use ip.addr
instead of the clumsy ip.src or ip.dst format I taught you in Step 8). What is this filter
you used? Now, reverse the filter to determine how many packets don’t contain your ip
address. See any problems here? If not, you've already figured out the point of this
question, so explain how you did so. If so, how can this problem be fixed? What are
the appropriate display filters to use? How does Wireshark warn you of such a problem?
(This is an important detail to remember about Wireshark. Please ensure you've
discussed the problem well enough so that the grader can ensure you explored it
thoroughly.)
5. Explain the difference between the temporary and permanent packet coloring facilities
in Wireshark (in more detail than simply stating that one is temporary). When might
you find yourself using each?
6. List one permanent packet coloring rule you implemented successfully. I hope you
spent a bit of time trying a variety of rules, colors, etc. For purposes of this question,
describe just one of your experiments. What was the intent of the rule? What was the
expression you entered in the dialog?
7. Turn in your answers in a single PDF file and submit it to the Lab0 “Assignment” on
Blackboard. Late submissions will not be graded.
PAGE 9 OF 9