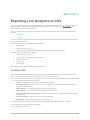
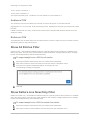
1
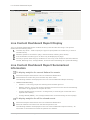
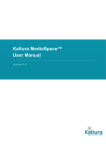
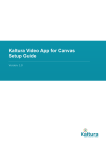
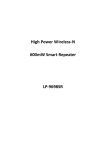
Live Analytics for Kaltura Live Streaming Information Guide Version: Jupiter Kaltura Business Headquarters 250 Park Avenue South, 10th Floor, New York, NY 10003 Tel.: +1 800 871 5224 Copyright © 2015 Kaltura Inc. All Rights Reserved. Designated trademarks and brands are the property of their respective owners. Use of this document constitutes acceptance of the Kaltura Terms of Use and Privacy Policy. Contents Preface .................................................................................................................................................... 4 About this Guide ............................................................................................................................... 4 Audience ........................................................................................................................................... 4 Document Conventions ..................................................................................................................... 4 What type of data is collected, analyzed and presented in aggregated form? ................................. 5 Kaltura Live Analytics Reports .......................................................................................................... 5 Section 2 Live Content Dashboard Report ............................................................................................. 6 Filtering Kaltura Live Analytics .......................................................................................................... 6 Live Content Dashboard Report Display .......................................................................................... 7 Live Content Dashboard Report Summarized Information ............................................................... 7 Refresh Rate ............................................................................................................................... 8 Section 3 Specific Entry for Live Content Detailed Report ..................................................................... 9 Specific Entry for Live Content Detailed Report Summarized Information ..................................... 10 Investigation Reports ...................................................................................................................... 10 Statistics - Summarized Information ......................................................................................... 11 Graph and Map Benchmarks .................................................................................................... 11 Plays VS Audience ................................................................................................................... 11 Live Audience vs. DVR Audience ............................................................................................. 11 Refresh Rate ............................................................................................................................. 12 Section 4 Exporting Live Analytics to CSV ........................................................................................... 13 Location CSV ............................................................................................................................ 13 Audience CSV........................................................................................................................... 14 Referrers CSV........................................................................................................................... 14 Show All Entries Filter ..................................................................................................................... 14 Show Kaltura Live Now Only Filter ................................................................................................. 14 CSV Drill Down Report (for All Viewed Live Entries) ................................................................ 15 CSV Drill Down report (for Kaltura Live Now Only Entries) ...................................................... 15 Verifying and Viewing the CSV Files .............................................................................................. 15 Live Analytics for Kaltura Live Streaming Information Guide 3 Preface This preface contains the following topics: About this Guide Audience Document Conventions About this Guide This guide describes how to use and understand Kaltura Analytics for Live Streaming. NOTE: Please refer to the official and latest product release notes for last-minute updates. Technical support may be obtained directly from: Kaltura Customer Care. Contact Us: Please send your documentation-related comments and feedback or report mistakes to [email protected]. We are committed to improving our documentation and your feedback is important to us. Audience This guide is intended for KMC users that want to configure Live Streaming analytics. Document Conventions Kaltura uses the following admonitions: Note Workflow NOTE: Identifies important information that contains helpful suggestions. Workflow: Provides workflow information. 1. Step 1 2. Step 2 Live Analytics for Kaltura Live Streaming Information Guide 4 SECTION 1 Introduction to Live Analytics Live Streaming Analytics is a management tool that provides powerful information about live streams in a user-friendly KMC interface – informing real-time decision-making through interactive dashboards that visualize trends and track quality metrics for both current and past live events. Includes Status-at-a-Glance: See and share Kaltura Live session utilization and status (what's popular, trending, and going viral, etc.) Assists in Resource Planning: Monitor utilization and plan for the future (increase video engagement, monetization, etc.) Simplifies Troubleshooting: Quickly identify problems / root causes related to live streaming errors (and find solutions) Deployment-wide service intelligence for customer’s Kaltura administrators, IT staff, senior management, etc. Real-time and historical information about Kaltura live events activities and quality metrics, including interactive dashboards to visualize trends such as o real-time information on live events that are taking place right now o detailed information about live events after they have taken place Kaltura Live Analytics enquire those events by presenting audience behavior and live playback characteristics such as the stream bitrate, buffer time or audience geo-locations and others. What type of data is collected, analyzed and presented in aggregated form? The Kaltura Player collects real-time player data about the audience experience for any given viewer watching a “Kaltura Live Streaming” or non Kaltura such as - Universal (Akamai), Flash and mobile / Manual URL/ multicast (RTP) event: Start/Stop of live stream playback (including DVR playback, if available) Buffering time (latency of live stream’s loading time on viewer’s device) Bitrate played (actual quality of live stream sent to the viewer’s device) Geo-IP data (viewer’s city location) Hosting pages (one or more website URLs where the live stream’s player is embedded) The information is captured and analyzed every 10 seconds throughout the duration of a Kaltura Live Streaming event. Data is aggregated and summarized to include measurements of partner’s current live or past live events in the last 36 hours. Kaltura Live Analytics Reports Kaltura Analytics for live streaming include several views to support the different stages and usecases for live events. The following live real-time reports are available: Live Content Dashboard Report Specific Entry for Live Content Detailed Report You can also export your data to a CSV file. See Exporting Kaltura Analytics to a CSV File. Live Analytics for Kaltura Live Streaming Information Guide 5 SECTION 2 Live Content Dashboard Report The Live Content Dashboard Report displays: Currently broadcasting live events (“Kaltura Live Now Only”) Entries that were live in the past 36 hours. (“All Viewed Live Entries”) The following three data elements are presented: Summarized information reflecting ‘All Viewed Live Entries’ or ‘Kaltura Live Now Only’ filtered in the dashboard. Entries that are ‘Kaltura Live Now Only’, where a live session is taking place in real-time. Entries that were live in the past 36 hours: o Entries that were recorded and now have a VOD asset for them. o Entries that were not recorded. o Entries which are currently live and viewed by at least one viewer Kaltura Live Streaming (HDS / HLS / DASH) Other live streaming event types: Universal Streaming, Legacy Flash Streaming [RTMP], or Manual Live Stream URLs You can access the Specific Entry Live Content detailed report (per entry) through the Live Content Dashboard Report, where you can choose an entry to display detailed information about it. To view the Live Content Dashboard Report Select the Analytics tab and then select Live Real-Time Dashboard. Filter the live entries. Select Kaltura Live Now Only or All Viewed Live Entries from the dropdown menu Filtering Kaltura Live Analytics The Live Content Dashboard Report filter is used to select how to display analytics for ‘live now’ entries only, or for all live entries in the past 36 hours. The summarized information that is shown in the report shows information based on the filter. Live Analytics for Kaltura Live Streaming Information Guide 6 Live Content Dashboard Report Live Content Dashboard Report Display The Live Content Dashboard Report contains the entry name and the time range. The report is divided into the following areas: The filter drop down - used to specify the type of report (Kaltura Live Now Only or All Live Viewed Entries). Statistics (audience and DVR or plays, minutes viewed, buffering time, bitrate) A list of filtered live entries (up to 10 items may be displayed per page). An Entry’s specific data: Plays (or Audience for live now), Peak Audience and DVR, Minutes Viewed, Buffering Time, Average Bitrate, First and Last broadcasting time (re-broadcasting). Live Content Dashboard Report Summarized Information To display analytics for current Kaltura live events Select the Analytics tab and then select Live Real-time Dashboard. Select Kaltura Live Now Only from the filter drop down menu. The following statistics are displayed in the Live Content Dashboard Report summary: Kaltura Live Now Only o Audience - how many people are watching the broadcast right now o Minutes viewed – sum of the minutes viewed by all users from the start of broadcasting. Information is aggregated for the past 36 hours. o Average buffering time per minute – average time (in seconds) per minute that users experienced buffering o Average bitrate (KBPS) – the average bitrate users consumed during the event (kbps) To display analytics for all live viewed events Select the Analytics tab and then select Live Real-time Dashboard. Select All Viewed Live Entries from the filter drop down menu. The following statistics are displayed in the Live Content Dashboard report summary. All information is calculated from within the past 36 hour window. Live Analytics for Kaltura Live Streaming Information Guide 7 Live Content Dashboard Report All Viewed Live Entries o Plays (sum of plays on ended streams and plays on ‘live now’ streams) o Minutes viewed – sum of minutes viewed by all users o Average buffering time per minute – average time (in seconds) per minute that users experienced buffering o Average bitrate (KBPS) – the average bitrate users consumed during the event (kbps) Refresh Rate The Live Content Dashboard Report is refreshed with each user action or automatically. If there is no user action, the page content is refreshed every 30 seconds. Live Analytics for Kaltura Live Streaming Information Guide 8 SECTION 3 Specific Entry for Live Content Detailed Report The Specific Entry Live Content Detailed report is a drill down from the Live Content Dashboard Report and presents the following five data elements: Statistics for a specific entry. A graph that shows the views there were in the last 36 hours. A map that shows views in a geographical location, in a specific point in time (available for the last 36 hours). Player - only if the entry is live now or has been recorded. Top 10 referrers list. All information is calculated from within the past 36 hour window. To view the Specific Entry for Live Content Detailed Report Select the Analytics tab and then select Live Real-Time Dashboard. Filter the live entries. Select Kaltura Live Now Only or All Viewed Live Entries from the dropdown menu. Live Analytics for Kaltura Live Streaming Information Guide 9 Specific Entry for Live Content Detailed Report The Specific Entry for Live Content Detailed Report is displayed. Specific Entry for Live Content Detailed Report Summarized Information The report contains the entry name and the time range. The report is divided into five areas. Statistics for both live now and for ended live. (audience or plays, minutes viewed, buffering time, bitrate) Audience Timeline Graph o current live stream (audience in past 36h, showing total viewers per 10 seconds intervals) o past live stream (entire audience since first play till end broadcast, showing total viewers per 10 seconds intervals) Player Preview– displays the live broadcast (on air) content or the VOD content. There may be entries without recordings that display a message that the event was not recorded. Location – shows the audience size in a geographical location at the city level, at a specific point in time (last 36 hours). If you are looking at the map for information about a live or an ended broadcast, a tooltip is displayed showing the name of city and number of audience for the 10 seconds intervals. The user can use the map horizontal scroll thumbnail (or left/right keyboard cursors) to display historical (up to past 36 hours) data. There is also a thumbnail tooltip to help locate a specific time in the past. Top 10 Referrers – a list of URLs that hosted the live stream’s embedded player (sorted by # of visits) Investigation Reports There are 3 different entry types, each has a report: Entries that are ‘live now’, live session is taking place in real-time. o The preview player in this report displays the live session as it is played for the end-user. o The graph displays information for the entire 36 hours. Live Analytics for Kaltura Live Streaming Information Guide 10 Specific Entry for Live Content Detailed Report Entries that were live in the past 36 hours that were recorded and now have a VOD asset for them. o The graph in the investigation screen displays only the recorded section that was saved from the start of broadcast until it ended o The player scrollbar moves simultaneously to right minute of recorded entry, when you click on the audience specific graph dot o The location map scrollbar moves to matching time in full sync, providing interesting snapshot of viewers map for any broadcasting minute. Entries that were live in the past 36 hours and were not recorded. o Graph / location behave like ‘live now’ entry, no player preview. Statistics - Summarized Information Statistics for both current live and past live events (per Partner ID / specific entry) includes: Audience - how many people are watching in real-time (for current live events) Plays - sum of unique plays on past live events. Users who played the content multiple times are eliminated from this count, however, plays that resulted from users who refreshed/re-opened the browser with the player hosting page are counted as new plays Minutes viewed – sum of minutes viewed by all users in aggregate Peak audience and DVR – the maximum number of real-time and DVR viewers combined Buffering time (per minute) – average time that viewers experienced buffering during the entirety of their viewing. (“0” = ideal playback experience, “60” = worse scenario, full buffering usually means bad network conditions) Average bitrate (kbps) – the average bitrate users consumed during the event. Graph and Map Benchmarks For ‘Kaltura Live Now’ entry, both graph and map display information over past 36h. For ended entry, both graph and map display information from start of broadcast as long as it is not exceeded 36h, as currently the maximum given time range is 36h. Both the graph and map display number of audience per time, while total number of ‘circles’ will not exceed 1,000 (cities) per each interval view. Top 1000 “big audience cities” will be shown. (sort by descending audience) Map displays circles by size, and color according to the viewer’s audience/DVR counts and ratio, quick glance allow to differ between interesting population groups, detect trends and overhaul behaviour. Plays VS Audience When a viewer presses “play” on the Kaltura player - it is counted as a play. A play is included in audience analytics only if the content is viewed over 10 seconds. A play represents a viewer “join”, and is therefore counted only once into aggregation. If a viewer refreshed the page, and presses play, it will be considered as a new “join” and therefore a new play. Live Audience vs. DVR Audience The DVR audience (current live stream): viewers watching in real time (but not the live point in time) are presented in separated “DVR” graph audience when the live streaming entry is active The DVR audience (ended live stream): viewers who watched in real time but not the live point in time) are presented in separated “DVR” graph audience (live now) once live stream has ended Live Analytics for Kaltura Live Streaming Information Guide 11 Specific Entry for Live Content Detailed Report “DVR” graph audience will include extended part representing timeline of “DVR” viewers watching the stream after the actual live event stream ended (DVR timeline > recorded stream timeline). Extended part is synchronized with the location map, but not with the player preview. Location Map shows Live and DVR audience with varying colours representing the ratio of “live to DVR” count (the tooltip shows both counts). Refresh Rate The Live Content Detailed Report is refreshed with each action of the user or automatically (in case no action took place) every 30 seconds. Only the statistics are updated. To view the audience at different resolutions Use the scrollbar to view the audience data at different intervals. The point in time in the audience graph is synchronized with the player timeline. This feature is only available for past live broadcasting events that are not rebroadcasted. The time indicates the time interval selected. To preview the broadcast Click on the player. You can see whether the entry is on air. To view the location Zoom into the location for the Geographical IP to location. The location tooltip indicates the number of plays at that location. Use the scroll bars to see snapshots in different time intervals. Live Analytics for Kaltura Live Streaming Information Guide 12 SECTION 4 Exporting Live Analytics to CSV The Live Content Dashboard Report displays all live entries that are from the last 36 hours. You can export Kaltura Analytics live streaming reports to a CSV file. CSV reports can be created on the partner id level or on the entry id level. You can create CSV files based on the filters you have chosen from the Live Content Dashboard Reports. All Entries Live Now You can display analytics from the Live Content Dashboard Report as well as from the Specific Entry for Live Content Report. The filename consists of the following information: Report type Status: All or live-now time range of YYYYMMDD – HHMMSS_Entry ID (for entry level reports) The drill down CSV filename includes: Status: all or live-now Type of Report: location/referrers/audience/ Specific entry id Entry name Time range The CSV structure includes statistics about the entry. Location CSV Aggregation for the location analytics is on the second level descending in time, starting from the point you selected to create the CSV and no more than the last 36 hours. The location CSV report indicates the city and country, the longitude and latitude and aggregated data in 1-minute window with following columns: Plays – contains the sum of plays in that specific minute. Average audience – contains the sum of the audience known in that minute, divided by the number of known events Min audience – the minimal audience known in that minute. Max audience – the maximal known audience in that minute Average, Min, Max DVR Audience – the minimal, maximum and average of DVR audience in that minute Seconds viewed – will be the sum of seconds viewed Buffer time –The average buffer time per minute. The location statistics start from the first point of available data in the past 36 hour interval. The following use case provides an example: 10:30 – plays: 1 audience: 0 Live Analytics for Kaltura Live Streaming Information Guide 13 Exporting Live Analytics to CSV 10:40 – plays: 0 audience: 1 10:50- plays: 0 audience: 1 The report will show plays: 1 audience: 2/3 min audience: 0 max audience: 1 Audience CSV The audience CSV report indicates the number of viewers at specific 10 second intervals. Aggregation is on a 10 second, level descending in time, starting from the point you selected to create the CSV. If DVR is enabled for the entry, another DVR column will be included with similar behavior as in the audience column. Referrers CSV The Referrers CSV includes the list of host sites and the number of visits from the host sites sorted in descending order for the past 36 hours. Show All Entries Filter Export to CSV - downloads all related entries for a specific partner and includes ALL available entry data (entry name, entry id, Plays, Peak Audience, Minutes viewed, Average buffering time, Average bit rate, first broadcast time and last broadcast time). To export analytics to a CSV for all entries Select the Analytics tab and then select Live Real-Time Dashboard. Filter the live entries. Select All Viewed Live Entries from the dropdown menu From the Live Content Dashboard Report, click Export to CSV. The following message is displayed. Click OK. Show Kaltura Live Now Only Filter Kaltura Live Now only - downloads all related entries for a specific partner and includes ALL available entry data (entry name, entry id, Plays, Peak Audience, Min viewed, average buffering time, average bit rate, first broadcast time, last broadcast time). To export analytics to a CSV for actual live entries Select the Analytics tab and then select Live Real-Time Dashboard. Filter the live entries. Select Kaltura Live Now Only from the dropdown menu Live Analytics for Kaltura Live Streaming Information Guide 14 Exporting Live Analytics to CSV From the Live Content Dashboard Report, click Export to CSV. The following message is displayed. Click OK. CSV Drill Down Report (for All Viewed Live Entries) To export analytics to a CSV for a specific entry (including ended broadcasts) Select the Analytics tab and then select Live Real-Time Dashboard. Filter the live entries. Select All Viewed Live Entries from the dropdown menu. Click on Details to display the Specific Entry Detailed Report. Select an option from Export to CSV drop down. Audience - downloads all audience. (This is represented as the sum of views on ended streams and views on ‘live now’ streams for the past 36 hours or from the start of the broadcast, with at least 10 sec interval. Location – downloads one minute intervals (averaging every six “10 second” samples in the one minute interval) including time, total plays, IP to location fields, country, city, latitude and longitude (at the city level). Referrers - downloads ALL (not just top ten) URLs (for the past 36 hours or from the start of broadcast), each referrer contains the URL, the total number of visits sorted by visit totals in ascending order. CSV Drill Down report (for Kaltura Live Now Only Entries) To export analytics to a CSV for a specific entry Select the Analytics tab and then select Live Real-Time Dashboard. Filter the live entries. Select Kaltura Live Now from the dropdown menu. Click on Details to display the Specific Entry Detailed Report. Select an option from Export to CSV drop down. Audience - downloads all audience analytics (for the past 36 hours or from the start of broadcast) with at least a 10 second interval. Location - downloads one min interval (averaging 6 to 10 second samples), including time, total audience, IP to location fields, country, city, latitude and longitude (at the city level). Referrers - downloads URLs (for the past 36 hours or from the start of broadcast), each referrer contains the URN, the total number of visits sorted by visit totals in ascending order. Verifying and Viewing the CSV Files You should receive a notice that your CSV file was created successfully or whether it failed. Kaltura Customer Care will notify you when the file is ready and provide a link to the CSV file location. The Live Analytics for Kaltura Live Streaming Information Guide 15 Exporting Live Analytics to CSV link is valid for three days. Live Analytics for Kaltura Live Streaming Information Guide 16