1
A Wireless Sensor Network Platform for Structural Health Monitoring: enabling
accurate and synchronized measurements through COTS+custom-based design
R. Severino, R. Gomes, M. Alves, P. Sousa, E. Tovar*
L.F. Ramos, R. Aguilar, P.B. Lourenço**
*CISTER Research Unit, Polytechnic Institute of Porto (ISEP-IPP), Portugal; e-mail: {rars,rftg}@isep.ipp.pt).
** ISISE Research Unit, University of Minho, Guimarães, Portugal; e-mail: {raguilar,lramos}@civil.uminho.pt
Abstract: Structural health monitoring has long been identified as a prominent application of Wireless
Sensor Networks (WSNs), as traditional wired-based solutions present some inherent limitations such as
installation/maintenance cost, scalability and visual impact. Nevertheless, there is a lack of ready-to-use
and off-the-shelf WSN technologies that are able to fulfill some most demanding requirements of these
applications, which can span from critical physical infrastructures (e.g. bridges, tunnels, mines, energy
grid) to historical buildings or even industrial machinery and vehicles. Low-power and low-cost yet
extremely sensitive and accurate accelerometer and signal acquisition hardware and stringent time
synchronization of all sensors data are just examples of the requirements imposed by most of these
applications. This paper presents a prototype system for health monitoring of civil engineering structures
that has been jointly conceived by a team of civil, and electrical and computer engineers. It merges the
benefits of standard and off-the-shelf (COTS) hardware and communication technologies with a minimum
set of custom-designed signal acquisition hardware that is mandatory to fulfill all application requirements.
1. INTRODUCTION
Structural Health Monitoring (SHM) and damage
identification at the earliest possible stage have been
receiving increasing attention from the scientific community
and public authorities. Damage identification is relevant to all
engineering fields as service loads and accidental actions may
cause damage to the structural systems (Pines et al., 1997).
Conventional monitoring systems used for these applications
in civil engineering studies involve large number of wires
(copper or fibber-optic cables) and centralized data
acquisition systems with remote connections. As damage is a
local phenomenon and in order to achieve high accuracy, it is
important to monitor the structural behaviour at fine-grained
level. Thus, a sufficiently large number of measuring points
is necessary. The fact that the conventional sensor platforms
use wires increases the cost of the monitoring systems and
creates difficulties in their maintenance and deployment.
Adding to the fact that the cost of traditional wire-based
monitoring systems is driven by the number of sensors, the
installation time and installation costs limit the scale of
deployment of such systems (Lynch et al., 2006). From
experience, the installation time of a structural monitoring
system for bridges and buildings can consume over 75% of
the total testing time, and the installation labour costs can
approach well over 25% of the total system cost (Lynch et
al., 2000). These installation time and device costs can be
greatly reduced via Micro-Electro-Mechanical Systems
(MEMS) based sensors integrated in Wireless Sensors
Networks (WSN). In this line, the recent years have
witnessed an increasing interest in a new technology based on
WSN platforms as a low-cost alternative for being applied in
civil engineering structures (Lynch et al., 2006).
Previous work from the same team (collaboration between
the CISTER and the ISISE research units) focused on a SHM
system strictly based on commercial off-the-shelf (COTS)
technologies. This enabled a preliminarily demonstration of
the applicability of MEMS+WSN-based systems for
operational modal analysis of structures (Aguilar et al.,
2010). Such work allowed identifying three major
limitations: (1) the lack of enough sensitivity of the
acceleration sensors, (2) low resolution of the Analogue-toDigital Converter (ADC) embedded in the WSN platform,
and (3) the lack of synchronization algorithms.
The SHM system illustrated in this paper solves the
limitations from our previous work and blends both the
advantages of using COTS and customized hardware and
software technologies. Importantly, the proposed system
architecture aims not only to respond to the application
scenario under consideration – operational modal analysis of
Civil Engineering structures– but also to other types of
applications where mechanical constructions (e.g. industrial
machinery, vehicles) under stress (natural or induced) require
structural integrity monitoring and/or analysis.
The remainder of this paper is structured as follows. Section
2 presents some related work in this area. Section 3 provides
a system overview, emphasising the underlying application
requirements. Section 4 details the WSN architecture and
related implementation aspects. The hardware platform, with
particular emphasis on the signal acquisition board, is
described in Section 5. In Section 6, a comprehensive
explanation of the application interface with the WSN and the
application scenario is presented, together with a discussion
on the results of the tests carried out to validate the prototype
platform. Finally, Section 7 draws some conclusions and
outlines future work.
2. STATE OF THE ART
SHM has been a very active research area among both
academics and industrialists,, especially in what concerns
recent developments in WSN and Micro Electromechanical
Systems (MEMS) (Lynch et al., 2006).
Nevertheless, existing solutions for SHM using WSNs
present one or more of the following limitations: a) low
sampling resolution (typically 8-12
12 bits systems,
systems which
invalidates SHM based on operational modal analysis);
analysis b) no
explicit synchronization mechanisms between sensing nodes;
c) not relying on standard communications protocols
(commonly they use IEEE 802.15.4-compli
compliant devices that
neither implement the IEEE 802.15.4 medium access control
(MAC) nor ZigBee protocols); d) not building upon de facto
operating systems (OS) for WSNs platforms (e.g. TinyOS,
Contiki); e) not relying on COTS technologies
chnologies (more costcost
effective). Examples of relevant work follow, highlighting
h
some of their limitations.
The system proposed by Xu et al.,, 2004,
200 which was reevaluated by Paek et al., 2005, despite using a reasonable
sampling resolution (16 bits), lacks an explicit
synchronization mechanism between the sensing devices.
The implementation provides a posteriori time correlation of
the samples,, which is not satisfactory for some operational
operation
modal analysis algorithms that require that samples from all
sensors are acquired simultaneously.
processing. The most relevant application requirements were
identified as follows:
−
−
−
−
−
−
−
−
−
−
XYZ accelerometer (triaxial)
Max.. measurement range: ± 1 g
Minimum sensitivity: 1 V/g
Typical resolution: 1 mg
Max. resolution: 50 µg
Frequency response, 3 dB: 0 - 100 Hz
Max. sampling rate: 100
00 Hz
Max. sampling drift between sensors : 10 ms
ADC resolution: 24 bits
0% sample lost during sampling process
Ensuring the correct synchronization of the sensing operation
is of major importance for this kind of monitoring
applications (Xu et al.,, 2004; Lynch et al., 2006; Cinque et
al., 2006; Whelan et al., 2009).. This means that samples from
all sensors must be acquired in a synchronized way in order
for the data analysis algorithms to provide consistent results.
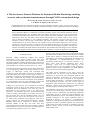
3.2 Snapshot of the System Architecture
The system architecture was designed in
i order to satisfy the
identified application requirements and is illustrated in Fig. 1,
considering a prototype system composed by four Sensing
Nodes. Each Sensing Node is composed by a TelosB node
(Crossbow, 2009) with a signal acquisition board (SAB)
(
attached to a MEMS acceleration sensor (see Section 5).
Researchers at WSU-SL
SL (e.g. G. Hackmann et. Al)
Al proposed
a system based on iMote2 platforms, which may present
some system lifetime limitations due to their
the energy
consumption. Additionally, no strict sensor data
synchronization is supported (forcing to correlate data a
posteriori)) and validation was just based on external stimulus
(not addressing the natural vibration) or on simulation.
Whelan et al., 2009 described an innovative system
composed of twenty sensing nodes deployment in a highway
bridge. Nevertheless, the system uses a non-standard
non
communication stack, and the WSN platform microprocessor
does not run a known OS. Additionally, they provide no
detail on the synchronization mechanism.
Ceriotti et al., 2009 presented a very complete
implementation of a SHM application that allows monitoring
several phenomenon of interest when monitoring heritage
buildings (accelerations,
accelerations, deformation and environmental
parameters). However, the particularities of the system and
its inherent customization level limit its application to a
narrow type of structures. Moreover, the synchronization
mechanism is based on a custom middleware, and takes few
advantages of the native functionalities of the communication
protocol, requiring a constant refreshment and storage of
temporal information in order to maintain time-consistency.
time
3. SYSTEM OVERVIEW
3.1 System Requirements
The aim of the system is to sample in a synchronized
ynchronized fashion
multiple accelerometers placed at different locations in a
structure and forward the data to a central
centra station for later
Fig. 1. Snapshot of the System Architecture
All four Sensing Nodes communicate with a Coordinator
Node (also a TelosB node) via a standard communication
protocol (IEEE 802.15.4). The Coordinator Node supervises
the network and nodes activities (e.g.
(
node configuration,
start/stop sampling)) and guarantees a tight synchronization
between all nodes;; it also forwards the configuration
parameters and dispatches the acquired data to the Command
& Configuration Application (C&C App). The WSN
architecture is described in Section 4.
The Command and Configuration application
applica
(C&C App,
briefly described in Section 6.1)
6.1 provides the system user
with a human-machine
machine interface (HMI) to configure the
system and also an application programming interface (API)
to integrate the WSN system with the data
processing/analysis applications.
application The latter enable to infer
about the reaction of the monitored structure to natural
vibration or impacts,
ts, as outlined in Section 6.2.
4. WSN ARCHITECTURE
As previously stated, the proposed SHM system aims at
sampling several accelerometers placed at different locations
in a structure, in a synchronized fashion. Sampled data is to
be stored in each Sensing Node until it is retrieved by a
central node for processing. To enable the analysis of the
results, namely the modal shape analysis, it is crucial to
guarantee the temporal correctness of the system.
4.1 Guaranteeing Synchronization
According to Cinque et al., 2006, the maximum drift between
samples should be computed as presented in (1):
หܥሺݏ ሻ − ܥ൫ݏ ൯ห ≤
ଵ
ೞ
∀݅ = 1 … ܰ ≠ ݆
(1)
where ܥሺݏ ሻ is the clock of the ݅-th sensor, ܰ is the total
number of sensors and ݂௦ is the sampling frequency.
The existing timers in the TelosB platform depend on a
32.768 Hz Citizen CMR200T quartz crystal (Citizen, 2006).
This crystal features a drift of ±20 ppm in relation to its
nominal frequency. This means that (in the worst-case) there
is a drift of approximately 20 µs at every second.
Assuming a sampling frequency of 100 Hz results in a
sampling period of 10 ms. For keeping the drift bellow
10 ms, according to the application requirements, it will be
necessary to synchronize every 500 s at most. This result
imposes the existence of a synchronization mechanism in the
WSN, so that all nodes have the same time reference.
transmitting a beacon frame announcing the start of the
Superframe (IEEE 802.15 TG4, 2010). Upon beacon
reception, each Sensing Node triggers an external GPIO
(General Purpose Input/Output) pin on its Signal Acquisition
Board (SAB) in order to synchronize it.
4.2 Communication Architecture
The prototype system consists of five TelosB (Fig. 1) nodes.
These hardware platforms feature a TI MSP430 16-bit
microcontroller, a CC2420 RF transceiver (IEEE 802.15.4compliant), 48 kB of Program memory (in-system
reprogrammable flash), 10 kB of EEPROM, two UART
communication ports, and I2C. They also include in-board
light, temperature and humidity sensors, which might be
useful for some SHM application scenarios.
Four nodes act as Sensing Nodes and control the
corresponding SABs, while one node acts as the Coordinator
Node, assuming network management (including network
configuration and synchronization), data collection and
interfacing with the Command and Configuration application
(C&C App). Implementation of the Sensing and Coordinator
Nodes software was done in nesC (Gay et al., 2003) over the
TinyOS operating system (TinyOS, 2010). The open-ZB
implementation of the IEEE 802.15.4 protocol has been used
(MASS, 2007; Open-ZB, 2010).
Fig. 2 presents a message sequence chart of the application:
There already exist some mechanisms to achieve
synchronization in wireless networks. The simplest approach
is to use the Global Positioning System (GPS) as the source
for a universal clock. GPS can provide extremely accurate
timing, but requires special (typically power hungry)
receivers and a clear sky view.
Many of the proposed protocols solve the synchronization
problem
by
transmitting
in-band
synchronization
information. Typically, these involve creating some form of
hierarchical organization and use it to distribute timing
information. There are several in-band time synchronization
schemes in the literature, where some providing good
accuracy are RBS (Elson et al., 2002), TPSN (Ganeriwal et
al., 2003) or FTSP (Maroti et al., 2004). Notably, the work
from Werner-Allen et al., 2005, is the only practical
synchronization strategy that does not require nodes to
construct a hierarchical organization, but it can take an
unbounded number of broadcasts to achieve synchronization.
Another approach to this problem is RT-Link (Rowe et al.,
2006), a TDMA-like protocol that can use an out-of-band
synchronization mechanism, avoiding in-band solutions that
reduce network performance.
The IEEE 802.15.4 protocol provides a standard-based
solution for synchronization (beacon-enabled operation
mode) that fits the application requirements (Section 3.1).
Thus, it has been selected for the WSN communication
infrastructure. A Coordinator node (officially named PAN –
Personal Area Network – Coordinator) schedules channel
access and data transmissions in a messaging structure – the
Superframe. This node is also responsible for periodically
Fig. 2. Message sequence chart
The WSN application commutes between 6 states, as follows:
(1) Idle - As soon as the nodes are powered they enter the
Idle state. At this stage, the open-ZB IEEE 802.15.4 stack is
initiated and the nodes try to synchronize and associate with a
PAN Coordinator. The Channel Scan feature of the protocol
stack is disabled, since the network topology is fixed.
(2) Ready - As soon as every node is synchronized, the user
signals the Coordinator to initiate the Ready state. This is
done by changing the information in the IEEE 802.15.4
beacon payload. Each Sensing node receives the beacon,
parses the payload information and immediately checks the
presence of a SAB. The Coordinator is then signalled by each
node concerning its readiness. Upon the reception of this
message, the Coordinator informs the C&C App about the
state of each node.
(3) Acquiring - When every node is configured, the user can
start the signal acquisition process by sending a command to
the Coordinator that will signal the Sensing Nodes for start
sampling, through a beacon frame. All Sensing Nodes trigger
the SABs and re-synchronize them at every beacon.
(4) Stopped - The user sends a command to the Coordinator
to stop the data acquisition process. Again, the Coordinator
signals the network using its beacon at the beginning of the
next Superframe. All the nodes stop the data acquisition
process when the beacon embedding this command is
received. The sampled data is stored in the SABs memory
until the respective node is polled by the Coordinator.
(5) Transmitting - After signalling the Stop state for the
network, the Coordinator initiates the Transmitting state by
pooling a Sensing Node at a time for data. Every message
payload embeds 8 samples which are relayed to the C&C
App, upon reception by the Coordinator.
(6) Done - All Sensing Nodes signal the Coordinator upon
completion of the Transmit state. When the last Sensing
Node informs the Coordinator that there is no more data to
send, the Coordinator enters the Done state.
from the Coordinator, including sampling rate, period and
time. They also wait for a message to set their behaviour as
active or passive. (3) START – This command triggers the
beginning of the signal acquisition from the accelerometers.
The SABs are synchronized at each beacon and save the
samples in its internal memory. (4) STOP – Upon reception
of this command, Sensing Nodes stop the data acquisition
procedure (command sent to the SABs) and wait for further
instructions. (5) GET <address> - The Coordinator polls each
Sensing node with the GET command, to trigger the
transmission of the sample data stored at the Sensing Nodes
SABs memory. Each Sensing Node checks the address
embedded in the beacon payload. (6) RESET – This
command signals the end of an acquisition cycle. After
receiving this command, a Sensing Node switches to the
Ready state.
All commands are acknowledged by the Coordinator upon
reception at the UART (sent by the C&C App).
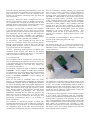
4.4 Sensing Nodes
The Sensing Nodes (Fig. 3) control and synchronize the
acquisition of the SABs, and carry out the acquisition of the
embedded sensors measurements (temperature, humidity,
voltage, luminosity).
4.3 Coordinator node
The Coordinator node is responsible for synchronizing the
network and managing the application. It also serves as a sink
to the sampled data sent by the Sensing Nodes. Such data is
immediately forwarded to the C&C App without any
processing, for later analysis.
The Coordinator supports two types of commands: (1) Board
Commands – used to configure the SABs; these commands
are transmitted to the corresponding node, and then directly
forwarded to the SAB, using regular IEEE 802.15.4 data
frames; (2) Network Commands – used to manage the
monitoring application.
There are two kinds of commands within the former
category: (a) Node Management commands; (b) Application
Management commands. The Node Management commands
are sent to the Sensing Nodes using regular IEEE 802.15.4
data frames during the application Ready state. These include
setting the behaviour of the node (active/passive), remote
reset, channel selection, and requesting onboard sensor
reading (temperature and humidity). The Application
Management commands are sent within the payload of the
IEEE 802.15.4 beacon frames (Fig. 2) so that all nodes
receive and process the command at the same time, thus
guaranteeing synchronization (there is no contention in
beacon transmission).
The commands are described as follows: (1) IDLE, This
command indicates that the system is in Idle state, waiting for
input from the User; (2) READY - It marks the beginning of
the configuration phase for the nodes. When receiving this
command, the Sensing Nodes wait for a configuration packet
Fig. 3. Sensing Node, SAB and accelerometer
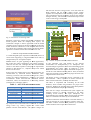
The architecture of a Sensing Node is illustrated in Fig. 4. All
the application as well as the open-ZB stack was developed
in nesC, over TinyOS. Communications with the SAB are
handled using the UART serial interface of the TelosB. Two
additional general purpose input/output (GPIO) pins of the
TelosB are used to enable the synchronization of the SAB
and to control the communication flow.
At the beginning of the application, the Coordinator’s beacon
is set to IDLE. Upon application input, the Coordinator
changes payload to READY signalling all boards. When the
Sensing Node is informed of the beginning of the Ready
state, it will immediately check for the presence of the SAB
using its UART interface. If the SAB responds, the Sensing
Node signals the Coordinator that everything is ready.
Otherwise it will signal the error using an Error Message with
the respective error code. Sensing Nodes are then activated
and configured by the Coordinator.
then derived from this energy source. Note that both the
WSN platform and the SAB’s digital section voltage
regulator are independent of the remaining system voltages.
This arrangement allowed switching on/off all the onboard
analogue circuitry, which enables a substantial improvement
in the overall energy consumption.
Fig. 4. Architecture of a Sensing Node
Sampling is started by sending the START command in the
beacon payload. When the sampling time expires,
expires the
Coordinator changes its beacon payload to send the STOP
command.. Upon reception of the GET command,
command the Sensing
Nodes initiate the transmission of the sampled data stored at
the SAB to the Coordinator Node. Finally, the Sensing Nodes
N
signal the Coordinator that the data transmission is over.
5. SIGNAL ACQUISITION SUB--SYSTEM
A custom-designed
designed signal acquisition board (SAB) had to be
conceived for supporting: a) a high resolution 24-bit ADC; b)
enough memory for storing data samples.
MEMS sensors are quite appealing for WSN applications,
due to their low energy consumption, low voltage operation,
small size and low cost. Although there are several MEMS
sensors in the market capable of satisfying the requirements
outlined in Sub-Section 3.1, complete ready-to-use
ready
COTS
devices are still scarce.
Some of the most suitable devices for these applications are
commercialize by Advanced Sensors Calibration (ASC,
Germany), Crossbow (USA) and Silicon Designs Inc. (USA).
(USA)
Among the referred manufactures’ portfolios, the triaxial
accelerometer model ASC 5631-002 (Advanced Sensors
Calibration, 2009) was identified as an interesting solution
(characteristics outlined in Table 1):
Table 1 – ASC 5631-002
002 characteristics
Range
Sensitivity
Frequency
Linearity
Signal output
Zero output
Supply voltage
Current consumption
Cost
±2 g
1 V/g
100 Hz ±3 dB
±1.0 % FSO
500 mV to 4500 mV (DC)
2500 mV ±100 mV
5 V ±0.1 V
7 mA (max.)
250 Eur + VAT
Fig. 5 depicts the overall architecture of the SAB.
SAB A common
energy source (e.g. battery) supplies the COTS WSN
platform and the SAB hardware. The system voltages are
Fig. 5. Sensor Acquisition Board
oard (SAB) architecture
In this particular case, the outputs of the Triaxial
accelerometer are multiplexed by a 3:1 multiplexer. The
selected analogue signal then crosses the initial buffering and
programmable gain stages. Then,
Then an analogue 8th order
Butterworth filter limits the signal’s maximum frequency to
100 Hz to avoid undesired aliasing effects. Then, the filtered
signal goes through a final conditioning stage and enters into
a high-resolution 24 bits ADC.
The digital circuitry connections (arrows connected to the
microcontroller - MCU) represent
present its relation towards the
MCU internal architecture,, as briefly described next.
next
The MCU is responsible for controlling all the SAB
hardware, which includes the procedures for proper ADC
behaviour, handling the samples storage until WSN platform
request and additional samples pre-formatting.
pre
Note that the voltage converter/inverter (that supplies the
analogue circuitry) is directly connected to the MCU
(enabling on/off control). The input multiplexer, the
programmable gain amplifier (PGA) and the high resolution
ADC are connected to the MCU by several GPIO lines.
The data transmission from the MCU to the flash memory is
achieved through the serial peripheral interface (SPI) bus.
The MCU connects
nnects with the WSN platform by its internal
UART hardware and a couple of two GPIO lines.
lines
6. TEST AND VALIDATION
This section describes how the proposed SHM system (and
the underlying architecture) was tested and validated in a real
application scenario.
accelerometers model PCB 393B12 (PCB, 2009) as well as
the NI-USB9233 (NI, 2009) as data acquisition board.
6.1 Command and Configuration Application
In order to provide the necessary HMI and API for the data
analysis applications,, a Command and Configuration
Application (C&C App) was developed (Fig. 6).
Fig. 7. Laboratory system idealization/experimental
idealization
setups
Fig. 6. Command & Configuration Application
The available controls of the C&C App enable full control
over the acquisition configuration parameters (i.e.
(
axis
selection, sampling rate, sampling period, sampling duty
cycle, etc.) and also provides a quick evaluation of the
presence of the system nodes.
s. Several additional features are
also built-in
in to assist the user with relevant information on
the network and acquisition parameters configuration.
One additional goal of the C&C App was to provide a
convenient interface between the WSN and the data
processing/analysis application. The implemented mechanism
allows a transparent interface with the system, in a very
similar with the previously used, which are typically serial
data interfaces.
To complete the data acquisition process, a VI routine was
developed in Labview (Labview, 2006) for the interpretation
and conversion into standard units, for receiving the
messages from the serial port as well as their local storage in
the central station.
6.2 Experimental Modal Identification
cation Tests
A single degree of freedom structure represented by an
inverted pendulum is one of the simplest examples used by
the civil engineers to explain the fundamentals of the
dynamics of structures. In this work, this structure was also
used as a tool to evaluate and understand the behaviour of the
COTS WSN and the developed prototype for operational
modal analysis of civil engineering structures.
structures
As it is shown in Fig. 7, the studied specimen consists in an
inverted wooden pendulum with 1.70 m height
hei
built specially
for testing purposes in the civil engineering laboratory at the
University of Minho. The pendulum was designed in such a
way that its dynamic properties replicates the properties of
the Mogadouro´s Clock Tower, an old masonry tower in the
northern part of Portugal, which was previously studied
stud
and
presented in Ramos (2007).
For comparison purposes, both WSN platforms were
evaluated considering as references conventional wired based
systems which consist in high sensitivity piezoelectric
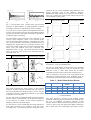
The initial tests were meant to observe the performance of the
COTS technology on WSN platforms for dynamic
monitoring studies. With this purpose, the accuracy of the
time series recordings of these platforms (MICA2 solution +
MTS400 board) was evaluated using only one of the
conventional accelerometers and mote placed at the top of the
Pendulum.. The results of these tests are presented in Fig. 8.
Acceleration [mg]
60
Acceleration [mg]
400
30
200
0
0
-30
-60
0
(a)
-200
COTS WSN Platform
Conventional Wired Based System
1
Time [s]
2
Commercial WSN Platform
Conventional System
-400
5
3
6
7
8
Time [s]
(b)
Fig. 8. Time domain series recorded using COTS WSN
platforms: (a) low
ow amplitude excitation recordings; and
(b) higher amplitude excitation recordings
The results of the first test indicated the good performance of
the commercial WSN platforms for measuring high
amplitude vibrations. As it was expected, for signals with
amplitudes below 20 mg, the WSN platforms recorded only
noise (it is even feasible to observe the digitalizing lines) due
to the low resolution of the micro-accelerometers
micro
and the
ADCs embedded. However, it is important to state
sta that in
SHM studies of civil engineering structures, vibrations with
amplitudes below 2 mg are commonly found. Moderate
differences (less than 5%) were found in the frequencies
detected with both systems (wired and COTS WSN) as well
as meaningless results forr the mode shape detection task due
to the lack of the implementation of synchronization
algorithms in the commercial WSN platforms.
Using the developed prototype of WSN platform, a second
round of tests were carried out considering the same inverted
pendulum as case study.
The first test was aimed to observe the quality of the time
series recordings of the developed platforms. With this
purpose, the effect of an impulse force was registered using
one conventional accelerometer and one new sensing node,
both located at the top of the pendulum.
pendulum The tests were
carried out considering a sampling rate of 100 Hz and
sampling time of 10 s. The results are shown in Fig. 9.
9
located at the top of the pendulum using parametric time
domain techniques such as the Stochastic Subspace
Identification (SSI) method (Van Overschee; and De Moor,
1991). Fig 11 shows the results of this analysis only for the
case of random excited system.
Acceleration [mg]
0.50
Acceleration [mg]
150
0.25
75
0
0.00
-75
-0.25
New Prototype of WSN
Conventional Wired Based Systems
1
Time [s]
2
5
3
7
Conventional Systems
8
Time [s]
New Prototype of WSN
Fig. 9. Time domain series recorded using the developed
prototype of WSN platform: (a) High amplitude excitation
recordings; and (b) lower amplitude excitation recordings
As it was shown, even for signals with amplitudes below than
0.25 mg, the records from the new developed WSN platform
and the conventional wired based accelerometers presented a
remarkable degree of similarity.
The subsequently stage consisted on the verification of the
accuracy of the frequency content of the acquired signals
with the developed WSN platforms. Considering the same
pair of sensors located at the top of the pendulum and 30 s of
sampling time, experiments in two excitation scenarios were
carried out: random impacts tests (vibrations with amplitudes
below 5 mg) and ambient noise tests (vibrations with
amplitudes below 1.5 mg). The Welch Spectrums (Welch,
1967) of the time series records were calculated and are
presented in Fig. 10.
New Prototype of WSN
Ambient Tests
Excited Tests
Conventional Systems
Fig. 10.Frequency domain results – Tests new WSN Platform
The results evidenced the high accuracy of the resultant
frequency domain spectrums calculated from the records of
the new developed system. With this respect, even in the case
of ambient noise tests, outstanding similarities in the content
of frequencies were detected.
The last stage of the experimental operational modal analysis
process consists on the estimation of the dynamic properties
of the structures by means of their natural frequencies,
damping coefficients and mode shapes.
For this purpose, a more refined data processing method was
used which consisted on the evaluation of the time series
recordings with 3 conventional and new developed sensors
1st Mode Shape
(b)
2nd Mode Shape
(a)
6
3rd Mode Shape
0
New Prototype of WSN
Conventional Wired Based Systems
-0.50
-150
Fig. 11. Experimental modal analysis results under excited
environment – Tests new WSN Platform
The first two mode shapes of the structure were identified
with no uncertainties. However, there was registered a light
difference in the 3rd mode shape which will be further
investigated in future stages of the present research project.
Table 2 summarizes the results of the experimental modal
identification studies performed in the pendulum using the
conventional wired based systems and new WSN platforms.
Table 2 – Modal Identification Results
Conv. Systems
Mode
1
2
3
ƒ (Hz)
3.26
5.00
16.07
ξ (%)
2.0
2.3
1.2
New Prototype
of WSN
f (Hz)
3.34
4.94
16.03
ξ (%)
2.4
1.9
2.0
Error
∆ƒ(%)
2.5
1.2
0.3
∆ξ(%)
20.0
17.4
66.7
7. CONCLUSIONS
This paper describes a wireless sensor network (WSN)
system for monitoring physical infrastructures. Building upon
the cons of traditional wired-based solutions, several
solutions based on WSNs have been proposed, but there was
a lack of ready-to-use and off-the-shelf WSN technologies
able to fulfil some more demanding requirements of these
applications (e.g. monitoring bridges, historical buildings or
vehicles structures).
Embedded networked sensor systems (SenSys’05), pages 142–153,
San Diego, California, USA.
This paper describes a solution that is mostly based on
standard and off-the-shelf technologies, namely in what
concerns hardware platforms, operating system and
communication protocol. Only a minimum set of customdesigned signal acquisition hardware was conceived, in order
to serve as an interface between the accelerometers and the
sensing nodes. Our solution is low-power and low-cost and
guarantees accurate and time synchronized measurements.
Rowe, A., Mangharam, R., Rajkumar, R. (2006). RT-Link: A time
synchronized link protocol for energy- constrained multi-hop
wireless networks. In: Proceedings of the 3rd Annual IEEE
Communications Society on Sensor and Ad Hoc Communications
and Networks, pages 402–411, Reston, VA, USA.
Future work will focus on extending the WSN architecture
proposed in this paper in order to support a higher number of
nodes and a wider region under monitoring, still guaranteeing
a tight synchronization between all nodes.
REFERENCES
Pines, Darryll J., Lovell, Philip A. (1997). Conceptual framework of
a remote wireless health monitoring system for large civil structures.
1998 Smart Mater Struct. 7 627.
Paek, Jeongyeup, Chintalapudi, Krishna, Govindan, Ramesh,
Caffrey, John, Masri, Sami (2005). A Wireless Sensor Network For
Structural Monitoring: Performance and Experience. In:
Proceedings of the Second IEEE Workshop on Embedded
Networked Sensors (EmNetS-II). Sidney, Australia.
Crossbow (2009). TelosB mote platform datasheet. Online at:
http://www.xbow.com/Products/Product_pdf_files/Wireless_pdf/Tel
osB_Datasheet .
Citizen (2006). Tuning Fork Crystal Units CMR200T – CMR250T
datasheet. Online at: http://www.citizencrystal.com/images/pdf/kcmr.pdf .
TinyOS (2010). TinyOS website. Online at: http://www.tinyos.net/ .
Open-ZB (2010). Open-ZB – OpenSource Toolset for IEEE
802.15.4 and ZigBee. Online at: http://www.open-zb.net/
Lynch, Jerome P., Low, Kincho H., Straser, Erik G. (2000). The
Development of a Wireless Modular Health Monitoring System for
Civil Structures. MCEER Mitigation of Earthquake Disaster by
Advanced Technologies (MEDAT-2) Workshop.
IEEE 802.15 WPANTM Task Group 4 (TG4) (2010). Online at:
http://grouper.ieee.org/groups/802/15/pub/TG4.html
Lynch, Jerome P., Loh, Kenneth J. (2006). A summary Review of
Wireless Sensors and Sensor Networks for Structural Health
Monitoring. The Shock and Vibration Digest, v. 38, nº2, pp. 91-128.
Gay, D., Levis, P., Von Behren, R., Welsh, M., Brewer, E., Culler,
D. (2003). The nesC language: A Holistic Approach to Networked
Embedded Systems. In: Proceedings of the Programming Language
Design and Implementation.
Ceriotti, M., Mottola, L., Picco, G.-P., Murphy, A., Guna, S., Corrà,
M., Pozzi, M., Zonta, D., Zanon, P. (2009). Monitoring Heritage
Buildings with Wireless Sensor Networks: The Torre Aquila
Deployment. 8th ACM/IEEE Int. Conf, on Information Processing
in Sensor Networks (IPSN/SPOTS), San Francisco (CA, USA).
Cinque, Marcello, Cotroneo, Domenico, Caro, Giampaolo De,
Pelella, Massimiliano (2006). Reliability Requirements of Wireless
Sensor Networks for Dynamic Structural Monitoring. In:
International Workshop on Applied Software Reliability (WASR
2006), pages 8-13.
Xu, Ning, Rangwala, Sumit, Chintalapudi, Krishna Kant, et al.
(2004). A Wireless Sensor Network For Structural Monitoring. In:
Proceedings of 2nd international conference on Embedded
networked sensor systems (SenSys’04). Baltimore, MD, USA.
Whelan, Matthew J., Gangone, Michael V., Janoyan, Kerop D., Jha,
Ratneshwar (2009). Real-time wireless vibration monitoring for
operational modal analysis of an integral abutment highway bridge.
In: Engineering Structures.
Elson, J., Girod, L., Estrin, D. (2002). Fine-grained network time
synchronization using reference broadcasts. In Proceedings of 5th
symposium on Operating systems design and implementation. OSDI
2002, pages 147–163. Boston, MA, USA.
Ganeriwal, S., Kumar R., . Srivastava, M. B. (2003). Timing-sync
protocol for sensor networks. In: Proceedings of 1st international
conference on Embedded networked sensor systems (SenSys’03),
pages 138–149, Los Angeles, California, USA.
Maroti, M., Kusy, B., Simon, G., Ledeczi, A. (2004). The flooding
time synchronization protocol. In: Proceedings of 2nd international
conference on Embedded networked sensor systems (SenSys’04),
pages 39–499, Baltimore, MD, USA.
Werner-Allen, G., Tewari, G., Patel, A., Welsh, M., Nagpal, R.
(2005). Firefly-inspired sensor network synchronicity with realistic
radio effects. In: Proceedings of 3rd international conference on
Advanced Sensors Calibration, (2009). Capacitive Accelerometer
ASC5631 Preliminary datasheet. Germany.
Cunha, A., Koubaa, A., Severino, R., Alves, M,. Open-ZB: an opensource implementation of the IEEE 802.15.4/ZigBee protocol stack
on TinyOS. 4th IEEE International Conference on Mobile Ad-hoc
and Sensor Systems (MASS´07), Pisa, Italy, October 2007, pp.1-12.
Aguilar, R.; Ramos, L.; Lourenço, P.B.; Severino, R.; Gomes, R.;
Gandra, P.; Alves, M. and Tovar, E. Operational Modal Monitoring
of Ancient Structures using Wireless Technology. Proceedings of
the XXVIII International Modal Analysis Conference, IMAC 2010,
Jacksonville, Florida, USA, (2010).
Labview. LabView User Manual, Release 8.0. National Instruments
Corporation, USA, (2006).
NI. User Guide and Specifications. www.ni.com. Accessed
December, (2009).
PCB. Product Catalogue. Accessed December, (2009).
Ramos, L. Damage Identification on Masonry Structures Based on
Vibration Signatures. PhD Thesis, Universidade do Minho,
Guimaraes, Portugal, (2007).
Van Overschee, P. and De Moor, B. Subspace Algorithms for the
Stochastic Identification Problem. Proceedings of the 30th
Conference on Decision and Control, Brighton, England, (1991).
Welch, P.D. The Use of the Fast Fourier Transform for the
Estimation of Power Spectra: A method Based on Time Averaging
over Short Modified Peridograms. IEE Transactions on Audio and
Electro-Acoustics, (1967).
G. Hackmann, F. Sun, N. Castaneda, C. Lu and S. Dyke, A Holistic
Approach to Decentralized Structural Damage Localization Using
Wireless Sensor Networks, IEEE Real-Time Systems Symposium
(RTSS'08), December 2008.