1
San
nta Marg
M gariita R
Regioon
Hyd
H drolo
ogy Mod
del
Guida
G ancee Doocum
mentt
Prrepared By:
Santaa Margarita Reegion Copermitttees: Riversid
de County Floood Control and Water Conservvation District,
Cou
unty of Riversiide, and the citties of Murrietaa, Temecula, an
and Wildomar
With assistance
a
from
m:
Cleear Creek Solutions,
S
In
nc. www.cleearcreeksolu
utions.com
April 20144
Santa Margarita Region Hydrology Model Guidance – April 2014
This page has been intentionally left blank.
Santa Margarita Region Hydrology Model Guidance – April 2014
To download the Santa Margarita Region Hydrology Model and the electronic version of
this document,
please go to http://www.floodcontrol.co.riverside.ca.us/NPDES/SantaMargaritaWS.aspx#SMdocs
If you have questions about SMRHM or its use, please contact: Clear Creek Solutions, Inc.
360-943-0304 (8 AM – 5 PM Pacific time)
ii
Santa Margarita Region Hydrology Model Guidance – April 2014
End User License Agreement
End User Software License Agreement (Agreement). By clicking on the "Accept" Button when
installing the Santa Margarita Region Hydrology Model (SMRHM) Software or by using the Santa
Margarita Region Hydrology Model Software following installation, you, your employer, client and
associates (collectively, "End User") are consenting to be bound by the following terms and
conditions. If you or User do not desire to be bound by the following conditions, click the "Decline"
Button, and do not continue the installation process or use of the SMRHM Software.
The SMRHM Software is being provided to End User pursuant to a sublicense of a governmental
licensee of Clear Creek Solutions, Inc. Pursuant to the terms and conditions of this Agreement, End
User is permitted to use the SMRHM Software solely for purposes authorized by participating
municipal, county or special district member agencies of signatory programs which are organized on
a county-wide basis for implementation of stormwater discharge permits issued by the California
Regional Water Quality Control Board, under the National Pollutant Discharge Elimination System.
The End User is not permitted to use the SMRHM Software for any other purpose than as described
above.
End User shall not copy, distribute, alter, or modify the SMRHM Software.
The SMRHM incorporates data on soils, climate and geographical features to support its intended
uses of identifying site-appropriate modeling parameters, incorporating user-defined inputs into longterm hydrologic simulation models of areas within the Santa Margarita Region , and assisting design
of facilities for flow duration control as described in the accompanying documentation. These data
may not be adequate for other purposes such as those requiring precise location, measurement or
description of geographical features, or engineering analyses other than those described in the
documentation.
This program and accompanying documentation are provided 'as-is' without warranty of any kind.
The entire risk regarding the performance and results of this program is assumed by End User. Clear
Creek Solutions Inc. and the governmental licensee or sublicensees disclaim all warranties, either
expressed or implied, including but not limited to implied warranties of program and accompanying
documentation. In no event shall Clear Creek Solutions Inc., or authorized representatives be liable
for any damages whatsoever (including without limitation to damages for loss of business profits,
loss of business information, business interruption, and the like) arising out of the use of, or inability
to use this program even if Clear Creek Solutions Inc., has been advised of the possibility of such
damages. Software Copyright © by Clear Creek Solutions, Inc. 2005-2013; All Rights Reserved.
iii
Santa Margarita Region Hydrology Model Guidance – April 2014
FOREWORD
The Santa Margarita Region Hydrology Model (SMRHM) is a tool for analyzing the
hydromodification effects of land development projects and sizing solutions to mitigate the
increased stormwater runoff from these projects.
This section of the guidance
documentation provides background information on the definition and effects of
hydromodification and relevant findings from technical analyses conducted in response to
regulatory requirements. It also summarizes the current Hydromodification Management
Standard and general design approach for hydromodification control BMPs, which led to
the development of the SMRHM.
Regulatory Context
The California Regional Water Quality Control Board (Regional Board) requires
stormwater programs to address the increases in stormwater runoff rate and volume from
New Development and Redevelopment projects where those increases could cause
increased erosion of receiving channels. Phase 1 municipal separate stormwater system
(MS4) permits in Riverside County contain requirements to develop and implement
hydromodification management plans (HMPs) and to implement associated management
measures.
iv
Santa Margarita Region Hydrology Model Guidance – April 2014
TABLE OF CONTENTS
End User License Agreement ............................................................................................iii
FOREWORD ...................................................................................................................... iv
Regulatory Context ............................................................................................................. iv
Acknowledgements ............................................................................................................ iv
INTRODUCTION TO SMRHM ........................................................................................ 1
QUICK START .................................................................................................................. 3
MAIN SCREENS ............................................................................................................. 35
MAP INFORMATION SCREEN ..................................................................................... 36
GENERAL PROJECT INFORMATION SCREEN ......................................................... 37
SCHEMATIC EDITOR .................................................................................................... 39
LAND USE BASIN ELEMENT ...................................................................................... 40
LATERAL BASIN ELEMENT (Pervious) ...................................................................... 43
LATERAL I BASIN ELEMENT (Impervious) ............................................................... 44
TRAPEZOIDAL POND ELEMENT ............................................................................... 45
VAULT ELEMENT ......................................................................................................... 49
TANK ELEMENT ............................................................................................................ 51
IRREGULAR POND ELEMENT .................................................................................... 53
PONDPAD INTERFACE ................................................................................................. 54
GRAVEL TRENCH BED ELEMENT ............................................................................. 56
SAND FILTER ELEMENT ............................................................................................. 58
OUTLET STRUCTURE CONFIGURATIONS ............................................................... 60
INFILTRATION ............................................................................................................... 66
AUTO POND .................................................................................................................... 67
CHANNEL ELEMENT ................................................................................................... 69
FLOW SPLITTER ELEMENT ........................................................................................ 71
TIME SERIES ELEMENT ............................................................................................... 73
STAGE-STORAGE-DISCHARGE TABLE ................................................................... 74
SSD TABLE ELEMENT .................................................................................................. 75
BIORETENTION ELEMENT .......................................................................................... 78
POINT OF COMPLIANCE .............................................................................................. 85
CONNECTING ELEMENTS ........................................................................................... 87
ANALYSIS SCREEN ...................................................................................................... 90
FLOW DURATION ......................................................................................................... 92
FLOW FREQUENCY ...................................................................................................... 94
DRAWDOWN .................................................................................................................. 95
HYDROGRAPHS ............................................................................................................. 96
LID BMP SIZING ............................................................................................................ 97
REPORTS SCREEN ....................................................................................................... 104
v
Santa Margarita Region Hydrology Model Guidance – April 2014
TOOLS SCREEN ........................................................................................................... 106
LID ANALYSIS SCREEN ............................................................................................. 110
OPTIONS ........................................................................................................................ 114
DURATION CRITERIA ................................................................................................ 115
SCALING FACTORS .................................................................................................... 116
TIPS AND TRICKS FOR LID PRACTICES AND FACILITIES ................................ 118
INFILTRATION BASIN/POND .................................................................................... 119
INFILTRATION TRENCH ........................................................................................... 122
PERMEABLE PAVEMENT .......................................................................................... 125
BIORETENTION (STANDARD DESIGN) .................................................................. 128
BIORETENTION (VERTICAL SIDESLOPES) ........................................................... 130
BIORETENTION (PLANTER BOX) ............................................................................ 132
SAND FILTER BASIN .................................................................................................. 134
EXTENDED DETENTION BASIN ............................................................................... 136
APPENDIX A: DEFAULT SMRHM HSPF PERVIOUS PARAMETER VALUES ... 140
APPENDIX B:DEFAULT SMRHM HSPF IMPERVIOUS PARAMETER VALUES 157
APPENDIX C: ADDITIONAL GUIDANCE FOR USING SMRHM .......................... 161
Infiltration Reduction Factor ..................................................................................... 161
Flow Duration Outlet Structures – Practical Design Considerations ........................ 162
Drawdown time and treatment/vector considerations ............................................... 163
APPENDIX D: SMRHM REVIEWER CHECKLIST ................................................... 167
APPENDIX E: SMRHM BACKGROUND ................................................................... 169
Effects of Hydromodification ................................................................................... 169
Development of the Santa Margarita Region Hydrology Model .............................. 169
SMRHM OVERVIEW ................................................................................................... 170
BIORETENTION MODELING METHODOLOGY .................................................... 172
vi
Santa Margarita Region Hydrology Model Guidance – April 2014
ACRONYMS and ABBREVIATIONS
AGWETP
AGWRC
AGWS
ASCE
ASTM
AT
BASETP
BMP
C
CCS
CEPSC
CF
CFS
d
DEEPFR
Dev.
DMA
D85
Ft
GWVS
h
Headr
HMP
HSPF
H/V
I
IFWS
in.
INFEXP
INFILD
INFILT
INTFW
IRC
K
KVARY
LID
LSUR
LZETP
LZS
Active Groundwater Evapotranspiration Fraction
Active Groundwater Recession Constant (per day)
Initial Active Groundwater Storage (inches)
American Society of Civil Engineers
American Society of Testing and Materials
Tributary Area
Base Flow (from groundwater) Evapotranspiration Fraction
Best Management Practice
Runoff Coefficient
Clear Creek Solutions
Interception storage (inches)
Correction Factor
Cubic Feet per Second
Surface ponding depth (feet)
Fraction of groundwater to deep aquifer or inactive storage
Development
Drainage Management Area
85th percentile, 24-hour rainfall depth
Foot
Initial Groundwater Vertical Slope (feet/feet)
Hydraulic head (feet)
The water height over the notch/orifice bottom
Hydromodification Management Plan
Hydrologic Simulation Program in Fortran
Ratio of horizontal to vertical distance
Gradient of the water table surface (slope)
Initial interflow (inches)
inch
Infiltration Exponent
Infiltration ratio (maximum to mean)
Infiltration (inches per hour)
Interflow index
Interflow Recession Constant (per day)
Hydraulic conductivity (inches per hour)
Variable groundwater recession
Low Impact Development
Length of surface flow path (feet)
Lower Zone Evapotranspiration fraction
Initial Lower Zone Storage (inches)
vii
Santa Margarita Region Hydrology Model Guidance – April 2014
LZSN
m
Mitigated
MS4
N
NRCS
NSUR
NTS
Phi
POC
Predev
Q
q
QBMP
Qcp
RETS
RETSC
SLSUR
SMMWW
SMR
SMRHM
SSD
Stormwater runoff
SURS
SWMM
Theta
Tr
TSS
USDA
UZS
UZSN
VBMP
VU
WDM
WEF
Wh
WS
WWHM
Lower Zone Storage Nominal (inches)
rank (largest event, m = 1)
The developed land use with mitigation measures (as selected by the
user).
Municipal Separate Storm Sewer System
Number of years
Natural Resources Conservation Service
Surface roughness (Manning's n) for impervious area
Not to Scale
Soil porosity
Point of Compliance
Predevelopment: the native land cover conditions prior to any land
use development.
Flow rate (cfs)
Darcy flux (cm/hr)
LID BMP flow rate (cfs)
Critical Flow (cfs)
Initial surface retention storage (inches) for impervious area
Surface retention storage (inches) for impervious area
Slope of surface flow path (feet/feet) for impervious area
Stormwater Management Manual for Western Washington
Santa Margarita Region
Santa Margarita Region Hydrology Model
Stage Storage Discharge
Stormwater that does not soak into the ground and either flows
directly into surface waterways or is channeled into storm drains
Initial surface runoff (inches) for impervious area
Stormwater Management Model
Notch Angle
Return period (years)
Total suspended solids
United States Department of Agriculture
Initial Upper Zone Storage (inches)
Upper Zone Storage Nominal (inches)
LID BMP design volume
85% unit storage volume
Watershed Data Management
Water Environment Federation
Notch Width
Water Surface
Western Washington Hydrology Model
vii
Santa Margarita Region Hydrology Model Guidance – April 2014
This page has been intentionally left blank.
vii
Santa Margarita Region Hydrology Model Guidance – April 2014
INTRODUCTION TO SMRHM
SMRHM is the Santa Margarita Region Hydrology Model. SMRHM is based on the
WWHM (Western Washington Hydrology Model) stormwater modeling software platform.
WWHM was originally developed for the Washington State Department of Ecology. More
information about WWHM can be found at www.clearcreeksolutions.com. More
information can be found about the Washington State Department of Ecology's stormwater
management program and manual at
http://www.ecy.wa.gov/programs/wq/stormwater/manual.html.
Clear Creek Solutions is responsible for SMRHM and the SMRHM guidance
documentation.
This guidance documentation is organized so as to provide the user an example of a
standard application using SMRHM (described in Quick Start) followed by descriptions of
the different components and options available in SMRHM. The Tips and Tricks section
presents some ideas of how to incorporate LID (Low Impact Development) facilities and
practices into the SMRHM analysis. Riverside County's Design Handbook for Low Impact
Development Best Management Practices (September 2011) has the most up-to-date
information regarding BMP standards and should be consulted prior to the
start of any SMRHM LID BMP modeling.
Appendices A and B provide a full list of the HSPF parameter values used in SMRHM.
Appendix C contains additional guidance and recommendations by the stormwater
programs that have sponsored the SMRHM development. Appendix D is a checklist for
use by SMRHM project reviewers. Appendix E provides additional background
information on SMRHM.
Throughout the guidance documentation notes using this font (sans-serif italic)
alert the user to actions or design decisions for which guidance must be consulted
that is external to the SMRHM software, either provided in Appendix C of this
guidance documentation or by the Copermittee with jurisdiction over the project
site.
Purpose
The purpose of SMRHM is to size hydromodification management or flow control BMPs
to mitigate the effects of increased stormwater runoff (peak discharge, duration, and
volume) from proposed land use changes that impact natural streams, wetlands, and other
water courses.
SMRHM provides:
A uniform methodology for the SMR
A more accurate methodology than single-event design storms
An easy-to-use software package
1
Santa Margarita Region Hydrology Model Guidance – April 2014
SMRHM is based on:
Continuous simulation hydrology (HSPF)
Actual long-term recorded precipitation data
Measured pan evaporation data
Existing vegetation (for predevelopment conditions)
Regional HSPF parameters
Computer Requirements
Windows 2000/XP/Vista/7/8 with 300 MB uncompressed hard drive space
Internet access (only required for downloading SMRHM, not required for
executing SMRHM)
Pentium 3 or faster processor (desirable)
Color monitor (desirable)
It is important to know the following information prior to using SMRHM for a
project:
Knowledge of the site location and/or street address
Knowledge of the actual distribution of existing site soil by category (A, B, C, or
D)
Knowledge of the actual distribution of existing and proposed site land cover by
category (forest, shrub, grass, or urban)
Knowledge of the actual distribution of existing and proposed site topography by
category (flat, moderate, steep, or very steep)
Knowledge of the planned distribution of the proposed development (buildings,
streets, sidewalks, parking, lawn areas) overlying the soil categories
2
Santa Margaritaa Region Hydroology Model Guiidance – April 20014
QUICK STA
ART
Quick
k Start very briefly
b
describes the steeps to quickkly size a stoormwater ruunoff detentiion
pond using
u
SMRH
HM. New users should
d read the ddescriptions of the SMR
RHM screenns,
elemen
nts, and anallysis tools beefore going through
t
the steps describbed below.
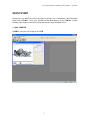
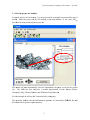
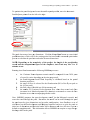
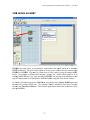
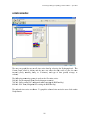
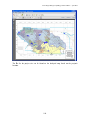
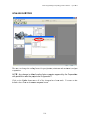
1. Opeen SMRHM
M.
SMRH
HM will open with a map
p of the SMR
R.
3
Santa Margaritaa Region Hydrollogy Model Guidance – April 20014
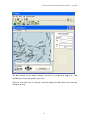
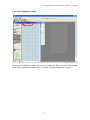
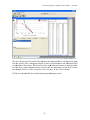
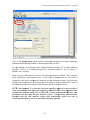
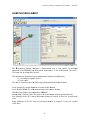
The map
m controlss can be useed to enlarg
ge a specificc area on thhe street mapp layer. Thhis
option
n helps to loccate the speccific project site.
s
When the street map
m layer is enlarged a sufficient am
mount the inndividual strreet names aare
shown
n on the map
p.
4
Santa Margaritaa Region Hydroology Model Guiidance – April 20014
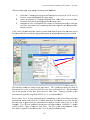
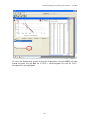
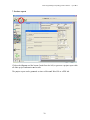
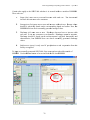
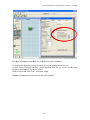
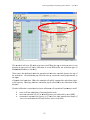
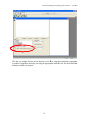
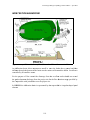
2. Select the projject site loca
ation.
Locatee the project site on the map.
m
Use th
he map contrrols to magniify a portionn of the map,, if
needed
d. Select th
he project sitte by left cliicking on thhe map locattion. A redd circle will be
placed
d on the map identifying the project site.
s
The model
m
will th
hen automatiically select the approprriate rain gaauge record for the projeect
site. The SMR has four long-term 15-minute prrecipitation records: Eaastern Slopes,
Temeccula Valley, Western Plaateau, and Wildomar/No
W
rth Murrietaa.
For thiis example we
w will use th
he Temeculaa Valley rainn gauge.
The sitte name, add
dress, and citty informatio
on is optionaal. It is not uused by SMR
RHM, but w
will
be inclluded in the project repo
ort summary..
5
Santa Margaritaa Region Hydrollogy Model Guidance – April 20014
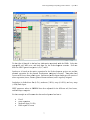
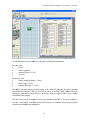
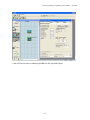
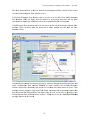
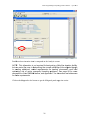
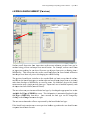
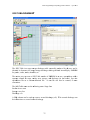
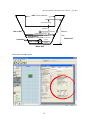
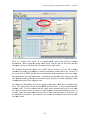
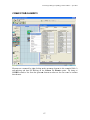
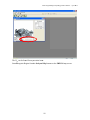
3. Use the tool bar (immediately above the
t map) to move to thee
Scenario Editor. Click on th
he General Project
P
Inforrmation buttton.
The General
G
Projject Informa
ation button will bring
up the Schematic Editor.
E
The scchematic ediitor screen co
ontains two scenarios:
Predev
velopment an
nd Mitigated
d.
ent scenario
First set
s up the Predevelopm
P
o and then
the Miitigated scen
nario.
Left cllick on the Land
L
use Baasin elementt under the
Drainaage Elementts heading. The Land use Basin
elemen
nt representts a drainage managem
ment area
(DMA
A).
Select any grid ceell (preferably near the top of the
grid) and
a left clicck on that grid.
g
The DMA
D
will
appearr in that grid cell.
6
Santa Margaritaa Region Hydrollogy Model Guidance – April 20014
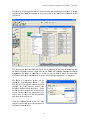
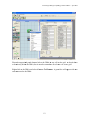
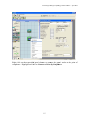
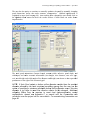
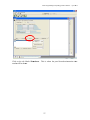
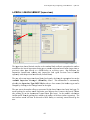
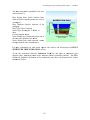
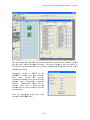
To thee right of thee grid is thee land use in
nformation aassociated w
with the DM
MA. Select tthe
approp
priate soil, land
l
cover, and land slo
ope for the Predeveloppment scenarrio. Soils aare
based on NRCS geeneral catego
ories A, B, C,
C and D.
Land cover
c
is based on the naative vegetaation for the Predevelopment projecct area and tthe
planneed vegetation for the planned deveelopment (M
Mitigated scenario). Noon-urban lannd
cover can
c be forest, shrub, and
d/or grass. In
n contrast, thhe developedd landscape will consist of
urban vegetation (lawns, floweers, planted shrubs and ttrees) and is regularly irrrigated.
Land slope
s
is diviided into flaat (0-5%), moderate
m
(5-110%), steep (10-20%), aand very steeep
(>20%
%) land slopees.
HSPF parameter values
v
in SM
MRHM havee been adjussted for the different sooil, land coveer,
and lan
nd slope cateegories.
For thiis example we
w will assum
me that the Predevelopm
P
ment land usee is:
D soil
grass vegeetation
moderate slope (5-10%
%)
DMA equ
uals 10 acress
7
Santa Margaritaa Region Hydroology Model Guiidance – April 20014
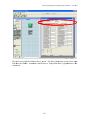
Note th
hat the Predevelopment land use nev
ver includes man-made iimpervious aareas. Existiing
imperv
vious areas must
m be mod
deled as theey were prioor to any lannd use develoopment on tthe
projectt site.
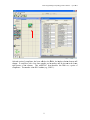
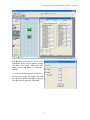
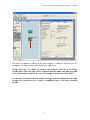
The do
ownstream discharge
d
fro
om this DMA will be seelected as ouur point of ccompliance ffor
the Preedevelopmen
nt scenario. Right click
k on the DM
MA and highhlight Conneect to Point of
Complliance (the point
p
of com
mpliance is defined as the locationn at which the stormwaater
runofff from both th
he Predevelo
opment scen
nario and thee Mitigated sscenario are compared).
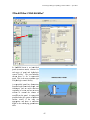
The Point
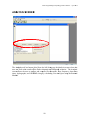
P
of Co
ompliance screen
s
will be
shown
n for Predev
velopment DMA
D
1. The
T
POC (Point
(
of Compliance) Outlet
O
has beeen
checkeed for bo
oth surface runoff and
a
interflo
ow (shallow
w subsurfacee flow). Theese
are thee two flow components
c
of stormwaater
runofff. Do not ch
heck the gro
oundwater box
b
unless there is observed
o
and
d documentted
base fllow on the project site.
Click the Connecct button in the low rig
ght
cornerr to connect this
t point off compliancee to
the Preedevelopmen
nt basin.
8
Santa Margaritaa Region Hydrollogy Model Guidance – April 20014
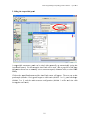
After the
t point of compliance has been ad
dded to the D
DMA, the laand use basinn element w
will
changee. A small box with a bar chart grraphic and a number w
will be shownn in the low
wer
right corner
c
of th
he element. This smalll POC boxx identifies this DMA as a point of
compliiance. The number
n
is th
he POC numb
ber (e.g., PO
OC 1).
9
Santa Margaritaa Region Hydrollogy Model Guidance – April 20014
4. Set up the Mitiigated scena
ario.
First, select
s
the Miitigated scen
nario tab at the
t top of thee grid. Place a land use basin elemeent
on the grid to repreesent the sam
me DMA, ass selected in the Predeveelopment sceenario.
10
Santa Margaritaa Region Hydroology Model Guiidance – April 20014
For thee Mitigated scenario DM
MA we will input
i
the folllowing inforrmation:
Pervio
ous area:
D soil
urban veg
getation
moderate slope (5-10%
%)
4.5 acres
Imperv
vious area:
Roads, moderate slop
pe: 2.5 acres
Roof Areaa: 1.5 acres
Parking, flat
f slope: 1.5 acres
The im
mpervious land category includes roaads, roofs, siidewalks, paarking, driveeways, and aany
other impervious
i
surfaces.
s
Alll are modeled the samee; the surfacee runoff prodduced from an
imperv
vious land surface
s
only
y varies by land
l
slope ((steeper sloppes producee more surfaace
runofff than flatter slopes).
The neext step is to
o add a mitig
gation facilitty downstreaam of the DM
MA. For thhis example w
we
will usse a trapezo
oidal stormw
water pond (also
(
knownn as a detenttion basin) tto provide tthe
requireed hydromod
dification miitigation.
11
Santa Margaritaa Region Hydroology Model Guiidance – April 20014
Place the
t trapezoid
dal pond eleement below
w the DMA inn any cell onn the grid. IIt doesn't haave
to be directly
d
below
w the DMA, but it must be somewheere on a low
wer row in thhe grid.
Right click
c
on the DMA and select Conneect To Elemeent. A greenn line will apppear with oone
end co
onnected to the
t DMA.
12
Santa Margaritaa Region Hydroology Model Guiidance – April 20014
Pull th
he other end
d of the line down to the
trapezo
oidal pond with the mouse
m
pointeer
and cllick on the pond. Thiss action willl
bring up the From
m Basin to Conveyance
n.
screen
As with the Predeevelopment scenario we
t only conn
nect the surfa
face flow and
d
want to
the intterflow (shalllow subsurfface seepagee)
from th
he basin to the
t pond. Cllick OK.
13
Santa Margaritaa Region Hydroology Model Guiidance – April 20014
A line will then bee shown conn
necting the DMA
D
to the trapezoidal pond.
14
Santa Margaritaa Region Hydroology Model Guiidance – April 20014
Right click on thee trapezoidaal pond elem
ment to connnect the ponnd's outlet tto the point of
hlight and cliick on Connect to Point Of Compliaance.
compliiance. High
15
Santa Margaritaa Region Hydroology Model Guiidance – April 20014
The Po
oint of Com
mpliance screeen will be shown
s
for thhe pond. Thhe pond has one outlet ((by
defaultt). The outfflow from thee pond will be
b comparedd with the Prredevelopmeent runoff. T
The
point of complian
nce is desig
gnated as POC
P
1 (SM
MRHM allow
ws for multtiple points of
compliiance). Clicck on the Con
nnect button
n.
16
Santa Margaritaa Region Hydrollogy Model Guidance – April 20014
The po
oint of comp
pliance is sh
hown on the pond elemeent as a smaall box with the letter "A
A"
and nu
umber 1 in th
he bar chart symbol
s
in th
he lower righht corner.
NOTE
E: The letteer "A" stan
nds for An
nalysis and designates that this iis an analyssis
locatio
on where fllow and sta
age will be computed
c
aand the outtput flow an
nd stage tim
me
series will be mad
de available to the user. The numb
ber 1 denotees that this is POC 1.
You can
c have an
n analysis lo
ocation with
hout havingg a point off compliancee at the sam
me
locatio
on, but you
u cannot have a poin
nt of complliance that is also nott an analyssis
locatio
on.
17
Santa Margaritaa Region Hydrollogy Model Guidance – April 20014
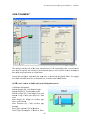
5. Siziing the trapezoidal pon
nd.
A trap
pezoidal storrmwater pon
nd can be siized either m
manually orr automaticaally (using tthe
Auto Pond
P
featuree). For this example
e
Autto Pond will be used. (G
Go to page 48 to find moore
inform
mation about how to man
nually size a stormwaterr pond, detenntion basin, or other HM
MP
BMP.))
Click on
o the Auto Pond button
n and the Au
uto Pond scrreen will apppear. The uuser can set tthe
pond depth
d
(defau
ult: 4 feet), pond
p
length to width raatio (default: 1 to 1), poond sidesloppes
(defau
ult: 3 to 1), and the outtlet structuree configurattion (defaultt: 1 orifice aand riser wiith
rectang
gular notch weir).
w
18
Santa Margaritaa Region Hydroology Model Guiidance – April 20014
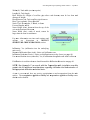
To opttimize the po
ond design and
a create thee smallest poond possiblee, move the A
Automatic
Pond Adjuster
A
poin
nter from the left to the right.
r
The po
ond does nott yet have an
ny dimensions. Click thhe Create Poond button tto create inittial
pond dimensions,
d
which will be the startiing point forr Auto Pondd's automatedd optimizatiion
processs to calculatte the pond size
s and outlet structure dimensions.
NOTE
E: Dependin
ng on the complexity
c
ngth of the precipitatiion
of the projject, the len
record
d and the computation
c
nal speed of the comp
puter, Auto Pond mayy take 1 to 15
minuttes to run.
Runnin
ng Auto Pon
nd automatess the followiing SMRHM
M processes:
1.
1
2.
2
3.
3
4.
4
5.
5
the 15--minute Pred
developmentt scenario ruunoff is com
mputed for thhe 30-50 yeaars
of record (it varies depending on
o the rain ggauge used),
the Preedevelopmen
nt runoff flo
ood frequenncy is calcullated based on the parttial
duration peak flows,
the ran
nge of flows is selected for the flow
w duration (110% of the 22-year peak to
the 10-year peak),
this flow range is divided
d
into 100 incremeents, and
the num
mber of 15--minute Predevelopmennt flow valuues that exceeed each floow
increment level (Prredevelopmeent flow durration) are ccounted to ccreate the floow
duration curves and
d accompany
ying tabular results.
Next, SMRHM computes
c
thee post-development runnoff (in thee Mitigated scenario) aand
t
the pond. But before
b
the ruunoff can bee routed throough the poond
routes the runoff through
ond must be given dimeensions and an outlet coonfiguration.. Auto Pondd uses a set of
the po
rules based
b
on thee Predevelop
pment and Mitigated
M
sccenario land uses to givve the pond an
initial set of dimen
nsions and an
a initial outtlet orifice ddiameter andd riser (the rriser is givenn a
defaultt rectangularr notch). Th
his informattion allows SMRHM too compute a stage-storaggedischaarge table forr the pond.
19
Santa Margaritaa Region Hydroology Model Guiidance – April 20014
With this initial po
ond stage-sto
orage-dischaarge table SM
MRHM:
1.
1
2.
2
3.
3
routes the
t 15-minu
ute post-projeect runoff thhrough the pond for the 30-50 years of
record to create thee Mitigated flow
f
time serries,
counts the numberr of 15-minu
ute Mitigateed flow valuues that exceed each floow
increment level (this is the Mitiigated flow dduration), annd
computtes the ratio of Mitigateed flow valuues to Predevvelopment fl
flow values ffor
each flow incremeent level (comparing thee Predeveloppment and M
Mitigated floow
duration results).
If any of the 100 in
ndividual raatio values iss greater thann allowed byy the flow duuration criteria
then th
he pond failss to provide an
a appropriaate amount oof mitigationn and needs tto be resizedd.
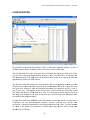
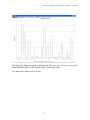
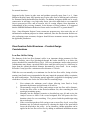
Flow duration
d
resu
ults are show
wn in the pllots above. The verticaal axis show
ws the range of
flows from
f
10% of the 2-year flow (0.40 cfs)
c to the 100-year flow ((8.66 cfs). T
The horizonntal
axis iss the percen
nt of time that
t
flows exceed
e
a floow value. Plotting poositions on tthe
horizontal axis typ
pically rangee from 0.001% to 1%, as explained bbelow.
For the entire 30- to 50-year simulation period
p
(depeending on thhe period off record of tthe
precipitation statio
on used) all of the 15-miinute time stteps are cheecked to see if the flow ffor
that tim
me step is greater
g
than the minimu
um flow durration criterria value (0.40 cfs, in thhis
examp
ple). For a 50-year
5
simu
ulation perio
od there aree approximattely 1,600,000 15- minuute
values to check. Many of th
hem are zero
o flows. Thhe 10% of thhe Predeveloopment 2-yeear
flow value
v
is typiccally exceedeed less than 1% of the tootal simulatioon period.
20
Santa Margaritaa Region Hydroology Model Guiidance – April 20014
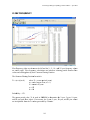
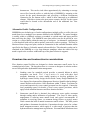
This fllow duration
n check is do
one for both
h the Predeveelopment floows (shown in blue on tthe
screen
n) and the Miitigated flow
ws (shown in
n red).
If all of
o the Mitig
gated flow duration
d
valu
ues (in red) are to the leeft of the Prredevelopmeent
flow duration
d
valu
ues (in bluee), then the number of occurrencess decreases and the poond
successsfully mitigaates the addiitional erosiv
ve flows prooduced by thhe developmeent.
If the Mitigated
M
flow duration
n values (in red)
r
are far tto the left off the Predevelopment floow
duratio
on values (iin blue), theen the pond
d can be m
made smallerr and still m
meet the floow
duratio
on criteria.
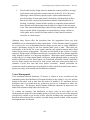
Auto Pond
P
goes th
hrough an iteeration process by whicch it changess the pond ddimensions aand
outlet configuratio
on, then insstructs SMR
RHM to ag ain compute the resultting Mitigatted
ns, and decid
de if it has m
made the ressults better oor worse. Thhis
runofff, compare fllow duration
iteratio
on process continues
c
until Auto Pon
nd finally cooncludes thatt an optimum
m solution hhas
been found
f
and th
he Mitigated
d flow duratiion values (iin red) are aas close as ppossible to tthe
Predev
velopment fllow duration
n values (in blue).
b
Whenn this occurss the Auto P
Pond Finish
hed
messag
ge appears on
o the screen
n.
21
Santa Margaritaa Region Hydroology Model Guiidance – April 20014
The usser has the option
o
to continue to manually optiimize the poond by manuually changiing
pond dimensions and/or thee outlet stru
ucture confi
figuration. (Manual opptimization is
explain
ned in more detail on paage 48.) Aft
fter making tthese changees the user should click on
the Op
ptimize Pon
nd button to
o check the results andd see if Autoo Pond cann make furthher
improv
vements.
(bottom len
The final
fi
pond dimensions
d
ngth, bottom
m width, efffective ponnd depth, aand
sideslo
opes) and ou
utlet structu
ure informatiion (riser heeight, riser diameter, riiser weir typpe,
weir notch
n
height and width, and
a orifice diameter
d
andd height) aree shown on tthe trapezoiddal
pond screen
s
to the right of the Schematic grid.
g
NOTE
E: If Auto Pond selec
cts a bottom orifice d
diameter sm
maller than the smalle
est
diame
eter allowed
d by the lo
ocal municip
pal permittiting agencyy then the user has th
the
option
n of specify
ying a minim
mum allowa
able bottom
m orifice dia
iameter eve
en if this siize
diame
eter is too large to meet
m
flow duration
d
criiteria for th
his elementt. Addition
nal
mitiga
ating BMPs may be
e required
d to meett local hyydromodifica
ation contr
trol
requirrements. Please
P
see
e Appendix
x C or co
onsult with the Cope
ermittee w
with
jurisdiiction over the project site for mo
ore details. For manua
al sizing infformation see
page 48.
22
Santa Margaritaa Region Hydrollogy Model Guidance – April 20014
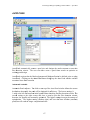
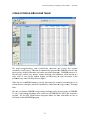
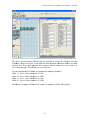
6. Rev
view analysiis.
The Analysis tool bar button (third from the left) brinngs up the A
Analysis scrreen where tthe
user caan look at th
he results. Eaach time series dataset iss listed in thhe Analyze D
Datasets box in
the low
wer left corn
ner.
23
Santa Margaritaa Region Hydrollogy Model Guidance – April 20014
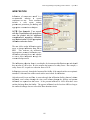
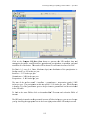
To rev
view the flow
w duration analysis at th
he point of coompliance select the PO
OC 1 tab at tthe
bottom
m and make sure that both
b
the 501
1 POC 1 Prredevelopmeent flow and 801 POC
C 1
Develo
oped flow arre highlighteed.
24
Santa Margaritaa Region Hydroology Model Guiidance – April 20014
The flow duration
n plot for both Predevelo
opment and Mitigated fflows will bee shown aloong
with th
he specific flow valuess and numbeer of times Predevelopm
ment and M
Mitigated flow
ws
exceed
ded those flo
ow values. The
T Pass/Faiil on the righht indicates w
whether or nnot at that floow
level the
t flow con
ntrol standard
d criteria weere met and the pond paasses at that flow level ((in
this ex
xample from 10% of the 2-year flow to the 10-yeear). If not, a Fail is shoown.
NOTE
E: A single Fail
F fails the hydromodiffication pondd design criteria.
25
Santa Margaritaa Region Hydrollogy Model Guidance – April 20014
Pond drawdown/re
d
etention timee is computeed on the Annalysis screenn.
NOTE
E: This info
ormation is not require
ed for basicc sizing of tthe flow durration facilitty,
but ca
an assist th
he user in determining
d
g the overalll suitabilityy of the mitig
igated desig
gn
in me
eeting addiitional, rela
ated requirrements fo
or treating stormwater runoff an
nd
minim
mizing risk of vector (mosquito)
(
breeding p
problems. See page 98 for mo
ore
descriiptions of th
his SMRHM
M feature, and
a Append
dix C for disscussion an
nd reference
es
for the
ese requirements.
Click on
o the Stagee tab at the bottom to gett the Mitigat ed pond stagge time seriees.
26
Santa Margaritaa Region Hydrollogy Model Guidance – April 20014
Click on the tab labeled Dra
awdown. This
T
is wherre the pond drawdown/rretention tim
me
resultss will be show
wn.
27
Santa Margaritaa Region Hydroology Model Guiidance – April 20014
Select the pond yo
ou want to analyze
a
for drawdown/re
d
etention timee (in this exxample theree is
only one pond: Traapezoidal Po
ond 1) by cliicking on thee dataset andd highlightinng it.
28
Santa Margaritaa Region Hydrollogy Model Guidance – April 20014
Click on the Analy
lyze Stage button and th
he computedd pond stagees (pond watter depths) aare
summaarized and reeported in teerms of drain
n/retention tiime (in days).
For th
his example, the maximu
um stage co
omputed durring the enttire 30-50 yeear simulation
period
d is 3.40 feeet. This max
ximum stage has a draawdown tim
me of 1 day, 20 hours, 33
minutees, and 8 secconds.
Ponds may have drain
d
times in
i excess off the allowedd maximum of hours. T
This can occcur
when a pond has a small botttom orifice. If this is nnot acceptabble then the user needs to
changee the pond outlet
o
config
guration, maanually run tthe Mitigatedd scenario, and repeat tthe
analyzze stage com
mputations. A situation may
m occur w
where it is noot possible too have both an
accepttable pond drrawdown/rettention time and meet thhe flow durattion criteria.
NOTE
E: See Appe
endix C or the local municipal
m
pe
ermitting ag
gency for an
n overview of
other requiremen
nts that ma
ay apply reg
garding dra
awdown tim
me, and sug
ggestions ffor
essing situa
ations where
re it is not possible
p
to meet all d
drawdown/re
retention tim
me
addre
guidellines and also
a
meet the
t flow durration criteria. The g
guidance do
ocumentatio
on
assum
mes that the
t
flow duration
d
criiteria take precedencce unless the user is
instruc
cted otherw
wise by the local munic
cipal permittting agenccy.
29
Santa Margaritaa Region Hydrollogy Model Guidance – April 20014
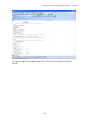
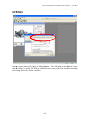
7. Produce reportt.
Click on
o the Repo
orts tool bar button (fourrth from the left) to generate a projeect report wiith
all of the
t project in
nformation and
a results.
The prroject report can be geneerated as eith
her a Microsooft Word file or a PDF ffile.
30
Santa Margaritaa Region Hydroology Model Guiidance – April 20014
Scroll down the Reeport screen
n to see all off the results.
31
Santa Margaritaa Region Hydrollogy Model Guidance – April 20014
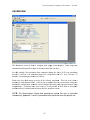
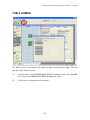
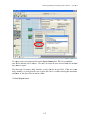
8. Sav
ve project.
To sav
ve the projecct click on Fiile in the upp
per left cornner and select Save As.
32
Santa Margaritaa Region Hydrollogy Model Guidance – April 20014
Selectt a file namee and save th
he SMRHM project file. The user ccan exit SMR
RHM and latter
reload
d the project file with all of its inform
mation by gooing to File, Open.
33
Santa Margaritaa Region Hydrollogy Model Guidance – April 20014
9. Exitt SMRHM.
To exiit SMRHM click
c
on Filee in the uppeer left cornerr and select Exit. Or cliick on the X in
the red
d box in the upper
u
right hand
h
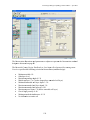
corner of the screenn.
34
Santa Margaritaa Region Hydrollogy Model Guidance – April 20014
MAIN SCRE
EENS
SMRH
HM has six main screen
ns. These main
m
screenss can be accessed througgh the buttoons
shown
n on the tool bar above or
o via the Vieew menu.
The siix main screeens are:
Map
M Information
General
G
Projeect Informatiion
Analysis
A
Reports
R
Tools
T
LID
L (Low Im
mpact Develo
opment) Anaalysis
Each is
i discussed in more detaail in the folllowing secti ons.
35
Santa Margaritaa Region Hydroology Model Guiidance – April 20014
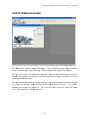
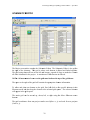
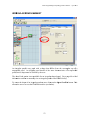
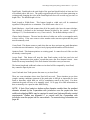
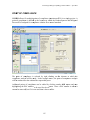
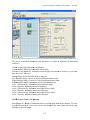
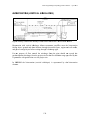
MAP
P INFORM
MATION SCREEN
S
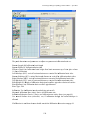
The Map
M screen contains
c
cou
unty informaation. The precipitationn gauge andd precipitatiion
factor are shown to
o the right of the map. They
T
are bassed on the prroject site loccation.
The usser can prov
vide site info
ormation (op
ptional). Thhe site namee and addresss will help to
identiffy the projecct on the Report screen
n and in thee printed repport provideed to the loccal
municipal permittiing agency.
The usser locates th
he project siite on the map
m screen byy using the mouse and lleft clickingg at
the project site lo
ocation. Rig
ght clicking on the mapp re-centers the view. The + andd –
button
ns zoom in and
a out, resp
pectively. The
T cross haiir button zoooms out to tthe full counnty
view. The arrow keys
k
scroll th
he map view
w.
36
Santa Margaritaa Region Hydroology Model Guiidance – April 20014
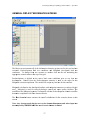
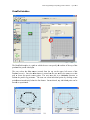
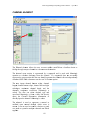
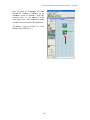
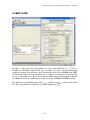
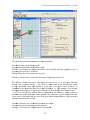
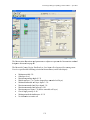
GEN
NERAL PR
ROJECT INFORMA
I
ATION SC
CREEN
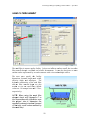
The Prroject screen
n contains all of the inforrmation aboout the projecct site for thhe two land uuse
scenarrios: Predev
velopment land
l
use co
onditions annd Mitigateed (developped) land uuse
conditions. To change
c
from
m one scenaario to anotther click oon the tab ccontaining tthe
priate scenarrio name at th
he top of thee grid.
approp
Predev
velopment is defined as
a the nativ
ve land coveer conditionns prior to any land uuse
develo
opment. Ru
unoff from the Predeveelopment sccenario is uused as the target for tthe
Mitigaated scenario
o compliancee. The modeel will acceppt any land uuse for this sccenario.
Mitigaated is defineed as the dev
veloped land
d use with m
mitigation meeasures (as sselected by tthe
user). Mitigated is used for sizing hyd
drologic conttrol and waater quality facilities. T
The
runofff from the Mitigated
M
scen
nario is com
mpared with tthe Predevellopment scennario runofff to
determ
mine compliaance with flo
ow duration criteria.
c
The Run
R Scenario
o button exeecutes the ru
unoff calcullations for thhe scenario shown on tthe
screen
n.
Note: Any chang
ges made by
y the user to
t the elemeent dimensiions and other input aare
not an
nalyzed by SMRHM
S
un
ntil the Run Scenario bu
utton is cliccked.
37
Santa Margarita Region Hydrology Model Guidance – April 2014
Below the Run Scenario button are the Elements. Each element represents a specific
stormwater-related feature (drainage elements, flow connections, BMPs, etc.) and is
described in more detail in the following section.
38
Santa Margaritaa Region Hydroology Model Guiidance – April 20014
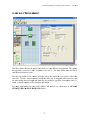
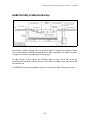
SCHE
EMATIC EDITOR
E
The Prroject screen
n also contaiins the Schem
matic Editorr. The Scheematic Editoor is the gridd to
the rig
ght of the elements. Th
his grid is where
w
each eelement is pllaced and linked togethher.
The grrid, using thee scroll bars on the left and
a bottom, expands as large as neeeded to contaain
all of the
t elementss for the project. A maxiimum of 5000 elements iss allowed.
NOTE
E: All movem
ment of watter on the grrid must bee from the toop of the grrid down.
The sp
pace to the riight of the grrid will conttain the approopriate elem
ment informaation.
To sellect and placce an elemeent on the grrid, first left
ft click on thhe specific eelement in tthe
Elements menu an
nd then drag the elementt to the seleccted grid squuare. The selected elemeent
will ap
ppear in the grid
g square.
The en
ntire grid caan be moveed up, down
n, left, or riight using thhe Move Ellements arroow
button
ns.
The grrid coordinaates from onee project can
n be saved ((Save x, y) and used for new projeccts
(Load x, y).
39
Santa Margaritaa Region Hydrollogy Model Guidance – April 20014
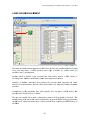
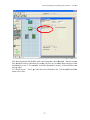
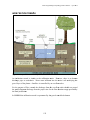
LAND
D USE BA
ASIN ELE
EMENT
The Laand use Basiin element reepresents a DMA
D
that caan have any combinationn of soils, lannd
cover, and land slopes. A DMA producces three typpes of runofff: (1) surfaace runoff, ((2)
interflo
ow, and (3) groundwaterr.
Surfacce runoff is defined as the overlan
nd flow thaat quickly reeaches a M
MS4 facility or
receiviing water. Su
urface runofff mainly com
mes from im
mpervious suurfaces.
Interflow is shallo
ow, subsurfface flow prroduced by pervious laand categoriies and variies
based on soil charracteristics and
a how thesse characteriistics are alttered by landd developmeent
practicces.
Groun
ndwater is th
he subsurfaace flow thaat typically does not eenter a MS44 facility, bbut
provid
des base flow
w directly to a channel.
The usser can speccify where each
e
of thesee three sourrces of flow
w should be directed. T
The
defaultt setting is for
fo the surfacce runoff and
d interflow tto go to the M
MS4 facilityy; groundwatter
should
d not be con
nnected unlesss there is observed
o
basse flow occuurring in MS
S4 facilities in
the DM
MA.
40
Santa Margarita Region Hydrology Model Guidance – April 2014
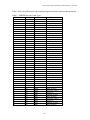
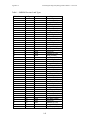
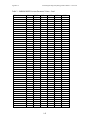
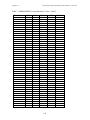
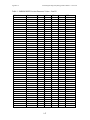
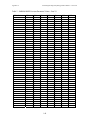
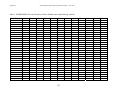
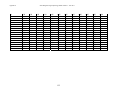
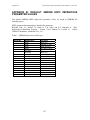
Table 1 shows the different pervious land types represented in the Land use Basin element.
Table 1. SMRHM Pervious Land Types
PERLND No.
1
2
3
4
5
6
7
8
9
10
11
12
13
14
15
16
17
18
19
20
21
22
23
24
25
26
27
28
29
30
31
32
33
34
35
36
37
38
39
40
41
42
43
Soil Type
A
A
A
A
A
A
A
A
A
A
A
A
A
A
A
A
B
B
B
B
B
B
B
B
B
B
B
B
B
B
B
B
C/D
C/D
C/D
C/D
C/D
C/D
C/D
C/D
C/D
C/D
C/D
Land Cover
Forest
Forest
Forest
Forest
Shrub
Shrub
Shrub
Shrub
Grass
Grass
Grass
Grass
Urban
Urban
Urban
Urban
Forest
Forest
Forest
Forest
Shrub
Shrub
Shrub
Shrub
Grass
Grass
Grass
Grass
Urban
Urban
Urban
Urban
Forest
Forest
Forest
Forest
Shrub
Shrub
Shrub
Shrub
Grass
Grass
Grass
Land Slope
Flat (0-5%)
Moderate (5-10%)
Steep (10-20%)
Very Steep (>20%)
Flat (0-5%)
Moderate (5-10%)
Steep (10-20%)
Very Steep (>20%)
Flat (0-5%)
Moderate (5-10%)
Steep (10-20%)
Very Steep (>20%)
Flat (0-5%)
Moderate (5-10%)
Steep (10-20%)
Very Steep (>20%)
Flat (0-5%)
Moderate (5-10%)
Steep (10-20%)
Very Steep (>20%)
Flat (0-5%)
Moderate (5-10%)
Steep (10-20%)
Very Steep (>20%)
Flat (0-5%)
Moderate (5-10%)
Steep (10-20%)
Very Steep (>20%)
Flat (0-5%)
Moderate (5-10%)
Steep (10-20%)
Very Steep (>20%)
Flat (0-5%)
Moderate (5-10%)
Steep (10-20%)
Very Steep (>20%)
Flat (0-5%)
Moderate (5-10%)
Steep (10-20%)
Very Steep (>20%)
Flat (0-5%)
Moderate (5-10%)
Steep (10-20%)
41
Santa Margarita Region Hydrology Model Guidance – April 2014
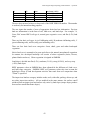
44
45
46
47
48
C/D
C/D
C/D
C/D
C/D
Grass
Urban
Urban
Urban
Urban
Very Steep (>20%)
Flat (0-5%)
Moderate (5-10%)
Steep (10-20%)
Very Steep (>20%)
The user does not need to know or keep track of the HSPF PERLND number. That number
is used only for internal tracking purposes.
The user inputs the number of acres of appropriate basin land use information. Pervious
land use information is in the form of soil, land cover, and land slope. For example, "A,
Grass, Flat" means NRCS soil type A, natural grass vegetative cover, and flat (0-5%) land
slope.
There are four basic soil types: A (well infiltrating soils), B (moderate infiltrating soils), C
(poor infiltrating soils), and D (really poor infiltrating soils).
There are four basic land cover categories: forest, shrub, grass and urban landscaped
vegetation.
Native land cover is assumed to be grass and refers to the natural (non-planted) vegetation.
In contrast, the developed landscape will consist of urban vegetation (lawns, flowers,
planted shrubs and trees). Urban vegetation is irrigated in SMRHM.
Land slope is divided into flat (0-5%), moderate (5-10%), steep (10-20%), and very steep
(>20%) land slopes.
HSPF parameter values in SMRHM have been adjusted for the different soil, land cover,
and land slope categories. SMRHM HSPF soil parameter values take into account the
hydrologic effects of land development activities that result from soil compaction when
"Urban" is specified.
The impervious land use category includes roads, roofs, sidewalks, parking, driveways, and
any other impervious surfaces. All are modeled in the same manner: the surface runoff
produced from an impervious land surface only varies by land slope (steeper slopes produce
more surface runoff than flatter slopes).
42
Santa Margaritaa Region Hydrollogy Model Guidance – April 20014
LATE
ERAL BA
ASIN ELEM
MENT (Pe
ervious)
Surfacce runoff dispersion fro
om impervio
ous surfacess onto adjaccent pervious land can be
modelled using pervious and impervious
i
lateral
l
basinns. For exam
mple, surfacce runoff froom
an imp
pervious parrking lot caan sheet flow
w onto an aadjacent lawnn prior to ddraining intoo a
MS4 facility.
f
Thiis action slow
ws the surfaace runoff annd allows foor some limitted infiltration
into th
he pervious lawn
l
soil prior to discharrging into a M
MS4 facilityy.
The peervious laterral basin is similar
s
to th
he standard lland use bassin except thhat the surfaace
runofff from the latteral basin goes
g
to anoth
her adjacent lateral basinn (imperviouus or perviouus)
rather than directly
y to a MS4 facility
f
or reeceiving watter. By definnition, the pervious laterral
basin contains
c
onlly a single peervious land
d type. Impeervious area is handled sseparately wiith
the im
mpervious lateral basin (L
Lateral I Bassin).
The usser selects th
he pervious lateral
l
basin
n land type b y checking tthe appropriiate box on tthe
Availa
able Soil Typ
pes (PERLN
NDs) screen
n. This inforrmation is auutomaticallyy placed in tthe
Soil Types
T
(PER
RLNDs) box
x above. Once
O
enteredd, the land type can be changed bby
clickin
ng on the Ch
hange button
n on the righ
ht.
The usser enters thee number off acres repressented by thee lateral basiin land type..
If the lateral basin
n contains tw
wo or more pervious
p
landd use types tthen the userr should creaate
b
for eacch.
a sepaarate lateral basin
43
Santa Margaarita Region Hyydrology Model G
Guidance – Apriil 2014
LATE
ERAL I BA
ASIN ELE
EMENT (IImperviou
us)
The im
mpervious laateral basin is
i similar to
o the standarrd land use bbasin exceptt that the suurface
runofff from the lateral imperv
vious basin goes
g
to anothher adjacentt lateral basiin (impervioous or
pervious) rather than
t
directly
y to a MS4
4 facility oor receiving water. Byy definitionn, the
imperv
vious laterall basin con
ntains only impervious land typess. Pervious area is hanndled
separaately with thee pervious laateral basin (Lateral
(
Basiin).
The usser selects th
he imperviou
us lateral bassin land typee by checkinng the approppriate box oon the
Availa
able Impervvious Covera
age’s (IMPL
PLNDs) screeen. This iinformation is automatiically
placed
d in the Impeervious Typee (IMPLND)
D) box abovee. Once enteered, the landd use type caan be
changeed by clickin
ng on the Ch
hange button
n on the rightt.
The usser enters the number off acres repreesented by thhe lateral im
mpervious basin land typee. To
model parking lott surface run
noff dispersiion onto adjjacent lawn connect thee Lateral I B
Basin
t the down
nstream Lateeral Basin ((the lawn). In the moddel's calculaations
(the parking lot) to
m the parkin
ng lot is addeed to the surfface of the laawn (urban vegetation). The
surfacee runoff from
total surface runofff will then be directed to MS4 faccility or receeiving waterr selected byy the
user.
44
Santa Margaritaa Region Hydroology Model Guiidance – April 20014
TRAP
PEZOIDA
AL POND ELEMEN
NT
In SM
MRHM theree is an ind
dividual
pond (detention basin)
b
element for
each type
t
of pon
nd and hyd
drologic
control facility. The pond element
e
shown
n above is for a trap
pezoidal
pond. This is the most commo
on type
of hyd
drologic conttrol facility.
A trap
pezoidal pon
nd has dimeensions
(bottom
m length and
d width, dep
pth, and
sideslo
opes) and an
a outlet sttructure
consistting of a riseer and one or
o more
orificees to contro
ol the releease of
runofff from the po
ond. A trap
pezoidal
i
the option to in
nfiltrate
pond includes
surfacee runoff, if the soiils are
approp
priate and there
t
is su
ufficient
depth to the underrlying groun
ndwater
table.
45
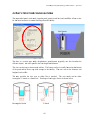
Santa Margarita Region Hydrology Model Guidance – April 2014
The user has the option to specify that different outlets be directed to different downstream
destinations, although usually all of the outlets go to a single downstream location.
Auto Pond will automatically size a trapezoidal pond to meet the required flow duration
criteria.
NOTE: Auto Pond is available only in the Mitigated scenario.
Quick Pond can be used to instantly add pond dimensions and an outlet configuration
without checking the pond for compliancy with flow duration criteria. Quick Pond is
sometimes used to quickly create a scenario and check the model linkages prior to sizing
the pond. Multiple clicks on the Quick Pond button incrementally increase the pond size.
The user can change the default name "Trapezoidal Pond 1" to another more appropriate
name, if desired.
Precipitation and evaporation must be applied to the pond unless the pond is covered. The
pond bottom elevation can be set to an elevation other than zero if the user wants to use
actual elevations. All pond stage values are relative to the bottom elevation. Negative
bottom elevations are not allowed.
The pond effective depth is the pond height (including freeboard) above the pond bottom.
It is not the actual elevation of the top of the pond.
Pond sideslopes are in terms of horizontal distance over vertical. A standard 3:1 (H: V)
sideslope would be given a value of 3. A vertical sideslope has a value of 0.
The pond bottom is assumed to be flat.
The pond outlet structure consists of a riser and zero to three orifices. The riser has a
height (typically one foot less than the effective depth) and a diameter. The riser can have
either a flat top or a weir notch cut into the side of the top of the riser. The notch can be
either rectangular, V-shaped, or a Sutro weir. More information on the riser weir shapes
and orifices is provided later in this guidance document.
After the pond is given dimensions and outlet information the user can view the resulting
stage-storage-discharge table by clicking on the Open Table arrow in the lower right corner
of the pond information screen. This table hydraulically defines the pond's characteristics.
The user can use either Auto Pond to size a pond or can manually size a pond. Follow the
steps below for manual sizing a pond using an outlet configuration with one orifice and a
riser with rectangular notch (this is usually the most efficient design):
1.
2.
Input a bottom orifice diameter that allows a discharge equal to the lower
threshold (e.g., 10% of 2-year) Predevelopment flow for a stage equal to 2/3 the
height of the riser. This discharge can be checked by reviewing the pond's
stage-storage-discharge table.
Input a riser rectangular notch height equal to 1/3 of the height of the riser.
46
Santa Margarita Region Hydrology Model Guidance – April 2014
3.
4.
5.
6.
7.
Initially set the riser notch width to 0.1 foot.
Run Predevelopment and Mitigated scenarios.
Go to Analysis screen and check flow duration results.
If pond passes flow duration criteria then decrease pond dimensions.
If pond fails flow duration criteria then change (in order of priority) bottom
orifice diameter, riser notch width, pond dimensions.
Iterate until there is a good match between Predevelopment and Mitigated flow
duration curves or fatigue sets in.
Pond input information:
Bottom Length (ft): Pond bottom length. Bottom Width (ft): Pond bottom width
Effective Depth (ft): Pond height from pond bottom to top of riser plus at least 0.5 foot
extra
Left Sideslope (H/V): ratio of horizontal distance to vertical; 0 (zero) for vertical pond
sides
Bottom Sideslope (H/V): ratio of horizontal distance to vertical; 0 (zero) for vertical pond
sides
Right Sideslope (H/V): ratio of horizontal distance to vertical; 0 (zero) for vertical pond
sides
Top Sideslope (H/V): ratio of horizontal distance to vertical; 0 (zero) for vertical pond
sides
Riser Height (ft): Height of overflow pipe above pond bottom
Riser Diameter (in): Pond overflow pipe diameter
Riser Type (options): Flat or Notched
Notch Type: Rectangular, V-Notch, or Sutro.
For a rectangular notch:
Notch Height (feet): distance from the top of the weir to the bottom of the notch
Notch Width (feet): width of notch; cannot be larger than the riser circumference.
For more information on riser notch options and orifices see discussion in OUTLET
STRUCTURE CONFIGURATIONS section.
Infiltration: Yes (infiltration into the underlying native soil)
Measured Infiltration Rate (in/hr): Native soil infiltration rate
Infiltration Reduction Factor: 1/Native soil infiltration rate safety factor (see page 69)
Use Wetted Surface Area (sidewalls): Yes, if infiltration through the pond sideslopes is
allowed
If infiltration is used then the user should consult the Infiltration discussion on page 69.
NOTE: See Appendix C or consult with the local municipal permitting agency for
additional considerations regarding infiltration and determination of the appropriate
infiltration reduction factor.
A pond receives precipitation on and evaporation from the pond surface. The Precipitation
Applied to Facility and Evaporation Applied to Facility boxes should be checked.
47
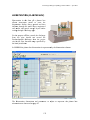
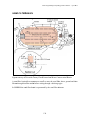
Santa Margaarita Region Hyddrology Model G
Guidance – Aprill 2014
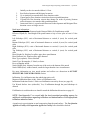
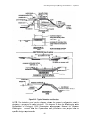
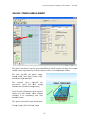
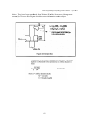
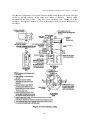
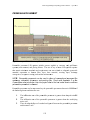
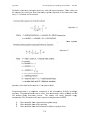
NOTE
E: The detention pond section dia
agram show
ws the gene
eral configu
uration use
ed in
design
ning a pond
d and its ou
utlet structure. This diiagram is frrom the Wa
ashington S
State
Deparrtment of Ecology's 2005 Sto
ormwater M
Manageme
ent Manual for Wesstern
Washington. Consult
C
with
h the Cope
ermittee wi
with jurisdicttion over p
project site
e on
equirementts.
speciffic design re
48
Santa Margaarita Region Hyddrology Model G
Guidance – Aprill 2014
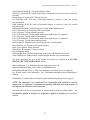
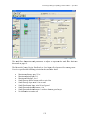
VAUL
LT ELEM
MENT
The sttorage vault has all of th
he same chaaracteristics of the trapezzoidal pond, except thatt the
user do
oes not speccify the sideslopes (by definition
d
theey are zero) and the vauult is assumeed to
have a lid (no preccipitation or evaporation).
Auto Vault
V
and Qu
uick Vault work
w
the sam
me way as A
Auto Pond annd Quick Poond. Go to ppage
48 to find
f
information on how to manually
y size a vaultt or other HM
MP facility.
NOTE
E: Auto Vau
ult is availab
ble only in the
t Mitigateed scenario..
Vault input
i
inform
mation:
Bottom
m Length (ft)): Vault botttom length
Bottom
m Width (ft): Vault botto
om width
Effectiive Depth (fft): Vault heiight from vaault
bottom
m to top of riser
r
plus att least 0.5 fo
oot
extra
Riser Height (ft): Height of overflow piipe
above vault bottom
m
Riser Diameter (in): Vault overflow piipe
diametter
Riser Type
T
(option
ns): Flat or Notched
N
Notch Type: Rectaangular, V-N
Notch, or Suttro
49
Santa Margarita Region Hydrology Model Guidance – April 2014
For a rectangular notch:
Notch Height (ft): distance from the top of the weir to the bottom of the notch
Notch Width (ft): width of notch; cannot be larger than the riser circumference
For more information on riser notch options and orifices see discussion in OUTLET
STRUCTURE CONFIGURATIONS section.
Infiltration: Yes (infiltration into the underlying native soil) Measured Infiltration Rate
(in/hr): Native soil infiltration rate
Infiltration Reduction Factor: 1/Native soil infiltration rate safety factor (see page 69)
Use Wetted Surface Area (sidewalls): Yes, if infiltration through the vault sides is allowed
If infiltration is used then the user should consult the Infiltration discussion on page 69.
NOTE: See Appendix C or consult with the Copermittee with jurisdiction over the
project site for additional considerations regarding infiltration and determination of
the appropriate infiltration reduction factor.
A vault is usually covered and does not receive precipitation on and evaporation from the
vault surface. The Precipitation Applied to Facility and Evaporation Applied to Facility
boxes should not be checked unless the vault top is open to the atmosphere.
50
Santa Margarrita Region Hyddrology Model G
Guidance – Aprill 2014
TANK
K ELEME
ENT
A storrage tank is a cylinder placed
p
on itts side. Thee user speciffies the tankk's diameter and
length.
Auto Tank
T
and Qu
uick Tank work
w
the sam
me way as A
Auto Pond annd Quick Poond. Go to ppage
48 to find
f
information on how to manually
y size a vaultt or other hyydrologic conntrol facilityy.
NOTE
E: Auto Tan
nk is availab
ble only in the Mitigateed scenario.
There is a Quick Tank
T
option
n that createss a tank,
but do
oes not check for complliance with the
t flow
duratio
on criteria.
Tank input
i
inform
mation:
Tank Type:
T
Circullar or Arched
d
For Ciircular:
Diameeter (ft): Tan
nk diameter
Length
h (ft): Tank length
l
For Arrched:
Heightt (ft): Tank height
h
51
Santa Margaritta Region Hydroology Model Guuidance – April 22014
Width
h (ft): Tank width
w
(at wid
dest point)
Length
h (ft): Tank length
Riser Height (ft):: Height of overflow pipe
p
above tank bottom
m; must be less than taank
diameter or heightt
D
(in
n): Tank oveerflow pipe diameter
d
Riser Diameter
Riser Type
T
(option
ns): Flat or Notched
N
Notch Type: Rectaangular, V-N
Notch, or Suttro
For a rectangular
r
notch:
n
Notch Height (feeet): distancee from the top
t of the
weir to
o the bottom
m of the notch
h
Notch Width (feet): width of notch; cannot
c
be
larger than the riseer circumfereence
For more
m
informaation on riseer notch options and
orificees
see
discussion
n
in
OUTLET
O
STRU
UCTURE CO
ONFIGURA
ATIONS seection.
Infiltraation: Yes (infiltration into the underlying
u
native soil)
Measu
ured Infiltrattion Rate (in//hr): Native soil infiltrattion rate
Infiltraation Reducttion Factor: 1/Native soiil infiltrationn rate safety factor (see ppage 69)
Use Wetted
W
Surfacce Area (sideewalls): Yess, if infiltratiion through tthe tank sidees is allowedd
If infilltration is used then the user
u should consult
c
the IInfiltration ddiscussion onn page 69.
NOTE
E: See App
pendix C orr consult with
w the Cop
permittee w
with jurisdicction over tthe
projec
ct site for additional
a
consideratio
c
ons regardiing infiltratio
on and dettermination of
the ap
ppropriate infiltration
i
re
eduction fa
actor.
A tank
k is covered
d and does not receivee precipitatioon on and eevaporation from the taank
surface. The Preccipitation Ap
pplied to Fa
acility and E
Evaporation Applied to Facility boxxes
should
d not be checcked.
52
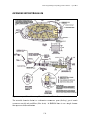
Santa Margaritaa Region Hydrollogy Model Guidance – April 20014
IRRE
EGULAR POND
P
EL
LEMENT
An irrregular pond
d is any pon
nd with a shape
s
that ddiffers from the rectanggular top off a
trapezo
oidal pond. An irregullar pond hass all of the same charaacteristics off a trapezoiddal
pond, but
b its shapee must be defined by the user.
The Auto
A
Pond op
ption is not available
a
forr an irregularr-shaped ponnd. Go to ppage 48 to finnd
inform
mation on how
w to manuallly size an irrregular pondd or other HM
MP facility.
To creeate the shap
pe of an irreg
gular pond th
he user clickks on the Oppen PondPaad button. Thhis
allowss the user to access the PondPad interface (see beelow).
53
Santa Margaritaa Region Hydrollogy Model Guidance – April 20014
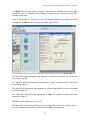
Pond
dPad Interrface
The Po
ondPad interrface is a grrid on which
h the user caan specify thhe outline off the top of tthe
pond and
a the pond
d's sideslopess.
The user selects the
t Line bu
utton (secon
nd from the top on the upper left corner of tthe
Pad screen). Once the Line
L
button is turned onn the user m
moves the m
mouse over tthe
PondP
grid to
o locate thee pond's corrner points. The user ddoes this in a clockwisse direction to
outlinee the pond's top perimetter. The useer can selectt individual points by cclicking on tthe
point button
b
immeediately belo
ow the line button.
b
Oncee selected, anny individuaal point can be
moved
d or repositio
oned.
54
Santa Margarita Region Hydrology Model Guidance – April 2014
The default sideslope value is 3 (3:1). The sideslopes can be individually changed by right
clicking on the specific side (which changes the line color from black to red) and then
entering the individual sideslope value in the slope text box.
The grid scale can be changed by entering a new value in the grid scale box. The default
value is 200 feet.
PondPad Controls and Numbers
Clear:
Line:
Point:
The Clear button clears all of the lines on the grid
The Line button allows the user to draw new lines with the mouse
The Point button allows the user to move individual points to alter the pond
shape and size
Sq Ft:
Grid Scale:
Grid X:
Grid Y:
Converts the computed pond area from square feet to acres and back.
Changes the length of a grid line. Default grid scale is 200 feet
Horizontal location of the mouse pointer on the grid (0 is the upper left
corner)
Vertical location of the mouse pointer on the grid (0 is the upper left corner)
Area:
Slope:
Top area of the pond (either in square feet or acres)
Sideslope of the selected line (side of the pond)
55
Santa Margaritaa Region Hydroology Model Guiidance – April 20014
GRAVEL TRE
ENCH BED
D ELEME
ENT
The grravel trench bed is used to spread an
nd infiltrate runoff, but aalso can havve one or moore
surfacee outlets represented by an outlet strructure with a riser and m
multiple orifi
fices.
The user
u
specifi
fies the treench length
h,
bottom
m width, tottal depth, bottom slopee,
and lefft and right sideslopes.
s
The material layers rep
present the
gravel//rock layers and th
heir design
n
characcteristics (thiickness and porosity).
p
Quick Trench willl instantly crreate a graveel
trench bed with default vallues withou
ut
checkiing it for compliancy
y with flow
w
duratio
on criteria.
The grravel trench
h bed input information
n:
Trench
h Length (ft)): Trench bed
d length.
56
Santa Margarita Region Hydrology Model Guidance – April 2014
Trench Bottom Width (ft): Trench bed bottom width
Effective Total Depth (ft): Height from bottom of trench bed to top of riser plus at least 0.5
feet extra
Bottom Slope of Trench (ft/ft): Must be non-zero
Left Sideslope (ft/ft): H/V ratio of horizontal distance to vertical; 0 (zero) for vertical
trench bed sides
Right Sideslope (ft/ft): H/V ratio of horizontal distance to vertical; 0 (zero) for vertical
trench bed sides
Infiltration Rate (in/hr): Trench bed gravel or other media infiltration rate
Layer 1 Thickness (ft): Trench top media layer depth
Layer 1 Porosity: Trench top media porosity.
Layer 2 Thickness (ft): Trench middle media layer depth (Layer 2 is optional)
Layer 2 Porosity: Trench middle media porosity
Layer 3 Thickness (ft): Trench bottom media layer depth (Layer 3 is optional)
Layer 3 Porosity: Trench bottom media porosity
Riser Height (ft): Height of trench overflow pipe above trench surface
Riser Diameter (in): Trench overflow pipe diameter
Riser Type (options): Flat or Notched
Notch Type: Rectangular, V-Notch, or Sutro
For a rectangular notch:
Notch Height (feet): distance from the top of the weir to the bottom of the notch
Notch Width (feet): width of notch; cannot be larger than the riser circumference
For more information on riser notch options and orifices see discussion in OUTLET
STRUCTURE CONFIGURATIONS section.
Native Infiltration: Yes (infiltration into the underlying native soil)
Measured Infiltration Rate (in/hr): Native soil infiltration rate
Infiltration Reduction Factor: 1/Native soil infiltration rate safety factor (see page 69)
Use Wetted Surface Area (sidewalls): Yes, if infiltration through the trench sideslopes is
allowed.
If infiltration is used then the user should consult the Infiltration discussion on page 69.
NOTE: See Appendix C or consult with the Copermittee with jurisdiction over the
project site for additional considerations regarding infiltration and determination of
the appropriate infiltration reduction factor.
Gravel trench bed receives precipitation on and evaporation from the trench surface. The
Precipitation Applied to Facility and Evaporation Applied to Facility boxes should be
checked.
57
Santa Margaritaa Region Hydroology Model Guiidance – April 20014
SAND
D FILTER
R ELEMEN
NT
The saand filter is a water quality facility. It does not infiltrate surrface runoff,, but is usedd to
filter runoff
r
throu
ugh a mediu
um and send
d it downstrream. It caan also havee one or moore
surfacee outlets represented by an outlet strructure with a riser and m
multiple oriffices.
The user
u
must specify th
he facility
dimensions (botto
om length and
a
width,
a
sideslopes. The
effective depth, and
hydrau
ulic conducttivity of the sand filter
and th
he filter maaterial depth
h are also
needed
d to size th
he sand filtter (default
values are 1.0 inch
h per hour an
nd 1.5 feet,
respectively).
NOTE
E: When using
u
the sand
s
filter
eleme
ent check with Appen
ndix C or
the Co
opermittee with jurisdiiction over
the project
p
site
e to deterrmine the
requirred treatme
ent standard
d (percent
of the
e total runo
off volume treated
t
by
the sa
and filter).
58
Santa Margarita Region Hydrology Model Guidance – April 2014
The filter discharge is calculated using the equation Q = K*I*A, where Q is the discharge
in cubic feet per second (cfs). K equals the hydraulic conductivity (inches per hour). For
sand filters K = 1.0 in/hr. Sand is the default medium. If another filtration material is used
then the design engineer should enter the appropriate K value supported by documentation
and approval by the reviewing authority.
Design of a sand filter requires input of facility dimensions and outlet structure
characteristics, running the sand filter scenario, and then checking the volume calculations
to see if the Percent Filtered equals or exceeds the treatment standard percentage. If the
value is less than the treatment standard percentage then the user should increase the size of
the sand filter dimensions and/or change the outlet structure. The sand filter input
information:
Bottom Length (ft): Sand filter bottom length
Bottom Width (ft): Sand filter bottom width
Effective Depth (ft): Height from bottom of sand filter to top of riser plus at least 0.5 feet
extra
Left Sideslope (ft/ft): H/V ratio of horizontal distance to vertical; 0 (zero) for vertical sand
filter sides
Bottom Sideslope (ft/ft): H/V ratio of horizontal distance to vertical; 0 (zero) for vertical
sand filter sides
Right Sideslope (ft/ft): H/V ratio of horizontal distance to vertical; 0 (zero) for vertical sand
filter sides
Top Sideslope (ft/ft): H/V ratio of horizontal distance to vertical; 0 (zero) for vertical sand
filter sides
Riser Height (ft): Height of sand filter overflow pipe above sand filter surface
Riser Diameter (in): Sand filter overflow pipe diameter
Riser Type (options): Flat or Notched
Notch Type: Rectangular, V-Notch, or Sutro
For a rectangular notch:
Notch Height (feet): distance from the top of the weir to the bottom of the notch
Notch Width (feet): width of notch; cannot be larger than the riser circumference.
For more information on riser notch options and orifices see discussion in OUTLET
STRUCTURE CONFIGURATIONS section.
Infiltration: Yes (infiltration through the filter material)
Hydraulic Conductivity (in/hr): Filtration rate through the sand filter
Filter material depth (ft): Depth of sand filter material (for runoff filtration)
Sand filter receives precipitation on and evaporation from the sand filter surface. The
Precipitation Applied to Facility and Evaporation Applied to Facility boxes should be
checked.
59
Santa M
Margarita Regionn Hydrology Moodel Guidance – April 2014
OUT
TLET STR
RUCTURE
E CONFIG
GURATION
NS
The trrapezoidal po
ond, vault, taank, irregulaar pond, gravvel trench beed, and sandd filter all usse a riser
for thee outlet struccture to contrrol dischargee from the faacility.
The riiser is a verrtical pipe with
w a heightt above ponnd bottom (ttypically onne foot less tthan the
effectiive depth). The
T user speecifies the risser height annd diameter.
The riser can havee up to threee round orificces. The bo ttom orifice is usually loocated at thee bottom
of the pond and/o
or above any
y dead storaage in the faacility. Thee user can sset the diameter and
heightt of each oriffice.
The user
u
specifiees the riser type as eitther flat or notched. The weir nnotch can bbe either
rectangular, V-nottch, or a Sutrro weir. Thee shape of eaach type of w
weir is show
wn below.
Rectan
ngular Notch
h
V-Notch
60
Sutro
Santa Margarita Region Hydrology Model Guidance – April 2014
By selecting the appropriate notch type the user is then given the option to enter the
appropriate notch type dimensions.
Riser and orifice equations used in SMRHM are provided below.
Headr = the water height over the notch/orifice bottom.
q = discharge
Riser Head Discharge:
Head = water level above riser
q = 9.739 * Riser Diameter * Head ^ 1.5
Orifice Equation:
q = 3.782 * (Orifice Diameter) ^ 2 * SQRT(Headr)
Rectangular Notch:
b = NotchWidth *- (1- 0.2 * Headr)
where b >= 0.8
q = 3.33 * b * Headr ^ 1.5
Sutro:
Wh = Top Width + {(Bottom Width- Top Width)/Notch Height }* Headr
Wd = Bottom Width - Wh (the difference between the bottom and top widths)
Q1 = (rectangular notch q where Notch Width = Wh)
Q2 = (rectangular notch q where Notch Width = Wd)
q = Q1 + Q2 / 2
V-Notch:
Notch Bottom = height from bottom of riser to bottom of notch
Theta = Notch Angle
a = 2.664261 - 0.0018641 * Theta + 0.00005761 * Theta ^2
b = -0.48875 + 0.003843 * Theta - 0.000092124 * Theta ^2
c = 0.3392 - 0.0024318 * Theta + 0.00004715 * Theta ^2
Y over H = Headr / (NotchBottom + Headr)
Coef = a + b * Headr + c * Headr ^2
q = (Coef * Tan(Theta / 2)) * (Headr ^ (5 / 2))
These equations are provided from the Washington State Department of Ecology’s 2005
Stormwater Management Manual for Western Washington. The outlet designs are shown
61
Santa Margaritaa Region Hydrollogy Model Guidance – April 20014
below.. They have been reprod
duced from Volume
V
III oof the Stormw
water Manaagement
Manua
al for Westerrn Washingto
on which haas more inforrmation on th
the subject.
62
Santa Margaritaa Region Hydrollogy Model Guidance – April 20014
63
Santa Margaritaa Region Hydrollogy Model Guidance – April 20014
The ph
hysical confiiguration of the outlet structure shouuld include pprotection foor the riser aand
orifices to preven
nt clogging of the outtlet from ddebris or seediment. V
Various outllet
configu
urations are shown below. They have been reproduced from Volum
me III of tthe
Stormw
water Manag
gement Man
nual for Wesstern Washinngton which has more in
nformation on
the sub
bject.
64
Santa Margaritaa Region Hydrollogy Model Guidance – April 20014
Riserr protection structures. Diagrams
D
coourtesy of W
Washington S
State
65
Depaartment of Ecology.
Santa Margaritaa Region Hydrollogy Model Guidance – April 20014
INFIL
LTRATION
Infiltraation of sto
ormwater ru
unoff is a
recomm
mended solution
s
iff certain
conditions are met. These conditions
include: a soils report,, testing,
ground
dwater proteection, pre-seettling, and
approp
priate constru
uction techn
niques.
NOTE
E: See App
pendix C or
o consult
with th
he Coperm
mittee with ju
urisdiction
over the projec
ct site for additional
consid
derations regarding
r
infiltration
and determinatio
d
on of the ap
ppropriate
infiltra
ation reducttion factor.
The usser clicks on
n the Infiltraation option
arrow to change in
nfiltration frrom NO to
YES.
This actiivates the infiltration
input options:
o
meaasured infilttration rate,
infiltraation reductiion factor, an
nd whether
or nott to allow in
nfiltration th
hrough the
wetted
d sideslopes/walls.
The in
nfiltration red
duction facto
or is a multiiplier for thee measured iinfiltration raate and shouuld
have a value of 1.0
00 or less. It
I is the samee as the inveerse of a safeety factor. F
For example, a
safety factor of 2 is equal to a reduction faactor of 0.50 .
Infiltraation occurs only through the bottom
m of the facillity if the weetted surfacee area optionn is
turned
d off. Otherw
wise the entirre wetted su
urface area iss used for inffiltration.
After the
t model iss run and flo
ow is routed
d through thhe infiltrationn facility thee total volum
me
infiltraated, total volume throu
ugh the riserr, total voluume throughh the facilityy, and perceent
infiltraated are repo
orted on thee screen. Iff the percentt infiltrated is 100% then there is nno
surfacee discharge from
f
the faccility. The percent infiltrrated can be less than 1000% as long as
the surrface discharrge does not exceed the flow
f
duratioon criteria.
66
Santa Margaritaa Region Hydroology Model Guiidance – April 20014
AUTO
O POND
Auto Pond
P
automatically creaates a pond size and deesigns the ouutlet structurre to meet tthe
flow duration
d
critteria. The user can eitther create a pond from
m scratch oor optimize an
existin
ng pond design.
Auto Pond
P
requirees that the Prredevelopmeent and Mitiigated basinss be definedd prior to usiing
Auto Pond.
P
Click
king on the Auto
A
Pond button bringgs up the Auuto Pond wiindow and tthe
associaated Auto Po
ond controlss.
Auto Pond
P
contro
ols:
Autom
matic Pond Adjuster:
A
Th
he slider at th
he top of the Auto Pond window alloows the userr to
decidee how thorou
ughly the pon
nd will be deesigned for eefficiency. T
The lowest ssetting (01 min)) at the left constructs
c
an
n initial pond
d without chhecking the fflow duratioon criteria. T
The
second
d setting to the right creates and sizes a ponnd to pass thhe flow durration criterria;
howev
ver, the pond
d is not neceessarily optim
mized. The higher settinngs increase the amount of
optimiization. The highest seetting (farth
hest right) w
will size thee most efficiient (smalleest)
pond, but
b will resu
ult in longer computation
nal time.
67
Santa Margarita Region Hydrology Model Guidance – April 2014
Pond Depth: Pond depth is the total depth of the pond and should include at least one foot
of freeboard (above the riser). The pond's original depth will be used when optimizing an
existing pond; changing the value in the Pond Depth text box will override any previous set
depth value. The default depth is 4 feet.
Pond Length to Width Ratio: This bottom length to width ratio will be maintained
regardless of the pond size or orientation. The default ratio value is 1.0.
Pond Sideslopes: Auto Pond assumes that all of the pond's sides have the same sideslope.
The sideslope is defined as the horizontal distance divided by the vertical. A typical
sideslope is 3 (3 feet horizontal to every 1 foot vertical). The default sideslope value is 3.
Choose Outlet Structure: The user has the choice of either one orifice or rectangular notch
or three orifices. If the user wants to select another outlet structure option then the pond
must be manually sized.
Create Pond: This button creates a pond when the user does not input any pond dimensions
or outlet structure information. Any previously input pond information will be deleted.
Optimize Pond: This button optimizes an existing pond. It cannot be used if the user has
not already created a pond.
Accept Pond: This button will stop the Auto Pond routine at the last pond size and
discharge characteristics that produce a pond that passes the flow duration criteria. Auto
Pond will not stop immediately if the flow duration criteria have not yet been met.
The bottom length and width and volume at riser head will be computed by Auto Pond;
they cannot be input by the user.
Auto Vault and Auto Tank operates the same way as Auto Pond.
There are some situations where Auto Pond will not work. These situations occur when
complex routing conditions upstream of the pond make it difficult or impossible for Auto
Pond to determine which land use will be contributing runoff to the pond. For these
situations the pond will have to be manually sized. Go to page 48 to find information on
how to manually size a pond or other HMP facility.
NOTE: If Auto Pond selects a bottom orifice diameter smaller than the smallest
diameter allowed by the Copermittee with jurisdiction over the project site then
additional mitigating BMPs may be required to meet local hydromodification control
requirements. Please see Appendix C or consult with the Copermittee with
jurisdiction over the project site for more details. For manual sizing information see
page 48.
68
Santa Margaritaa Region Hydrollogy Model Guidance – April 20014
CHA
ANNEL EL
LEMENT
The Channel
C
elem
ment allows the user to
o route surfa
face runoff ffrom a landd use basin or
facility
y through an
n open chann
nel to a down
nstream desttination.
The channel
c
crosss section is representeed by a traapezoid and is used with Manningg's
equation to calcu
ulate discharrge from th
he channel. If a trapeezoid does nnot accurateely
hould repressent the channnel with an independenttly
represent the crosss section then the user sh
U X-Sectioons option.
calculaated SSD Taable elementt or use the Use
The user
u
inputs channel bo
ottom width
h, channel
length
h, channel bo
ottom slope, channel leftt and right
sideslo
opes, maxim
mum chann
nel depth, and the
channeel's roughn
ness coefficient (Man
nning's n
value)). The userr can selecct channel type and
associated Manning's n from
m a table lisst directly
above the Chan
nnel Dimen
nsion inform
mation or
directlly input the channel's
c
Maanning's n vaalue.
The channel
c
is used to rep
present a natural
n
or
artificiial open ch
hannel thro
ough which water is
routed
d. It can be used to conn
nect a basin to a pond
or a po
ond to a pon
nd or multiplle channels can
c linked
togeth
her.
69
Santa Margarita Region Hydrology Model Guidance – April 2014
Channel input information:
Channel Bottom Width (ft): Open channel bottom width
Channel Length (ft): Open channel length
Manning's n coefficient: Open channel roughness coefficient (user menu selected or input)
Slope of Channel (ft/ft): Open channel bottom slope
Left Sideslope of Channel (ft/ft): H/V ratio of horizontal distance to vertical; 0 (zero) for
vertical channel sides
Right Sideslope of Channel (ft/ft): H/V ratio of horizontal distance to vertical; 0 (zero)
for vertical channel sides
Maximum Channel Depth (ft): Height from bottom of channel to top of channel bank.
Infiltration: Yes (infiltration into the underlying native soil)
Measured Infiltration Rate (in/hr): Native soil infiltration rate
Infiltration Reduction Factor: 1/Native soil infiltration rate safety factor (see page 69)
Use Wetted Surface Area (sidewalls): Yes, if infiltration through the channel sideslopes is
allowed.
If infiltration is used then the user should consult the Infiltration discussion on page 69.
NOTE: See Appendix C or consult with the Copermittee with jurisdiction over the
project site for additional considerations regarding infiltration and determination of
the appropriate infiltration reduction factor.
70
Santa Margaritaa Region Hydrollogy Model Guidance – April 20014
FLOW
W SPLITT
TER ELEM
MENT
The flo
ow splitter divides
d
the runoff
r
and sends it to tw
wo different destinationss. The splittter
has a primary
p
exitt (exit 1) and
d a secondarry exit (exit 2). The useer defines hoow the flow
w is
split beetween thesee two exits.
The usser can defin
ne a flow co
ontrol structu
ure with a riiser and from
m one to thrree orifices ffor
each exit. The flow control sttructure work
ks the same way as the ppond outlet structure, wiith
ht and diameter, the riserr weir type ((flat, rectanggular notch, V
Vthe useer setting thee riser heigh
notch, or Sutro), an
nd the orificce diameter and
a height.
For more
m
informaation on risser notch op
ptions and oorifices see discussion in OUTLE
ET
STRU
UCTURE CO
ONFIGURA
ATIONS secction.
71
Santa Margaritaa Region Hydrollogy Model Guidance – April 20014
The seecond option
n is that the flow
f
split caan be based oon a flow thhreshold. Thhe user sets tthe
flow th
hreshold value in cubic feet
f per seco
ond (cfs) forr exit 1 at whhich flows inn excess of tthe
thresho
old go to ex
xit 2. For ex
xample, if th
he flow thresshold is set tto 5 cfs thenn all flows leess
than orr equal
to 5 cffs go to exit 1. Exit 2 gets
g only the excess flow
w above the 5 cfs threshoold (total floow
minus exit 1 flow)).
72
Santa Margaritaa Region Hydrollogy Model Guidance – April 20014
TIME
E SERIES
S ELEMEN
NT
SMRH
HM uses tim
me series of precipitation, evaporatiion, and runnoff stored iin its databaase
(HSPF
F WDM file)). The user has the optio
on to create or use a tim
me series file external froom
SMRH
HM in SMRH
HM. This may
m be a tim
me series of flow values created by another HSP
PF
model. An examp
ple is offsitee runoff enteering a projeect site. If tthis offsite rrunoff is in an
existin
ng WDM filee and is the same period
d as SMRHM
M data and the same siimulation tim
me
step (1
15-minute) th
hen it can bee linked to SMRHM moddel using thee Time Seriees element.
To link
k the externaal time series to SMRHM
M the user cllicks on the Choose WD
DM button annd
identiffies the exteernal WDM file. The external WD
DM's indiviidual time sseries files aare
shown
n in the Timee Series Outt box. The selected inpuut dataset is tthe time seriies that will be
used by
b SMRHM.
73
Santa Margaritaa Region Hydroology Model Guiidance – April 20014
STAG
GE-STOR
RAGE-DIS
SCHARGE
E TABLE
E
The stage-storage
s
e-discharge table hydrraulically reepresents anny facility that requirres
stormw
water runofff routing. Th
he table is au
utomaticallyy generated bby SMRHM when the usser
inputs storage faciility dimensiions and outtlet structuree informatioon. SMRHM
M generates 91
o stage, surrface area, sttorage, surfaace dischargge, and infilttration valuees starting att a
lines of
stage value of zeero (facility bottom heiight) and inncreasing inn equal incrrements to tthe
mum stage vaalue (facility
y effective deepth).
maxim
When the user or SMRHM
S
ch
hanges a faciility dimensiion (for exam
mple, bottom
m length) or an
orificee diameter orr height, thee model imm
mediately reccalculates thhe stage-storaage- discharrge
table.
The usser can inputt to SMRHM
M a stage-sto
orage-dischaarge table creeated outsidde of SMRHM
M.
To usee a stage-sto
orage-dischaarge table crreated out off SMRHM tthe SSD Taable elementt is
requireed. See thee SSD Tablee element deescription beelow for moore informatiion on how to
load su
uch a table to
o SMRHM program.
p
74
Santa Margaritaa Region Hydrollogy Model Guidance – April 20014
SSD TABLE ELEMENT
E
T
The SSD Table iss a stage-sto
orage-dischaarge table exxternally prooduced by thhe user and is
identiccal in formaat to the stag
ge-storage-d
discharge tabbles generateed internallyy by SMRH
HM
for pon
nds, vaults, tanks,
t
chann
nels, etc.
The eaasiest way to
o create a SSD Table ou
utside of SM
MRHM is too use a spreaadsheet withh a
separaate column for
f stage, su
urface area, storage, andd discharge (in that ordder). Save tthe
spread
dsheet file as
a a commaa-delimited file. A texxt file can also be creeated, if moore
conven
nient.
The SS
SD Table mu
ust use the following
fo
uniits: Stage: feeet
Surfacce Area: acrees
Storag
ge: acre-feet
Dischaarge: cfs
A fifth
h column can be used to
o create a seecond dischaarge (cfs). T
This second discharge ccan
be infiiltration or a second surfface discharg
ge.
75
Santa Margaritaa Region Hydrollogy Model Guidance – April 20014
Certain
n rules applly to the SSD
D Table wh
hether it is ccreated insidde or outsidee of SMRHM
M.
These rules are:
1.
1
Stage (feet)
(
must start at zero
o and increaase with eacch row. Thhe incrementtal
increase does not have
h
to be co
onsistent.
2.
2
Storagee (acre-feet) must start at
a zero and inncrease withh each row. S
Storage valuues
should be physicallly based on
n the corressponding deppth and surrface area, bbut
HM does not check extern
nally generat
ated storage vvalues.
SMRH
3.
3
Discharrge (cfs) mu
ust start at zero.
z
Dischharge does nnot have to increase wiith
each ro
ow. It can sttay constant or even deccrease. Disccharge cannoot be negativve.
Discharrge should be based on
n the outlett structure's physical diimensions annd
charactteristics, butt SMRHM does not ccheck externnally generaated discharrge
values.
4.
4
Surfacee area (acres) is only used
u
if preciipitation to aand evaporaation from tthe
facility
y are applied..
To inp
put an extern
nally generated SSD Tab
ble, first creaate and save tthe table outtside of
SMRH
HM. Use thee Browse buttton to locate and load thhe file into S
SMRHM.
76
Santa Margarita Region Hydrology Model Guidance – April 2014
The first three columns (Stage, Area, and Storage) will automatically show in the table. To
use the additional columns (Column 4, 5, etc.) click on the Not Used at the head of the
table and select the appropriate option. For externally calculated discharge (cfs) select
Manual in Column 4. To have SMRHM calculate discharge based on outlet structure
dimensions select Outlet Structure. If infiltration is included then click on Not Used in
Column 5 and select the appropriate option.
77
Santa Margaritaa Region Hydroology Model Guiidance – April 20014
BIOR
RETENTIO
ON ELEM
MENT
The Bioretention
B
element reepresents a bioretentionn area or rain garden. In modeliing
shorthand terms SMRHM
S
hass abbreviated
d "bioretenttion" to the default nam
me "bio swale".
This name can be changed by the user.
The biioretention element has two
t availablee outlet struccture configuurations:
(1) verticall orifice pluss overflow
(2) riser ou
utlet
The usser is requireed to enter th
he following informationn about the bbioretention:
Swale Length (ft): length dimeension of sw
wale surface bbottom
Swale Bottom Wid
dth (ft): widtth dimension
n of swale suurface bottom
m
Effectiive Total Deepth (ft): com
mputed by SM
MRHM
Bottom
m Slope of Swale
S
(ft/ft): the slope off the swale leength; must bbe greater thhan zero
Left Sideslope (ft//ft): H/V ratiio of horizon
ntal distancee to vertical; 0 (zero) forr vertical swaale
sides
Right Sideslope (ft/ft): H/V ratio
r
of horizontal distaance to verttical; 0 (zero) for verticcal
swale sides
78
Santa Margarita Region Hydrology Model Guidance – April 2014
For the three amended soil material layers the user inputs:
Layer Thickness (feet): depth of amended soil
Type of amended soil: 24 different soil types are included; the user can also create their
own soil type using the Edit Soil Type button
NOTE: Amended soil layers 2 and 3 are optional.
Infiltration to the native soil can be turned on by setting Native Infiltration to YES. The
parameters for native soil infiltration are:
Measured Infiltration Rate (inches per hour): infiltration rate of the native soil
Infiltration Reduction Factor: between 0 and 1 (1/Native soil infiltration rate safety factor
(see page 69)
Use Wetted Surface Area (sidewalls): YES or NO; YES allows infiltration to the native soil
through the sidewalls of the swale; otherwise all infiltration is through the bottom only
If infiltration is used then the user should consult the Infiltration discussion on page 69.
NOTE: See Appendix C or consult with the Copermittee with jurisdiction over the
project site for additional considerations regarding infiltration and determination of
the appropriate infiltration reduction factor.
The user has two bioretention surface outlet configuration choices: (1) Vertical Orifice +
Overflow or (2) Riser Outlet Structure.
79
Santa Margaritaa Region Hydrollogy Model Guidance – April 20014
The in
nput informattion required
d for the verttical orifice plus overfloow is:
Vertical Orifice Diameter (inches): diametter of verticaal opening beelow the weeir
E
(in
nches): vertiical distancee from the top of the amended sooil
Vertical Orifice Elevation
om of the veertical orificee
surfacee to the botto
Width of Over-roaad Flow (feett): weir/streeet length
v
orifiice plus overrflow:
Diagraam of bioreteention with vertical
80
Santa Margaritaa Region Hydrollogy Model Guidance – April 20014
Wid
dth of Over-ro
oad Flow
Ov
ver-road Floodin
ng
Freeboard
Vertical Orifice D
Diameter
Nativ
ve Soil
Effective
Vertical Orifice
e Elevation
Layer 1
Amende
ed Soil
Layer 2
Underdrain
Layer 3
Native Soil
S
Riser outlet
o
structu
ure option:
81
Total
Natiive Soil
Santa Margaritta Region Hydroology Model Guuidance – April 22014
The in
nput informaation requireed for the riiser
outlet structure is:
Riser Height abo
ove Swale Surface (feeet):
depth of surface ponding
p
beffore the riserr is
overto
opped
Riser Diameter (inches):
(
diameter of the
stand pipe
p
Riser Type:
T
Flat or Notched
Notch Type: Rectaangular, V-N
Notch, or
Sutro
For a rectangular
r
notch:
n
Notch Height (feet): distance from
f
the top
p of
the weeir to the botttom of the notch
n
Notch Width (feeet): width off notch; cann
not
be larg
ger than the riser circum
mference
For more
m
information on risser notch op
ptions and orifices seee discussionn in OUTLET
STRU
UCTURE CO
ONFIGURA
ATIONS seection.
To usse the underdrain click
k the Underrdrain Usedd box and input an unnderdrain pipe
diameter (feet), un
nderdrain ou
utlet orifice diameter (innches), and ooffset (inchees). The offfset
definees the heightt of the botttom of the underdrain pipe above the bottom
m of the low
west
amend
ded soil layer.
82
Santa Margaritaa Region Hydrollogy Model Guidance – April 20014
The am
mended soil layer fills with
w stormwater runoff ffrom the topp on down too where it ccan
drain to
t the nativee soil (if Naative Infiltrattion is set too YES) and//or the underdrain pipe (if
Underrdrain Used box is check
ked).
Water enters the underdrain
u
when
w
the am
mended soil bbecomes satturated downn to the top of
the underdrain. The underdraain pipe fills and conveyys stormwateer runoff prooportionally to
the dep
pth
of ameended soil saaturation. When
W
the ameended soil iss fully saturaated the underdrain pipee is
at full capacity. Discharge
D
fro
om the underdrain pipe iis controlledd by the undderdrain orifiice
diametter.
If nativ
ve infiltratio
on is turned on
o then nativ
ve infiltrationn will start w
when/if storm
mwater runoff:
1.
1
2.
2
3.
3
starts to fill the undeerdrain (if an
n underdrainn is used).
enters th
he amended soil (if Use Wetted
W
Surfface Area (siidewalls) is sset to YES).
saturatess the amend
ded soil layeer(s) to 2/3rdds of the tottal amendedd soil depth (if
there iss no underdraain and Wetted Surface Area is set tto NO).
83
Santa Margaritaa Region Hydroology Model Guiidance – April 20014
There is a simple swale option. It is computationnally much faster thann the standaard
bioreteention. Beffore using th
he simple sw
wale option read the noote on the sscreen and tthe
inform
mation below
w to understand the limitaations of the simple swalle.
The sttandard bio
oretention ro
outine uses HSPF Spe cial Actions to check the availabble
amend
ded soil storaage and com
mpares it witth the storm
mwater runofff inflow rate. Because of
the check done by
y HSPF Speccial Actionss simulationss using bioreetention take much longger
n using bio
oretention. Simulations that normallly take onlyy seconds m
may
than siimulations not
take multiple
m
minu
utes when on
ne or more bioretention
b
facilities aree added, deppending on tthe
compu
utational speed of the com
mputer used
d.
One so
olution to thiis problem is to use the simple swalle option (chheck the Use Simple Swaale
box). The simple swale does not
n include HSPF
H
Speciial Actions. It is less acccurate than tthe
standaard swale. Tests
T
have sh
hown that th
he simple sw
wale option sshould only be used whhen
the sw
wale area (an
nd volume) is relatively small compaared to the ccontributing basin area. If
in dou
ubt, model th
he bioretentio
on both way
ys and see hoow close thee simple swaale answer is to
the staandard swalee method. The
T standard
d swale methhod will alw
ways be moree accurate thhan
the sim
mple swale.
84
Santa Margaritaa Region Hydroology Model Guiidance – April 20014
POIN
NT OF CO
OMPLIANCE
SMRH
HM allows for
f multiple points
p
of co
ompliance (m
maximum off 59) in a sinngle project. A
point of
o compliancce is defined
d as the locaation at whiich the Predeevelopment and Mitigatted
flows will
w be analy
yzed for com
mpliance with
h the flow coontrol standaard.
The point
p
of com
mpliance is selected by
b right cliccking on thhe element at which tthe
compliiance analyssis will be made.
m
In the example abbove, the poiint of complliance analyysis
will bee conducted at the outlett of the trapeezoidal pond .
Additiional points of complian
nce can be added by c licking on tthe ADD buutton and thhen
highlig
ghting the POC number to be used for the elem
ment. Once a POC num
mber is addedd it
cannott be removed
d, but if it is not used theen it has no eeffect.
85
Santa Margaritaa Region Hydrollogy Model Guidance – April 20014
Once the point of compliaance has beeen
selecteed the elem
ment is mo
odified on the
Schem
matic screen
n to includee a small box
b
with the
t
letter "A" (for An
nalysis) in the
lower right cornerr. This identtifies the outtlet
from this
t element as a point off compliancee.
The number
n
1 neext to the letter "A" is the
numbeer of the POC
C (POC 1).
86
Santa Margaritaa Region Hydroology Model Guiidance – April 20014
CON
NNECTING
G ELEME
ENTS
Elements are conn
nected by rig
ght clicking on
o the upstreeam elementt (in this exaample DMA 1)
d then left clicking
c
on the Connecct To Elemeent option. By doing so
and seelecting and
SMRH
HM extends a line from the upstream
m element tto wherever the user waants to conneect
that eleement.
87
Santa Margaritaa Region Hydroology Model Guiidance – April 20014
The usser extends the
t connectiion line to th
he downstreeam elementt (in this exaample, a ponnd)
and leeft clicks on
n the destin
nation elem
ment. This aaction bringgs up the F
From Basin to
Conveeyance box that
t
allows the
t user to specify whicch runoff coomponents tto route to tthe
downsstream elemeent.
Stormw
water runo
off is deffined in the
t
SMRH
HM as surfface flow plus
p
interflo
ow.
Both
boxes
should
be
b
checked.
Groun
ndwater shou
uld not be checked for the
t
standaard land developmen
nt mitigatiion
analysis.
Groun
ndwater sho
ould only be
checkeed when there is observed
o
and
a
docum
mented base flow occurrring from the
t
upstreaam basin.
After the approp
priate boxees have beeen
checkeed click the OK
O button.
88
Santa Margaritaa Region Hydrollogy Model Guidance – April 20014
The fin
nal screen will
w look likee the above screen.
s
Thee basin inform
mation screeen on the rigght
will sh
how that DM
MA 1 stormw
water runofff flows to Trrapezoidal Poond 1 (grounndwater is nnot
conneccted).
89
Santa Margaritaa Region Hydrollogy Model Guidance – April 20014
ANA
ALYSIS SCREEN
S
N
The Analysis tool bar button (third from the left) brinngs up the A
Analysis scrreen where tthe
user caan look at th
he results off the Predevelopment annd Mitigatedd scenarios. The Analyssis
screen
n allows the user to anallyze and com
mpare flow ddurations, fllow frequenncy, drawdow
wn
times, hydrograph
hs, and LID BMP
B
sizing by calculatiing VBMP annd QBMP usinng the Rationnal
od.
Metho
90
Santa Margaritaa Region Hydrollogy Model Guidance – April 20014
The usser can analy
yze all time series datassets or just fl
flow, stage, pprecipitationn, evaporatioon,
or poin
nt of compliiance flows by
b selecting the approprriate tab beloow the list oof the differeent
datasetts available for analysis..
91
Santa Margaritaa Region Hydrollogy Model Guidance – April 20014
FLOW DURATION
Flow duration
d
at the
t point of compliance
c
(POC 1) is tthe most com
mmon analyysis. A plot of
the flo
ow duration values
v
is sho
own on the left, the flow
w values on thhe right.
The flow duration
n flow range is from the lower
l
threshhold flow freequency valuue (10% of tthe
2-yearr value) to th
he upper threeshold flow frequency
f
vaalue (10-yeaar value). As shown in tthe
flow duration
d
tablle to the righ
ht of the flow
w duration ccurves, this flow range iis divided innto
approx
ximately 100
0 levels (flow
w values).
The diivision of th
he flow rangee into a larg
ge number off levels is im
mportant to m
make sure thhat
the ero
osive flows do
d not increaase between
n the lower thhreshold (100% of the 2-yyear flow) and
the 2-y
year flow frrequency vallue and betw
ween increassing flow freequency levels (3-year, 4year, 5-year,
5
etc.).. The majorrity of the errosive flows occur between the 10%
% of the 2-yeear
flow value
v
and thee 2-year flow
w frequency value. It is important too divide the flow levels in
that raange into multiple levell steps to no
ot miss any occasions w
when the M
Mitigated flow
ws
exceed
d the Predev
velopment flo
ows.
For eaach flow leveel/value SMR
RHM counts the numbeer of times thhat the flow at the Point of
Compliance for the Predev
velopment scenario
s
(P
Predev) excceeds that specific floow
level/v
value. It doees the same count
c
for thee Mitigated sscenario flow
w (Mit). The total numbber
of cou
unts is the number of simulated 15-minute
1
tim
me steps thhat the flow
w exceeds thhat
specifi
fic flow levell/value.
92
Santa Margarita Region Hydrology Model Guidance – April 2014
The Percentage column is the ratio of the Dev count to the Predev count. This ratio must
be less than or equal to 100% for flow levels/values between the lower threshold (10% of
the 2-year flow) and the 5-year flow and 110% for flow levels/values between the 5-year
flow and the upper threshold value.
If the percentage value does not exceed this maximum ratio (100% for the lower threshold
to the 5-year flow value and 110% for the 5-year flow value to the 10-year value) then the
Pass/Fail column shows a Pass for that flow level. If they are exceeded then a Fail is
shown. A single Fail and the facility fails the flow duration criteria. The facility overall
Pass/Fail is listed at the top of the flow duration table.
93
Santa Margaritaa Region Hydroology Model Guiidance – April 20014
FLOW
W FREQU
UENCY
Flow frequency
f
pllots are show
wn on the lefft and the 2-,, 5-, 10-, andd 25-year freequency valuues
are on
n the right. Flow frequeency calculations are baased on seleccting partial duration floow
values and ranking
g them by their Cunnanee Plotting Poosition.
The Cu
unnane Plottting Position
n formula is:
Tr = (N
N+a)/(m-b)
where Tr = return period
p
(yearrs)
m = raank (largest event,
e
m = 1)
N = nu
umber of yeaars
a = 0.2
2
b = 0.4
4
Probab
bility = 1/Tr
The reeturn period value, Tr, is
i used in SM
MRHM to ddetermine thhe 2-year, 5--year, 10-yeear,
and 25
5-year peak flow
f
values. If necessarry, the 2-yeaar, 5-year, 100-year, and 225-year valuues
are interpolated fro
om the Tr vaalues generatted by Cunnnane.
94
Santa Margaritaa Region Hydroology Model Guiidance – April 20014
DRAWDOWN
N
The drrawdown sccreen is used
d to computte pond stagges (water ddepths). Thhese stages aare
summaarized and reeported in teerms of drain
n/retention tiime (in days).
For th
his example, the maximu
um stage co
omputed durring the enttire 30-50 year simulatiion
period
d is 3.40 feeet. This max
ximum stag
ge has a draawdown tim
me of 1 day,, 20 hours, 33
minutees, 8 secondss (approximaately 45 hou
urs).
Ponds may have drain
d
times in excess off the allowe d maximum
m. This can occur whenn a
pond has
h a small bottom
b
orificce. If this iss not acceptaable then thee user needss to change tthe
pond outlet
o
config
guration, man
nually run th
he Mitigatedd scenario, annd repeat thee analyze staage
compu
utations. A situation maay occur wh
here it is noot possible too have both an acceptabble
pond drawdown/
d
retention
r
tim
me and meet the
t flow durration criteriaa.
NOTE
E: The flow
w duration criteria tak
ke precedence unlesss the user is instructted
otherw
wise by App
pendix C orr the Coperrmittee with
h jurisdiction
n over the p
project site .
95
Santa Margaritaa Region Hydroology Model Guiidance – April 20014
HYDR
ROGRAP
PHS
The usser can grap
ph/plot any or
o all time series
s
data bby selecting the Hydrogrraph tab. T
The
Createe Graph screeen is show
wn and the user
u
can sellect the tim
me series to plot, the tim
me
intervaal (yearly, monthly,
m
daaily, or 15--minute), annd type of data (peakss, average, or
volum
me).
The fo
ollowing num
mbering systtem is used for
f the flow ttime series:
500-59
99: Predevellopment flow
w (Predevelo
opment scenaario)
700-79
99: Inflow to
o the POC (M
Mitigated run
noff enteringg the BMP ffacility)
800-89
99: POC flow
w (Mitigated
d flow exitin
ng the BMP ffacility)
The seelected time series are sh
hown. To grraph the seleected time seeries the useer clicks on tthe
Graph button.
96
Santa Margaritaa Region Hydroology Model Guiidance – April 20014
The hy
ydrograph sh
hows the yeearly maxim
mum/peak floow values foor each timee series for tthe
entire simulation period
p
(in thiis example, from
f
1974 thhrough 20100).
The grraph can be either
e
saved or printed.
97
Santa Margaritaa Region Hydroology Model Guiidance – April 20014
LID BMP
B
SIZIN
NG
Riversside County
y and local municipalitties use thee Rational M
Method (Q = C*I*A) to
calculaate the LID BMP design
n volume, VBMP, and floow rate, QBM
are
MP. These calculations a
completely separaate from the other runofff calculationns produced by SMRHM
M using HSP
PF.
unty's Desig
gn Handbookk for Low Im
mpact Devellopment Best Managemeent
See Riiverside Cou
Practices (Septem
mber 2011) fo
or the most up-to-date innformation rregarding BMP standardds.
ould be consu
ulted prior to
o the start off any SMRH
HM LID BMP
P modeling.
The haandbook sho
The caalculation off the BMP deesign volume VBMP, andd flow rate QBMP is done on this screeen.
The usser first enterrs the 85th peercentile, 24
4-hour rainfaall depth (D855).
98
Santa Margaritaa Region Hydrollogy Model Guidance – April 20014
und for any location
l
in th
he
The D85 can be fou
Santa Margarita
M
Region
R
from the
t Isohyeta
al Map buttoon on the SM
MRHM map screen.
99
Santa Margaritaa Region Hydroology Model Guiidance – April 20014
The D85 for the project
p
site can be foun
nd on the iisohyetal maap based onn the projecct's
locatio
on.
100
Santa Margaritaa Region Hydroology Model Guiidance – April 20014
The efffective impeervious fracttion is calcullated in the m
model basedd on the tribuutary area (A
AT)
for thee post-devellopment land
d cover. Th
he user inpuuts the num
mber of acress of each laand
cover and
a the mod
del calculatess the runoff coefficient,
c
C.
101
Santa Margaritaa Region Hydroology Model Guiidance – April 20014
Click on the Calcculate button at the botttom of the screen to ccalculate thee BMP desiign
me, VBMP, and
d flow rate, QBMP.
volum
102
Santa Margarita Region Hydrology Model Guidance – April 2014
This page has been intentionally left blank.
103
Santa Margaritaa Region Hydrollogy Model Guidance – April 20014
REP
PORTS SCREEN
S
N
The Reports
R
tool bar button (fourth
(
from
m the left) brrings up thee Report screen where tthe
user can look at all
a of the prroject input and output. The project report caan be saved or
d.
printed
The project reporrt contains the project input inforrmation provvided by thhe user andd a
summaary of the project outpu
ut informatio
on producedd by SMRHM
M. The projject report ccan
be gen
nerated as eitther a Microsoft Word fiile or a PDF file.
104
Santa Margaritaa Region Hydroology Model Guiidance – April 20014
This iss an examplee of the projeect report in the format oof a Microsooft Word filee (RTF
formatt).
105
Santa Margaritaa Region Hydrollogy Model Guidance – April 20014
TOO
OLS SCR
REEN
The Tools
T
screen is accessed
d with the Tools
T
tool baar (second ffrom the rigght). The tw
wo
purposses of the To
ools screen are:
a
(1)
To allow users
u
to view
w SMRHM HSPF
H
PERL
LND parameeter values. See Appenddix
A for a listt of the SMR
RHM HSPF PERLND
P
paarameter valuues.
(2)
To allow users
u
to expo
ort time seriees datasets.
106
Santa Margaritaa Region Hydrollogy Model Guidance – April 20014
To exp
port a time series datasett click on thee Export Daataset box. T
The list of avvailable
time seeries datasetts will be sh
hown. The user
u can seleect the start and end datees for the daata
they want
w to exporrt.
The tim
me step (15--minute, daiily, monthly, yearly) cann also be specified. If tthe user wannts
daily, monthly, or yearly data the user is given
g
the choice of eitheer selecting tthe maximum
m,
minim
mum, or the sum of the 15
5-minute vallues.
Click the
t Export button.
b
107
Santa Margaritaa Region Hydroology Model Guiidance – April 20014
The usser providess a file namee and the forrmat or typee of file. Thhe file type can be ASC
CII
text, comma
c
delim
mited, Accesss database,, recharge, S
SWMM, or WWHM. Click Save to
save th
he exported time
t
series file.
f
108
Santa Margarita Region Hydrology Model Guidance – April 2014
This page has been intentionally left blank.
109
Santa Margaritaa Region Hydrollogy Model Guidance – April 20014
LID ANALYS
A
SIS SCR
REEN
The LIID tool bar button
b
(farth
hest on the right) brings uup the Low IImpact Deveelopment
Scenarrio Generato
or screen.
The LID scenario generator can
c be used to comparee the amounnt of runoff from differeent
land ty
ypes and com
mbinations. The user caan quickly ssee how chaanging the laand use affeccts
surfacee runoff, inteerflow, grou
undwater, and
d evapotransspiration.
NOTE
E: The LID scenario geenerator worrks only in the Mitigatted scenarioo.
110
Santa Margaritaa Region Hydroology Model Guiidance – April 20014
The eaasiest way to
o compare different land
d use scenariios is to placce all of them
m on the sam
me
Schem
matic Editor screen grid. Each DMA
A can then reepresent a ddifferent landd use scenarrio.
Because the LID scenario gen
nerator only
y compares rrunoff volum
me there is no need to do
any routing throug
gh a MS4 faccility or receeiving water..
For thiis example th
he four DMA
As are assign
ned the folloowing land uuses:
DMA 1: 1 acre A, Grass, Mod
derate (5-10%
%)
derate (5-10%
%)
DMA 2: 1 acre C, Shrub, Mod
derate (5-10%
%)
DMA 3: 1 acre C, Grass, Mod
DMA 4: 1 acre D, Urban, Mod
derate (5-10%
%)
Each basin
b
is assig
gned a differrent POC (po
oint of comppliance) for tthe LID anallysis.
111
Santa Margaritaa Region Hydroology Model Guiidance – April 20014
Click on the Com
mpute LID Base Data
a button to generate thhe LID anallysis data aand
summaarize the surrface runoff,
f, interflow, groundwater
g
r, precipitatiion, evaporaation, and tootal
runofff for all of the basins. Th
he results wiill be shown for each bassin in terms of its POC.
For DM
MA 1 (1 accre of A, Grrass, Moderaate slope) thhe distributiion of the prrecipitation is:
Surfacce runoff = 0.242
0
inches per year
Interflow = 2.133 inches per year
y
ndwater = 2.0
089 inches per
p year
Groun
Evaporation = 11.4
419 inches per
p year
The su
um of the surface
s
runo
off + interflo
ow + grounndwater + eevaporation equals 15.8883
inches per year. The
T precipitaation at this site
s equals 1 5.910 inches per year. T
The differennce
is becaause 2% of the
t groundw
water goes to deep or inaactive grounddwater and iis not includded
in the LID table.
To loo
ok at the other DMAs click on thee Select PO
OC To arrow
w and selectt the DMA of
interesst.
The LIID analysis results
r
can be
b presented
d in terms off either inchees per year oor acre-feet pper
year by
y checking the
t appropriaate box in th
he lower righht portion off the LID anaalysis screenn.
112
Santa Margaritaa Region Hydrollogy Model Guidance – April 20014
To com
mpare the different POC
Cs side-by-sid
de as bar chaarts click onn the Water B
Balance
Chart..
The water
w
balancee chart graph
hically displaays the runooff distributioon for all foour POCs siddeby-side. In the barr chart the bottom red is the surface runoff. Aboove in yellow
w is interflow
w;
undwater an
nd blue for ev
vapotranspirration.
then grreen for grou
DMA 1 (POC 1) is
i an A soil with grass land
l
cover oon a moderaate slope andd produces tthe
least amount
a
of su
urface runofff and interfllow (the sum
m of surfacee and interfloow is the tottal
stormw
water runoff)
f).
DMA 2 is a C soil with shru
ub land coveer on a mod erate slope; it producess more surfaace
runofff and interflo
ow than DMA
A 1.
DMA 3 is a C so
oil with grasss land cover on a modeerate slope; it producess more surfaace
ow than eitheer DMA 1 orr DMA 2.
runofff and interflo
DMA 4 is a D so
oil with urbaan land cov
ver on a mo derate slopee. Urban laand covers aare
irrigateed. Urban produces
p
thee largest amo
ount of surfaace runoff annd interflow
w in addition to
a largee amount of evapotransp
piration due to
t the additioon of irrigatiion water.
A max
ximum of sev
ven scenario
os can be graaphed at one time.
113
Santa Margaritaa Region Hydrollogy Model Guidance – April 20014
OPT
TIONS
Option
ns can be acccessed by go
oing to View
w, Options. This will brring up the O
Options screeen
and th
he ability to modify the built-in deffault duration criteria foor flow duraation matchinng
and scaling factorss for climate variables.
114
Santa Margarita Region Hydrology Model Guidance – April 2014
DURATION CRITERIA
The flow duration criteria are:
1.
If the post-development flow duration values exceed any of the predevelopment
flow levels between the lower threshold (10% of the two-year) and five-year
predevelopment peak flow values then the flow duration standard has not been
met.
2.
If the post-development flow duration values exceed any of the predevelopment
flow levels between the 5-year and the upper threshold (100% of the 10-year)
predevelopment peak flow values more than 10 percent of the time (110 Percent
Threshold) then the flow duration standard has not been met.
3.
If more than 10 percent of the flow duration levels exceed the 100 percent
threshold then the flow duration standard has not been met.
The duration criteria in SMRHM can be modified by the user if appropriate and the local
municipal permitting agency allows (see NOTE below).
The user can conduct the duration analysis using either (1) durations based on
Predevelopment flow frequency, or (2) durations based on user defined flow values.
If using durations based on Predevelopment flow frequency, the percent of the lower limit
can be changed from the default of the 10% of the 2-year flow event to a higher or lower
percent value. The lower and upper flow frequency limits (2-year and 10-year) also can be
changed.
If using durations based on user defined flow values, click on that option and input the
lower and upper flow values.
The default pass/fail threshold is 100% for the flows between 10% of the 2-year and 5year flow. This value cannot be changed by the user.
The default pass/fail threshold is 110% for the flows between the 5-year and 10-year flow.
This value can be changed by the user.
The duration criteria can be changed for a single POC. Click on the Update button once all
of the changes have been made. To return to the default values click on the Restore
Defaults button.
NOTE: Any change(s) to the default duration criteria must be approved by the
Copermittee with jurisdiction over the project site or specified in Appendix C.
115
Santa Margaritaa Region Hydrollogy Model Guidance – April 20014
SCAL
LING FAC
CTORS
The usser can change the scalin
ng factors fo
or precipitatioon (minimum
m and maxim
mum) and ppan
evaporration.
NOTE
E: Any change in defa
ault scaling factors req
quires appro
oval by the Copermitte
ee
with ju
urisdiction over
o
the pro
oject site orr Appendix C.
Click on the Upd
date button once
o
all of the changess have beenn made. Too return to tthe
defaultt values click
k on the Resstore Defaullts button.
116
Santa Margarita Region Hydrology Model Guidance – April 2014
This page has been intentionally left blank.
117
Santa Margarita Region Hydrology Model Guidance – April 2014
TIPS AND TRICKS FOR LID PRACTICES AND FACILITIES
There are many different tips and tricks that can be used to tailor SMRHM to solve
different stormwater runoff management problems. This section presents only a fraction of
the tricks that we and others have found and used, but it should give you a good idea of the
options and flexibility built into SMRHM.
The tips and tricks show how different LID/BMPs
elements.
can be represented by SMRHM
LID/BMP practices and facilities reduce the need for and the size of hydrologic control
facilities. LID/BMP practices and facilities typically try to mimic the natural environment
and provide source control and storage of runoff.
Riverside County's Design Handbook for Low Impact Development Best Management
Practices (September 2011) include eight (8) practices that can be modeled using the
comparable SMRHM elements. This handbook has the most up-to-date information
regarding BMP standards and should be consulted prior to the start of any SMRHM LID
BMP modeling.
The eight LID BMPs are:
1.
2.
3.
4.
5.
6.
7.
8.
Infiltration Basin
Infiltration Trench
Permeable Pavement
Bioretention (standard design)
Bioretention (vertical sideslopes)
Bioretention (planter box)
Sand Filter
Extended Detention Basin
Each of these eight LID BMPs are described below.
NOTE: Many of these LID/BMP practices and facilities rely on infiltration into native
soils. See Appendix C or consult with the Copermittee with jurisdiction over the
project site for additional considerations regarding infiltration and determination of
an infiltration reduction factor, where appropriate.
118
Santa Margaritaa Region Hydroology Model Guiidance – April 20014
INFIL
LTRATION BASIN//POND
Figuree courtesy off Riverside County
C
Flood
d Control annd Water Connservation D
District
An inffiltration basin allows stormwater
s
runoff
r
to ennter the basiin above groound and thhen
infiltraate through the
t bottom of
o the basin into
i
the nativve soil beneaath the basinn. Overflow
w is
controlled by an ov
verflow outllet.
For the purpose of flow contrrol the disch
harge from tthe overflow
w outlet shouuld not exceeed
the preedevelopmen
nt discharge from the prroject site foor the flow dduration rangge specified by
the Co
opermittee with
w jurisdictiion over the project site .
In SM
MRHM the in
nfiltration baasin is repressented by thee trapezoidaal or irregulaar-shaped poond
elemen
nt.
119
Santa Margaritaa Region Hydroology Model Guiidance – April 20014
The po
ond dimensio
ons and paraameters to ad
djust to repreesent an infiiltration basiin are:
Bottom
m Length (ft)): Infiltration
n basin lengtth
Bottom
m Width (ft): Infiltration
n basin width
h
Effectiive Depth (fft): Infiltratio
on basin height from baasin bottom tto top of riseer plus at leaast
1.0 foo
ot of freeboaard
Left Siideslope (H//V): ratio of horizontal distance
d
to veertical for innfiltration basin sides
Bottom
m Sideslope (H/V): ratio
o of horizontaal distance too vertical foor infiltrationn basin sides
Right Sideslope (H
H/V): ratio of
o horizontal distance to vvertical for iinfiltration bbasin sides
Top Siideslope (H//V): ratio of horizontal distance
d
to veertical for innfiltration bassin sides
Riser Height
H
(ft): Height
H
of inffiltration bassin/pond oveerflow pipe aabove basin soil surface
Riser Diameter
D
(in
n): Infiltratio
on basin overrflow pipe diiameter
Riser Type:
T
Flat
Infiltraation: Yes (in
nfiltration in
nto the underrlying nativee soil)
Measu
ured Infiltratiion Rate (in//hr): Native soil infiltratiion rate
Infiltraation Reducttion Factor: 1/Native soiil infiltrationn rate safety ffactor (see ppage 69)
Use Wetted
W
Surfaace Area (sidewalls): Yes,
Y if infiltrration througgh the basinn sideslopes is
alloweed.
If infilltration is useed then the user
u should consult
c
the IInfiltration ddiscussion onn page 69.
120
Santa Margarita Region Hydrology Model Guidance – April 2014
Any changes made by the user to the element dimensions and other input are not analyzed
by SMRHM until the Run Scenario button is reclicked.
The Riverside County Design Handbook for Low Impact Development Best Management
Practices specifies the following criteria for infiltration basins:
Maximum drawdown time: 72 hrs
Maximum tributary area: 50 ac
Maximum depth: 5 ft
Maximum sideslopes: 4 to 1
NOTE: See Appendix C or consult with the Copermittee with jurisdiction over the
project site for additional considerations regarding infiltration and determination of
the appropriate infiltration reduction factor.
An infiltration basin/pond receives precipitation on and evaporation from the basin surface
area. The Precipitation Applied to Facility and Evaporation Applied to Facility boxes
should be checked.
121
Santa Margaritaa Region Hydrollogy Model Guidance – April 20014
INFIL
LTRATION TRENC
CH
Figuree courtesy off Riverside County
C
Flood
d Control annd Water Connservation D
District
An inffiltration treench is simiilar to the infiltration
i
bbasin. How
wever, there is no bottoom
dischaarge pipe or underdrain. Water must
m
infiltratee into the nnative soil uunderlying tthe
gravel layer of the planter. Ov
verflow is co
ontrolled by an overflow
w outlet.
For the purpose of flow contrrol the disch
harge from thhe overflow
w outlet shouuld not exceeed
the preedevelopmen
nt discharge from the prroject site for the flow du
duration rangge specified bby
the loccal jurisdictio
on.
In SMRHM the infiltration trench is repressented by thhe gravel trennch bed elem
ment.
122
Santa Margaritaa Region Hydroology Model Guiidance – April 20014
The gravel trench
h bed dimen
nsions and parameters to adjust too represent an infiltratiion
trench are:
Trench
h Length (ft)): Infiltration
n trench leng
gth
Trench
h Bottom Wiidth (ft): Infi
filtration tren
nch width
Effectiive Total Deepth (ft): Infiltration treench height from bottom
m of trench to top of risser
plus att least 0.5 feeet extra
Bottom
m Slope of Trench
T
(ft/ft): Must be no
on-zero
Left Siideslope (ft/ft): 0 (zero) for vertical infiltration
i
tr
trench sides
Right Sideslope (ft
ft/ft): 0 (zero) for vertical infiltrationn trench sidess
n/hr): Infiltrration trench soil infiltrattion rate
Infiltraation Rate (in
Layer 1 Thicknesss (ft): Infiltraation trench soil
s layer deepth
Layer 1 Porosity: Infiltration
I
trrench soil po
orosity
Layer 2 Thicknesss (ft): Infiltraation trench gravel
g
layer depth
Layer 2 Porosity: Infiltration
I
trrench gravell porosity
Layer 3 Thicknesss (ft): Infiltraation trench gravel
g
layer depth
Layer 3 Porosity: Infiltration
I
trrench gravell porosity.
NOTE
E: Layers 2 and 3 are optional.
o
Riser Height
H
(ft): Height
H
of infiltration treench overflow
w pipe abovve trench botttom. If a w
weir
is prefferred insteaad of a riser,, then set th
he riser heighht to the weeir height annd set the risser
diametter to the weeir length.
123
Santa Margarita Region Hydrology Model Guidance – April 2014
Riser Diameter (in): Infiltration trench overflow pipe diameter
Riser Type: Flat
Native Infiltration: Yes (infiltration into the underlying native soil)
Measured Infiltration Rate (in/hr): Native soil infiltration rate
Infiltration Reduction Factor: 1/Native soil infiltration rate safety factor (see page 69)
If infiltration is used then the user should consult the Infiltration discussion on page 69.
Any changes made by the user to the element dimensions and other input are not analyzed
by SMRHM until the Run Scenario button is reclicked.
The Riverside County Design Handbook for Low Impact Development Best Management
Practices specifies the following criteria for infiltration trenches:
Max drawdown: 72 hrs
Max tributary area: 10 ac
Max depth: 8 ft
Sideslope: 0 to 1 (vertical)
Trench width must be greater than depth
NOTE: See Appendix C or consult with the Copermittee with jurisdiction over the
project site for additional considerations regarding infiltration and determination of
the appropriate infiltration reduction factor.
The infiltration trench receives precipitation on and evaporation from the trench surface.
The Precipitation Applied to Facility and Evaporation Applied to Facility boxes should be
checked.
124
Santa Margaritaa Region Hydrollogy Model Guidance – April 20014
PERMEABLE
E PAVEME
ENT
Figuree courtesy off Riverside County
C
Flood
d Control annd Water Coonservation D
District
Permeeable pavem
ment LID op
ptions inclu
ude porous asphalt or concrete annd grid/lattiice
system
ms (non-conccrete) and paving block
ks. The use of any of thhese LID opptions requirres
that ceertain minim
mum standarrds and requ
uirements arre met relateed to subgraade, geotextile
materiial, separatiion or botttom filter layer, base material, wearing laayer, drainaage
convey
yance, accep
ptance testin
ng, and surfacce maintenan
ance.
NOTE
E: Permea
able pavement can be
e used in pllace of con
nventional p
pavement ffor
roadw
ways, sidew
walks, drive
eways, and parking lotts. Check with Appen
ndix C or th
he
Coperrmittee with
h jurisdictio
on over the project site
e to find ou
ut under wh
hat condition
ns
perme
eable pavem
ment is allo
owed.
Permeeable pavemeent can be reepresented by
b the permeeable pavemeent element in SMRHM
M if
the folllowing threee conditions are met:
1.
1
2.
2
3.
3
The inffiltration ratte of the perm
meable paveement is greeater than thee peak rainffall
rate.
The infiltration ratte of the perrmeable pavvement is grreater than tthe underlying
native soil.
There is
i subgrade layer
l
of crusshed rock/graavel betweenn the permeaable pavemeent
and thee native soil.
125
Santa Margaritaa Region Hydrollogy Model Guidance – April 20014
The peermeable pav
vement dimeensions and parameters
p
aare:
Pavem
ment Length (ft): Roadwaay length
Pavem
ment Bottom Width (ft): Roadway
R
wiidth
Effectiive Total Deepth (ft): Heeight from bottom of peermeable pavvement subggrade to top of
pavem
ment plus at least 0.5 feett extra
Bottom
m Slope (ft/fft): Pavemen
nt slope or grrade.
Effectiive Volume Factor: zero
o unless the bottom
b
slopee is greater thhan 2%.
The efffective volu
ume factor is
i a value beetween zeroo and 1.00. It is only uused when tthe
bottom
m slope is grreater than 2%.
2
The efffective voluume factor iis the fractioon ratio of tthe
averag
ge maximum
m water dep
pth behind a check daam in the ggravel layer (Sublayer 1)
compaared to the maximum
m
grravel layer depth
d
(Sublaayer 1). Foor example, if the averaage
maxim
mum water height is 6" an
nd the graveel depth is 9"" then the Efffective Voluume Factor
= 0.67
7 (6/9). The effective vo
olume factor is multipliedd by the Subblayer 1 storrage volume to
determ
mine the actu
ual maximum
m volume av
vailable for stormwater runoff storaage before tthe
check dam is overrtopped and the water in
n the gravel llayer depth ((Sublayer 1)) proceeds too a
downsstream conveeyance faciliity.
Pavem
ment Thickneess (ft): Perm
meable pavem
ment layer ddepth
Pavem
ment Porosity
y: Permeablee pavement porosity
p
Sublay
yer 1 Thickn
ness (ft): Sub
bgrade graveel layer depthh
126
Santa Margarita Region Hydrology Model Guidance – April 2014
Sublayer 1 Porosity: Subgrade gravel porosity.
Sublayer 2 Thickness (ft): Sand layer depth (if appropriate)
Sublayer 2 Porosity: Sand porosity
Ponding Depth above Pavement (ft): Height at which surface runoff occurs
NOTE: Check with Appendix C or the Copermittee with jurisdiction over the project
site to find out if ponding on the surface of the pavement is allowed.
Underdrain Diameter (inches) and Height (feet) above bottom layer-native soil interface.
The underdrain is optional.
Native Infiltration: Yes (infiltration into the underlying native soil)
Measured Infiltration Rate (in/hr): Native soil infiltration rate
Infiltration Reduction Factor: 1/Native soil infiltration rate safety factor (see page 69)
If infiltration is used then the user should consult the Infiltration discussion on page 69.
Any changes made by the user to the element dimensions and other input are not analyzed
by SMRHM until the Run Scenario button is re-clicked.
The Riverside County Design Handbook for Low Impact Development Best Management
Practices specifies the following criteria for permeable pavement:
Max drawdown: 24 hrs
Max tributary area: 10 ac
Max reservoir (gravel subgrade) depth: 1 ft
Max pavement slope: 0.03
Permeable pavement bottom slope: zero
Aggregate porosity: 0.40
NOTE: See Appendix C or consult with the Copermittee with jurisdiction over the
project site for additional considerations regarding infiltration and determination of
the appropriate infiltration reduction factor.
127
Santa Margaritaa Region Hydrollogy Model Guidance – April 20014
BIOR
RETENTIO
ON (STAN
NDARD DESIGN)
D
Figuree courtesy off Riverside County
C
Flood
d Control annd Water Connservation D
District
Bioretention (stan
ndard design
n) allows sto
ormwater runnoff to enteer the biorettention faciliity
above ground and then infiltraate through th
he mulch layyer, engineeered soil meddia, and gravvel
storagee layers befo
ore exiting th
hrough a discharge pipe..
For th
he purpose of flow co
ontrol the discharge froom the pipee should noot exceed tthe
predev
velopment diischarge from
m the projecct site for thee flow durattion range sppecified by tthe
local ju
urisdiction.
In SMRHM the bioretention (sstandard dessign) is repreesented by thhe bioretention element.
128
Santa Margaritaa Region Hydroology Model Guiidance – April 20014
The biioretention dimensions
d
and
a parameteers to adjustt to represennt the bioreteention standaard
design
n are discusseed on page 81.
8
The Riiverside Cou
unty Design Handbook for
f Low Impaact Development Best M
Management
Practices specifiess the followiing criteria for
fo bioretentiion (standardd design):
Minimum
m width: 6 ft
Sideslopee: 4 to 1
Maximum
m ponding deepth: 0.5 ft
Mulch top
p layer: 2 to 3 inches deeep (above am
mended soil layer)
Minimum
m amended so
oil layer dep
pth: 1.5 ft
Maximum
m amended soil
s layer dep
pth: 3 ft
Maximum
m amended soil
s porosity:: 0.30
Maximum
m gravel layeer: 1 ft (below amended soil layer)
Gravel lay
yer porosity: 0.40
Minimum
m underdrain
n diameter: 0.5 ft
No infiltraation to nativ
ve soil
129
Santa Margaritaa Region Hydrollogy Model Guidance – April 20014
BIOR
RETENTIO
ON (VERT
TICAL SID
DESLOPE
ES)
Figuree courtesy off Riverside County
C
Flood
d Control annd Water Coonservation D
District
Biorettention with vertical sid
deslopes allo
ows stormw
water runofff to enter thhe bioretention
facility
y above gro
ound and theen infiltrate through thee mulch layeer, engineereed soil meddia,
and grravel storagee layers before exiting th
hrough a disccharge pipe.
For th
he purpose of flow co
ontrol the discharge
d
froom the pipee should noot exceed tthe
predev
velopment discharge from the projecct site for thee flow durattion range sppecified by tthe
Coperrmittee with jurisdiction
j
over the pro
oject site.
In SM
MRHM the bioretention
n (vertical sideslopes) is represennted by thee bioretention
elemen
nt.
130
Santa Margaritaa Region Hydroology Model Guiidance – April 20014
The biioretention dimensions
d
and
a parameteers to adjustt to represennt the bioreteention standaard
design
n are discusseed on page 81.
8
The Riiverside Cou
unty Design Handbook for
f Low Impaact Development Best M
Management
Practices specifiess the followiing criteria for
fo bioretentiion (vertical sideslopes)::
Minimum
m width: 2 ft
Sideslopee: 0 to 1
Maximum
m ponding deepth: 0.5 ft
Mulch top
p layer: 2 to 3 inches deeep (above am
mended soil layer)
Minimum
m amended so
oil layer dep
pth: 1.5 ft
Maximum
m amended soil
s layer dep
pth: 3 ft
Maximum
m amended soil
s porosity:: 0.30
Maximum
m gravel layeer: 1 ft (below amended soil layer)
Gravel lay
yer porosity: 0.40
Minimum
m underdrain
n diameter: 0.5 ft
No infiltraation to nativ
ve soil
131
Santa Margaritaa Region Hydroology Model Guiidance – April 20014
BIOR
RETENTIO
ON (PLAN
NTER BO
OX)
Bioretention in th
he form off a planter box
allowss stormwatter runoff to enter the
bioreteention faciliity above ground
g
and then
infiltraate through the mulch laayer, engineeered
soil media,
m
and gravel
g
storag
ge layers beefore
exiting
g through a discharge
d
pip
pe.
For thee purpose off flow control, the disch
harge
from the pipe should no
ot exceed the
Predev
velopment discharge
d
frrom the project
site fo
or the flow duration ran
nge specified by
the loccal jurisdictio
on.
In SMRHM the planter box bioretention iss representedd by the biorretention eleement.
The bioretention
b
dimensionss and param
meters to aadjust to reepresent thee planter bbox
bioreteention are diiscussed on page
p
81.
132
Santa Margarita Region Hydrology Model Guidance – April 2014
The Riverside County Design Handbook for Low Impact Development Best Management
Practices specifies the following criteria for planter box bioretention:
Minimum width: 2 ft
Sideslope: 0 to 1
Maximum ponding depth: 0.5 ft
Mulch top layer: 2 to 3 inches deep (above amended soil layer)
Minimum amended soil layer depth: 1.5 ft
Maximum amended soil layer depth: 3 ft
Maximum amended soil porosity: 0.30
Maximum gravel layer: 1 ft (below amended soil layer)
Gravel layer porosity: 0.40
Minimum underdrain diameter: 0.5 ft
No infiltration to native soil
133
Santa Margaritaa Region Hydrollogy Model Guidance – April 20014
SAND
D FILTER
R BASIN
Figuree courtesy off Riverside County
C
Flood
d Control annd Water Connservation D
District
A sand
d filter basin
n allows storrmwater runoff to enter the sand filtter above ground and thhen
filtratee through thee filter mediaa before exitting through a discharge pipe.
In SMRHM the saand filter bassin is represeented by the sand filter eelement.
134
Santa Margaritaa Region Hydroology Model Guiidance – April 20014
The saand filter dim
mensions an
nd parameters to adjust to represennt the sand ffilter basin aare
discussed on page 61.
The Riiverside Cou
unty Design Handbook for
f Low Impaact Development Best M
Management
Practices specifiess the followiing criteria for
fo the sand ffilter basin:
Maximum
m tributary arrea: 25 ac
Maximum
m basin depth
h: 5 ft
Maximum
m Sideslope: 4 to 1
Sand filteer top below bottom orifiice: min 4 inn
Sand filteer top layer: min
m 18 in off sand
Sand filteer bottom lay
yer: min 10 in of gravel
Sand filteer underdrain
n diameter: 6 in
Sand filteer underdrain
n bottom: 1 in
i above botttom gravel llayer
No infiltraation to nativ
ve soil
135
Santa Margaritaa Region Hydrollogy Model Guidance – April 20014
EXTE
ENDED DETENTIO
D
ON BASIN
N
Figuree courtesy off Riverside County
C
Flood
d Control annd Water Coonservation D
District
The ex
xtended deteention basin
n is a combiination storm
mwater pondd (forebay), gravel trennch
(conneector trench)), and sand filter
f
(filter drain). In S
SMRHM theere is not a ssingle elemeent
that reepresents thiss combinatio
on.
136
Santa Margaritaa Region Hydroology Model Guiidance – April 20014
In SM
MRHM the extended
e
dettention basin
n is represeented by treaatment trainn connectingg a
trapezo
oidal pond (or irregularr pond) elem
ment to a ggravel trenchh element too a sand filter
elemen
nt, in that order.
There is also the option
o
of creeating the ex
xtended deteention basin''s stage-storaage- discharrge
table outside
o
of SM
MRHM and inputting it as
a a SSD Taable element.
The trrapezoidal pond
p
dimenssions and paarameters too adjust to represent thhe forebay aare
discussed on page 46.
The irrregular pon
nd dimensio
ons and parrameters to adjust to rrepresent thhe forebay aare
discussed on page 56.
The grravel trench dimensions and parametters to adjusst to represennt the connector trench aare
discussed on page 59.
The sand filter dimensions
d
and parameeters to adjuust to repreesent the fiilter drain aare
discussed on page 61.
The SS
SD element is discussed on page 78..
The Riiverside Cou
unty Design Handbook for
f Low Impaact Development Best M
Management
Practices specifiess the followiing criteria for
fo the extendded detentioon basin:
137
Santa Margarita Region Hydrology Model Guidance – April 2014
Minimum tributary area: 5 ac
Maximum drawdown: 72 hrs
Maximum Sideslope: 4 to 1
Trench bottom slope: 1%
Minimum filter drain depth: 2.33 ft
138
Santa Margarita Region Hydrology Model Guidance – April 2014
This page has been intentionally left blank.
139
Appendix A
APPENDIX A: DEFAULT
PARAMETER VALUES
Santa Margarita Region Hydrology Model Guidance – June 2013
SMRHM
HSPF
PERVIOUS
The default SMRHM HSPF pervious parameter values are found in SMRHM file
defaultpersp.uci.
HSPF parameter documentation is found in the document:
Bicknell, B.R., J.C. Imhoff, J.L. Kittle Jr, T.H. Jobes, and A.S. Donigian Jr. 2001.
Hydrological Simulation Program – Fortran, User's Manual for Version 12. AQUA
TERRA Consultants. Mountain View, CA.
140
Appendix A
Santa Margarita Region Hydrology Model Guidance – June 2013
Table 1. SMRHM Pervious Land Types
PERLND No.
1
2
3
4
5
6
7
8
9
10
11
12
13
14
15
16
17
18
19
20
21
22
23
24
25
26
27
28
29
30
31
32
33
34
35
36
37
38
39
40
41
42
43
44
Soil Type
A
A
A
A
A
A
A
A
A
A
A
A
A
A
A
A
B
B
B
B
B
B
B
B
B
B
B
B
B
B
B
B
C/D
C/D
C/D
C/D
C/D
C/D
C/D
C/D
C/D
C/D
C/D
C/D
Land Cover
Forest
Forest
Forest
Forest
Shrub
Shrub
Shrub
Shrub
Grass
Grass
Grass
Grass
Urban
Urban
Urban
Urban
Forest
Forest
Forest
Forest
Shrub
Shrub
Shrub
Shrub
Grass
Grass
Grass
Grass
Urban
Urban
Urban
Urban
Forest
Forest
Forest
Forest
Shrub
Shrub
Shrub
Shrub
Grass
Grass
Grass
Grass
Land Slope
Flat (0-5%)
Moderate (5-10%)
Steep (10-20%)
Very Steep (>20%)
Flat (0-5%)
Moderate (5-10%)
Steep (10-20%)
Very Steep (>20%)
Flat (0-5%)
Moderate (5-10%)
Steep (10-20%)
Very Steep (>20%)
Flat (0-5%)
Moderate (5-10%)
Steep (10-20%)
Very Steep (>20%)
Flat (0-5%)
Moderate (5-10%)
Steep (10-20%)
Very Steep (>20%)
Flat (0-5%)
Moderate (5-10%)
Steep (10-20%)
Very Steep (>20%)
Flat (0-5%)
Moderate (5-10%)
Steep (10-20%)
Very Steep (>20%)
Flat (0-5%)
Moderate (5-10%)
Steep (10-20%)
Very Steep (>20%)
Flat (0-5%)
Moderate (5-10%)
Steep (10-20%)
Very Steep (>20%)
Flat (0-5%)
Moderate (5-10%)
Steep (10-20%)
Very Steep (>20%)
Flat (0-5%)
Moderate (5-10%)
Steep (10-20%)
Very Steep (>20%)
141
Appendix A
45
46
47
48
Santa Margarita Region Hydrology Model Guidance – June 2013
C/D
C/D
C/D
C/D
Urban
Urban
Urban
Urban
Flat (0-5%)
Moderate (5-10%)
Steep (10-20%)
Very Steep (>20%)
142
Appendix A
Santa Margarita Region Hydrology Model Guidance – June 2013
Table 2. SMRHM HSPF Pervious Parameter Values – Part I
PERLND No.
1
2
3
4
5
6
7
8
9
10
11
12
13
14
15
16
17
18
19
20
21
22
23
24
25
26
27
28
29
30
31
32
33
34
35
36
37
38
39
40
41
42
43
44
45
LZSN
5.20
4.80
4.50
4.20
5.20
4.80
4.50
4.20
5.20
4.80
4.50
4.20
5.00
4.60
4.20
3.80
5.00
4.70
4.40
4.10
5.00
4.70
4.40
4.10
5.00
4.70
4.40
4.10
4.80
4.40
4.00
3.60
4.80
4.50
4.20
4.00
4.80
4.50
4.20
4.00
4.80
4.50
4.20
4.00
4.60
INFILT
0.100
0.075
0.055
0.045
0.090
0.070
0.045
0.040
0.090
0.070
0.045
0.040
0.060
0.050
0.040
0.030
0.080
0.060
0.045
0.035
0.070
0.055
0.040
0.030
0.070
0.055
0.040
0.030
0.050
0.040
0.030
0.025
0.050
0.045
0.035
0.030
0.045
0.040
0.030
0.025
0.045
0.040
0.030
0.025
0.040
LSUR
400
350
300
200
400
350
300
200
400
350
300
200
400
350
300
200
400
350
300
200
400
350
300
200
400
350
300
200
400
350
300
200
400
350
300
200
400
350
300
200
400
350
300
200
400
143
SLSUR
0.05
0.10
0.15
0.25
0.05
0.10
0.15
0.25
0.05
0.10
0.15
0.25
0.05
0.10
0.15
0.25
0.05
0.10
0.15
0.25
0.05
0.10
0.15
0.25
0.05
0.10
0.15
0.25
0.05
0.10
0.15
0.25
0.05
0.10
0.15
0.25
0.05
0.10
0.15
0.25
0.05
0.10
0.15
0.25
0.05
KVARY
0.80
0.80
0.80
0.80
0.80
0.80
0.80
0.80
0.80
0.80
0.80
0.80
1.20
1.20
1.20
1.20
1.20
1.20
1.20
1.20
1.20
1.20
1.20
1.20
1.20
1.20
1.20
1.20
1.80
1.80
1.80
1.80
2.00
2.00
2.00
2.00
2.00
2.00
2.00
2.00
2.00
2.00
2.00
2.00
3.00
AGWRC
0.985
0.985
0.985
0.985
0.955
0.955
0.955
0.955
0.955
0.955
0.955
0.955
0.997
0.997
0.997
0.997
0.980
0.980
0.980
0.980
0.950
0.950
0.950
0.950
0.950
0.950
0.950
0.950
0.995
0.995
0.995
0.995
0.980
0.980
0.980
0.980
0.950
0.950
0.950
0.950
0.950
0.950
0.950
0.950
0.995
Appendix A
46
47
48
Santa Margarita Region Hydrology Model Guidance – June 2013
4.20
3.80
3.50
0.030
0.022
0.020
350
300
200
0.10
0.15
0.25
3.00
3.00
3.00
LZSN: Lower Zone Storage Nominal (inches)
INFILT: Infiltration (inches per hour)
LSUR: Length of surface flow path (feet)
SLSUR: Slope of surface flow path (feet/feet)
KVARY: Variable groundwater recession
AGWRC: Active Groundwater Recession Constant (per day)
144
0.995
0.995
0.995
Appendix A
Santa Margarita Region Hydrology Model Guidance – June 2013
Table 3. SMRHM HSPF Pervious Parameter Values – Part II
PERLND No.
1
2
3
4
5
6
7
8
9
10
11
12
13
14
15
16
17
18
19
20
21
22
23
24
25
26
27
28
29
30
31
32
33
34
35
36
37
38
39
40
41
42
43
44
45
INFEXP
2.00
2.00
2.00
2.00
2.00
2.00
2.00
2.00
2.00
2.00
2.00
2.00
2.00
2.00
2.00
2.00
2.00
2.00
2.00
2.00
2.00
2.00
2.00
2.00
2.00
2.00
2.00
2.00
2.00
2.00
2.00
2.00
3.00
3.00
3.00
3.00
3.00
3.00
3.00
3.00
3.00
3.00
3.00
3.00
3.00
INFILD
2.00
2.00
2.00
2.00
2.00
2.00
2.00
2.00
2.00
2.00
2.00
2.00
2.00
2.00
2.00
2.00
2.00
2.00
2.00
2.00
2.00
2.00
2.00
2.00
2.00
2.00
2.00
2.00
2.00
2.00
2.00
2.00
2.00
2.00
2.00
2.00
2.00
2.00
2.00
2.00
2.00
2.00
2.00
2.00
2.00
DEEPFR
0.02
0.02
0.02
0.02
0.02
0.02
0.02
0.02
0.02
0.02
0.02
0.02
0.06
0.06
0.06
0.06
0.12
0.12
0.12
0.12
0.12
0.12
0.12
0.12
0.12
0.12
0.12
0.12
0.36
0.36
0.36
0.36
0.15
0.15
0.15
0.15
0.15
0.15
0.15
0.15
0.15
0.15
0.15
0.15
0.45
145
BASETP
0.03
0.03
0.03
0.03
0.03
0.03
0.03
0.03
0.03
0.03
0.03
0.03
0.03
0.03
0.03
0.03
0.08
0.08
0.08
0.08
0.08
0.08
0.08
0.08
0.08
0.08
0.08
0.08
0.08
0.08
0.08
0.08
0.15
0.15
0.15
0.15
0.15
0.15
0.15
0.15
0.15
0.15
0.15
0.15
0.15
AGWETP
0.00
0.00
0.00
0.00
0.00
0.00
0.00
0.00
0.00
0.00
0.00
0.00
0.00
0.00
0.00
0.00
0.00
0.00
0.00
0.00
0.00
0.00
0.00
0.00
0.00
0.00
0.00
0.00
0.00
0.00
0.00
0.00
0.00
0.00
0.00
0.00
0.00
0.00
0.00
0.00
0.00
0.00
0.00
0.00
0.00
Appendix A
46
47
48
Santa Margarita Region Hydrology Model Guidance – June 2013
3.00
3.00
3.00
2.00
2.00
2.00
0.45
0.45
0.45
0.15
0.15
0.15
0.00
0.00
0.00
INFEXP: Infiltration Exponent
INFILD: Infiltration ratio (maximum to mean)
DEEPFR: Fraction of groundwater to deep aquifer or inactive storage
BASETP: Base flow (from groundwater) Evapotranspiration fraction
AGWETP: Active Groundwater Evapotranspiration fraction
146
Appendix A
Santa Margarita Region Hydrology Model Guidance – June 2013
Table 4. SMRHM HSPF Pervious Parameter Values – Part III
PERLND No.
1
2
3
4
5
6
7
8
9
10
11
12
13
14
15
16
17
18
19
20
21
22
23
24
25
26
27
28
29
30
31
32
33
34
35
36
37
38
39
40
41
42
43
44
45
CEPSC
see Table 6
see Table 6
see Table 6
see Table 6
see Table 6
see Table 6
see Table 6
see Table 6
see Table 6
see Table 6
see Table 6
see Table 6
see Table 6
see Table 6
see Table 6
see Table 6
see Table 6
see Table 6
see Table 6
see Table 6
see Table 6
see Table 6
see Table 6
see Table 6
see Table 6
see Table 6
see Table 6
see Table 6
see Table 6
see Table 6
see Table 6
see Table 6
see Table 6
see Table 6
see Table 6
see Table 6
see Table 6
see Table 6
see Table 6
see Table 6
see Table 6
see Table 6
see Table 6
see Table 6
see Table 6
UZSN
1.00
0.80
0.60
0.50
0.90
0.70
0.50
0.40
0.80
0.70
0.55
0.30
0.70
0.50
0.35
0.30
1.00
0.80
0.60
0.50
0.90
0.70
0.50
0.40
0.80
0.70
0.55
0.30
0.70
0.50
0.35
0.30
1.00
0.80
0.60
0.50
0.90
0.70
0.50
0.40
0.80
0.70
0.55
0.30
0.70
NSUR
0.35
0.35
0.35
0.35
0.30
0.30
0.30
0.30
0.25
0.25
0.25
0.25
0.25
0.25
0.25
0.25
0.35
0.35
0.35
0.35
0.30
0.30
0.30
0.30
0.25
0.25
0.25
0.25
0.25
0.25
0.25
0.25
0.35
0.35
0.35
0.35
0.30
0.30
0.30
0.30
0.25
0.25
0.25
0.25
0.25
147
INTFW
4.50
4.00
3.00
2.00
4.00
3.20
2.60
1.80
4.00
3.20
2.60
1.80
3.00
2.40
1.60
1.00
4.00
3.00
2.00
0.80
3.00
2.40
1.60
0.60
3.00
2.40
1.60
0.60
2.00
1.20
0.80
0.60
2.00
1.50
1.00
0.40
2.00
1.20
0.80
0.40
2.00
1.20
0.80
0.40
1.00
IRC
0.80
0.50
0.45
0.40
0.70
0.45
0.40
0.35
0.70
0.45
0.40
0.35
0.40
0.35
0.30
0.30
0.80
0.50
0.45
0.40
0.70
0.45
0.40
0.35
0.70
0.45
0.40
0.35
0.40
0.35
0.30
0.30
0.80
0.50
0.45
0.40
0.70
0.45
0.40
0.35
0.70
0.45
0.40
0.35
0.40
LZETP
see Table 7
see Table 7
see Table 7
see Table 7
see Table 7
see Table 7
see Table 7
see Table 7
see Table 7
see Table 7
see Table 7
see Table 7
see Table 7
see Table 7
see Table 7
see Table 7
see Table 7
see Table 7
see Table 7
see Table 7
see Table 7
see Table 7
see Table 7
see Table 7
see Table 7
see Table 7
see Table 7
see Table 7
see Table 7
see Table 7
see Table 7
see Table 7
see Table 7
see Table 7
see Table 7
see Table 7
see Table 7
see Table 7
see Table 7
see Table 7
see Table 7
see Table 7
see Table 7
see Table 7
see Table 7
Appendix A
46
47
48
Santa Margarita Region Hydrology Model Guidance – June 2013
see Table 6
see Table 6
see Table 6
0.50
0.35
0.30
0.25
0.25
0.25
CEPSC: Interception storage (inches)
UZSN: Upper Zone Storage Nominal (inches)
NSUR: Surface roughness (Manning's n)
INTFW: Interflow index
IRC: Interflow Recession Constant (per day)
LZETP: Lower Zone Evapotranspiration fraction
148
0.70
0.50
0.35
0.35
0.30
0.30
see Table 7
see Table 7
see Table 7
Appendix A
Santa Margarita Region Hydrology Model Guidance – June 2013
Table 5. SMRHM HSPF Pervious Parameter Values – Part VI
PERLND No.
1
2
3
4
5
6
7
8
9
10
11
12
13
14
15
16
17
18
19
20
21
22
23
24
25
26
27
28
29
30
31
32
33
34
35
36
37
38
39
40
41
42
43
44
45
CEPS
0.00
0.00
0.00
0.00
0.00
0.00
0.00
0.00
0.00
0.00
0.00
0.00
0.00
0.00
0.00
0.00
0.00
0.00
0.00
0.00
0.00
0.00
0.00
0.00
0.00
0.00
0.00
0.00
0.00
0.00
0.00
0.00
0.00
0.00
0.00
0.00
0.00
0.00
0.00
0.00
0.00
0.00
0.00
0.00
0.00
SURS
0.00
0.00
0.00
0.00
0.00
0.00
0.00
0.00
0.00
0.00
0.00
0.00
0.00
0.00
0.00
0.00
0.00
0.00
0.00
0.00
0.00
0.00
0.00
0.00
0.00
0.00
0.00
0.00
0.00
0.00
0.00
0.00
0.00
0.00
0.00
0.00
0.00
0.00
0.00
0.00
0.00
0.00
0.00
0.00
0.00
UZS
0.01
0.01
0.01
0.01
0.01
0.01
0.01
0.01
0.01
0.01
0.01
0.01
0.01
0.01
0.01
0.01
0.01
0.01
0.01
0.01
0.01
0.01
0.01
0.01
0.01
0.01
0.01
0.01
0.01
0.01
0.01
0.01
0.01
0.01
0.01
0.01
0.01
0.01
0.01
0.01
0.01
0.01
0.01
0.01
0.01
IFWS
0.00
0.00
0.00
0.00
0.00
0.00
0.00
0.00
0.00
0.00
0.00
0.00
0.00
0.00
0.00
0.00
0.00
0.00
0.00
0.00
0.00
0.00
0.00
0.00
0.00
0.00
0.00
0.00
0.00
0.00
0.00
0.00
0.00
0.00
0.00
0.00
0.00
0.00
0.00
0.00
0.00
0.00
0.00
0.00
0.00
149
LZS
0.50
0.50
0.50
0.50
0.50
0.50
0.50
0.50
0.50
0.50
0.50
0.50
3.50
3.50
3.50
3.50
0.50
0.50
0.50
0.50
0.50
0.50
0.50
0.50
0.50
0.50
0.50
0.50
3.50
3.50
3.50
3.50
0.50
0.50
0.50
0.50
0.50
0.50
0.50
0.50
0.50
0.50
0.50
0.50
3.50
AGWS
0.30
0.30
0.30
0.30
0.30
0.30
0.30
0.30
0.30
0.30
0.30
0.30
1.50
1.50
1.50
1.50
0.30
0.30
0.30
0.30
0.30
0.30
0.30
0.30
0.30
0.30
0.30
0.30
1.50
1.50
1.50
1.50
0.30
0.30
0.30
0.30
0.30
0.30
0.30
0.30
0.30
0.30
0.30
0.30
1.70
GWVS
0.01
0.01
0.01
0.01
0.01
0.01
0.01
0.01
0.01
0.01
0.01
0.01
0.10
0.10
0.10
0.10
0.01
0.01
0.01
0.01
0.01
0.01
0.01
0.01
0.01
0.01
0.01
0.01
0.10
0.10
0.10
0.10
0.01
0.01
0.01
0.01
0.01
0.01
0.01
0.01
0.01
0.01
0.01
0.01
0.10
Appendix A
46
47
48
Santa Margarita Region Hydrology Model Guidance – June 2013
0.00
0.00
0.00
0.00
0.00
0.00
0.01
0.01
0.01
0.00
0.00
0.00
CEPS: Initial interception storage (inches)
SURS: Initial surface runoff (inches)
UZS: Initial Upper Zone Storage (inches)
IFWS: Initial interflow (inches)
LZS: Initial Lower Zone Storage (inches)
AGWS: Initial Active Groundwater storage (inches)
GWVS: Initial Groundwater Vertical Slope (feet/feet)
150
3.50
3.50
3.50
1.70
1.70
1.70
0.10
0.10
0.10
Appendix A
Santa Margarita Region Hydrology Model Guidance – June 2013
Table 6. SMRHM HSPF Pervious Parameter Values: Monthly Interception Storage (inches)
PERLND No.
1
2
3
4
5
6
7
8
9
10
11
12
13
14
15
16
17
18
19
20
21
22
23
24
25
26
27
28
29
30
JAN
0.15
0.15
0.15
0.15
0.13
0.13
0.13
0.13
0.12
0.12
0.12
0.12
0.11
0.11
0.11
0.11
0.15
0.15
0.15
0.15
0.13
0.13
0.13
0.13
0.12
0.12
0.12
0.12
0.11
0.11
FEB
0.15
0.15
0.15
0.15
0.13
0.13
0.13
0.13
0.12
0.12
0.12
0.12
0.11
0.11
0.11
0.11
0.15
0.15
0.15
0.15
0.13
0.13
0.13
0.13
0.12
0.12
0.12
0.12
0.11
0.11
MAR
0.15
0.15
0.15
0.15
0.13
0.13
0.13
0.13
0.12
0.12
0.12
0.12
0.11
0.11
0.11
0.11
0.15
0.15
0.15
0.15
0.13
0.13
0.13
0.13
0.12
0.12
0.12
0.12
0.11
0.11
APR
0.20
0.20
0.20
0.20
0.14
0.14
0.14
0.14
0.11
0.11
0.11
0.11
0.11
0.11
0.11
0.11
0.20
0.20
0.20
0.20
0.14
0.14
0.14
0.14
0.11
0.11
0.11
0.11
0.11
0.11
MAY
0.20
0.20
0.20
0.20
0.15
0.15
0.15
0.15
0.10
0.10
0.10
0.10
0.11
0.11
0.11
0.11
0.20
0.20
0.20
0.20
0.15
0.15
0.15
0.15
0.10
0.10
0.10
0.10
0.11
0.11
JUN
0.20
0.20
0.20
0.20
0.15
0.15
0.15
0.15
0.10
0.10
0.10
0.10
0.11
0.11
0.11
0.11
0.20
0.20
0.20
0.20
0.15
0.15
0.15
0.15
0.10
0.10
0.10
0.10
0.11
0.11
152
JUL
0.20
0.20
0.20
0.20
0.15
0.15
0.15
0.15
0.10
0.10
0.10
0.10
0.11
0.11
0.11
0.11
0.20
0.20
0.20
0.20
0.15
0.15
0.15
0.15
0.10
0.10
0.10
0.10
0.11
0.11
AUG
0.20
0.20
0.20
0.20
0.15
0.15
0.15
0.15
0.10
0.10
0.10
0.10
0.11
0.11
0.11
0.11
0.20
0.20
0.20
0.20
0.15
0.15
0.15
0.15
0.10
0.10
0.10
0.10
0.11
0.11
SEP
0.20
0.20
0.20
0.20
0.15
0.15
0.15
0.15
0.10
0.10
0.10
0.10
0.11
0.11
0.11
0.11
0.20
0.20
0.20
0.20
0.15
0.15
0.15
0.15
0.10
0.10
0.10
0.10
0.11
0.11
OCT
0.20
0.20
0.20
0.20
0.15
0.15
0.15
0.15
0.10
0.10
0.10
0.10
0.11
0.11
0.11
0.11
0.20
0.20
0.20
0.20
0.15
0.15
0.15
0.15
0.10
0.10
0.10
0.10
0.11
0.11
NOV
0.20
0.20
0.20
0.20
0.14
0.14
0.14
0.14
0.11
0.11
0.11
0.11
0.11
0.11
0.11
0.11
0.20
0.20
0.20
0.20
0.14
0.14
0.14
0.14
0.11
0.11
0.11
0.11
0.11
0.11
DEC
0.18
0.18
0.18
0.18
0.13
0.13
0.13
0.13
0.12
0.12
0.12
0.12
0.11
0.11
0.11
0.11
0.18
0.18
0.18
0.18
0.13
0.13
0.13
0.13
0.12
0.12
0.12
0.12
0.11
0.11
Appendix A
31
32
33
34
35
36
37
38
39
40
41
42
43
44
45
46
47
48
Santa Margarita Region Hydrology Model Guidance – June 2013
0.11
0.11
0.15
0.15
0.15
0.15
0.13
0.13
0.13
0.13
0.12
0.12
0.12
0.12
0.11
0.11
0.11
0.11
0.11
0.11
0.15
0.15
0.15
0.15
0.13
0.13
0.13
0.13
0.12
0.12
0.12
0.12
0.11
0.11
0.11
0.11
0.11
0.11
0.15
0.15
0.15
0.15
0.13
0.13
0.13
0.13
0.12
0.12
0.12
0.12
0.11
0.11
0.11
0.11
0.11
0.11
0.20
0.20
0.20
0.20
0.14
0.14
0.14
0.14
0.11
0.11
0.11
0.11
0.11
0.11
0.11
0.11
0.11
0.11
0.20
0.20
0.20
0.20
0.15
0.15
0.15
0.15
0.10
0.10
0.10
0.10
0.11
0.11
0.11
0.11
0.11
0.11
0.20
0.20
0.20
0.20
0.15
0.15
0.15
0.15
0.10
0.10
0.10
0.10
0.11
0.11
0.11
0.11
153
0.11
0.11
0.20
0.20
0.20
0.20
0.15
0.15
0.15
0.15
0.10
0.10
0.10
0.10
0.11
0.11
0.11
0.11
0.11
0.11
0.20
0.20
0.20
0.20
0.15
0.15
0.15
0.15
0.10
0.10
0.10
0.10
0.11
0.11
0.11
0.11
0.11
0.11
0.20
0.20
0.20
0.20
0.15
0.15
0.15
0.15
0.10
0.10
0.10
0.10
0.11
0.11
0.11
0.11
0.11
0.11
0.20
0.20
0.20
0.20
0.15
0.15
0.15
0.15
0.10
0.10
0.10
0.10
0.11
0.11
0.11
0.11
0.11
0.11
0.20
0.20
0.20
0.20
0.14
0.14
0.14
0.14
0.11
0.11
0.11
0.11
0.11
0.11
0.11
0.11
0.11
0.11
0.18
0.18
0.18
0.18
0.13
0.13
0.13
0.13
0.12
0.12
0.12
0.12
0.11
0.11
0.11
0.11
Appendix A
Santa Margarita Region Hydrology Model Guidance – June 2013
Table 7. SMRHM HSPF Pervious Parameter Values: Monthly Lower Zone Evapotranspiration
PERLND No.
1
2
3
4
5
6
7
8
9
10
11
12
13
14
15
16
17
18
19
20
21
22
23
24
25
26
27
28
29
30
JAN
0.60
0.60
0.60
0.60
0.50
0.50
0.50
0.50
0.40
0.40
0.40
0.40
0.50
0.50
0.50
0.50
0.60
0.60
0.60
0.60
0.50
0.50
0.50
0.50
0.40
0.40
0.40
0.40
0.50
0.50
FEB
0.60
0.60
0.60
0.60
0.50
0.50
0.50
0.50
0.40
0.40
0.40
0.40
0.50
0.50
0.50
0.50
0.60
0.60
0.60
0.60
0.50
0.50
0.50
0.50
0.40
0.40
0.40
0.40
0.50
0.50
MAR
0.60
0.60
0.60
0.60
0.50
0.50
0.50
0.50
0.40
0.40
0.40
0.40
0.50
0.50
0.50
0.50
0.60
0.60
0.60
0.60
0.50
0.50
0.50
0.50
0.40
0.40
0.40
0.40
0.50
0.50
APR
0.70
0.70
0.70
0.70
0.60
0.60
0.60
0.60
0.45
0.45
0.45
0.45
0.60
0.60
0.60
0.60
0.70
0.70
0.70
0.70
0.60
0.60
0.60
0.60
0.45
0.45
0.45
0.45
0.60
0.60
MAY
0.75
0.75
0.75
0.75
0.65
0.65
0.65
0.65
0.50
0.50
0.50
0.50
0.65
0.65
0.65
0.65
0.75
0.75
0.75
0.75
0.65
0.65
0.65
0.65
0.50
0.50
0.50
0.50
0.65
0.65
JUN
0.75
0.75
0.75
0.75
0.65
0.65
0.65
0.65
0.55
0.55
0.55
0.55
0.65
0.65
0.65
0.65
0.75
0.75
0.75
0.75
0.65
0.65
0.65
0.65
0.55
0.55
0.55
0.55
0.65
0.65
154
JUL
0.75
0.75
0.75
0.75
0.65
0.65
0.65
0.65
0.55
0.55
0.55
0.55
0.65
0.65
0.65
0.65
0.75
0.75
0.75
0.75
0.65
0.65
0.65
0.65
0.55
0.55
0.55
0.55
0.65
0.65
AUG
0.75
0.75
0.75
0.75
0.65
0.65
0.65
0.65
0.55
0.55
0.55
0.55
0.65
0.65
0.65
0.65
0.75
0.75
0.75
0.75
0.65
0.65
0.65
0.65
0.55
0.55
0.55
0.55
0.65
0.65
SEP
0.75
0.75
0.75
0.75
0.65
0.65
0.65
0.65
0.55
0.55
0.55
0.55
0.65
0.65
0.65
0.65
0.75
0.75
0.75
0.75
0.65
0.65
0.65
0.65
0.55
0.55
0.55
0.55
0.65
0.65
OCT
0.75
0.75
0.75
0.75
0.65
0.65
0.65
0.65
0.55
0.55
0.55
0.55
0.65
0.65
0.65
0.65
0.75
0.75
0.75
0.75
0.65
0.65
0.65
0.65
0.55
0.55
0.55
0.55
0.65
0.65
NOV
0.65
0.65
0.65
0.65
0.55
0.55
0.55
0.55
0.45
0.45
0.45
0.45
0.55
0.55
0.55
0.55
0.65
0.65
0.65
0.65
0.55
0.55
0.55
0.55
0.45
0.45
0.45
0.45
0.55
0.55
DEC
0.60
0.60
0.60
0.60
0.50
0.50
0.50
0.50
0.40
0.40
0.40
0.40
0.50
0.50
0.50
0.50
0.60
0.60
0.60
0.60
0.50
0.50
0.50
0.50
0.40
0.40
0.40
0.40
0.50
0.50
Appendix A
31
32
33
34
35
36
37
38
39
40
41
42
43
44
45
46
47
48
Santa Margarita Region Hydrology Model Guidance – June 2013
0.50
0.50
0.60
0.60
0.60
0.60
0.50
0.50
0.50
0.50
0.40
0.40
0.40
0.40
0.50
0.50
0.50
0.50
0.50
0.50
0.60
0.60
0.60
0.60
0.50
0.50
0.50
0.50
0.40
0.40
0.40
0.40
0.50
0.50
0.50
0.50
0.50
0.50
0.60
0.60
0.60
0.60
0.50
0.50
0.50
0.50
0.40
0.40
0.40
0.40
0.50
0.50
0.50
0.50
0.60
0.60
0.70
0.70
0.70
0.70
0.60
0.60
0.60
0.60
0.45
0.45
0.45
0.45
0.60
0.60
0.60
0.60
0.65
0.65
0.75
0.75
0.75
0.75
0.65
0.65
0.65
0.65
0.50
0.50
0.50
0.50
0.65
0.65
0.65
0.65
0.65
0.65
0.75
0.75
0.75
0.75
0.65
0.65
0.65
0.65
0.55
0.55
0.55
0.55
0.65
0.65
0.65
0.65
155
0.65
0.65
0.75
0.75
0.75
0.75
0.65
0.65
0.65
0.65
0.55
0.55
0.55
0.55
0.65
0.65
0.65
0.65
0.65
0.65
0.75
0.75
0.75
0.75
0.65
0.65
0.65
0.65
0.55
0.55
0.55
0.55
0.65
0.65
0.65
0.65
0.65
0.65
0.75
0.75
0.75
0.75
0.65
0.65
0.65
0.65
0.55
0.55
0.55
0.55
0.65
0.65
0.65
0.65
0.65
0.65
0.75
0.75
0.75
0.75
0.65
0.65
0.65
0.65
0.55
0.55
0.55
0.55
0.65
0.65
0.65
0.65
0.55
0.55
0.65
0.65
0.65
0.65
0.55
0.55
0.55
0.55
0.45
0.45
0.45
0.45
0.55
0.55
0.55
0.55
0.50
0.50
0.60
0.60
0.60
0.60
0.50
0.50
0.50
0.50
0.40
0.40
0.40
0.40
0.50
0.50
0.50
0.50
Appendix A
Santa Margarita Region Hydrology Model Guidance – June 2013
This page has been intentionally left blank.
156
Appendix B
Santa Margarita Region Hydrology Model Guidance – June 2013
APPENDIX B: DEFAULT SMRHM HSPF IMPERVIOUS
PARAMETER VALUES
The default SMRHM HSPF impervious parameter values are found in SMRHM file
defaultpersp.uci.
HSPF parameter documentation is found in the document:
Bicknell, B.R., J.C. Imhoff, J.L. Kittle Jr, T.H. Jobes, and A.S. Donigian Jr. 2001.
Hydrological Simulation Program – Fortran, User's Manual for Version 12. AQUA
TERRA Consultants. Mountain View, CA.
Table 1. SMRHM Impervious Land Types
IMPLND No.
1
2
3
4
5
6
7
8
9
10
11
12
13
14
15
16
17
IMPLND Name
Roads
Roads
Roads
Roads
Roof Area
Driveways
Driveways
Driveways
Driveways
Sidewalks
Sidewalks
Sidewalks
Sidewalks
Parking
Parking
Parking
Parking
Land Slope
Flat (0-5%)
Moderate (5-10%)
Steep (10-20%)
Very Steep (>20%)
All
Flat (0-5%)
Moderate (5-10%)
Steep (10-20%)
Very Steep (>20%)
Flat (0-5%)
Moderate (5-10%)
Steep (10-20%)
Very Steep (>20%)
Flat (0-5%)
Moderate (5-10%)
Steep (10-20%)
Very Steep (>20%)
157
Appendix B
Santa Margarita Region Hydrology Model Guidance – June 2013
Table 2. SMRHM HSPF Impervious Parameter Values – Part I
IMPLND No.
1
2
3
4
5
6
7
8
9
10
11
12
13
14
15
16
17
LSUR
100
100
100
100
100
100
100
100
100
100
100
100
100
100
100
100
100
SLSUR
0.05
0.10
0.15
0.25
0.05
0.05
0.10
0.15
0.25
0.05
0.10
0.15
0.25
0.05
0.10
0.15
0.25
NSUR
0.10
0.10
0.10
0.10
0.10
0.10
0.10
0.10
0.10
0.10
0.10
0.10
0.10
0.10
0.10
0.10
0.10
RETSC
0.10
0.09
0.08
0.06
0.10
0.10
0.09
0.08
0.06
0.10
0.09
0.08
0.06
0.10
0.09
0.08
0.06
LSUR: Length of surface flow path (feet) for impervious area
SLSUR: Slope of surface flow path (feet/feet) for impervious area
NSUR: Surface roughness (Manning's n) for impervious area
RETSC: Surface retention storage (inches) for impervious area
158
Appendix B
Santa Margarita Region Hydrology Model Guidance – June 2013
Table 3. SMRHM HSPF Impervious Parameter Values – Part II
IMPLND No.
1
2
3
4
5
6
7
8
9
10
11
12
13
14
15
16
17
RETS
0.00
0.00
0.00
0.00
0.00
0.00
0.00
0.00
0.00
0.00
0.00
0.00
0.00
0.00
0.00
0.00
0.00
SURS
0.00
0.00
0.00
0.00
0.00
0.00
0.00
0.00
0.00
0.00
0.00
0.00
0.00
0.00
0.00
0.00
0.00
RETS: Initial surface retention storage (inches) for impervious area
SURS: Initial surface runoff (inches) for impervious area
159
Appendix B
Santa Margarita Region Hydrology Model Guidance – June 2013
This page has been intentionally left blank.
160
Appendix C
Santa Margarita Region Hydrology Model Guidance – June 2013
APPENDIX C: ADDITIONAL GUIDANCE FOR USING
SMRHM
Scope and Purpose: This appendix includes guidance and background information that
are not incorporated into the SMRHM software, but which the user needs to know in order
to use SMRHM for designing projects in the participating jurisdictions. The three main
topic areas in this appendix are flagged in the main guidance documentation text by
specially formatted notes under the SMRHM elements or software features to which they
are related:
Appendix C Topic
Infiltration Reduction Factor
Flow Duration Outlet Structures
(includes sizing of low-flow orifice and
alternative configurations)
Drawdown (drain) time for flow duration
facilities
Relevant Sections in Guidance documentation
Infiltration, page 69; applicable when specifying
characteristics of a facility (pond, vault, tank, some
LID elements) if "yes" is selected as the Infiltration
option.
Outlet Structure Configurations, pages 63-68;
applicable when specifying characteristics of a flow
duration facility.
Drawdown (Analysis screen), page 98.
This guidance was originally created by the stormwater programs of Alameda, Santa Clara,
and San Mateo Counties. Please consult with the local municipal permitting agency for
additional considerations.
Additional guidance and references are also discussed at the end of this appendix.
Infiltration Reduction Factor
The Western Washington Hydrology Model included this factor to reflect the requirement
in the Stormwater Management Manual for Western Washington (SMMWW), to
incorporate a Correction Factor (CF) to determine long-term infiltration rates; the inverse of
the CF is the Infiltration Reduction Factor in SMRHM. The SMMWW gives three methods
for determining CF: 1) a table providing empirical correlations between long-term
infiltration rates and USDA Soil Textural Classification; 2) American Society of Testing
and Materials (ASTM) gradation testing at full-scale infiltration facilities; or 3) In-situ
infiltration tests, preferably using a Pilot Infiltration Test specified in an appendix of the
SMMWW.
Application of a CF or safety factor attempts to account for clogging and the reduction in
infiltration over time, which might apply to the bottom of a flow duration pond or the top
layer of a bioretention facility. However, a safety factor is also used to account for
uncertainties in the available estimate of in-situ infiltration rates. The SMMWW notes that
its suggested CF values, which range from 2 to 4, "represent an average degree of long-term
facility maintenance, TSS reduction through pretreatment, and site variability in the
subsurface conditions", and that increases or decreases to these factors should be considered
161
Appendix C
Santa Margarita Region Hydrology Model Guidance – June 2013
for unusual situations.
Suggested safety factors in other texts and guidance generally range from 1 to 4. Santa
Margarita Region County MS4 permits may require some form of tracking and verification
for treatment and hydromodification facilities. In addition, designers should not be overly
conservative in selecting a very high safety factor, since this might lead to over-controlled
(lower) post-project flows and an increase risk of causing impacts from deposition or
sedimentation in the receiving channels. In the absence of other guidance, it is suggested
that the SMRHM Infiltration Reduction Factor not be less than 0.25 or greater than 0.5.
Note: Santa Margarita Region County stormwater programs may also restrict the use of
infiltration for treatment purposes in certain conditions; since the flow duration facilities are
also performing some treatment, designers should discuss treatment measure design with
the applicable jurisdiction.
Flow Duration Outlet Structures – Practical Design
Considerations
Low-flow Orifice Sizing
The diameter of the low-flow (bottom) orifice is an important design parameter for flow
duration facilities, since flows discharged through this outlet should be at or below the
project threshold for controlled flows (Qcp). However maintenance and/or other practical
considerations may dictate a practical limit to how small this orifice may be, which may be
larger than the optimal theoretical diameter determined by Auto Pond. As an example,
Riverside County specifies a minimum orifice diameter of 1.0 inch.
While the user can manually set a minimum size for the low-flow orifice, doing so before
running Auto Pond is not recommended as this may impair the program's ability to optimize
the pond configuration. The following general approach is suggested for designing a pond
when there is a small value for the low end of the flow matching range:
1.
2.
3.
4.
First estimate the minimum pond volume allowing Auto Pond to freely
determine the diameter and placement of all orifices.
Then manually accept all of the pond settings except low-flow orifice diameter.
Set the low-flow orifice to the desired minimum size, after consulting the local
municipal permitting agency.
Manually run the mitigated scenario as described on page 48 and review the
Analysis screen to check if the revised mitigated flow still passes the flowduration criteria for curve matching. If so, proceed with the pond design using
the revised outlet.
If the revised design shows Fail scoring at one or more flow levels, excess flow
durations may be reduced somewhat by reducing the depth of the pond which
lowers the head above the orifice. As an alternative, further mitigation can be
applied to the low-flow orifice flow by adding an additional infiltration measure
162
Appendix C
Santa Margarita Region Hydrology Model Guidance – June 2013
downstream. This can be sized either approximately by estimating an average
excess flow from the orifice or with the help of SMRHM by returning to the
screen for the pond characteristics and specifying a different Downstream
Connection for the bottom orifice, which is then connected to an additional
element. With this revision to the post project scenario, the POC for the system
would then be located at the downstream end of the additional low- flow
mitigation.
Alternative Outlet Configurations
SMRHM has two default types of outlet configurations (multiple orifice or orifice plus weir
notch) based on a standpipe riser structure detailed in the SMMWW. The entire standpipe
is usually within a cylindrical enclosure or manhole to exclude trash and larger particles
that could clog the outlet. The SMMWW notes that orifices can also be placed on a tee
section or a vertical baffle within the same type of enclosure. An alternative configuration
is a flat headwall with orifices and/or notches, protected by racks or gratings. This may be
fabricated from a large steel plate, similar in construction to the extended detention outlets
specified in the Denver (Colorado) manual referenced below. This alternative outlet can be
simulated in the SMRHM as a very large diameter standpipe, where the width of the top
notch is equal to the overflow width at the top of the plate between its supports.
Drawdown time and treatment/vector considerations
Flow duration control facilities are designed to detain stormwater runoff onsite for an
extended period of time. The drawdown time is a concern to designers in relation to three
areas of design besides hydromodification management:
1.
Standing water for extended periods provides a potential habitat in which
mosquitoes can breed. T h e C o p e r m i t t e e s work with their local
mosquito abatement or vector control agencies to develop guidelines for
hydrologic control facility design; the Riverside County Design Handbook for
Low Impact Development Best Management Practices identifies that hydrologic
control facilities must achieve 100% drawdown within 72 hours. Provisions for
access and inspection by vector control personnel are also required. Contact the
local permitting agency for details of local vector control provisions, which
apply to both treatment measures and flow duration facilities.
2.
Stormwater runoff that is detained also undergoes water quality treatment
through settling and/or infiltration of pollutants. The focus of water quality
management is reducing mean annual loads and typical concentrations of
pollutants in receiving waters, so treatment design focuses on typical storms
which contain the bulk of annual stormwater runoff volume. The MS4 permit
and guidance documents describe the Copermittees design criteria for volume
based treatment measures, which apply to a wider range of projects than the
hydromodification management requirements. Recommended drawdown times
163
Appendix C
Santa Margarita Region Hydrology Model Guidance – June 2013
for detention structures are typically at least 48 hours, but not to exceed 72 hours
within Riverside County.
164
Appendix C
3.
Santa Margarita Region Hydrology Model Guidance – June 2013
Flood control facility design criteria is intended to control peak flows for large
sized storms (with expected recurrence intervals such as 25, 50 or 100 years).
Hydrologic control facilities typically require capture and detention of a
specified volume of stormwater runoff, which then is discharged out at flows
that can be safely conveyed by downstream channels without undue risk of
flooding. Hydrologic control facilities usually are required to drain within 24
hours after the end of the design storm in order to be empty for the next storm
event. This concern that hydrologic control facility storage remains available for
large events has led the Copermittees to require that any storage volume for
water quality not be credited for flood control, a feature that is sometimes
referred to as "dead storage".
Although many factors affect the drawdown time, the suggestions below may help
SMRHM users in evaluating these other requirements. If flow duration control is required
for a project site, it is recommended that the design process start by using SMRHM to
obtain a preliminary design for the flow duration pond, vault, or tank. Then check the
performance of the facility for vector control concerns, and against treatment and/or flood
control design criteria as appropriate. The latter are both based on the concept of a single
empirical "design storm" which does not directly correspond to the flow duration approach
using frequency analysis in a long-term simulation. Stormwater runoff treatment design
requires the use of volume-based runoff coefficients, which although similar in concept to
runoff coefficients used for flood control, are determined differently. Runoff coefficients
used for flood control were derived for large storms with some conservatism built-in to
estimates of peak flow rates and water surface elevations. Runoff coefficients for
stormwater runoff treatment have been adjusted to reflect runoff from small storms where a
greater percentage of the rainfall is held within the catchment.
Vector Management
If the maximum allowed drawdown (72 hours) is seldom or never exceeded over the
simulation period, then likelihood of mosquito breeding in the facility is very low and the
design for the pond, vault or tank does not need to be modified. If a maximum allowed
drawdown time is exceeded then the system may need to be redesigned to reduce the
drawdown time. The designer should consider additional reductions in impervious area
and/or LID elements to help reduce the facility size.
To evaluate the frequency and distribution of larger events in more detail, use the
Hydrograph tool (page 99) to plot monthly peaks for several years at a time of the mitigated
(post-project) scenario to get an idea of how often the discharge that corresponds to the
maximum allowed drain time would be exceeded during warmer months, when mosquito
development times are shortest.
165
Appendix C
Santa Margarita Region Hydrology Model Guidance – June 2013
Treatment Credit
Use the applicable design criteria to determine the minimum treatment volume for the postproject scenario.
Look at the pond volume representing a 2-day drawdown in the
SMRHM's flow duration drawdown table. If this is larger than the calculated treatment
volume, no further treatment design is needed. If the pond volume is less than the
treatment volume, or always drains in less than 2 days, most or all of the water quality
criteria may still be met if the combination of infiltration loss and detainment captures 80%
of the runoff from the site. Infiltration loss for each pond stage is shown in the StageStorage-Discharge table, accessed by selecting the "Open Table" option at the bottom of the
main Pond screen.
Flood Control Detention
Design criteria must be obtained from the Copermittee with jurisdiction over the project
site, as well as any other policies or restrictions that may apply to drainage design. A single
design storm event can be imported as a time series (page 76) and applied to the postproject scenario instead of the simulated precipitation record. If additional live storage is
needed, it may be added to upper levels of the same facility or provided elsewhere on the
site.
Guidance by Other Agencies
Some agencies in other parts of the United States have developed extensive guidance for
design of hydrologic control facilities. Two manuals are discussed below that provide
detailed discussions or examples that may be helpful to users of SMRHM, although the
suitability of these recommendations for Riverside County conditions has not been verified.
These documents can help provide context and ideas for users for SMRHM, but adapting
these ideas requires the exercise of professional engineering judgment. Mention of the
procedures and details in these documents does not imply any endorsement or
guarantee that they will be appropriate for addressing the Hydromodification
Management Standards in Santa Margarita Region.
Stormwater Management Manual for Western Washington (SWMMWW) was prepared by
the Washington Department of Ecology for implementation in 19 counties of Western
Washington.
The latest (2012) edition in 5 volumes is on the Web at:
http://www.ecy.wa.gov/programs/wq/stormwater/manual.html.
Design recommendations from this manual were the basis for many features of the WWHM
that have been carried over into SMRHM. Portions of Volume 3 (Hydrology) that may be
of interest to project designers include:
Pages 3-2 through 3-18 illustrate several types of roof downspout controls, simple
pre-engineered designs for infiltrating and/or dispersing runoff from roof areas in
order to reduce runoff volume and/or increase potential groundwater recharge.
Pages 3-50 to 3-63 discuss outlet control structures, their maintenance and source
equations modeled into WWHM and SMRHM
166
Appendix C
Santa Margarita Region Hydrology Model Guidance – June 2013
Pages 3-75 to 3-93 regarding Infiltration Reduction Factor
Urban Storm Drain Criteria Manual by the Denver Urban Drainage and Flood Control
District is on the Web at: http://www.udfcd.org/downloads/down_critmanual.htm.
Volume 3 covers design of stormwater runoff treatment measures, including extended
detention basins on pages S-66 through S-77 and structural details shown on pages SD-1 to
SD-16. Although these designs are not presented for hydromodification management
control, the perforated plate design concept allows fine-tuning of drawdown times and is
adaptable for use in flow duration facilities.
167
Appendix D
Santa Margarita Region Hydrology Model Guidance – June 2013
APPENDIX D: SMRHM REVIEWER CHECKLIST
SMRHM Reviewer Checklist:
Yes No
1. Received SMRHM project (WHM and WH2) files?
2. Received SMRHM WDM (WDM) file?
3. Received SMRHM report (DOC) file?
4. Project (WHM) file loads okay?
5. Project location matches location on SMRHM screen?
6. Predevelopment scenario runs okay?
7. Mitigated scenario runs okay?
8. Compare SMRHM Report screen with report file:
a. Project location descriptions match?
b. Precipitation gauges match?
c. Precipitation scales match?
d. Flow frequency results match?
e. All flow duration values PASS?
f. Any pervious (PERLND) land use changes?
g. Any impervious (IMPLND) land use changes?
h. Any scaling factor changes?
i. Any duration criteria changes?
j. pond dimensions match?
k. pond outlet structure info matches?
9. SMRHM pond dimensions match drawings?
10. Infiltration set to YES for infiltration pond?
11. Total SMRHM drainage area matches drainage maps/drawings?
12. Mitigated drainage area(s) match Predevelopment?
13. Predevelopment vegetation correct?
14. Mitigated land use areas correct?
15. Routing correct?
16. Check facility drawdown (if included):
a. Used POC Mitigated stage?
b. Drawdown times okay?
17. Options set to default values?
18. Other issues?
SMRHM submittal APPROVED?
168
Appendix D
Santa Margarita Region Hydrology Model Guidance – June 2013
This page has been intentionally left blank.
169
Appendix E
Santa Margarita Region Hydrology Model Guidance – June 2013
APPENDIX E: SMRHM BACKGROUND
Effects of Hydromodification
Urbanization of a watershed modifies natural watershed and stream processes by altering
the terrain, modifying the vegetation and soil characteristics, introducing pavement and
buildings, installing drainage and flood control infrastructure, and altering the condition of
channels through straightening, deepening, and armoring. These changes affect hydrologic
characteristics in the watershed (rainfall interception, infiltration, runoff and channel flows),
and affect the supply and transport of sediment in the MS4 and receiving waters. The
change in runoff characteristics from a watershed caused by changes in land use conditions
is called hydrograph modification, or simply hydromodification.
As the total area of impervious surfaces increases in previously undeveloped areas,
infiltration of rainfall decreases, causing more water to run off the surface as overland flow
at a faster rate. Storms that previously didn't produce runoff under rural conditions can
produce erosive flows. The increase in the volume of runoff and the length of time that
erosive flows occur ultimately intensify sediment transport, causing changes in sediment
transport characteristics and the hydraulic geometry (width, depth, and slope) of channels.
The larger runoff durations and volumes and the intensified erosion of streams can impair
the beneficial uses of the stream channels.
Development of the SMRHM
The concept of designing a flow duration control facility is relatively new and, as described
above, requires the use of a continuous simulation hydrologic model. To facilitate this
design approach, Clear Creek Solutions (CCS) has created a user-friendly, automated
modeling and flow duration control facility sizing software tool adapted from its Western
Washington Hydrology Model (WWHM). The WWHM was developed in 2001 for the
Washington State Department of Ecology to support Ecology's Stormwater Management
Manual for Western Washington 1 and assist project proponents in complying with the
Western Washington hydromodification control requirements. The SMRHM is adapted
from WWHM Version 4, but has been modified to represent Riverside County hydrology
and enhanced to be able to size other types of control measures and LID techniques for flow
reduction as well.
SMRHM is a useful tool in the design process, but must be used in conjunction with local
design guidance to ensure compliance for specific projects. The reader should refer to
Appendix C and guidance from the Copermittee with jurisdiction over the project site for
additional information and suggestions for using the SMRHM.
1 Washington State Department of Ecology. 2001. Stormwater Management Manual for Western Washington.
Volume III: Hydrologic Analysis and Flow Control Design/BMPs. Publication No. 99-13. Olympia, WA.
170
Appendix E
Santa Margarita Region Hydrology Model Guidance – June 2013
SMRHM Overview
The SMRHM software architecture and methodology is the same as that developed for Bay
Area Hydrology Model, San Diego Hydrology Model, South Orange County Hydrology
Model, and WWHM and uses HSPF as its computational engine 2. Like these models,
SMRHM is a tool that generates flow duration curves for the pre- and post-project
condition and then sizes a flow duration control pond/basin or vault and outlet structure to
match the predevelopment curve. The software package consists of a user-friendly
graphical interface with screens for input of predevelopment and post-project conditions; an
engine that automatically loads appropriate parameters and meteorological data and runs
continuous simulations of site runoff to generate flow duration curves; a module for sizing
or checking the control measure to achieve the hydromodification control standard; and a
reporting module.
The HSPF hydrology parameter values used in SMRHM are based on best professional
judgment using our experience with calibrated watersheds in other parts of California.
SMRHM uses the Riverside County long-term 15-minute precipitation data records selected
to represent SMR rainfall patterns.
HSPF is the U.S. Geological Survey and U.S. Environmental Protection Agency continuous
simulation hydrology software package maintained by AQUA TERRA Consultants. The
HSPF continuous simulation hydrology model is preferred over single- event hydrology
models because of its ability to compute and keep track of all of the individual components
of the hydrologic cycle including surface runoff, interflow, groundwater, soil moisture, and
evapotranspiration. HSPF, since its introduction in 1980, has become the industry standard
for hydrologic modeling.
One of the major advantages of continuous simulation hydrologic modeling is the ability to
accurately determine soil moisture conditions immediately prior to storm events. Singleevent hydrologic models have to make assumptions about the antecedent soil moisture
conditions – assumptions which are often not accurate or appropriate. This is an important
distinction because antecedent soil moisture conditions play a major role in determining the
amount and timing of runoff.
Not all continuous simulation hydrologic models handle the calculation of soil moisture
conditions in the same level of detail. HSPF uses a potential evapotranspiration time series
to compute actual evapotranspiration each time step. HSPF uses parameter values to
determine the proportion of the actual evapotranspiration from interception storage, upper
soil layer storage, lower soil zone layer storage, groundwater storage, and base flow. Other
continuous simulation hydrologic models, SWMM included, use a much more simplified
approach to determining soil moisture. Such simplified approaches do not accurately
reflect the seasonal and daily variability of the actual evapotranspiration and its effects on
soil moisture.
2
SMRHM is based on WWHM Version 4.
171
Appendix E
Santa Margarita Region Hydrology Model Guidance – June 2013
Santa Margarita Region Hydrology Model Guidance – May 2013
SMRHM computes stormwater runoff for a site selected by the user. SMRHM runs HSPF
in the background to generate a 15-minute runoff time series from the available rain gauge
data over a number of years. Stormwater runoff is computed for both predevelopment and
post-project land use conditions. Then, another part of the SMRHM routes the post-project
stormwater runoff through a hydrologic control facility of the user's choice.
SMRHM uses the Predevelopment peak flood values from a partial duration series of
individual peak events to compute the predevelopment 2-year through 25-year flood
frequency values 3 . The post-project runoff 2-year through 25-year flood frequency values
are computed at the outlet of the proposed hydrologic control facility. The model routes the
post-project runoff through the hydrologic control facility. As with the predevelopment
peak flow values, partial duration post-project flow values are selected by SMRHM to
compute the developed 2-year through 25-year flood frequency.
The Predevelopment 2-year peak flow is multiplied by a percentage (10 percent) to set the
lower limit of the erosive flows, in accordance with the current HMP performance criteria.
The predevelopment 10-year peak flow is the upper limit. A comparison of the
predevelopment and post-project flow duration curves is conducted for 100 flow levels
between the lower limit and the upper limit. The model counts the number of 15-minute
intervals that predevelopment flows exceed each of the flow levels during the entire
simulation period. The model does the same analysis for the post-project mitigated flows.
LID BMPs have been recognized as opportunities to reduce and/or eliminate stormwater
runoff at the source before it becomes a problem. They include compost-amended soils,
bioretention, permeable pavement, green roofs, rain gardens, and vegetated swales. All of
these approaches reduce stormwater runoff. SMRHM can be used to determine the
magnitude of the reduction from each of these practices and the amount of stormwater
runoff detention storage still required to meet HMP requirements.
3
The actual flood frequency calculations are made using the Cunnane flood frequency equation.
172
Appendix E
Santa Margarita Region Hydrology Model Guidance – June 2013
Bioretention Modeling Methodology
The bioretention element is also known as a landscape swale or rain garden. The SMRHM
bioretention element is a special conveyance feature with unique characteristics. The
element uses the HSPF hydraulic algorithms to route runoff, but the HSPF routing is
modified to represent the two different flow paths that runoff can take. The routing is
dependent on the inflow to the swale and the swale soil capacity to absorb additional
runoff. HSPF Special Actions is used to check the swale soil capacity to determine the
appropriate routing option.
A bioretention facility is a swale in which the native soils have been excavated and
replaced with amended soil. At the downstream end of the swale, a weir or riser controls
the surface discharge from the swale and detains runoff, encouraging it to infiltrate into the
amended soil. Infiltration from the amended soil to the native soil is also possible,
depending on the properties of the native soil. Swales can include an underdrain pipe.
The amended soil placed in the swale is assumed to have storage capacity equal to its
porosity and volume. Stormwater runoff infiltrates from the surface of the swale to the
amended soil at an infiltration rate set by the user. The infiltration rate cannot exceed the
available storage capacity of the amended soil. The available storage capacity is
determined each time step by HSPF Special Actions. Once the amended soil is saturated
then water has the opportunity to infiltrate into the underlying native soil at the native soil's
infiltration rate. The native soil infiltration is input by the user and is assumed to be
constant throughout the year.
Inflow to the swale can exceed the amended soil infiltration rate. When this occurs, the
extra water ponds on the surface of the swale. The extra water can then infiltrate into the
soil during the next time step or can flow out of the swale through its surface outlet if the
ponding exceeds the surface outlet's storage.
Runoff in both the surface storage and amended soil storage is available for
evapotranspiration. Surface storage evapotranspiration is set to the potential
evapotranspiration; the amended soil evapotranspiration pan evaporation factor is set to
0.50 to reflect reduced evapotranspiration from the amended soil.
In the amended soil water movement through the soil column is dependent on soil layer
characteristics and saturation rates for different discharge conditions.
Consider a simple two-layered bioretention facility designed with two soil layers with
different characteristics. As water enters the facility at the top, it infiltrates into the soil
based on the modified Green Ampt equation (Equation 1). The water then moves through
the top soil layer at the computed rate, determined by Darcy's and Van Genuchten's
equations. As the soil approaches field capacity (i.e., gravity head is greater than matric
head), we can determine when water will begin to infiltrate into the second layer (lower
layer) of the soil column. This occurs when the matric head is less than the gravity head in
the first layer (top layer).
173
Appendix E
Santa Margarita Region Hydrology Model Guidance – June 2013
Since the two layers have different soil characteristics, water will move through the two
layers at different rates. Once both layers have achieved field capacity then the layer that
first becomes saturated is determined by which layer is more restrictive. This is determined
by using Darcy's equation to compute flux for each layer at the current level of saturation.
The layer with the more restrictive flux is the layer that becomes saturated for that time
step. The next time step the same comparison is made.
The rate and location of water discharging from the soil layer is determined by the
discharge conditions selected by the user.
There are four possible combinations of discharge conditions:
1.
There is no discharge from the subsurface layers (except for evapotranspiration).
This means that there is no underdrain and there is no infiltration into the native
soil. Although this discharge condition is unlikely, we still need to be able to
model it.
2.
There is an underdrain, but no native infiltration. Discharge from the underdrain
is computed based on head conditions for the underdrain. The underdrain is
configured to have an orifice. (It is possible for the orifice to be the same
diameter as the underdrain.) With a maximum of three soil layers determining
head conditions for the orifice is complicated. Each modeled layer must
overcome matric head before flow through the underdrain can begin. Once
matric head is overcome by gravity head for all of the layers then the underdrain
begins to flow. The flow rate is determined based on the ability of the water to
move through the soil layers and by the discharge from the orifice, whichever is
smaller. Head conditions are determined by computing the saturation level of
the lowest soil layer first. Once the lowest soil layer is saturated and flow
begins, then the gravity head is considered to be at the saturation level of the
lowest soil layer. Once the lowest soil layer is saturated completely then the
head will include the gravity head from the next soil layer above until gravity
head from all soil layers is included. Gravity head from ponding on the surface
is included in the orifice calculations only if all of the intervening soil layers are
saturated.
3.
There is native infiltration but no underdrain. Discharge (infiltration) into the
native soil is computed based on a user entered infiltration rate in units of inches
per hour. Specific head conditions are not used in determining infiltration into
the native soil. Any impact due to head on the infiltration rate is considered to
be part of the determination of the native soil infiltration rate. Because it is
possible to have a maximum of three soil layers, each modeled layer must
overcome matric head before infiltration to the native soil can begin. Once
matric head is overcome by gravity head for all modeled layers, then infiltration
begins at a maximum rate determined either by the ability of the water to move
through the soil layers or by the ability of the water to infiltrate into the native
soil, whichever is limiting.
174
Appendix E
4.
Santa Margarita Region Hydrology Model Guidance – June 2013
There is both an underdrain and native infiltration. Underdrain flow and native
infiltration are computed as discussed above. However, there is one other
limitation to consider. In the case where the flow through the soil layer is less
than the sum of the discharge through the underdrain and the native infiltration,
then the flow through the soil layer becomes the limiting flow and must be
divided between the native infiltration and the underdrain. This division is done
based on the relative discharge rates of each.
Note that wetted surface area can be included in the discharge calculations by adding the
infiltration through the wetted surface area to the lower soil layer and the upper surface
layer individually. This is done by computing the portion of the wetted surface area that is
part of the upper surface layer and computing the infiltration independently from the
portion of the wetted surface area that is part of the lower soil layers.
There are several equations used to determine water movement from the surface of the
bioretention facility, through the soil layers, and into an underdrain or native infiltration.
The water movement process can be divided into three different zones:
1.
2.
3.
Surface ponding and infiltration into the top soil layer (soil layer 1)
Percolation through the subsurface layers
Underdrain flow and native infiltration
175
Appendiix E
Santa Margaritta Region Hydroology Model Guiidance – June 20013
m
Greeen Ampt equ
uation (Equaation 1) contr
trols the infilltration rate into the top
The modified
soil lay
yer:
( )(d )
f K 1
F
(E
Equation 1)
f = soil surface inffiltration ratee (cm/hr)
soiil porosity off top soil layeer
soiil moisture coontent of topp soil layer
sucction head att the wettingg front (cm)
F= soiil moisture content
c
of the top soil lay
yer (cm)
d= surrface ponding
g depth (cm))
K= hyd
draulic cond
ductivity based on saturaation of top ssoil layer (cm
m/hr)
K (relaative hydrau
ulic conductiv
vity) can be computed uusing the folllowing Van Genuchten
approx
ximation equ
uation:
(Eqquation 2)
ng with multtiple subsurfface soil layeers. The K vvalue used inn
A few issues arise when dealin
p soil layer. Infiltration into the uppper soil layerr
Equatiion 1 must be computed from the top
must not
n exceed th
he lesser of the
t maximum
m percolatio n rates for each of the sooil layers.
Finally
y, the rate off percolation
n of the top laayer may bee reduced beccause the layyer or layerss
beneatth the top lay
yer cannot acccept the perrcolation fluux because of existing saaturation
levels.
176
Appendix E
Santa Margarita Region Hydrology Model Guidance – June 2013
Water storage and movement through the three subsurface layers will be computed using
Darcy’s equation as shown below:
q K
h
z
(Equation 3)
Where:
q = Darcy flux (cm/hr)
K = hydraulic conductivity of the porous medium (cm/hr)
h = total hydraulic head (cm)
z = elevation (cm)
The total head, h, is the sum of the matric head, , and the gravity head, z:
h z .
(Equation 4)
Substituting for h yields:
q K
d ( z )
.
dz
(Equation 5)
177
Appendiix E
Santa Margaritta Region Hydroology Model Guiidance – June 20013
Hydrau
ulic conducttivity and matric
m
head vary
v
with soiil moisture ccontent. Theese values ccan
be com
mputed by solving the Van
V Genuchtten's equatioon (Equationn 6) for bothh values. Noote
that 0 when th
he soil is saturated.
(Equation 6)
Effectiive saturatio
on (SE) can be computeed using thee following Van Genuchhten equatioon:
(Equation 7)
Ignorin
ng z (elevatiion head) ressults in h = hm
h (matric hhead).
Evapotranspiration
n is an imp
portant com
mponent of tthe bioretenntion facilityy's hydrologgic
processses. Evapottranspiration
n removes water
w
from bbioretention surface ponnding and tthe
soil column
c
duriing non-sto
orm periodss. The rooutine will satisfy pottential evappotranspiiration (PET
T) demands in the same sequence
s
as iimplementedd in HSPF:
1.
1
2.
2
3.
3
Water available
a
fro
om vegetatio
on interceptioon storage
Water available
a
fro
om surface ponding
Water available
a
fro
om the biorettention soil llayers (top laayer first)
178
Appendix E
Santa Margarita Region Hydrology Model Guidance – June 2013
Water will be removed from vegetation interception storage and surface ponding and the
bioretention soil layers (starting at the top layer) down to the rooting depth at the potential
rate. Water is taken from the soil layers below the rooting depth based on a percentage
factor to be determined. Without this factor there will be no way to remove water from
below the rooting depth once it becomes completely saturated.
179