1
Data Ally™
Chromatography Manager
User's Manual
Data Ally Chromatography Manager User's Manual
Contents
Figures .................................................................................................................................................................. 7
License Agreement ............................................................................................................................................. 11
1.0 Introduction: Data Ally Chromatography Manager ..................................................................................... 13
2.0 Data Ally Specifications .............................................................................................................................. 14
2.1.0 Number of instruments.......................................................................................................................... 14
2.2.0 Signal Inputs/Acquisition...................................................................................................................... 14
2.3.0 Graphics................................................................................................................................................ 14
2.4.0 Methods ................................................................................................................................................ 14
2.5.0 Integration/Peak Identification.............................................................................................................. 15
2.6.0 Calibration ............................................................................................................................................ 15
2.7.0 Batch Operations................................................................................................................................... 15
2.8.0 Reports.................................................................................................................................................. 16
2.9.0 Files Handling....................................................................................................................................... 16
3.0 Installing Data Ally Chromatography Manager ........................................................................................... 17
3.1.0. Contents Listing ................................................................................................................................... 17
3.2.0 Installation ............................................................................................................................................ 17
3.2.1. Install the Data Ally Card ................................................................................................................ 17
3.2.2 Install the Data Ally Software........................................................................................................... 18
3.3.0. Starting Data Ally ................................................................................................................................ 20
3.4.0 Installing Data Ally Software Upgrades................................................................................................ 20
4.0 The Data Ally Desktop: Basics................................................................................................................... 21
4.1.0 Menus and Commands.......................................................................................................................... 21
4.1.1 Dialog Boxes ..................................................................................................................................... 22
4.2.0 Data Ally Windows............................................................................................................................... 25
4.2.1 Switching Between Windows ........................................................................................................... 26
4.2.2 Making a Window "Active".............................................................................................................. 26
4.2.3 Moving Windows and Dialog Boxes ................................................................................................ 26
4.2.4 Expanding Windows to Maximum Size............................................................................................ 27
4.2.5 Resizing Windows ............................................................................................................................ 27
4.2.6 Closing a Window............................................................................................................................. 28
4.2.7 Minimizing a Window ...................................................................................................................... 28
4.2.8 Splitting a Window ........................................................................................................................... 28
4.3.0 Mouse Pointers and Techniques ........................................................................................................... 29
4.3.1 Pointer Shapes .................................................................................................................................. 29
4.3.2 Basic Mouse Techniques .................................................................................................................. 31
4.4.0 Data Ally Tables ................................................................................................................................... 31
4.4.1 Moving Around in Tables ................................................................................................................. 31
4.4.2 Adding, Moving, Copying, and Changing Rows .............................................................................. 33
5.0 Configuring Data Ally.................................................................................................................................. 35
5.1.0 Configuration Files ............................................................................................................................... 35
5.2.0 Performing a Startup Configuration...................................................................................................... 35
5.2.1 Selecting Configured Components.................................................................................................... 37
5.2.2 Configuring Signal Inputs ................................................................................................................. 38
5.2.3 Configuring Relay Flags ................................................................................................................... 41
5.2.4 Deleting Components........................................................................................................................ 42
5.2.5 Setting Controlled System Instrument Components.......................................................................... 43
5.2.6 Program Screen Options, Menus, and Defaults ................................................................................ 45
5.3.0 Configuration Files ............................................................................................................................... 89
5.3.1 Saving Configuration Files ............................................................................................................... 89
5.3.2 Loading Configuration Files ............................................................................................................. 90
5.3.3 Deleting Configuration Files............................................................................................................. 90
6.0 Getting Started ............................................................................................................................................. 91
6.1.0. Operating Structure and Programs ....................................................................................................... 91
Data Ally Chromatography Manager User's Manual
6.2.0 Files and File Manipulations .................................................................................................................92
6.3.0 Entering the Data Ally Software............................................................................................................93
6.4.0 Using the Default System ......................................................................................................................93
6.4.1 Starting a Run....................................................................................................................................93
6.4.2 Analyzing Run Data Manually ..........................................................................................................94
6.4.3 Completing the Integration Peak Table .............................................................................................94
6.4.4 Setting Up a Calibration File.............................................................................................................95
6.4.5 Programming a Simple Sequence......................................................................................................97
6.5.0 Exiting the Data Ally System ................................................................................................................98
7.0 Chromatogram Display, Review, and Editing: Graph Screen ...................................................................100
7.1.0 GRAPH Screen Commands.................................................................................................................101
7.1.1 Application and Program Control Menu Commands ......................................................................101
7.1.2 Screen-Based Commands ................................................................................................................101
7.1.3 Graph Command Menu Bar ............................................................................................................104
7.2.0 Working With Chromatogram Files ....................................................................................................105
7.2.1 Files Commands ..............................................................................................................................105
7.3.0 Editing Graph Files .............................................................................................................................108
7.3.1 Editing Commands ..........................................................................................................................108
7.3.2 Integrating Chromatograms Manually.............................................................................................109
7.3.3 Manual Chromatogram Baseline Editing ........................................................................................111
7.3.4 Manual Zone Code Editing .............................................................................................................114
7.3.5 Manual Chromatogram Analysis .....................................................................................................117
7.3.6 Manual Calibration..........................................................................................................................119
7.3.7 Manual System Suitability Calculations ..........................................................................................121
7.3.8 Cutting the Current Display Image..................................................................................................121
7.4.0 Math Functions....................................................................................................................................122
7.4.1 Adding/Subtracting/Ratioing Chromatograms ................................................................................122
7.5.0 View Commands .................................................................................................................................123
7.5.1 View Commands .............................................................................................................................123
7.6.0 Changing Graph Display Characteristics.............................................................................................125
7.6.1 Display Attributes............................................................................................................................125
7.6.2 Screen Display Characteristics Settings ..........................................................................................127
7.6.3 Status Box .......................................................................................................................................131
7.6.4 Monitor Time Bases Function .........................................................................................................132
7.7.0 Manual Printing of Graph Documents.................................................................................................133
7.7.1 Printing Chromatograms..................................................................................................................133
7.7.2 Selecting Information Included On Chromatogram Printouts .........................................................135
7.7.3 Specifying Report Types .................................................................................................................136
7.8.0 Running From the Graph Screen .........................................................................................................137
8.0 Programming and Executing Runs: The Method Screen............................................................................139
8.1.0 Method Functions................................................................................................................................139
8.2.0 The Top Level Method Dialog............................................................................................................140
8.2.1 Method File Identification...............................................................................................................140
8.2.2 Setting Inputs Criteria .....................................................................................................................140
8.2.3 Setting Run Criteria.........................................................................................................................141
8.2.4 Setting Results Criteria....................................................................................................................142
8.3.0 Events Table........................................................................................................................................144
8.3.1 Events Table Functions ...................................................................................................................144
8.3.2 Events Table Column Parameters....................................................................................................145
8.3.3 Entering Events Table Parameters...................................................................................................148
8.4.0 Manual Operation................................................................................................................................153
8.4.1 Hold Function..................................................................................................................................153
8.5.0 Working with Method Files.................................................................................................................154
8.5.1 Loading Methods.............................................................................................................................154
8.5.2 Clearing Methods ............................................................................................................................155
Data Ally Chromatography Manager User's Manual
8.5.3 Saving Methods .............................................................................................................................. 156
8.5.4 Deleting Methods............................................................................................................................ 156
8.5.5 Printing Methods............................................................................................................................. 157
9.0 Integration Screen: Finding and Identifying Peaks ................................................................................... 158
9.1.0 Top-Level Integration Screen ............................................................................................................. 158
9.1.1 File Identification............................................................................................................................ 159
9.1.2 Integration Algorithm ..................................................................................................................... 159
9.1.3 System Suitability ........................................................................................................................... 163
9.1.4 Peak Identification .......................................................................................................................... 165
9.2.0 Integration Peak Table ........................................................................................................................ 165
9.2.1 Peak Table Functions...................................................................................................................... 166
9.2.2 Peak Table Components ................................................................................................................. 167
9.2.3 Entering Peak Table Values............................................................................................................ 169
9.3.0 Working with Integration Files ........................................................................................................... 173
9.3.1 Loading Integration Files ................................................................................................................ 173
9.3.2 Clearing Integration Peak Table ..................................................................................................... 174
9.3.3 Saving Integration Files .................................................................................................................. 175
9.3.4 Deleting Integration Files................................................................................................................ 175
9.3.5 Printing The Integration File........................................................................................................... 175
10.0 Reviewing and Editing Calibrations: Calibration Screen........................................................................ 176
10.1.0 Calibration File Definition ................................................................................................................ 176
10.2.0 The Calibration Display.................................................................................................................... 177
10.2.1 The Reference Peak Table ............................................................................................................ 177
10.2.2 The Calibration Point Table.......................................................................................................... 187
10.2.3 The Calibration Plot...................................................................................................................... 188
10.3.0 Theory of Calibration........................................................................................................................ 190
10.3.1 External Standard Calibration....................................................................................................... 190
10.3.2 Internal Standard Calibration ........................................................................................................ 193
10.4.0 Building, Reviewing and Modifying Calibrations............................................................................. 196
10.3.1 Building a New Calibration Table ................................................................................................ 196
10.3.2 Reviewing the Calibration Point by Point..................................................................................... 197
10.3.3 Editing Individual Standard Points ............................................................................................... 198
10.3.4 Changing the Calibration Curve Fit .............................................................................................. 199
10.3.5 Changing the Calibration Basis..................................................................................................... 200
10.5.0 Working With Calibration Files........................................................................................................ 200
10.5.1 Loading Calibration Files.............................................................................................................. 200
10.5.2 Clearing Calibrations .................................................................................................................... 201
10.5.3 Saving Calibrations....................................................................................................................... 202
10.5.4 Deleting Calibrations .................................................................................................................... 203
10.5.5. Printing Calibrations .................................................................................................................... 203
11.0 Running and Reprocessing Batches: The Sequence Screen.................................................................... 204
11.1.0 Sequence Screen Functions............................................................................................................... 204
11.2.0 Top-Level Sequence ......................................................................................................................... 204
11.2.1 Operating Modes........................................................................................................................... 205
11.3.0 Sequence Table................................................................................................................................. 206
11.3.1 Sequence Table Functions ............................................................................................................ 206
11.3.2 Sequence Table Columns.............................................................................................................. 208
11.3.3 Fill Functions ................................................................................................................................ 210
11.4.0 Running a Sequence.......................................................................................................................... 213
11.4.1 Modifying a Sequence While Executing....................................................................................... 214
11.5.0 Working with Sequence Files ........................................................................................................... 214
11.5.1 Loading Sequence Files ................................................................................................................ 215
11.5.2 Clearing Sequence Files................................................................................................................ 215
11.5.3 Saving Sequence Files .................................................................................................................. 216
11.5.4 Deleting Sequence Files................................................................................................................ 217
Data Ally Chromatography Manager User's Manual
11.5.5 Printing Sequence Files .................................................................................................................217
11.5.6 Automatically Starting Sequence Files.........................................................................................217
12.0 Utilities.....................................................................................................................................................218
12.1.0 Utilities Files Commands ..................................................................................................................218
12.1.1 Resetting Configuration.................................................................................................................218
12.1.2 Translate Functions .......................................................................................................................219
12.2.0 Configure...........................................................................................................................................222
12.2.1 Exiting the Data Ally System ........................................................................................................222
13.0 Data Ally Help Functions.........................................................................................................................223
13.1.0 Using the HELP System ....................................................................................................................223
13.2.0 Marking Help Topics ........................................................................................................................225
13.3.0 Annotating Help Topics ....................................................................................................................226
14.0 Reporting with Microsoft Excel ...............................................................................................................228
14.1.0 Using Excel to Review and Edit Report Templates............................................................................228
14.1.1 Loading Excel ................................................................................................................................228
14.1.2 Opening An Existing Report Template File ...................................................................................228
14.1.3 Elements of a Report Template File ...............................................................................................229
14.2.0 Excel Basics .......................................................................................................................................230
14.2.1 Changing Column Widths and Row Heights ..................................................................................231
14.2.2 Changing Contents of a Single Cell................................................................................................231
14.2.3 Moving Data From One Cell To Another.......................................................................................231
14.2.4 Using The Name Box .....................................................................................................................231
14.2.5 Using the Define Name Dialog Box...............................................................................................232
14.2.6 Inspecting Defined Names Used in Report Templates ...................................................................232
14.3.0 Modifying Existing Report Template Styles ......................................................................................233
14.3.1 Modifying A Template Paper Size .................................................................................................233
14.3.2 Placing And Formatting Report Headers........................................................................................234
14.3.3 Placing And Formatting Page Headers Using Print_Titles.............................................................234
14.3.4 Placing and Formatting Data/Result Tables ...................................................................................234
14.4.0 Data Ally DDE Names For Use On Reports ......................................................................................235
14.4.1 Current Context Sensitive DDE Names..........................................................................................236
14.4.2 Calibration DDE Names.................................................................................................................236
14.4.3 Integration DDE Names .................................................................................................................238
14.4.4 Method DDE Names ......................................................................................................................238
14.4.5 PDF DDE Names ...........................................................................................................................240
14.4.6 Sequence DDE Names ..................................................................................................................241
15 Hardware Specific Interface Information .....................................................................................................243
15.1 Autosamplers.........................................................................................................................................243
15.1.1 Marathon Autosampler by Spark-Holland......................................................................................243
15.1.2 Parameters which can be controlled on all Models ........................................................................244
15.1.3 Parameters which apply to XT and Basic-Plus Models Only .........................................................244
15.1.4 Connections Between Data Ally and Marathon..............................................................................244
15.1.5 Placing the Marathon in Remote Control Mode.............................................................................244
15.1.6 Autosampler Sequence Control Issues ...........................................................................................244
15.1.7 Injection Modes..............................................................................................................................245
15.1.8 Dispenser Controlled Injection Mode ............................................................................................245
15.1.9 Pressure Controlled Injection .........................................................................................................245
15.1.9 Marathon Error Codes....................................................................................................................245
15.2 Kontron 460 Autosampler .....................................................................................................................245
15.2.1 Setting up the Kontron for Remote Control....................................................................................246
15.2.2 Connections Between Data Ally and Kontron 460.........................................................................246
15.2.3 Working with Kontron 460 Series Autosamplers...........................................................................246
15.2.4 Kontron Autosampler Sequence Control Issues .............................................................................247
15.3 Detectors ...............................................................................................................................................247
15.3.1 General Instructions for connection of detectors to Data Ally .......................................................247
Data Ally Chromatography Manager User's Manual
15.3.2 UV and Fluorescence Detector Control ......................................................................................... 248
15.3.3 Controlling the Antec Decade Electrochemical Detector............................................................... 248
15.3.4 Controlling the ESA Electrochemical Detector ............................................................................. 249
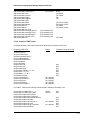
15.4 Photo Diode Array Detectors................................................................................................................ 253
15.4.1 General PDA Formulas used for Spectra, Similarity, and Purity Plots .......................................... 254
15.5 LabAlliance Model 506 or Linear 206 UV/Vis Control Installation Instructions................................. 255
16 Data Ally System Security & Log On Feature ............................................................................................. 257
16.1.0 System Log On................................................................................................................................... 257
16.2.0 Adding Users ..................................................................................................................................... 257
16.2.2 Setting Users Role.......................................................................................................................... 259
Access Roles ................................................................................................................................................. 260
17 Installation and Routine Troubleshooting .................................................................................................... 262
17.1.0 Serial Mismatch Errors ..................................................................................................................... 262
17.1.2 Other Startup Error Messages ........................................................................................................ 263
17.1.3 Errors During Data Ally Operation............................................................................................... 263
Data Ally Chromatography Manager User's Manual
Figures
Figure 3.2 Data Ally Application Group and Icon in Windows Program Manager ...........................................19
Figure 3.8 Exiting Data Ally In Utilities Screen.................................................................................................19
Figure 4.1 Command Menu Bar for Graph Screen.............................................................................................21
Figure 4.2 Pull-Down Display Menu for Graph Screen .....................................................................................21
Figure 4.3 Files/Load Dialog Box for Graph Screen..........................................................................................22
Figure 4.4 Control Application Menu for Graph Screen Window .....................................................................24
Figure 4.5 Maximize and Minimize Buttons for Time Base (top) and Program Windows ................................27
Figure 4.6 Graph Screen Program Control Menu...............................................................................................29
Figure 5.1. Selecting Configuration Mode From Utilities Screen. .....................................................................36
Figure 5.2 Configuration Window......................................................................................................................36
Figure 5.3 Component Set Dialog Box ..............................................................................................................37
Figure 5.4 Time Base Window System Setup Dialog ........................................................................................37
Figure 5.5 Entering Time Base Description .......................................................................................................38
Figure 5.6 Analog Input Setup Dialog Box ........................................................................................................38
Figure 5.7 Entering a Description For Detector Input........................................................................................39
Figure 5.8 Add Component Dialog Box.............................................................................................................40
Figure 5.9 Component Setup Dialog After Adding Second Analog Detector Input...........................................40
Figure 5.10 Adding Relay Flags.........................................................................................................................41
Figure 5.11 Input Flags Setup Dialog.................................................................................................................42
Figure 5.12 Removing a Defined Component ....................................................................................................43
Figure 5.13 Selecting Desired Detector Type ....................................................................................................43
Figure 5.14 ESA 5200 Detector Configuration Setup Dialog ............................................................................44
Figure 5.15 Configuration Graph Window.........................................................................................................45
Figure 5.16 Loading a Chromatogram In Configuration Graph Screen .............................................................46
Figure 5.17 Graph Edit Default Submenu ..........................................................................................................47
Figure 5.18 Analyze Default Dialog...................................................................................................................47
Figure 5.19 Selecting Default Report From Existing Template Files................................................................48
Figure 5.20 Calibrate Default Dialog .................................................................................................................48
Figure 5.21 Integrate Default Dialog..................................................................................................................49
Figure 5.22 Configuration Graph Display Submenu ..........................................................................................50
Figure 5.23 Setting Default Display Attributes ..................................................................................................50
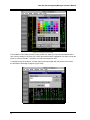
Figure 5.24 Setting Default Display Colors .......................................................................................................51
The Component Set dialog box (Figure 5.3) will appear. ...................................................................................51
Figure 5.26 Offset Default Dialog......................................................................................................................52
Figure 5.27 Pumps Offset Display Dialog..........................................................................................................52
Figure 5.28 Display Scaling Default Dialog........................................................................................................53
Figure 5.29 Pump Scaling Default Dialog..........................................................................................................54
Figure 5.30 Status Box Default Dialog ..............................................................................................................54
Figure 5.31 Graph View Default Submenu ........................................................................................................55
Figure 5.32 Zoom Center Default Submenu.......................................................................................................56
Figure 5.33 Zoom Scale Factors Default Dialog ................................................................................................56
Figure 5.34 Print Command Default Submenu...................................................................................................57
Figure 5.35 Printer Setup Default Dialog...........................................................................................................57
Figure 5.36 Printout Info Default Dialog ...........................................................................................................58
Figure 5.37 Chromatogram Report Default Dialog ............................................................................................58
Figure 5.38 Graph Screen Button Configuration Pop-up Submenu ...................................................................59
Figure 5.39 Set Button Color Dialog..................................................................................................................60
Figure 5.40 Set Button Title Dialog ...................................................................................................................60
Figure 5.41 Method Configuration Dialog .........................................................................................................61
Figure 5.41 Method Configuration Dialog .........................................................................................................62
Figure 5.43 Method Reports Default Dialog ......................................................................................................65
Figure 5.44 Method Files Configuration Submenu ............................................................................................66
Data Ally Chromatography Manager User's Manual
Figure 5.45 Default Method Description Dialog ............................................................................................... 66
Figure 5.46 Assign Default Method Dialog ....................................................................................................... 67
Figure 5.47 Method Events Table Configuration Window ................................................................................ 68
Figure 5.48 Table Button Edit Pop-up................................................................................................................ 68
Figure 5.49 Configure Events Table Columns Dialog ....................................................................................... 69
Figure 5.50 Events Table With Inputs Column................................................................................................. 69
Figure 5.51 Set Button Title Dialog................................................................................................................... 70
Figure 5.52 Button Title Color Select Dialog .................................................................................................... 71
Figure 5.53 Integration Configuration Default Window .................................................................................... 72
Figure 5.54 Integration Default File Submenu................................................................................................... 73
Figure 5.55 Integration Default Description Dialog .......................................................................................... 73
Figure 5.56 Integration Default Assignment Dialog .......................................................................................... 74
Figure 5.57 Configuration Peak Table Window ................................................................................................. 74
Figure 5.58 Configure Peak Table Columns Dialog .......................................................................................... 75
Figure 5.59 Configuration Calibration Window ................................................................................................. 76
Figure 5.60 Calibration Default File Submenu .................................................................................................. 77
Figure 5.61 Assign Default Calibration File Dialog .......................................................................................... 77
Figure 5.62 Calibration Tables Configuration Window...................................................................................... 78
Figure 5.63 Calibration Default File Submenu .................................................................................................. 78
Figure 5.64 Calibration Default Setup Dialog ................................................................................................... 79
Figure 5.65 Configure Calibration Reference Table Columns Dialog ............................................................... 80
Figure 5.66 Column Selector Dialog for Calibration Data Table ....................................................................... 81
Figure 5.67 Configuration Sequence Window ................................................................................................... 82
Figure 5.68 Sequence File Default Submenu..................................................................................................... 83
Figure 5.69 Sequence Default File Description Dialog ..................................................................................... 84
Figure 5.70 Assigning Sequence Default File.................................................................................................... 84
Figure 5.71 Configure Sequence Table Columns Dialog................................................................................... 85
Figure 5.72 Utilities/Files Configuration Submenu ........................................................................................... 87
Figure 5.73 Save As Configuration Dialog ........................................................................................................ 87
Figure 5.74 Load Configuration Dialog............................................................................................................ 88
Figure 5.75 Exiting Configuration Dialog ........................................................................................................ 88
Figure 7.1 Graph Screen .................................................................................................................................. 100
Figure 7.2 Graph Application Control Menu ................................................................................................... 101
Figure 7.7 Graph Files Submenu ..................................................................................................................... 105
Figure 7.8 Files/Clear Dialog........................................................................................................................... 106
Figure 7.9 Files/Load Dialog ........................................................................................................................... 107
Figure 7.10 Files/Save As Dialog .................................................................................................................... 108
Figure 7.11 File Overwrite Trap Dialog .......................................................................................................... 108
Figure 7.12 Graph Edit Command Submenu ................................................................................................... 109
Figure 7.13 Integration Dialog...................................................................................................................... 110
Figure 7.14 Baseline Editing Submenu Commands......................................................................................... 111
Figure 7.15 Baseline Edit Pop-up Selector ...................................................................................................... 112
Figure 7.16 Placing a Drop Line With Pointer ................................................................................................ 113
Figure 7.17 Erase Baseline Code Commands .................................................................................................. 114
Figure 7.18 Define Zone Codes Submenu ....................................................................................................... 115
Figure 7.19 Zone Codes Editor Pop-up ........................................................................................................... 116
Figure 7.20 Zone Codes Placed Along Graph Time Axis................................................................................ 116
Figure 7.21 Manual Analyze Dialog ................................................................................................................ 118
Figure 7.22 Example of Typical Area PerCent Report via Excel .................................................................... 119
Figure 7.23 Manual Calibration Dialog ........................................................................................................... 119
Figure 7.24 Example of Calibration Report..................................................................................................... 120
Figure 7.25 Cut Image Command ..................................................................................................................... 121
Figure 7.26 Math Functions Menu................................................................................................................... 122
Figure 7.27 View Submenu Commands........................................................................................................... 123
Figure 7.28 Zoom Box Enabled in Graph Window ......................................................................................... 124
Data Ally Chromatography Manager User's Manual
Figure 7.29 Zoom Center Commands ..............................................................................................................124
Figure 7.30 Zoom Center Scale Factors Dialog ...............................................................................................125
Figure 7.31 Graph/Display Submenu Commands ............................................................................................125
Figure 7.32 Graph Display/Attributes Dialog ..................................................................................................126
Figure 7.33 Display/Colors Dialog...................................................................................................................127
Figure 7.34 Display/Offset Dialog ...................................................................................................................128
Figure 7.35 Display/Scaling Dialog .................................................................................................................129
Figure 7.36 Pumps/Scaling Dialog...................................................................................................................129
Figure 7.37 Display Submenu with HPLC Pumps ...........................................................................................130
Figure 7.38 Setting Pump Trace Plotting .........................................................................................................130
Figure 7.39 Display/Status Dialog....................................................................................................................131
Figure 7.40 Status Box Enabled in Graph Window ..........................................................................................132
Figure 7.41 Monitor Time Bases Screen Display.............................................................................................132
Figure 7.42 Print Commands Submenu............................................................................................................133
Figure 7.43 Chromatograms Print Dialog ........................................................................................................134
Figure 7.44 Printer Setup Dialog......................................................................................................................134
Figure 7.45 Print Options Dialog .....................................................................................................................135
Figure 7.46 Printout Info Dialog ......................................................................................................................136
Figure 7.47 Print Report Dialog .......................................................................................................................136
Figure 8.1 Top-Level Method Screen ..............................................................................................................140
Figure 8.2 Detectors Setup Fields ....................................................................................................................141
Figure 8.3 Sample Information Dialog............................................................................................................142
Figure 8.4 Result Files Definition Fields..........................................................................................................142
Figure 8.5 Report Set Dialog...........................................................................................................................143
Figure 8.6 Method Events Table ......................................................................................................................144
Figure 8.7 AutoFill Dialog for Events Table Time Column.............................................................................149
Figure 8.8 Method Files Commands Submenu.................................................................................................154
Figure 8.9 Method Files/Load Dialog ..............................................................................................................155
Figure 8.10 Clearing Method Events Table......................................................................................................156
Figure 8.11 Method File/SaveAs Dialog..........................................................................................................156
Figure 8.12 Reporting Status Window .............................................................................................................157
Figure 9.1 Top Level Integration Screen..........................................................................................................158
Figure 9.2 Integration Algorithm Parameter Fields..........................................................................................159
Figure 9.3 Use of Slope Sensitivity Parameter .................................................................................................160
Figure 9.4 Use of Baseline Drift Parameter .....................................................................................................160
Figure 9.5 Integration Peak Table Window......................................................................................................166
Figure 9.6 Automatically Filling Retention Times ...........................................................................................170
Figure 9.7 Integration Files Command Submenu .............................................................................................173
Figure 9.8 Integration Files/Load Dialog ..........................................................................................................174
Figure 9.9 Clearing Peak Table........................................................................................................................174
Figure 9.10 Integration Files/Save As Dialog ..................................................................................................175
Figure 10.1 Calibration Screen.........................................................................................................................177
Figure 10.2 Reference Peak Table Window.....................................................................................................178
Figure 10.3 Calibration Files Submenu ............................................................................................................180
Figure 10.4 Calibration Setup Dialog...............................................................................................................180
Figure 10.5 AutoFilling Curve Fit Type...........................................................................................................182
Figure 10.6 Changing Basis for Existing Peak in Reference Table..................................................................183
Figure 10.6 Calibration Table ..........................................................................................................................187
Figure 10.8 Calibration Plot Window ..............................................................................................................189
Figure 10.9 Using Manual Calibrate Function to Process a Standard Chromatogram .....................................197
Figure 10.10 Automatic Indexing of Calibration Table After Plot Point Selection..........................................198
Figure 10.11 Failing a Calibration Data Point..................................................................................................199
Figure 10.12 Calibration Files/Load Dialog.....................................................................................................201
Figure 10.13 Clear Submenu for Calibration Files...........................................................................................201
Figure 10.14 Calibration Files/SaveAs Dialog.................................................................................................202
Data Ally Chromatography Manager User's Manual
Figure 10.15 Set Calibration Description Dialog............................................................................................. 202
Figure 11.1 Sequence Screen........................................................................................................................... 204
Figure 11.2 Auto Filling the METH Column................................................................................................... 211
Figure 11.3 Split-Screen Sequence Table with Graph ..................................................................................... 214
Figure 11.4 Sequence Files Menu.................................................................................................................... 215
Figure 11.5 Sequence Files/Load Dialog ......................................................................................................... 215
Figure 11.6 Sequence Clear Function .............................................................................................................. 216
Figure 11.7 Sequence Files/Save As Dialog .................................................................................................... 216
Figure 12.1 UTILITIES Screen ....................................................................................................................... 218
Figure 12.2 Utilities Files Submenu................................................................................................................. 218
Figure 12.3 Load Configuration Dialog........................................................................................................... 219
Figure 12.4 Translate Submenu Commands .................................................................................................... 219
Figure 12.5 Axxiom 700 Series File Conversion Dialog ................................................................................. 220
Figure 12.6 File Export Dialog ........................................................................................................................ 221
Figure 12.7 Export/Files Dialog ...................................................................................................................... 221
Figure 13.1 Data Ally Help Window ............................................................................................................... 223
Figure 13.2 Help Contents Index Window....................................................................................................... 224
Figure 3.3 Help Search Dialog......................................................................................................................... 224
Figure 13.4 Help History Window................................................................................................................... 225
Figure 13.5 Bookmark Define Dialog.............................................................................................................. 226
Figure 13.6 Help Annotation Dialog................................................................................................................ 226
Figure 14.1 Excel Files/Open Dialog Box ....................................................................................................... 229
Figure 14.2 Examining an Excel Worksheet Report Template ........................................................................ 229
figure 15.1 Marathon Autosampler Setup Dialog ............................................................................................. 243
Figure 15.2 Typical Sequence Table For Autosampler Operation.................................................................... 243
figure 15.3 Kontron Autosampler Setup Dialog ............................................................................................... 246
figure 15.4 Typical Sequence Table For Autosampler Operation..................................................................... 247
Figure 15.5 Typical Data Ally PDA Graph Screen........................................................................................... 253
Figure 15.6 Integration Peak Table with Peak Spectra Column........................................................................ 255
Figure 15.7 Top Level Method Screen for PDA with four individual channels available .............................. 255
Figure 1 System Security Startup Greeting Dialog .......................................................................................... 257
Figure 2 System Security menu items Edit Users & Logon. ............................................................................ 257
Figure 3 Set Users Dialog ................................................................................................................................. 258
Figure 4 Edit Users Dialog ............................................................................................................................... 258
Figure 5 User Access Rights Dialog ................................................................................................................. 259
Figure 6 Set Access Role Dialog ...................................................................................................................... 259
Figure 17.9 Communications Error Information Message ............................................................................... 264
Figure 17.10 Removing Driver Lines in SYSTEM.INI File ............................................................................ 265
Data Ally Chromatography Manager User's Manual
License Agreement
You have purchased Data Ally
TM
Chromatography Manager and agree to the following terms.
The Data Ally software is owned by SSI Distribution, Inc. and is protected by United States copyright
laws and international treaty provisions. You are permitted to make backup copies of the software for
your own use. You may not copy the written materials accompanying the software.
This License Agreement is your proof of license to exercise the rights granted herein and must be
retained by you. You may not rent or lease the Data Ally software, but you may transfer your rights
under this Agreement on a permanent basis provided you transfer this License Agreement, the
software, its accompanying hardware, and all accompanying written materials and retain no copies,
and the recipient agrees to the terms of this Agreement. You may not reverse engineer, decompile,
or disassemble the software, or modify the program code in any way, without prior written consent
from SSI Distribution. Any transfer of the software must include the most recent update and all prior
versions.
This License Agreement shall be construed, interpreted, and governed by the laws of the
Commonwealth of Pennsylvania. If any provision of this Agreement is found void or unenforceable, it
will not affect the validity of the balance of the Agreement, which will remain valid and enforceable
according to its terms. If any remedy provided is determined to have failed its essential purpose, all
limitations of liability and exclusions of damages set forth in the Agreement shall remain in full force
and effect. This Agreement may only be modified in writing with consent of an authorized officer of
SSI Distribution. Use, duplication, or disclosure by the United States Government of the software
and documentation in this product shall be subject to the restricted rights applicable to commercial
computer software (under DARS 52.227-7013).
All rights not specifically granted in this Agreement are reserved by SSI Distribution.
Data Ally Chromatography Manager Operators Manual
12
Data Ally Chromatography Manager Operators Manual
1.0 Introduction: Data Ally Chromatography Manager
TM
Data Ally Chromatography Manager is a system of hardware and software for IBM-compatible
personal computers which acquires, manages, and analyzes signal information from any type of
chromatography instrumentation. It can also control the operation of those instruments.
Data Ally can accommodate any types of chromatography instruments (HPLC, GC, IC, SFC, CZE, or
other techniques). The instrument is linked to the computer via the Data Ally card installed in one of
the computer's bus slots.
The Data Ally software programs Methods for acquiring chromatography signal data and for
controlling the desired instruments. The card at the start of each run sends all required commands to
the instrumentation to execute the Method. At the same time, the card captures incoming analog
signals from detectors through its high performance analog to digital converters, or acquires digitized
signals directly. Each captured and digitized signal is then saved in real time to the Data Ally
computer's hard disk drive, and also displayed, if desired, for monitoring purposes.
At the end of each run, the chromatogram signal data from each detector is saved as a unique DOS
file on the computer's hard disk. These files can be recalled, displayed, and edited at any time,
individually or in batches. Data Ally provides a complete set of analytical and editing tools for
integration, baseline modification, comparisons, and graphical manipulations of raw data files. The
Data Ally Calibration Module allows any types of calibrations to be performed for quantitative
methods. Reports can be created using Microsoft Excel, with transparent communication via Direct
Data Exchange (DDE). Data Ally reports can include any information known to the system, including
results, comments, text, graphics, and other file-specific data.
The Data Ally software requires and operates within the Microsoft Windows 3.1 or Microsoft Windows
95 environment. It provides many graphical tools and capabilities for programming, editing files, and
creating a fully customized user interface, consistent with other Windows applications. It also
supports Windows-based multitasking of DOS or Windows applications in 386-Enhanced Mode
simultaneously with all Data Ally operations.
13
Setting Up Your Computer For Data Ally
It is suggested that you perform the following procedures prior to installing the Data Ally
hardware PCB in the computer. This will avoid any hardware conflicts that may prevent
the computer from booting up. These conflicts should be eliminated by the procedures
outlined in this document.
Reserving Interrupt Resources in Windows 95 and the computer’s CMOS Setup Utility
In order to for your Data Ally Hardware to function properly, you must inform your computer’s BIOS and
Windows 95 operating system that certain resources are required by Data Ally. This is a two step process. The
first step is to reserve the IRQs 10 & 11 in Windows 95. The second step requires you to reserve IRQs
(Interrupts) 10 & 11 in the CMOS Setup Utility. The instructions that follow are intended to be a general guide as
to how to reserve these resources. CMOS Setup Utilities vary somewhat in how the user must proceed in order
to reserve resources so the guide lines provided here should may not be exact but they should be close.
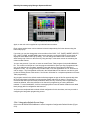
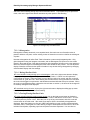
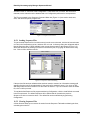
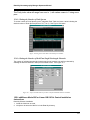
Reserving IRQs in Windows 95
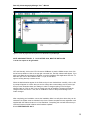
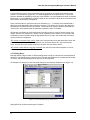
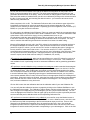
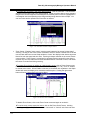
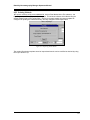
Go into control panel (click on Start/Settings/Control Panel) and click on the SYSTEM icon and then settings
When you see the above dialog box, click on Properties Button
Make sure the IRQ radio button is selected and you will see the listing for those that exist.
G:\Lit\Manuals\Data Ally\W95DAIRQ.DOC
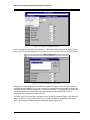
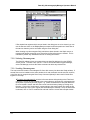
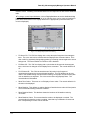
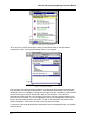
Next Click on the Reserve Resources Tab at the top
Click on the Add button and type in “10” with out the quotes
Repeat and Add “11”
Then click OK and close up all the dialogs.
Re-boot the computer. When you re-boot, Windows 95 will reassign any devices that are using the reserved
IRQs thus freeing them up for use with Our ISA Card.
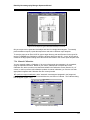
Reserving IRQs for ISA Legacy Cards in the CMOS BIOS Setup Utility
1.
2.
3.
4.
5.
You must enter the Setup Utility during the boot up process when your computer is first powered up or
reset. Usually this is done by pressing the Delete Key quickly when the message appears on the screen.
Some computers may require a different Key press in order to enter the Setup program. Most all will post a
message on the screen during boot up informing you as to what key press will invoke the Setup Utility.
Once you have entered the Setup Utility, you usually must proceed to the Advanced Setup Menu and then
locate the Reserve Resources or PnP PCI Setup menu.
When you have found the PnP Setup menu, you may have to select Manual Setup in order to see the
choices for reserving you ISA IRQs.
Once you have found the ISA Legacy IRQ menu, proceed to select and reserve IRQs 10 and 11.
Finally you will want to exit and Save your changes. This usually is done by pressing F10 key but there will
be instructions displayed on the screen as to how to do it. Save and Exit the BIOS Setup and then proceed
to the Windows 95 instructions shown below.
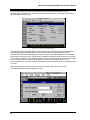
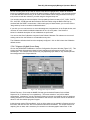
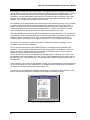
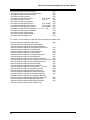
Checking on I/O Port Address Conflicts
Data Ally uses only 2 locations in the PC I/O address space. Those locations are 300hex & 301hex . These two
locations are not normally used by other devices and are designated for the “prototype card” by IBM.
Some devices that may be using these address will show up in the Windows 95 System Resources list but any
devices installed via MS-DOS configuration or autoexec.bat files are not likely to show up. You may examine the
autoexec.bat and config.sys files and look for device driver lines that reference I/O port addresses 300hex and
301hex. If you find any you will have to consult the manuals for those devices and relocate them to a nonconflicting I/O address.
G:\Lit\Manuals\Data Ally\W95DAIRQ.DOC
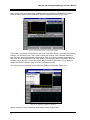
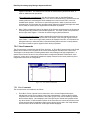
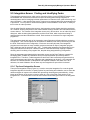
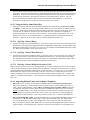
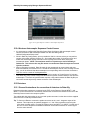
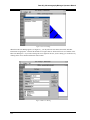
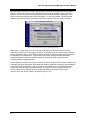
To examine the I/O port usage in Windows 95..
1.
2.
3.
4.
5.
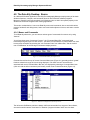
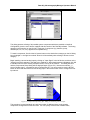
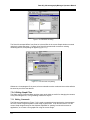
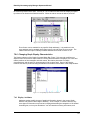
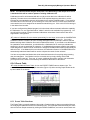
Go to the Control Panel (click on Start/Settings/Control Panel) and double click the System Icon.
Next click on the Device Manager Tab
Click on the Properties Button
Click on the input/output radio button. You should see a dialog box like the one shown below...
You may scroll the list up and down to see if any devices are shown as using 300hex or 301hex.
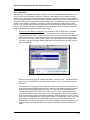
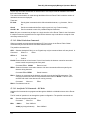
Important Note Regarding Windows 95 Installation Error #70
When installing The Data System software onto a Windows 95 you must run the Setup program
on Disk #1 after starting Windows. It is important that you not run any previous version of the Data
System software after re-booting the computer and before installing the new version of software.. If
this procedure is not followed an “Error 70” message will be encountered when the installation
program attempts to install the file named PYRXFR32.EXE.
The reason for the error is whenever you run the Data System software, Windows 95 determines
that Excel owns the current copy of PYRXFR32.EXE and will not allow it to be replaced until the
system is re-booted and prior to the Data System software being executed.
G:\Lit\Manuals\Data Ally\W95DAIRQ.DOC
Data Ally Chromatography Manager Operators Manual
2.0 Data Ally Specifications
2.1.0 Number of instruments
Available: One Active/Edit Pair
Analog Inputs per : 2
Digital Inputs per : 2
Contact Closure Relays Out per : 4
Contact Closure Relays In per : 4
Serial I/O Ports per : 4
Analog Pump I/O Ports per : 2
2.2.0 Signal Inputs/Acquisition
Analog:
Effective Sampling Rate per : 0.0001 Hz - 400 Hz
Maximum Input Range: 1 V, 10 V
Signal-to-Noise at 1 Hz: 25 bits
Signal-to-Noise at 200 Hz: 20 bits
Digital:
Effective Sampling Rate per Input:
Maximum Input Range: 1 V, 10 V
Maximum Run Time: Based on available disk memory
Raw data file size: 4 - 10 bytes/point (depending upon file configuration)
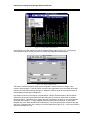
2.3.0 Graphics
Real-time Displays:
Up to four signal inputs per plus up to 12 saved reference files
Hardware control profiles
Configurable status information box
Split or multi-pane displays
Monitor function for display of any combination
Autosizing or fixed-scale scrolling
Unlimited zoom, rescale, and offset in real time
Editing/Comparison:
Up to 16 files at once
Reposition, stack swap functions
Switchable colors, attributes, filling on display
Baseline and zone code markers
Peak names and numbers
2.4.0 Methods
Number of Method programs: Unlimited, any path combination, with one default
14
Data Ally Chromatography Manager Operators Manual
Maximum number of timed event steps per Method: Unlimited
Maximum Number of zone codes per Method: Unlimited
Automatable Method Functions: File saves for all inputs
Integration for all inputs using unique programs
Calibration for all inputs using unique programs
Report Generation and saving
2.5.0 Integration/Peak Identification
Number of Integration Programs: Unlimited, any path combination, with one default
Maximum Number Peaks in Peak Table: Unlimited
Automatable Integration Functions:
Slope Sensitivity
Slope Calculation Interval
Baseline Drift Sensitivity
Area Threshold
Height Threshold
Peak Width Threshold
Automatable Peak Finding Functions:
Absolute Retentions
Absolute Retention Windows
2.6.0 Calibration
Number of Calibration Files: Unlimited, any path combination, with one default
Maximum Number of Entries in Calibration File: Unlimited
Maximum Number of Levels per Calibration: 16
Calibration Type Options:
External Standard
Internal Standard (up to 5 different IS)
Area or Height Basis for any peak
Curve Fitting Types Available:
Linear
Linear Force Through Origin
Quadratic
Quadratic Force Through Origin
Interpolated
Interpolate Extrapolate Through Origin
Other Calibration Options:
Manual Pass/Fail of Individual Calibrations
Omit/Replace Entire Level
2.7.0 Batch Operations
Number of Sequence Programs: Unlimited, any path combination, with one default
Maximum Number of Injections per Sequence: Unlimited
15
Data Ally Chromatography Manager Operators Manual
Processing Modes: Acquire, Reprocess and Summary
2.8.0 Reports
Number of Reports per Method, each Input: 1 to 4
Maximum Number of Reports in Template Library: Unlimited
Report Generation Modes:
via interface with Microsoft Excel
Manual Chromatogram Graphics Print functions
2.9.0 Files Handling
System File Types:
16
Chromatogram - *.PDF
Method - *.MET
Integration - *.INT
Calibration - *.CAL
Sequence - *.SEQ
Report - *.RPT/*.XLS
Excel Report Template - *.XLS
Excel Report Macro - *.XLM
Data Ally Chromatography Manager User’s Manual
3.1.0. CONTENTS LISTING
Data Ally consists of the following:
• Data Ally Software CD-ROM Disk
• Data Ally Interface P1 Module
• Detector Input Cables (mini-phono plugs) - 2 cables, 2 meter length
• Relay Flag Cables (Twisted Pair) - 2 cables, 2 meter length
• User's Manual
Before beginning any installation procedure, verify that all the components above are present and
undamaged.
The computer requirement for installing and operating Data Ally is as follows:
• Pentium processor or equivalent, 400 MHz or faster
• At least 64 MB of system RAM memory
• At least 50 MB free hard disk space recommended
• One Free Serial Port (16550 Uart)
• CD-ROM Drive
• Microsoft Windows 95, 98 or NT 4.0
• Microsoft Excel Version 7.0 or latter (required for report generation)
Data Ally is compatible with any printers or see your Windows documentation for a list plotters for
which Windows of supported devices. drivers are available. Please
3.2.0 INSTALLATION
3.2.1. INSTALL THE DATA ALLY HARDWARE
.
17
Data Ally Chromatography Manager User’s Manual
3.2.2 INSTALL THE DATA ALLY SOFTWARE.
Before beginning the software installation, be certain that the Data
that all PCPs are connected to the Data Ally and powered ON.
Reboot the PC and start Microsoft Windows. Insert the Data Ally CD-ROM in the CD-ROM drive.
The Setup program will load and appear onscreen. Follow the instructions given to complete the
installation process. If, after you begin installation, the Install program determines that there is not
sufficient free hard disk space to install Data Ally, a message box will appear alerting you to this
condition and requesting that disk space be freed before re-attempting the installation. Follow all
instructions given on screen while using Setup. The Setup program will add a new "Data Ally"
application icon to the Windows Program Manager, which can be used to start the Data Ally
software directly from Windows.
18
Data Ally Chromatography Manager User’s Manual
Figure 3.2 Data Ally Application Group and Icon in Windows Program Manager
NOTE: MICROSOFT EXCEL, V. 7.0 OR OFFICE 2000, MUST BE INSTALLED
in order for reports to be generated.
ÜTo exit Data Ally, click on the UTIL left-screen SoftButton to see the Utilities screen, then click
the left mouse button on Quit on the top right command line. The Quit submenu will appear. If you
wish to exit Data Ally and remain in Windows, move the highlight to Exit Application and click. To
abort the quit, click on the CANCEL button. To quit, click on QUIT.
Figure 3.8 Exiting Data Ally In Utilities Screen
When the desired entries appear in the fields, and you have checked them carefully, click on OK.
A prompt will appear to confirm that you want to change the current settings, and to remind you
that you must remember these new settings in order to change anything in the Configure
submenu later on. Click on OK if you are certain you wish to finalize the changes and that the
changes shown are correct. If not, click on CANCEL to return to the previous dialog box for
further changes.
After completing your installation, secure the Installation disks in a safe place where they can be
retrieved if the system must be reloaded in the future. Please complete the user registration card
supplied with the disks and return it to Your Distributor. Completing this card will ensure that you
receive all future technical bulletins and all software updates.
3.3.0. STARTING DATA ALLY
19
Data Ally Chromatography Manager User’s Manual
Depending upon how you installed Data Ally, you can start Data Ally in any of the following ways:
Turn the PC power off and then on again. start Data Ally automatically, the Data Ally the "Log On"
screen.
If you have installed AUTOEXEC.BAT and WIN.INI files to software will be initialized. After a
short delay you will see
If the PC is powered on and you see the DOS prompt (C>), either:
• Start Windows in the normal manner.
• Click on the Data Ally Icon. After a short delay you will see the "Log On" screen.
• Log on to the system.
When the Data Ally Graph screen appears, the system is ready to use.
Next configure the system to your exact requirements (Section 6), create programs immediately
using the factory-supplied configurations, or run Methods. A set of "default" files for each program
type are provided in the software with the names DEFAULT.MET, DEFAULT.INT,
DEFAULT.CAL, and DEFAULT.SEQ, and are ready to be modified or run as desired.
Note: To using the take full advantage of Data instructions in Section 5. Ally and your system you
can custom configure the software
3.4.0 INSTALLING DATA ALLY SOFTWARE UPGRADES
Periodically, upgraded versions of Data Ally software will be improved performance and features.
When re-installing an upgrade for Data Ally, you should first ensure that all existing Method,
Integration, Calibration, Sequence, and Configuration files are backed up on floppy disks, tape,
optical media, or on the hard drive of another PC. Although re-installation of the same or a newer
version will not overwrite any raw data, program, or report files, it is always good practice to
maintain separate copies of such files.
ÜTo re- install a new version of Data Ally, Follow the instructions for a first time installation.
The new software version will be installed into the C:\Data Ally or other designated directory on
the hard disk in the same manner as the original installation. When the installation is complete,
you must exit and restart Windows as advised by the completion message screen in order to load
the new
Data Ally version.
In some cases, you may be able to use existing configuration and/or program files documentation provided with the upgrade software package or in the Setup program message
screens will advise you as to the limitations for each type of upgrade.
20
Data Ally Chromatography Manager Operators Manual
4.0 The Data Ally Desktop: Basics
As a Microsoft Windows application, Data Ally Chromatography Manager employs many of the basic
Windows functions, concepts, and commands found in other Windows software programs.
Moreover, Data Ally conforms completely to all Windows rules, so that it can operate properly in the
Windows environment alongside other running applications.
This section reviews basics: how to use Data Ally menus and commands, how to work with various
program "windows" and dialog boxes, how to move and resize objects on screen, and how to use the
mouse.
4.1.0 Menus and Commands
To tell Data Ally what to do, you can choose various types of commands from menus or by using
"buttons."
You will use three types of command "menus:" the "Command Menu Bar" commands listed
horizontally along the top line of each screen; "pull-down" menus which are usually hidden from view
but are made accessible by selecting the "root command" item from a Menu Bar; and the vertical
row of "SoftButtons" at the left edge of all channel display screens..
Figure 4.1 Command Menu Bar for Graph Screen
Command items found in top-of-screen Command Menu bars (Figure 4.1) generally perform "global"
functions related to the type of screen being displayed. Pull-down menus or submenus are
associated with each Command Menu Bar item, are displayed by selecting a Command Menu item
(click on it with the left mouse button) and usually contain a set of related functions (Figure 4.2).
Figure 4.2 Pull-Down Display Menu for Graph Screen
.
The left-screen SoftButtons, which are always visible and accessible from any part of the software,
are used to switch between "time bases" or between "program windows" within one time base.
21
Data Ally Chromatography Manager Operators Manual
In some pull-down menus, some commands may be "grayed out" at certain times and will not be
useable. If a command is "grayed out", it is either inappropriate at the present time, or its function
has been defeated or disabled by some part of the software. It is also possible that certain Command
Menu items, or even SoftButtons, will not be shown at all in channels in which those commands have
been "hidden" by the active Configuration.
Some command items in pull-down menus are followed by a "..." or ellipsis, which indicates that a
dialog box will be displayed if that command is selected. The options you choose in the dialog box
will determine how that command is executed. Command items may be preceded or followed by a
"check mark" which indicates that the particular command is active or enabled.
All Data Ally commands can be chosen directly from their menus by using the mouse pointer or by
using a "shortcut" key assignment. Where a set of keystrokes can be used to run a command, the
command will show a notation listing the appropriate keys to its right. Not all Data Ally commands
can be executed via keystrokes.
Ü To choose a command from a menu, point to the command item name with the pointer cursor and
click the left mouse button. From the keyboard, you can also press the ALT key to activate the
menu, and then press the underlined letter for the menu item you wish to select.
Ü To cancel a menu without using any command, click the left mouse button anywhere on screen
outside the menu, or press the <ESC> key.
4.1.1 Dialog Boxes
Data Ally utilizes a large number of different dialog boxes to help you choose how commands will be
carried out. Each dialog box is a special type of "window" which appears in a predetermined position
on screen, and remains displayed as long as you are working with it.
An example of a dialog box is the Files/Load dialog from the Data Ally Graph Screen (Figure 4.3).
Figure 4.3 Files/Load Dialog Box for Graph Screen
Dialog boxes can contain several types of "objects:"
22
Data Ally Chromatography Manager Operators Manual
List Boxes: List Boxes are areas which show a "directory list" of alternative choices for some entry a list box for files appears in the upper left corner of Figure 4.3. List Boxes usually include a vertical
"scroll bar" which allows you to move quickly upward or downward through the listing. Often, a list
box will be used to "highlight" or select one or more items from the listing, using the mouse. If the
listed items fill up all the empty lines inside a List Box, there may be more items which are "hidden"
and which can be viewed by scrolling the box down with the lower scroll bar arrow. If one or more
items in the box must be highlighted to make a selection, you can click the left mouse button when
pointing at a desired item to "toggle" the highlight on or off for that item.
Entry Fields: Entry fields are intended for entering (typing) values for various parameters. An entry
field for filename to be loaded appears above the list box in top left of Figure 4.3. To use an entry
field box, click the left mouse button with the pointer cursor anywhere inside the box. The flashing
"vertical-bar" symbol will appear inside the box. Now type in the desired entry. You can use the
Delete key to delete the entire entry in the box, or use the Backspace key to backspace out incorrect
characters entered. If you double-click inside the entry box, the entire contents of the box will
become highlighted - typing any characters now replaces the old contents. Note that you can also
position the "I-bar" entry point at any character within the field for editing. Any entered characters, or
deletions, will appear immediately after the entry point. It is also possible to move the entry point
from the keyboard within a field, one character at a time, by pressing the left or right arrow keys.
As many characters as are necessary can be typed into any entry field, regardless of the physical
size of the entry box.
All Data Ally entry fields, as well as all table cells, can be made to show either a listing of all possible
entry values for each particular field or an instructional message regarding the type of entry that can
be made. To see the "menu listing" for any entry field, click the cursor anywhere inside that field with
the left mouse button, and then click the RIGHT mouse button - a "pop-up" menu will appear listing
all selections possible for that field. To select one of the entry options, highlight that option with the
pointer and click on it with the left button; this will cause the selected value to appear in the field,
replacing any previous value. For fields in which filenames must be entered, clicking the right button
in this manner will display the normal Files/Load dialog for the type of file required for that field, which
can then be used to select a file in the normal manner.
In Data Ally dialog box entry fields, it is usually necessary to move the entry point out of a field into
which an entry or modification has just been made, in order for that entry or modification to be
"recognized" by the system. As a rule, it is advisable to always click the mouse pointer inside at least
one other entry field in each dialog after making or editing entries, to assure that all the new entries
will be accepted, before closing or executing the dialog.
Data Ally will verify that entries made in any entry fields fall within the ranges of values or types of
values defined in Configuration, to ensure that incorrect or invalid data will not corrupt system
operation. In some instances, making an inappropriate entry will immediately display an error
message advising the operator to retry; in other cases, an error message may not appear until some
activity, such as clicking the RUN button to begin a Method, occurs.
In those fields which specify disk path names (directory locations) for various types of files, any
filename can be entered by typing the complete path name (e.g. C:\Data Ally\SUB1\data). All normal
DOS file naming rules and conventions must be followed. Filenames cannot include spaces, colons,
\, or / characters. Any desired number of subdirectory levels, and any real or virtual disk or memory
device, can be specified in any filename field. Note that if any program file type (e.g. Method) is
selected from a path other than the "default" path, the specified path will be retained for that program
file type until it is changed again or until the default path is re-selected.
Check Boxes: Check boxes are used to enable or disable certain items, independently from all other
items. If a check box for a particular item or option in a dialog box is "checked", that item is selected
or enabled when you exit the dialog box. If the item is "unchecked", it is inactive or disabled. To
23
Data Ally Chromatography Manager Operators Manual
check or uncheck any check box, click the left mouse button with the pointer on the desired checkbox
or on the item label for that checkbox. Each click will "toggle" the box to its alternate entry.
Radio Buttons: "Radio Buttons" are like check boxes, but differ in that they select only one from a
group of mutually exclusive options or items in a dialog box. For example, if you select the radio
button for the second item in a group of three items, in which the first item was previously selected,
the second item's button will be "dark" or active, and the first item's button will become "inactive". To
set a radio button, point at the desired button with the pointer and click the left mouse button. The
setting for the button will toggle, along with the setting of any other active button. A group of radio
buttons for selecting the display register for file loading appears at the middle right in Figure 4.3.
Example Areas: These are areas in a dialog box which are used to show an example of some
function or attribute, such as a picture of a font you have just selected, or a color Examples are
provided to make it easier to choose the most desirable setting for certain parameters.
Command Buttons: Command Buttons are single-function buttons such as "OK" or "CANCEL" in
Figure 4.3. Usually, command buttons cause another dialog box to appear (if the command on the
button is followed by an ellipsis) or some other action to occur. If certain command buttons are not
functional or available at certain times, they will be "grayed out" and cannot be used. To activate a
command button, click on it with the left mouse button.
Control-Menu Box: The Control Menu box (the small "horizontal dash" button) at the upper left
corner of certain dialog boxes has the same function as for any Window. Clicking the left mouse
button with the pointer on the Control Menu box displays the Control "pulldown" submenu common to
all Windows, with commands for Restore, Move, Resize, Minimize, Maximize, and Close (Figure 4.4).
Not all dialog boxes in Data Ally include the Control Menu Box; those that do include it are effectively
"windows" which can be moved, resized, minimized or "iconized", maximized, or closed. A "Switchto" command is often provided which allows direct switching to a different application in Windows. In
some cases only certain commands are available in the Control Menu for certain dialogs. For
example, the Control Menu pulldown for the Files/Load dialog in Figure 4.3 only includes commands
for closing and moving the dialog box.
Figure 4.4 Control Application Menu for Graph Screen Window
There are two ways to ''close" a dialog box. If a Control-Menu Box is present at its upper left corner,
click on the Box and select Close. If no Control Menu Box is present, generally clicking on either the
OK or CANCEL button will close the dialog box.
The OK button in any dialog box is used to close that box and accept all the current settings in the
box at the time OK is clicked. Pressing <ENTER> on the keyboard when viewing a dialog box has
the same effect as clicking on the OK button.
24
Data Ally Chromatography Manager Operators Manual
The CANCEL button discards any options you have selected in the dialog box, and closes the box
without changing anything in the system controlled by that dialog box. CANCEL differs from Close in
that Close will close a dialog box without canceling any of the changes made in that box before it is
closed. Instead of pressing the CANCEL button, you can use the <ESC> key. If the Control Menu
Box exists, you can click on the Control Menu box and press either <ESC> or <ENTER> to close the
dialog box.
4.2.0 Data Ally Windows
Like other Windows applications, Data Ally displays information inside various "windows" on the
screen. Each window is surrounded by a double-line "box".
Data Ally organizes its windows into two classes.
• "Time base" windows are present for each "system", with only one time base window normally
drawn on the full screen at any time. Separate and totally independent windows are provided for
each defined "system" for both active data collection and file editing, as well as for individual
"systems". You can switch between different time base windows by using the appropriate
SoftButtons on the left screen. Each time base window contains one or more "program
windows".
• "Program" windows correspond to different sections of the Data Ally program which is running in
the time base being observed in the current time base window. Once inside a time base window,
individual program windows are selected using the blue SoftButtons along the left edge of the
screen. In certain cases it is possible to view more than one program window at a time on a
single screen.
All windows of both types have some common features:
• Title Bar: The top, colored bar on the window displays the name of the Data Ally time base, if a
time base window, or the name of the program window type, if a program window. Other
information, such as loaded chromatogram or file name in program windows or the running mode
indicator in a time base window, may also be found in the title bar.
• Application Control Menu: The "horizontal bar" symbol inside the button at the top left corner of
all time base windows displays a menu for sizing and moving the time base window, or switching
to other applications.
• Program Control Menu: The "horizontal bar" symbol inside the button at the top left corner of all
program windows displays a menu for sizing, moving, or splitting the program window.
• Maximize Button: The Maximize button (upward arrow) at the top right of each time base and
program window causes either the time base or program window to fill the screen. When you
click on the Maximize button, it is replaced by the Restore button (double up/down arrow) which
returns the window to its previous size.
• Minimize Button: The Minimize button (downward arrow) at the top right of each time base
window causes the time base to be "iconized" without affecting its current function. Minimize
does not operate in program windows.
• Restore Button: The Restore button (double up/down arrow) which replaces the Maximize button
in the top right corner of time base or program windows returns the window to its previous size.
• Mouse Pointer: In program windows the "arrow" pointer or cursor is used to select commands
and manipulate graphic images on screen. The appearance of the pointer may change
25
Data Ally Chromatography Manager Operators Manual
depending on where it is placed on screen (see section below on Mouse Pointers and
Techniques).
• Insertion Point: In certain program windows only (Method, Integration, Calibration, Sequence)
this blinking vertical bar indicates where the next character typed will be entered. The insertion
point can be moved at will with the mouse pointer before making any entries.
• Scroll Bars: In program windows and "subwindows" such as Tables, a set of horizontal and
vertical scroll bars can be used to change the current view of the contents of the screen area
bordered by the scroll bars. To use scroll bars, you can either click the left mouse button while
pointing at the arrow at either end of a bar, to move the display in small increments, or you can
click on top of the "slider" button inside each scroll bar and "drag" it across the bar while holding
down the left mouse button. Also, clicking the left button with the pointer anywhere in the bar will
cause the scrolling to "jump" to that new position.
• Help Message: Most Data Ally screens have, in addition to the built-in HELP functions, a short
"help message" area to the right of the Command Menu bar. This area will usually contain a brief
phrase describing the current feature selected or the state of the system.
4.2.1 Switching Between Windows
Ü To switch from the current Data Ally "time base window" to see the current status of other time
bases in the software, click on the SoftButton corresponding to the desired time base. Each time you
change to a view of a new time base window, you will see the last program window which was viewed
in that time base, in the exact state in which it was left when the time base was switched. It is also
possible to switch directly to a different time base window (or to a different program running in
Windows) by selecting the Switch-To command in any channel window's Application Control Menu,
and then choosing the name of the desired Data Ally time base or program from the resulting listing.
A third way to switch between various running windows is to press Alt + Tab simultaneously, which
will cause an immediate jump to the last open program or time base window.
Ü To see a graphic display of all Data Ally time bases on a single screen, click on the MONITOR
button at bottom right of any GRAPH screen, which has the special function of putting views of all the
"active" time base windows present on screen at once. When the Monitor screen is displayed,
clicking on any of the individual time base SoftButtons in any of the separate time base windows will
return the full screen view to the selected time base only.
Ü To switch the program window being viewed in the current time base, click on the SoftButton
corresponding to the screen type (e.g. Method, Sequence, etc.) you wish to see.
4.2.2 Making a Window "Active"
When more than one window is displayed on a screen, such as the Method Events Table or
Integration Peak Table displays, only one window is "active" at any time, and only one window can
accept entries. The active window is denoted by the "active" color scheme you designate when
setting up Microsoft Windows.
Ü To select a window and make it "active", click anywhere inside that window. Alternatively, you can
click on the Program Control button in the upper left corner of the main window on the screen, and
choose "Next Window" or press CTRL+F6 until the window you want is active.
Ü To make the previous window active again, click inside it or press CTRL+SHIFT+F6.
4.2.3 Moving Windows and Dialog Boxes
If you need to move an open window on the display in order to see something behind it, you can
"drag" it to any new position.
26
Data Ally Chromatography Manager Operators Manual
Ü To move a window, click the left mouse button with the pointer anywhere in the title bar of the
window to be moved, and hold the mouse button down while you drag the window to the new
position. At least some of the title bar must be visible after a window is moved.
You can also use the Move command from the Program Control Menu by clicking on its button.
Ü To move a dialog box displayed on screen, click the left mouse button with the pointer on its title
bar and dragging.
A window cannot be moved if it is currently "maximized" and fills the screen.
4.2.4 Expanding Windows to Maximum Size
The maximum size of any window is the entire screen display. Channel windows in Data Ally are
normally maximized.
Ü To maximize a program or other window, click the Maximize (up arrow) button in the upper right
corner of the window's top bar (Figure 4.5). The window will expand to fill the screen. You can also
use Maximize in the Program Control menu in any window by clicking on its button, by pressing
CTRL+F10, or by double-clicking with the left mouse button on the top bar of the window.
Figure 4.5 Maximize and Minimize Buttons for Time Base (top) and Program Windows
4.2.5 Resizing Windows
Any window can be resized to fill any desired space on the screen. If you are using other software
programs at the same time as Data Ally, you may wish to resize the Data Ally time base windows so
that they appear beside windows in which other programs are running.
You can also enlarge windows which show, for example, a Peak Table or a Calibration Plot, for
added convenience or to see more information in a single view.
Ü To resize a window which has not been maximized, move the pointer to any border or corner of that
window until the pointer arrow changes to a "two-headed" arrow. With the "two-headed" arrow
displayed, depress the left mouse button and begin to drag the border or corner until the new outline
for the window reaches the desired size. Release the mouse button, and the window will be redrawn
to the new size.
A maximized window cannot be resized - you must use the Restore function to "un-maximize" it
first, by clicking on the "up/down arrow" Restore button at its top right corner.
You can also resize any window from its Program Control menu by clicking on the menu button at the
top left corner of the window (Figure 4.4), and selecting the Size function (ALT, HYPHEN, R or
CTRL+F8). The pointer will change to a "four-headed" arrow - press one of the arrow keys to
indicate which border you want to move, and the pointer will change to a "two-headed" arrow.
Use the appropriate arrow keys to move the border as desired, then press <ENTER>. Pressing
<ESC> will return the window to its previous size.
27
Data Ally Chromatography Manager Operators Manual
4.2.6 Closing a Window
Ü To close a window, double-click on the Application or Program Control Menu button at the upper
left corner of the current window (Figure 4.4). The window will close and be removed from the
display.
Alternatively, click on the Application or Program Control Menu button, and select the Close option by
clicking on it or by pressing CTRL+F4.
4.2.7 Minimizing a Window
In Data Ally, you can "minimize" any of the available time base windows so that they become
"iconized", using the Minimize function. Iconizing a time base will remove that time base's display
from the screen and place an icon representing that time base at the bottom edge of the screen.
Iconized time bases remain fully functional and will continue to execute any ongoing Methods,
Sequences, or other activities while iconized, even though the executing functions cannot be
observed while a window is iconized. Note that iconizing a time base actually iconizes both the
"active" and "edit" time bases associated with the selected system.
Ü To minimize a time base window, click the left mouse button with the pointer on the Minimize button
(down arrow) at top right of the screen. Alternatively, click on the Application or Program Control
menu button and select the Minimize command.
Ü To restore an iconized time base, double-click the left mouse button with the pointer on its icon,
which will place the time base window back on the screen in its last size and orientation before it was
iconized.
If time base or other icons are not visible on screen after minimization, you can display them at any
time by pressing the ALT+ESC keys. This will cause all icons for all current minimized application
programs in Windows to be shown at the bottom of the display.
4.2.8 Splitting a Window
Data Ally Graph windows can be split into as many desired "panes" as you like, by using either the
Split command in the Program Control Menu or the Display/Split command from the Command Menu
bar. Splitting a Graph window lets you see different parts of the same chromatogram in different
"panes" on screen at the same time, or puts different chromatogram traces in different windows in
real time for differentiation. When Graph windows are split into more panes, all panes use the
identical commands from the Command Menu bar on top of the screen, but only one pane is active at
any one time - you select the active pane by clicking anywhere inside that pane. Each time a Graph
window is split, it retains all the display characteristics of its "parent" window, but any such
characteristics can be changed as desired in the "child" window.
Ü To use the Program Control Menu to split Graph windows, click on its button at the top left corner of
the current Graph window, and select Split (ALT, HYPHEN, T) (Figure 4.6). The space filled by the
current window will be split into equally sized panes. Each pane can be resized and repositioned by
dragging, or panes can be subsequently split into additional panes.
28
Data Ally Chromatography Manager Operators Manual
Figure 4.6 Graph Screen Program Control Menu
To use the Display/Split command, see the section below on Graph screen.
4.2.9 Switching Between Programs in Windows
Since Data Ally runs in Windows "386 Enhanced" mode, other Windows or DOS applications can be
running on the PC simultaneously. These applications can either be maximized to full screen, placed
in windows of any desired size, or minimized as icons. Windows corresponding to non-Data Ally
application programs can be on screen at any time along with Data Ally channel windows, in any
relative sizes or orientations.
If you are running Data Ally as a full screen application, you may wish to switch to other programs.
Ü To switch from Data Ally to another application window, press the ALT + TAB keys simultaneously.
Pressing ALT + TAB repeatedly will toggle through all non-iconized software applications currently in
Windows.
Ü To switch from Data Ally to another iconized application, click on the Program Control button and
select the Switch To command from the menu. A listing of all loaded software applications will
appear. Click on the name of the application you wish to see and then click on the Switch To button.
The display will change to show the newly selected application.
4.3.0 Mouse Pointers and Techniques
Your mouse will work with Data Ally in mostly the same ways as with other Windows applications.
4.3.1 Pointer Shapes
When you move the mouse pointer to different areas on the Data Ally screens, which correspond to
different functions, the shape and appearance of the pointer may change, to help you recognize
which functions are available.
If the pointer assumes a shape representing a function you do not wish to use, you can either press
<ESC> to restore the pointer to its normal (arrow) shape, or move the pointer to a different part of the
screen so that its shape changes automatically.
The table below shows the common pointer shapes and their meanings:
29
Data Ally Chromatography Manager Operators Manual
"Arrow:" The pointer is on any of the menus, inactive windows, scroll bars, Graph screen display,
SoftButtons, or in areas of any dialog box which include buttons, check boxes, or radio buttons.
"Vertical Bar:" The pointer is inside any text or numerical entry field into which values can
be typed. The position of the vertical bar before or after any already-existing entry in a field
box shows exactly where new entered characters will begin to be inserted.
ç è "Left/Right Arrows Around Vertical Bar:" The pointer is on the edge of a table column
header button, and can be used to resize that column. To resize, hold down the left mouse
button and "drag" the edge of the column button left or right to change its size - release the
left button when the desired size is achieved.
è
"Large Left, Right, Up, or Down Arrow:" The pointer is in the furthermost top, bottom, left,
or right edge of a Graph window, and can be used to "pan" the graph display in the direction
of the arrow by clicking the left mouse button while the large arrow is displayed.
ô
"Double-Headed Vertical Arrow:" The pointer is in a window border area, and you can
change the upper or lower horizontal border position of that window by clicking the left
mouse button and dragging the existing border up or down.
ó
"Double-Headed Horizontal Arrow:" The pointer is in a window border area, and you can
change the left or right vertical border position of that window by clicking the left mouse
button and dragging the existing border left or right.
"Double-Headed Diagonal Arrow:" The pointer is in a window corner border area, and you can
change both its vertical and horizontal dimensions by clicking the left mouse button and dragging
both borders to the new position.
"Four-Headed Arrow (Heavy):" You have selected the Move or Size command from the Application
or Program Control Menu button. You can drag the entire window to a new position or move any
borders of that window to resize it.
ïx
ð
"Two-Headed Horizontal Arrow (Light):" The graphical editing function for timed events or
peak windows is enabled. You can move the position of the marked point or code by
depressing the left mouse button and dragging it to the desired location. This cursor is also
used for graphic moving or offsetting of chromatograms in the Graph window.
|
B
"Baseline Code/Vert. Cursor:" The graphical baseline editing function is active. You can
move the enabled code marker anywhere in the graph window and click the left mouse
button to set it.
G
"Hand Symbol:" The baseline or zone codes move function is enabled in the graph window.
Click on the left mouse button to "grab" the code beneath the cursor symbol, and hold the
button down while you drag it to the desired position. The "hand" symbol cursor is also used
to drag chromatogram filename icons in the register stack, and to move other objects such
as annotations or peak names in the Graph window.
@
"Bull's Eye Symbol:" The baseline or zone code clear function is enabled in the graph
window. Position the circular "bull's eye" over the code to be cleared and click the left
mouse button to clear it.
¨
â
"Zone Code Box/Arrow:" You are in zone code placement mode in the graph window.
Move the box containing the zone code symbol so that the arrow indicates its desired
placement, and then click the left mouse button to place it.
30
Data Ally Chromatography Manager Operators Manual
×
"Double Vertical Arrow Offset Cursor:" Graphical chromatogram offset has been activated.
Moving the cursor up or down in the graph window will pull the selected chromatogram trace
to a new position.
4.3.2 Basic Mouse Techniques
There are several basic mouse operations needed to make use of all Data Ally graphical functions.
To
Action Required
Point:
Move the mouse pointer until it is on or next to the desired object.
Click:
With the pointer in position, press and release the left (or right) mouse
button.
Double-Click:
With the pointer in position, quickly press and release the left mouse
button twice (there is no double-click function for the right button).
Drag:
With the pointer in position, press and hold down the left mouse button
while you move the mouse. The object you are moving on screen will
follow the motion. Release the button when the object is in the desired
position.
4.4.0 Data Ally Tables
The Data Ally system utilizes "tables" in order to program method events for execution (Events
Table), peak identifications, referencing, and handling (Peak Table), calibration standards and results
(Calibration Reference Peak and Calibration Tables), and series of batched methods (Sequence
Table). All the tables incorporate the same commands and techniques for making entries, moving
through the table to review, adding or deleting lines, and filling or graphically programming the
contents of columns.
All Data Ally tables are essentially "spreadsheets" consisting of a series of vertical columns, defined
in Configuration, and at least one horizontal row. Rows are defined and added as tables are
programmed. Columns can be moved around by direct "drag and drop", and their individual widths
can easily be modified.
Any entry in any table column can be modified by pointing to that cell/entry, clicking the left mouse
button to move the Edit cell highlight and vertical bar cursor inside that cell/entry, and typing in the
new entry or change. Double-clicking with the pointer inside any cell will cause the existing entry in
that cell to be completely cleared as soon as any new character is typed.
All table cells with predefined sets of allowed entries can be edited by first clicking inside the desired
cell with the left mouse button, and then clicking the RIGHT mouse button to see a "pop-up" listing of
all possible entries. Highlight the desired entry and click it with the left mouse button to place it in the
cell - this will overwrite any previous value found in that cell. If a table cell does not have completely
predefined entries (such as PeakName column in the Peak Table), a message will appear if the right
button is clicked on that cell advising you of the type of entry that is required.
4.4.1 Moving Around in Tables
Whenever you make any Data Ally table window active by clicking inside it, a blue "highlight" appears
around all four edges of the upper left cell of the table, called the "Edit cell". This highlight can be
moved around the table in any direction to select any cell for making an entry, or to select a column
or row for other operations.
31
Data Ally Chromatography Manager Operators Manual
You can simply point at any cell in the table with the cursor pointer, and click with the left button, to
move the Edit cell immediately to the new cell location. The following keys and commands can be
used to move around in any table:
Right and Bottom Scroll Bars
ENTER Key
Use the vertical right side scroll bars to move up or down in
the table, if it has too many rows to show inside the existing
table window. Use the bottom scroll bar to view columns
not observed in the existing table window.
Press the ENTER key to move the Edit cell highlight one
column position to the right. At the end of each row (last
column in that row), pressing ENTER again will move the
cursor to the first column in the next row.
TAB Key
Press TAB to move the Edit cell highlight one column
position to the right, in the same manner as ENTER.
CTRL + ð
Press the CTRL and right arrow keys simultaneously to
move the Edit cell highlight one cell to the right.
CTRL + ï
Press the CTRL and left arrow keys simultaneously to
move the Edit cell highlight one cell to the left.
Press the CTRL and up arrow keys simultaneously to move
the Edit cell highlight one row upward in the table.
CTRL + ñ
CTRL + ò
Press the CTRL and down arrow keys simultaneously to
move the Edit cell highlight one row downward in the table.
CTRL + HOME
Press the CTRL and HOME keys simultaneously to move
the Edit cell highlight to the first (leftmost) cell in the current
row.
CTRL + END
Press the CTRL and END keys simultaneously to move the
Edit cell highlight to the last (rightmost) cell in the current
row.
PgUp
Press the PgUp key to move the Edit cell highlight upward
in the current column by the number of rows shown in the
current table window.
PgDn
Press the PgDn key to move the Edit cell highlight
downward in the current column by the number of rows
shown in the current table window.
CTRL + PgUp
Press the CTRL and PgUp keys simultaneously to move
the Edit cell highlight upward to the first (top) row in the
current column.
CTRL + PgDn
Press the CTRL and PgDn keys simultaneously to move
the Edit cell highlight downward to the last (bottom) row
in the current column.
In addition to moving the Edit highlight from cell to cell, there are also a number of ways to move the
"vertical bar" editing point to various positions inside the current entry in the Edit cell, after clicking
inside the Edit cell to position the vertical bar cursor. Besides simply pointing to a certain position in
32
Data Ally Chromatography Manager Operators Manual
the entry inside the current Edit cell and clicking the left mouse button to fix the vertical bar at that
position, you can use the following keys:
ð
Press the right arrow key to move the vertical editing point
one character to the right inside the Edit cell.
ï
Press the left arrow key to move the vertical editing point
one character to the left inside the Edit cell.
ñ
Press the up arrow key to move the vertical editing point
to the first (leftmost) character inside the Edit cell.
ò
Press the down arrow key to move the vertical editing point
to the last (rightmost) character inside the Edit cell.
HOME
Press the HOME key to move the vertical editing point to
the first character inside the Edit cell (same as ñ).
END
Press the END key to move the vertical editing point to the
last character inside the Edit cell (same as ò).
4.4.2 Adding, Moving, Copying, and Changing Rows
All Data Ally tables (with the exception of the Calibration Table) can be modified using the four yellow
command buttons found beneath the left portion of each table: INSERT, CUT, PASTE, and COPY.
These commands are analogous to the similarly-named editing commands found in many Windows
applications. They are used as follows:
INSERT
Click the left mouse button on INSERT to insert a new
blank row immediately above the currently selected row in
which the Edit cell highlight appears. This is used to place
new rows into a table at any desired position.
DELETE
Click the left mouse button on DELETE to delete the
current row of the table in which the Edit cell highlight
appears. Unlike CUT (below) DELETE commands are
irreversible and cannot be used to PASTE rows back into
the table.
CUT
Click the left mouse button on CUT to "remove" the current
row in the table in which the Edit cell highlight appears.
After cutting , the contents of this row will be placed in a
special "buffer" in the Data Ally software, similar to the
Windows Clipboard (but not actually using Clipboard), and
can thereafter be PASTEd into any other row in the table.
The CUT buffer can only hold one row's contents at a time,
so CUTting a second row will cause the information from
the first CUT row to be lost. CUT is used to either delete
a row entirely or to remove it (CUT) and PASTE it into the
same table in a different position.
COPY
Click the left mouse button on COPY to copy the contents of
the current row in the table in which the Edit cell highlight
appears into the table buffer. The current row is unaffected
by a COPY command. COPY is used to insert a copy of
33
Data Ally Chromatography Manager Operators Manual
any existing row's cell contents into another blank row via a
PASTE command.
PASTE
Click the left mouse button on PASTE after using CUT or
COPY to transfer a row's contents into the table buffer.
Before using PASTE, you must select a new blank row
by either moving the Edit cell highlight to the target blank
row, or by using INSERT to insert a new blank row and then
moving the Edit cell into that blank row. PASTE causes
the contents of the table buffer to be placed into the row
currently containing the Edit cell highlight.
Note that the "spreadsheet editing" command buttons operate on only one row at a time.
34
Data Ally Chromatography Manager Operators Manual
5.0 Configuring Data Ally
Data Ally's Configuration capabilities constitute one of its most powerful and unique features. With
Configuration, the system software can be personalized for any type(s) of applications or
instrumentation. Configurability makes Data Ally the first truly "personal" data system since it can be
customized in any manner to the preferences of its operator(s).
Use of configuration is normally recommended at the time of system installation
5.1.0 Configuration Files
Every time the Data Ally software is loaded, a "Configuration file" is automatically recalled from
memory and used to structure the visual display screens of the user interface. Each Configuration
file is essentially a "database" filled with user-specified settings and values for all parameters in the
system. These settings include names of instruments, detectors, program files, and report
templates, as well as default values for numeric entry fields such as run time or slope sensitivity.
Configuration also includes any special software drivers needed to directly control specific
instrumentation connected to each individual time base's Communications Processor.
At the time of installation, "generic" Configuration files for the intended system types (e.g. HPLC or
GC) will be automatically loaded, so that you will not need to perform a configuration right away. This
allows you to use the system immediately, and make detailed configuration changes later to adjust
your system to fit your personal preference. The "generic" configurations represent the "default"
settings for each time base.
The Configuration file loaded at bootup can be modified at any time, or replaced by a new
Configuration. You can always use any existing Configuration file as a "template" which is modified
and resaved to construct a new configuration. Although only one Configuration file can be loaded
and used by Data Ally at any time, you can create as many such files as you desire for a "library" of
instantly available potential software configurations.
Configuration files are designated by the file extension ".CFG". They are normally saved by Data Ally
in a special directory called \Data Ally\CONFIG. In most cases, you will only need to configure your
Data Ally system once, at the time you first install the system and connect your instrumentation. If
you modify or add to your initial analytical system, or your requirements change, you may wish to
reconfigure Data Ally at that time.
5.2.0 Performing a Startup Configuration
The following describes the initial configuration of a Data Ally system.
After the Data Ally software has been loaded, click on the UTIL SoftButton (F7) in any time base
window to display the Utilities access screen. Click on Configure on the Command Menu Bar (Figure
5.1) to enter Configuration Mode. Note that the active window is now labeled 'Configuration" (Figure
5.2) and the top line Command Menu Bar has changed.
35
Data Ally Chromatography Manager Operators Manual
Figure 5.1. Selecting Configuration Mode From Utilities Screen.
When you are in Configuration mode and the Configuration window is visible, all Data Ally time bases
are disabled and any runs in progress will be terminated. Therefore, you should be certain that all
runs (acquire or reprocess) have been stopped before beginning reconfiguration.
In the Configuration Window, the name of the current time base view appears in the center top bar
followed by <<Configure>>; the name of the currently-loaded Configuration file appears in the
subordinate window bar below.
The acquisition time base has an associated "Edit" time base with its own dedicated SoftButton. The
Edit time base, which cannot support live data acquisition from detectors but is used for off-line
results review and processing, can be configured independently of the "live" time. You can use this
capability, as an example, to set up special features in an "edit" time base which you do not wish to
be present in the associated "live" time base used to capture data.
Figure 5.2 Configuration Window
36
Data Ally Chromatography Manager Operators Manual
5.2.1 Selecting Configured Components
The current Configuration screen is for the "live" time base now named TB1. To set up its
parameters, click on Component and then on Component Setup to begin configuration The
Component Set dialog box (Figure 5.3) will appear.
Figure 5.3 Component Set Dialog Box
A list will appear in the box showing all the currently enabled objects in the current time base. For a
new Data Ally system, only two "objects" will be shown in the listing: the current time base, called
"TB1" or "TB2", and one analog detector input, called "Det1". If instrument control options have been
included, the drivers for each instrument will also be shown. Begin by selecting the top item, the
current time base object, by clicking on it with the left mouse button to "highlight" its name. Click the
SETUP button to view the Setup Dialog for the System or time base window (Figure 5.4).
Figure 5.4 Time Base Window System Setup Dialog
This dialog provides information describing the current time base, including the application type, the
desired name for labeling the window, the identity of the Communications Processor connected to
this time base, serial and instrument numbers assigned, and any desired text description of the time
base itself.
37
Data Ally Chromatography Manager Operators Manual
Entering System Descriptors
Click inside the "System Name" entry field and enter the desired name for labeling the time base, up
to twelve characters long - this name will be shown in the top bar of the time base window. This
name will be used to label both this "live" time base and its companion edit time base. Click inside
the "System S/N" field and enter a specific serial or instrument number, if desired - this information
will be permanently stored in Data Ally as part of this Configuration and can be recalled any time for
reporting or labeling purposes.
To enter an additional text description of the current time base for documentation purposes, click the
"DESC" button and type the description into the entry field provided (Figure 5.5). Click OK when the
entry is completed (the text can be as long as desired) or on CANCEL to escape without changing
the current entry. Note that you can also import text or graphics from another file into the Description
box to save it on Data Ally with the current time base information simply by copying the text into
Windows Clipboard and then Pasting it into the Description entry box.
Figure 5.5 Entering Time Base Description
5.2.2 Configuring Signal Inputs
If you will be connecting analog detector signal inputs to the Communications Processor for this time
base, click on "Det1 Input" in the Component List dialog (Figure 5.3) to highlight it. Click again on
the SETUP button to display the Analog Input Setup dialog (Figure 5.6).
Figure 5.6 Analog Input Setup Dialog Box
38
Data Ally Chromatography Manager Operators Manual
The Analog Inputs Setup box is used to set up each detector input. You can define a maximum of
two different analog inputs for a single time base. Again, this setup can be done while configuring
either the live time base or its associated editing time base - all entries will appear the same in both
time bases.
Click inside the "Name" entry field and type the desired name for this detector, up to eight characters
long (only six characters maximum will be shown in some locations in the software).
You must enter at least a single character name for any defined input. This name will be used for
labeling all Data Ally functions, displays, and reports which reference this detector. Normally, the
name selected should clearly describe the type or model of the detector to help the operator
immediately recognize the nature and source of each signal input.
At the bottom of the dialog box in the area marked "Hardware" are entry fields designating the
number of the currently assigned Processor (Interface Module) and the identity of the input on that
Module (A or B) assigned to this analog signal. You must return to the System Setup dialog to
change the Interface Module number. Click inside the "Input Signal" field and enter the correct input
identity (A or B) for this detector connection if this is not already correct.
Click on the DESC button to enter a text description for this analog detector input - the text can be of
any desired length or format (Figure 5.7).
Figure 5.7 Entering a Description For Detector Input
When you are finished, click OK or CANCEL to return to the Analog Input Setup dialog.
If all entries are correct, click OK. Click CANCEL to avoid any changes to the previous entries for this
detector.
Adding a Second Detector
To specify two or more detectors for the current time base, click on the ADD button in the
Component Setup dialog (Figure 5.3) to see the Add Component dialog box (Figure 5.8).
39
Data Ally Chromatography Manager Operators Manual
Figure 5.8 Add Component Dialog Box
This dialog presents a listing of all possible system components which are possible to install via
Configuration given the set of drivers supplied with this version of the Data Ally software. This listing
appears in the menu box on the left side. Each type of component (e.g. detector, pump,
autosampler, GC, CE, etc.) appears as a separate listing.
To install a component, first click the left mouse button on the desired item category on the left listing
box to highlight it - the right box marked "Drivers" will immediately show a listing of all items in that
category.
Begin installing a second analog input by clicking on "Input Signal" in the left list box, and then on the
"Analog" item which appears in the right box to highlight it. When both items are highlighted, click OK
to add the new item to the existing Components list, or click OK to CANCEL. The dialog will close
and the Components Setup dialog will be displayed again (Figure 5.3). Note that a new item - a
second "Analog Input" - now appears in the Components list. You can proceed to use the SETUP
button to name and describe the second analog input in the same manner used to configure the first
input above.
Figure 5.9 Component Setup Dialog After Adding Second Analog Detector Input
This procedure is used repeatedly to install any number of additional items to the existing
components configuration for this time base. You can quickly review all the available items,
40
Data Ally Chromatography Manager Operators Manual
component types, and drivers available by clicking the BROWSE button, which will show a listing of
all such items as you page through the list.
You can proceed to assign a third or even fourth analog detector via the same method, using the
"Additional Inputs" function in the Detector Setup dialog to borrow analog inputs from different
Processor Modules.
If digital detector inputs are to be used, they will be programmed in conjunction with a serial or other
dedicated interface which is specified by selecting a detector driver using the Add Components
function. See Section 5.2.4 below for a complete explanation.
5.2.3 Configuring Relay Flags
When all the desired analog inputs have been defined, the next configuration step is setting and
enabling any relay or contact closure flags which will be used in the Communications Processor
assigned to the current time base. The electronic relay flag contacts, although always provided in
each Processor, must be configured in order to be functional and programmable while running the
system.
Click on the ADD button in the Components Setup dialog menu (Figure 5.9) to see the Add
Components dialog (Figure 5.8) again. Now click on "Flags" to highlight it in the left list box - two new
items, Input and Output, will immediately appear in the right list box (Figure 5.10).
Figure 5.10 Adding Relay Flags
To set an Input Relay flag for starting Data Ally methods in response to an Injection contact closure
from an autosampler, reed switch, or other device, click on Input and then click OK to add Input Flags
to the Components listing (or click CANCEL to cancel the addition). The Components dialog will
redisplay with the new Input Flags item listed, exactly as you added the second analog detector input
above.
Now click on Input Flags in the Components Setup dialog to highlight it and then on the SETUP
button - the Input Flags Setup dialog will appear (Figure 5.11).
41
Data Ally Chromatography Manager Operators Manual
Figure 5.11 Input Flags Setup Dialog
Each Communications Processor has four input relay flags or contact closures, identified on its
connections panel by code letters. One of the input flags is marked "S" and is normally reserved for
use with injection markers for triggering the start of a Method. However, any of the four inputs
available can be used for this or any other purpose. If you have already wired one or more of the
input relays to your installed instruments, you will now simply specify which inputs are used for what
purposes, and give them appropriate names to help you when programming methods in this time
base.
To assign a remote start function, click on the "Enable" field for the "S" input to check-mark it. Now
click inside the Name field (on the same row) and type a name such as "Inject/Start". The name can
be up to sixteen characters. Note this name will appear when you select the pop-up listing showing
choices for input flag entries while programming method events.
Repeat the same procedure to enable, disable, or name any or all of the other input flags. Once you
have configured flags in this dialog, the Input Flags column will be available for construction of the
Method Events Table (below).
When you are finished specifying all input flags, click on OK, or CANCEL to avoid changing the
previous entries. The Components Setup dialog will be redisplayed.
You can repeat the same procedure to enable and define any of all of the eight available output relay
flags on each Processor Module. Use the ADD button to select Output flags, and then use SETUP in
the Components Setup dialog to specify and name each desired flag.
5.2.4 Deleting Components
Once a Components listing for the current time base is generated, you can also delete or remove
items previously added for the current Configuration. From the Components Setup menu (Figure
5.12), click on the desired item to be removed to highlight it. For example, to delete a second analog
input from the current Configuration, click on Analog Input as shown.
42
Data Ally Chromatography Manager Operators Manual
Figure 5.12 Removing a Defined Component
Now click the REMOVE button - the highlighted item will immediate disappear from the listing.
You can use REMOVE repeatedly to delete several items. You can replace each items by repeating
the ADD command series as detailed above.
5.2.5 Setting Controlled System Instrument Components
Data Ally allows you to identify any and all instrumentation and accessories which form your
chromatographic system. This is particularly important when instrument control options are present.
To select an instrument control driver from the Components Setup dialog, click the ADD button to
see the Add Components dialog (Figure 5.8). Now click to highlight the item in the left list box
corresponding to the type of instrument/component you wish to add (You must have Purchased the
Control Package for that Component). For this example, click Detector to see the list in the right box
of all available detector interfaces (Figure 5.13).
Figure 5.13 Selecting Desired Detector Type
begin doing so, click the left mouse button on Components in the Command Menu bar, to display the
Components submenu.
43
Data Ally Chromatography Manager Operators Manual
Depending upon the type of system (e.g. HPLC, GC, etc.) you specified in the Set System command
above, certain choices for component type may be "grayed out" in the selection listing which are not
appropriate for that type.
As an example, assume your system is configured as HPLC. To set up this Data Ally time base to
use the ESA 5200 electrochemical detector, click on ESA5200 in the right "Drivers" list box to
highlight it and then click OK. The Detector Setup dialog box specific for this detector driver will
appear (Figure 5.14).
Figure 5.14 ESA 5200 Detector Configuration Setup Dialog
You can now select the mode in which the ESA 5200 will be used for programmed control by clicking
the appropriate selector button (Pulsed or DC) and indicating the number of analytical cells to be
used if DC mode is chosen. In the lower area marked "Hardware" the currently assigned
Processor/Interface Module number is listed and the serial port number on that Processor assigned
to the detector is given - you can change this number if a different port is to be used. Ports on the
Processor are automatically assigned during configuration on each time base in the order in which
devices are defined and configured.
To enable the actual programmed control via Data Ally, click the Enable Control field at lower right to
check mark it. If this field is not checked, the ESA detector in this example is still configured but the
actual control mechanism within Method programs will be inactive.
Click the DESC button to enter a text description for the detector of any length, and click OK when
done to return to the Setup dialog.
When the setup appears correct, click OK to finish the detector assignment. This detector is now set
until the current configuration is changed or a new Configuration file is loaded to replace it.
You can proceed to set up other components in the same manner, if their drivers are supplied with
your Data Ally software.
All instrument control interfaces ordered as options with each Data Ally unit should be listed as
Drivers by brand and model under each component type. If control interfaces you have ordered do
not appear in the listing, contact your distributor for further information. In some cases, a particular
instrument can use a driver protocol originally intended for a different instrument.
Clicking SETUP from the Components Setup screen for specific instrument brands or models added
to Configuration will often show unique Setup dialog boxes reflecting the independent parameters
required to define and operate each instrument interface. All setup dialogs permit the recording of
basic items such as brand, model, S/N, instrument number, and description.
44
Data Ally Chromatography Manager Operators Manual
You are not required to select nor complete the setup dialogs for any specific instruments you may be
using with Data Ally. It is best to configure only those for which you wish to perform direct
programmed control and those whose function and presence in the analytical system must be
thoroughly documented. Even if your Data Ally software includes control drivers for one or more
specific instrument types, you do not need to configure and use them in order to actually run Data
Ally.
When you are completely finished selecting and setting all configured elements, objects, and
instruments, click OK in the Components Setup dialog to return to the main Configuration Window
(Figure 5.2).
5.2.6 Program Screen Options, Menus, and Defaults
The next step in Configuration is to specify the contents of each of the primary programming and
display screens, select which options are to be used, and set all relevant defaults for variables in
each screen. By permitting you to customize every aspect of the user interface in this way, Data Ally
provides for the most perfect fit possible between the features you can see and use and the nature of
your application(s).
Each of the program screens can be configured differently for any "live" time base and its associated
editing time base, for maximum convenience and to fit your applications. The only parameters which
will remain constant are the time base name, detector input names, other instrument component
names, and flags.
You can also set names and colors for all screen elements, such as buttons, fields, and labels, which
will appear in the operating software.
You can set up each of the screens which are normally displayed by pressing their respective
SoftButtons, by pressing the usual button for the desired screen. The HELP SoftButton provides help
during this process, and the "channel selector" SoftButtons are inactive, except for the Edit channel
SoftButton which contains configure functions specific to editing.
5.2.6.1 Graph Default Screen Setup
Begin by clicking on the Graph SoftButton with the left mouse button to set the normal Graph display
configuration. The Configuration Graph window will appear (Figure 5.15).
Figure 5.15 Configuration Graph Window
This Graph window has nearly all the functionality of the normal Data Ally Graph screen (Section 6
below) so that you can try each feature and option available in order to determine which Graph
configuration is best as a default for your applications. Note that the RUN SoftButton is non-
45
Data Ally Chromatography Manager Operators Manual
functional since no live data acquisition or reprocessing is possible from Configuration Mode clicking the RUN button has no effect.
Configuring Chromatogram File Handling Functions
The Graph Files commands are available during Configuration both to load chromatograms for
experimentation and to set defaults for file loading and saving.
If you wish to load a chromatogram file, assuming at least one such file is available, in order to
experiment with configuring display options, click the Files command on the top menu bar and select
Load from the submenu (all other commands in the submenu are inactive) - the Load dialog will
appear (Figure 5.16).
Figure 5.16 Loading a Chromatogram In Configuration Graph Screen
Select a *.pdf (Data Ally data file) file from any directory or disk using the dialog, and click OK to load
this chromatogram file into the Graph window. The chromatogram will appear labeled with any
integration codes, peak names, and other annotations.
The normal default directory specified for the Data Ally software is a directory named C:\Data Ally.
This directory path will be selected first when you utilize the File Load dialog.
By using this dialog to load a file from a different directory or disk path, you can reset the default path
for loading chromatograms. WHEN YOU EXIT AND RESAVE THE CONFIGURATION FILE FOR A
TIME BASE, THE FILE LOAD AND SAVE DIALOGS WILL BE DEFAULTED TO THE
PATH/DISK/DIRECTORY FROM OR TO WHICH YOU LAST LOADED OR SAVED A
CHROMATOGRAM FILE. This is a convenient means of resetting the default file handling
commands if you wish to primarily use a directory other than C:\Data Ally. Note that you can always
select any path for file transfers using the Graph Files commands in the Data Ally software,
regardless of the default path settings.
Configuring Default Edit Functions
Click on the Edit command on the Graph top menu bar to see the Edit submenu in configuration.
Although all the commands are available, including Cut, Define Baseline, and Define Zone Codes,
only the Analyze, Calibrate, and Integrate functions can be configured for specific requirements in the
current time base. See Section 7.3 below for a complete explanation of the use of these commands
for analyzing and manipulating chromatogram data; the following section deals only with
configuration related changes to the Analyze, Calibrate, and Integrate dialogs.
46
Data Ally Chromatography Manager Operators Manual
Figure 5.17 Graph Edit Default Submenu
Click Analyze in the Edit submenu to see the Analyze Default dialog (Figure 5.18). This dialog is
used to produce result reports manually from loaded and integrated chromatograms.
Figure 5.18 Analyze Default Dialog
The Sample related information fields can be completed to set the defaults for sample name,
number, and description. These should be set only if your applications in this time base will require
frequent use of the same sample descriptors - otherwise, it will be easier to make these entries as
needed while processing chromatograms.
Any entries made here in the Report Template Name or Report Filename fields or the Print/Show
checkboxes will be used as the defaults for this dialog in the current time base when the default
Method is loaded. This allows you to specify the type of reporting to be done for any chromatogram
or sample as the default. To select a default report template from any selection of *.XLS report
template files in the \Data Ally\REPORTS subdirectory, click on the arrow button selector at the right
side of the Template field to see a listing of all such template files (Figure 5.19) - click on the filename
desired as the default, if any.
47
Data Ally Chromatography Manager Operators Manual
Figure 5.19 Selecting Default Report From Existing Template Files
During actual operation, Data Ally will capture all other sample-specific information in this dialog from
the Method program itself or from individual chromatogram file records, if and only if such information
exists. You can of course change any of the default reporting settings when running Data Ally, but it
is usually good practice to specify the most commonly used reporting type as the default. Do not
specify a default report file name if you plan to frequently use different report file specifications.
Note that the contents of the boxed areas marked "Correction Factors" and "Internal Standard
Amounts" are actually determined by how the master Calibration screen setup is performed (below,
Section 5.2.5.4). If you wish to specify defaults for different types of correction factors from those
actually shown here, or for a different number of internal standard peaks, you should first click the
Calib SoftButton in the left column and reset these items in Calibration screen configuration.
When all desired defaults are entered correctly, click OK to save them - if you have specified a report
in the default settings, the system will attempt to produce that report with any currently loaded
chromatogram.
Now, click Edit in the Graph top bar menu and then on Calibrate in the submenu to see the Calibrate
Default dialog (Figure 5.20).
Figure 5.20 Calibrate Default Dialog
48
Data Ally Chromatography Manager Operators Manual
Again, as with the Analyze dialog above, if you wish to add or remove correction factors or internal
standards from this dialog, you must first modify the Calibration screen configuration by clicking the
Calib SoftButton. If defaults values for any factor(s) are entered here, those defaults will appear in
the actual Edit/Calibrate dialog in this time base only if information specifying those factors is not
acquired from the loaded chromatogram raw data file.
Just as with the Analyze dialog above, the items in the "Report" area at the bottom can be defaulted
during configuration in this dialog. All other items will be automatically entered from the current
Method file or will be loaded from chromatogram records when processing files. Enter any defaults
as desired, and click OK when done, or Cancel to retain the previous settings.
To review and reset defaults for manual integration, click the Graph Edit command and then Integrate
in the submenu to see the Integrate Default dialog (Figure 5.21).
Figure 5.21 Integrate Default Dialog
This dialog can be used for manually integrating loaded chromatograms, once the required algorithm
parameters have been entered in the appropriate fields. You can click inside any of the parameter
fields in the dialog and type in a suitable value - these entries will also appear in the Integration
screen configuration dialog (below). If you have already completed the Integration Configure dialog,
the corresponding algorithm values entered there will appear in the same field locations here. See
Section 8. below for a complete explanation of the meaning and interpretation of these parameters.
Checking the "View Only" checkbox will default to manual integration of the current graph view of the
foreground chromatogram only. If you wish to perform primarily global integrations (entire
chromatograms), leave this box unchecked in this dialog.
When all settings are as desired, click OK to close. You can experiment with trial parameter settings
to determine the best values if you have loaded a typical chromatogram in the Graph window. Each
time you click OK, the system will attempt to integrate the current foreground chromatogram as
specified.
Configuring Default Graph Display Functions
Now, set the Graph Display default parameters by clicking Display on the top menu bar to view the
Display submenu (Figure 5.22).
49
Data Ally Chromatography Manager Operators Manual
Figure 5.22 Configuration Graph Display Submenu
You can select any of the submenu items to set the defaults associated with the assigned default
Method file.
Click on Attributes to set default display attributes (Figure 5.23).
Figure 5.23 Setting Default Display Attributes
In the Attributes dialog, click to check or uncheck the boxes to enable or disable all the desired
default options. These are divided into sections - Fill entries determine color filling, Show entries
determine display of codes or annotations, Baseline entries determine what baseline parameters will
be shown, and Peaks determines what peak descriptors or peaks will be displayed. You will see the
effects of changing any attributes on the loaded chromatogram in the Graph Window. When all the
desired attributes are set, click on OK, or on Cancel to use the previous settings.
See Section 7.6.1 below for a more detailed explanation of the various attribute functions. Note that
regardless of your settings, you will have complete access to changing any attributes at any time in
the Data Ally software after configuration is completed.
Now click the Colors command in the Graph Display submenu to see the default colors setup dialog
(Figure 5.24). This dialog selects the display colors associated with the default method.
50
Data Ally Chromatography Manager Operators Manual
Figure 5.24 Setting Default Display Colors
To change any of the colors, click the left mouse button with the pointer inside the "color box"
corresponding to the parameter or detector trace you wish to reset. The series of color boxes at the
top left marked "Trace Colors" will correspond to the detector inputs you have just specified for this
time base as you configured system components and inputs. Grid colors correspond to background
colors for the Graph window, Fill colors to chromatogram filling, and Attribute colors
to baseline and peak descriptors.
The Component Set dialog box (Figure 5.3) will appear.
To modify any default color, click inside the color box corresponding to the desired parameter to see
the Color Selector Dialog (Figure 5.25). The color palette can be used to change to the exact color
you prefer - click on the desired color in the palette to highlight it and then click OK, or click Cancel to
retain the current color setting. The color box on the Colors Dialog will change accordingly. When all
colors are adjusted, close the Default Colors Dialog (Figure 5.24) to return to the Graph Window.
51
Data Ally Chromatography Manager Operators Manual
Figure 5.26 Offset Default Dialog
Click the Graph Display top menu bar command and then click Offset to see the Offset Default Set
Dialog (Figure 5.26). This allows you to specify the signal offset level (either positive or negative)
from the true baseline level for display of chromatograms in any of the defined signal input and
display registers. If one or more chromatogram files are loaded, their current offsets in µV will
appear adjacent to their names in fields labeled with the detector input names you have configured.
If you wish to specify a permanent offset on the signal axis associated with the default Method file,
click inside the offset value field corresponding to that input register and type in the desired offset.
When all offsets have been entered as needed, click OK to close the dialog or Cancel to keep the
previous settings. Note that an entry of "0" (zero) will select no offset from the true signal value. You
have complete access to setting offsets either graphically or numerically at any time in the Graph
screen - entries of values other than zero are suggested primarily in cases in which you are aware
that the overlap of multiple detector signals will make them difficult to distinguish unless one or more
signal traces are offset.
Figure 5.27 Pumps Offset Display Dialog
If the current time base is configured for HPLC and pump control is defined in the Components
Configuration, a button will appear in the Set Offset dialog to set the default pump trace display
offsets. Click this button to specify these offsets with the Pumps Offset Display Dialog (Figure 5.27).
Fields are provided in this dialog for up to four individual pump gradient percentages (A through D)
and for a Flow value in ml/min depending upon the actual configuration. Click inside any of the fields
and enter an offset value from zero in the appropriate units. When finished, click OK to close the
52
Data Ally Chromatography Manager Operators Manual
dialog or Cancel to retain its previous entries. Again, this dialog sets the defaults only; the actual
offsets can always be changed during actual Data Ally operation.
Figure 5.28 Display Scaling Default Dialog
Click on the Graph Display top menu bar command and then on Scaling in the submenu to set the
graph scaling associated with the default Method file. The Scaling Default dialog (Figure 5.28) will
appear.
This dialog specifies the type of default scaling for chromatograms in the Graph window in this time
base. Scaling is set separately for the Signal and Time axes, either by checking the "Auto" box
adjacent to either field to specify "autoscaling" or by clicking inside the minimum and maximum value
fields and typing in actual scaling display limits in the appropriate units. If "Auto" is checked for either
Signal or Time, that axis will be adjusted automatically according to the magnitude of the
chromatogram(s) loaded or captured in the time base. See Section 7.6.3 below for a more complete
explanation of Scaling functions. As with all other parameters, you can change scaling at any time
during actual operation, including during real time data processing. It is recommended that you set
the defaults for what is normally the most convenient display presentation for your chromatograms
and applications. When scaling defaults are set, click OK to save them or Cancel to retain the
current settings.
If the current time base is configured with HPLC pump control, a Pumps button will appear in the
dialog for setting the pump trace scaling defaults. To adjust these settings, click on Pumps to view
the Pump Scaling Default dialog (Figure 5.29).
53
Data Ally Chromatography Manager Operators Manual
Figure 5.29 Pump Scaling Default Dialog
You can specify either autoscaling independently for the Flow and Gradient Per Cent traces, by
checking the "Auto" check boxes corresponding to either or both, or you can click inside the Minimum
and Maximum value entry fields to set the default scaling limits. Of course, it is possible to rescale
pump parameter traces at any time while running Data Ally regardless of this configuration. When
setup is as desired, click OK, or Cancel to retain the previous settings.
If you wish to set the default Graph display with more than one window "pane" when the default
Method is loaded, click Display in the top menu bar and then click Split in the submenu - a "child"
window which is an exact duplicate of the existing window will appear. You can repeat using the Split
command to create up to four separate panes as the default scenario. Each can have its own Graph
defaults set independently; simply click anywhere inside any window to make it "active", and then
select the Graph Display Attributes, Colors, Offsets, or Scaling dialog to specify the exact defaults for
that particular window. You can also close any window by using the Window control button at upper
left and selecting Close in the submenu.
To set a Status Window as the default, click on Graph Display in the top menu bar and then on
Status to see the Status Box Default Dialog (Figure 5.30).
Figure 5.30 Status Box Default Dialog
54
Data Ally Chromatography Manager Operators Manual
This dialog allows you to select a status window which will appear in the current time base when the
default Method file is loaded, containing specified parameters regarding chromatogram or trace
signals, run timing, and sample or sequence related information. The left portion of the dialog
contains a list of parameters which can be included in the status display window. To select the
desired parameters, click on each one to highlight its name. When all the desired items are
highlighted, be sure the Enable check box is checked and click OK to enable the defaulted Status
Box, which will appear on the current Graph window as specified. If you do not wish to have the
Status Box enabled, click the Enable checkbox to "uncheck" it.
The Status Box is the primary means of reporting real time information in Data Ally concerning the
signals being captured and displayed, and the progress of the running method. You should enable
the Status Box as default if you will normally use this function to track the operation of your methods.
Like all other display functions, you can switch the Status Box on or off at any time during actual
operation, or move or resize it at will.
The Swap function in the Graph Display configuration submenu has the same purpose as in live
operation, to move the chromatogram file in the "bottom" display register to the "top" register. This
command is active during configuration for use in manipulating files but has no other setup or
defaulting requirements. See Section 7.6.4 below for a more complete explanation of the Swap
command.
Configuring Default Graph View Functions
Next, configure the defaults for the View functions, the Zoom Box and Zoom Center mode.
Click the Graph View command in the top menu bar to see the submenu (Figure 5.31).
Figure 5.31 Graph View Default Submenu
To specify the Zoom Box to appear when the default Method is loaded, click on Zoom Box - the
Zoom Box window will appear. The Zoom Box is a "range-finding" tool which is most useful when
editing long chromatograms, to help you locate your current position when zooming various views.
Normally, the Zoom Box will not be enabled as a default. If the Zoom Box is already enabled as the
default, simply close it to defeat this setting.
Click on Zoom Center to set the Zoom/Center magnification parameters for both the time and signal
axes - the Zoom Center submenu (Figure 5.32) will appear.
55
Data Ally Chromatography Manager Operators Manual
Figure 5.32 Zoom Center Default Submenu
To activate the Zoom Center function as default for this time base, click on Enable Zoom Center
Scaling to "check mark" it. When Zoom/Center is activated, double-clicking anywhere on the current
Graph window will "zoom" the display centered around the cursor position by preset expansion
factors.
To reset the expansion factors as default, click on Set Zoom Scale Factors to see the Zoom Center
Scale Factors Default dialog (Figure 5.33).
Figure 5.33 Zoom Scale Factors Default Dialog
You can now click the left mouse button inside each of the set field boxes and type in the desired
magnification factor. Note that a factor greater than one will cause the display to "expand", while a
factor less than one will cause it to "contract". Recommended settings for are factors of between two
and five for both axes. When the factors are set as desired, click OK to save them,
or Cancel to retain the existing factors. You can of course reset the default factors using this dialog
without actually enabling Zoom Center as a default function.
Configuring Print Functions
You can set the default configuration of the manual printing functions in the Graph Print submenu by
clicking the Print top bar menu command to view the Print Default submenu (Figure 5.34).
56
Data Ally Chromatography Manager Operators Manual
Figure 5.34 Print Command Default Submenu
Click on Chromatograms in the submenu to see the printer setup dialog (Figure 5.35). This dialog
permits specification of the manual chromatogram print output associated with the default Method
file.
Figure 5.35 Printer Setup Default Dialog
This dialog selects the current printer type, the layout of the default chromatogram print, the number
of copies printed, whether the supplementary information is included, and allows access to additional
setup functions. A more detailed and complete explanation of the use of this dialog is provided in
Section 7.7.1 below. It is advisable to configure the default for the actual printer to be used with this
time base; remember that only a single printer can be specified for Data Ally.
When all printer and layout information is completed as desired for the default, click OK, or Cancel to
keep the existing settings.
57
Data Ally Chromatography Manager Operators Manual
Click the Graph Print top bar menu command and then Printout Info to default the desired
chromatogram information to be included on printouts in this time base. The Printout Info Default
dialog will appear (Figure 5.36).
Figure 5.36 Printout Info Default Dialog
This dialog specifies information specific to the foreground chromatogram which will be included in
chromatogram graphic printouts in the current time base when the default Method is loaded.
Note that unlike the printer setup dialog, the contents of this configuration dialog can be completely
independent for each time base. Check all the checkboxes corresponding to the printout information
to be included as default. Click OK when finished. Note that the printout information can be modified
prior to any printing activity while running Data Ally no matter how the defaults are set; it is
recommended that you specify only those information elements as default which you will always want
to include.
Now click Graph Print on the top bar menu and click Report in the submenu to see the
Chromatogram Report Default dialog (Figure 5.37).
Figure 5.37 Chromatogram Report Default Dialog
58
Data Ally Chromatography Manager Operators Manual
This dialog sets the default Excel template file for printing chromatogram reports and the file name
used for saving such reports, which can be specific to each independent time base.
Use these settings only if you intend to print out special report formats routinely when manually
producing hard copy chromatograms.
Click the "down arrow" button at the right of the Report Template field to see a complete listing of all
the report template *.XLS files available in the current \Data Ally\REPORTS subdirectory. If you wish
to select one of these reports as the default, highlight it and click the left mouse button. If you want to
omit any default for the report template type, simply leave this field blank.
When you have made the desired entries, click OK or click Cancel to escape without changes.
You have now completed initial configuration of the complete Graph menu which will be associated
with the default Method file in this time base. There is one other default setup task relative to the
Graph screen - the labeling and color of the Hold, Clear, and Monitor buttons at bottom right.
All Data Ally Softbuttons and display buttons can be reset individually and renamed as desired.
To configure the "Hold" button, place the cursor on the button and click the RIGHT mouse button the button configure pop-up submenu will appear (Figure 5.38).
Figure 5.38 Graph Screen Button Configuration Pop-up Submenu
There are two items in the poppa - Set Color and Set Title. To change the color of this button, click
on Set Color to see the Set Button Color Dialog (Figure 5.39).
59
Data Ally Chromatography Manager Operators Manual
Figure 5.39 Set Button Color Dialog
The Set Button Color Dialog contains a color palette from which you can select the desired button
face color by clicking on any color field. When the selected field is highlighted, click OK to recolor the
button or Cancel to escape. The button color will automatically be reset.
To change the title of the button, click the right mouse button again with the pointer on the button the Set Button Title dialog will appear (Figure 5.40).
Figure 5.40 Set Button Title Dialog
60
Data Ally Chromatography Manager Operators Manual
Click inside the entry field and type in the new name for this button, up to eight characters per line.
You can also enter a second line - press the CTRL and ENTER keys together to move to the second
line and type characters. Note that the "nominal" title of each button is always listed above the entry
field (in this example, Hold) to help you identify the function of each button you are renaming no
matter what actual name you assign. If you wish to change the text color for a better match to or
contrast against the selected background color, click inside the Title Color field. When the button
name is indicated correctly, with the desired color, click OK to rename the button or Cancel to
escape.
This same mechanism is used to rename and recolor all the Data Ally left column SoftButtons at any
time, and with all other buttons found at the bottom of the Method, Events, Integration, Peak Table,
Calibration Tables, and Sequence screens. You can select any combination of colors and names
desired. You should assign the names which are the most familiar to the system operators and the
most appropriate for your specific applications.
You can also rearrange the order of the three buttons at bottom right of the Graph configuration
screen, within the "solid border" that surrounds them. To move a button to a different position, simply
move the mouse pointer onto that button, hold down the left mouse button, and "drag" the entire
button to the new location - then "drop" it by releasing the mouse button. The other buttons will be
displaced and the "dragged" button inserted in the "dropped" location. You can also drag-and-drop in
this manner to rearrange the order of the SoftButtons in the left screen margin or any other sets of
screen-specific buttons.
Now proceed to configuring defaults for the Method program screen.
5.2.6.2 Method Default Screen Setup
Click on the METHOD SoftButton to set the Method screen defaults. A screen similar to the Graph
default screen will appear (Figure 5.41).
Figure 5.41 Method Configuration Dialog
There are two sections to the Method screen which are configured separately: the top level or
"global" method dialog, and the Method Events table window. The contents of both are completely
controlled by the manner in which you have specified Components Configuration for this time base
above.
Top Level Method Setup
61
Data Ally Chromatography Manager Operators Manual
The Method Configuration Dialog (Figure 5.41) contains information regarding the default Method file
name, the detector signal inputs, the handling of chromatogram data files, and the processing of
runs, in separate "blocked" sections of the screen. Since two independent detector inputs have been
configured for this time base in this example above, the Method dialog shown has parameter entries
for two inputs named "UV-Vis" and "ECD" - these could be renamed or one or the other removed by
clicking the Utilities SoftButton and selecting the Components configuration commands again as in
Section 5.2.1 above.
Default File Name: When Data Ally is first initialized all default program files will appear in their
Configuration windows with the name "Default.xxx" where xxx is the correct name extension, in this
case, .met. There are three ways to assign the default method file which will automatically be loaded
each time the current Data Ally time base is started, and whenever another method is cleared from
the time base; you can accept the name "default.met" and proceed, you can click inside the Name
field and type in any desired name (up to eight characters), or you can click on Files in the top
command bar to select a Method file which already exists on disk and "assign" it as the default with
all its existing parameters (see below). It is recommended that all default files be given the name
best suited to describe the nature of the method itself - if you perform mostly one type of method on
this time base, you may not need to program any Data Ally methods other than the one defined as
the default to do all your applications.
Once the default filename is shown correctly, click inside the Run Duration default field to set the
default run time in any desired time units. Type the value and units designator into the field and
either press ENTER or click inside another field on the screen. The new units will appear in the gray
box at right of the DURATION field. If the value already present for DURATION is acceptable, you do
not need to make any entry in the field.
Click the SAMPLE button to define the sample-specific entry fields associated with methods in the
current time base. The Sample Information Configuration dialog will appear (Figure 5.42).
Figure 5.41 Method Configuration Dialog
This dialog defines what information fields will be available for entering sample-specific data for
processing while executing individual methods, and sets the default values for those parameters, if
any.
In the top area of the dialog marked "Sample", click inside the check boxes in front of each sample
parameter listed to check those parameters you wish to be visible and accessible for entering sample
information. Do not checkmark those items you do not wish to use in your method files. You can
click inside the entry field corresponding to any parameter(s) and make entries which will
62
Data Ally Chromatography Manager Operators Manual
automatically appear in the default method. Such entries can of course be changed manually when
running the default method or when programming other methods; however, this is recommended
only if the default method will be used for nearly all applications in this time base and common
sample-related information is desired for output to typical reports.
NOTE THAT ITEMS WHICH ARE NOT CHECKMARKED WILL NEVER APPEAR IN ANY METHOD
PROGRAMS CREATED IN THIS TIME BASE.
In the center portion of the dialog marked "correction factors" are fields with check boxes which
correspond to the currently-enabled and available correction factors specified in the Calibration
screen configuration for this time base (Section 5.2.5.4 below). If the factors shown are sufficient or
appropriate for your applications, you can enter any desired default values for any such factors. If
you wish to add or delete factors for this time base associated with the method files, including
Dilution, Weight, and Injection Volume, click the Calib SoftButton and enable the desired factors, and
then return to this screen by clicking the Method SoftButton followed by the Sample button to
complete your factor assignments.
You can click inside the respective entry fields for each type of factor and type in a default entry
value, which will always appear when the default method is loaded. These entries can be modified
before executing the method.
You can also "lock" any or all factor values as desired simply by typing in a suitable value for any
factor's field and then un-checking its check box. In this manner, you can still use individual factors
for custom computations in reports, etc., but you will not be able to access them at all using the
SAMPLE button from methods in this time base.
In the bottom portion of the screen are several fields and check boxes corresponding to Internal
Standards (1 to 5). The number of internal standard peaks available for methods in this time base is
also specified by the Calibration configuration - to change the number of such internal standards,
click the Calibrate SoftButton and enable or disable internal standards as needed before returning to
this screen to set appropriate values.
When the correct number of available internal standard peaks is defined for the default method, you
can click inside any or all of the enabled value entry fields to insert IS concentration values as
defaults, if desired.
Click on the Sample Information Enable check box at right center to check it if the SAMPLE button is
to be visible and accessible with the defined information in your method files in the current time base.
If the Enable box is not checked, the SAMPLE button will not be displayed and it will not be possible
to enter sample-specific information for method processing in any method file.
When all the desired entries have been made, click OK to return to the Method Configuration Dialog
or CANCEL.
In the boxed area at top right marked "Detectors", separate rows and fields will appear for all the
detector inputs you have chosen in the current Components list for this time base. Each can be
enabled or disabled by default independently of all others by checking/unchecking the box before
each detector's name. Be sure all the detectors you wish to default as "active" are checked.
Each detector can also have its resolution or sampling rate set independently. Click inside the
RESOLUTION field for any detector and type in the desired value followed by a designator for any
acceptable units. If only a number is entered in the field, the existing units shown in the gray box at
right of the field will be used - if you have also typed a new units designator, the new units will be
shown in the gray box after you confirm your entry by pressing ENTER or clicking in any other field on
the screen. Again, if you wish to remove or rename a detector signal input, you must return to the
Utilities screen in Configuration and modify the current Components configuration settings.
63
Data Ally Chromatography Manager Operators Manual
The boxed area marked "Results" lists separate rows for each defined detector input, showing the
default chromatogram raw data file name to be used, a button accessing Reports for each
chromatogram, and fields to select the Integration and Calibration files to be used, if any.
If you wish to default to a specific filename for any or all detectors, click inside their respective
FILENAME fields and type the desired filename(s) up to eight characters. If no filename is given for
any detector input, the FILENAME field will come up blank by default and you will need to enter or
select a filename for each input before starting any runs using the default method.
If you wish to have any or all detector input signals automatically integrated at the end of your
methods, including the default method, click the check box in front of the INTEGRATION file entry
field for each such detector input to check it. IF YOU DO NOT CHECK THIS BOX FOR ANY
DETECTOR, YOU WILL NOT BE ABLE TO DEFINE AUTOMATIC INTEGRATION AND PEAK
FINDING FOR THAT INPUT AS PART OF ANY METHOD.
Enter an Integration program file name, if desired, as the default for any enabled/checked
INTEGRATION fields for detectors. This field supplies the program filename to be used for handling
the data from each detector independently in the default method. If you do not enter a filename here
for any detector, you will need to enter such a name before actually running any Data Ally method in
this time base if you want automatic analysis of that detector's data file during that method. Clicking
on the "down arrow" button at the right of this entry field will show a current listing of all available
*.INT files which you can associate with this default method - you can highlight the desired filename,
if any, and click to enter it.
If you wish to perform automatic calibrations using standard materials with the default method in this
time base for any detector inputs, click on the check box in front of each such detector's
CALIBRATION filename entry field to check it. IF YOU DO NOT CHECK THIS BOX FOR ANY
DETECTOR, YOU WILL NOT BE ABLE TO DEFINE AUTOMATIC CALIBRATION FOR THAT
INPUT AS PART OF ANY METHOD. Use the down arrow button at right of this field to choose from
the current selection of *.CAL files available as defaults.
For each check-marked detector, you can now enter a default calibration filename in the
CALIBRATION field, if desired, and/or designate a calibration TYPE or LEVEL number in the
appropriate fields. If you leave any of these fields blank for any detector, you will need to make
entries to use any calibration functions before actually running the default method in this time base. It
is best to leave these fields blank unless you will be using applications in which very frequent
calibrations are performed.
To set the default reports for chromatograms from any detector input, click on the REPORTS button
corresponding to that detector to view the Method Reports Default dialog (Figure 5.43).
64
Data Ally Chromatography Manager Operators Manual
Figure 5.43 Method Reports Default Dialog
To set reporting capability for any individual detector input, first click the ENABLE check box to check
it. The "number of reports" selector buttons will immediately become accessible as shown in Figure
5.43.
Now click on the button corresponding to the maximum number of reports you wish to be able to
produce during method execution for the current detector input (1 to 4). Immediately after clicking on
the desired number, that number of individual report fields will become enabled in the bottom portion
of the dialog.
Now click inside each of the check boxes corresponding to the individual report designator fields to
check the number of reports/rows you wish to be active for this detector in the default method.
You can also click inside the Report Template and/or Filename fields to enter Excel template
filenames and/or saved report filenames, respectively, as defaults. In the Template field, you can
click the right mouse button to see a "pop-up listing" of all report templates provided with your Data
Ally system, from which you can select a template for any row - of course, you can add new or
modified report templates to the default method at any later date once they have been created. If you
leave these fields blank for any or all lines, you will need to make entries before you can use the
automatic reporting functions when actually running the default method.
When all reports are shown as desired, click OK to return to the Configuration Method Window or
click CANCEL to avoid making any changes.
To enter a description for the default method file, click on Files in the top command bar menu to see
the Method Files Configuration submenu (Figure 5.44).
65
Data Ally Chromatography Manager Operators Manual
Figure 5.44 Method Files Configuration Submenu
Click on Method Description in the submenu to see the Default Method Description dialog (Figure
5.45).
Figure 5.45 Default Method Description Dialog
Type in a text description of any length for the default Method file - you can begin new lines by
pressing CTRL and ENTER simultaneously. This description will be available in the Data Ally Method
files directory to assist in selecting Methods to be loaded. Click OK when done or CANCEL.
It is recommended that, as with all other default settings, the default Method screen be configured
for the most common routine situation for this channel, which is most convenient since no additional
programming will need to be entered whenever that situation is present. The default Method can
always be modified in any manner to create custom Methods, which can be loaded for use at any
time.
Assigning an Existing Method File As Default: Instead of creating a new name and completely
entering a default method file, you can "re-assign" an existing Data Ally method file and its file
configuration as the default/configuration for the current time base. An assigned file will replace any
existing file shown in the Configuration Method Window and will substitute the new file's parameters
and configuration in place of the old.
To do this, click on File in the top command menu bar and select Assign Method from the pulldown
submenu to view the Assign Default Method dialog (Figure 5.46).
66
Data Ally Chromatography Manager Operators Manual
Figure 5.46 Assign Default Method Dialog
Use the path selector and file listing functions to find and highlight the desired method file (in any path
accessible) to use as the new default file. When the desired method name appears, click OK to
select it, or CANCEL to abort the assignment.
If a valid method file is chosen, it will be loaded into the Configuration Method Window and all its
settings and parameter values will be used to modify the current default configuration. You can then
proceed to edit this new default configuration item by item in the same manner as described above, if
desired, or you can accept this complete method as the default and proceed.
At this point all the global Method defaults have been defined - the next step is to set the default
Method Events table. Before proceeding, you may wish to reset the Events button color or label at
bottom right of the top level Method dialog by clicking the right mouse button for the pop-up button
edit menu as already described. When finished, click Events to see the default Events Table screen
(Figure 5.47).
Bottom Level Method (Events Table) Setup
The Events Table determines what chromatography system parameters you will be able to control
from Data Ally in real time while executing your Methods. You must include all columns in the table
which correspond to features or elements you will wish to control directly.
The normal Events Table is a split-screen window with a table in its bottom portion and the Graph
window visible in the top portion (Figure 5.47). This arrangement permits you to actually load a
chromatogram file (one file only) into the Graph window to assist you in properly programming the
default method, using all the same table editing tools normally available in Data Ally. Click anywhere
inside the Events Table window to make it active.
67
Data Ally Chromatography Manager Operators Manual
Figure 5.47 Method Events Table Configuration Window
Only a few columns are shown as "preliminary defaults" in the table, including the "Time" column and
"Comment". At this stage, you can add or remove columns from the table, you can change the
sizes/widths of individual columns as they are added, and you can change the order of the individual
columns in the table.
To begin, you can review the available selection of column types based on the current Components
configuration by placing the cursor pointer on any of the Events table column header buttons and
clicking the RIGHT mouse button - the table button edit pop-up submenu will appear (Figure 5.48).
Figure 5.48 Table Button Edit Pop-up
You can use this button to reset the color or button label/title for each specific button in the same
manner as previously described. To view the complete selection of available buttons, click on
Enable/Disable in the poppa. The Configure Events Table Columns dialog will appear (Figure 5.49).
68
Data Ally Chromatography Manager Operators Manual
Figure 5.49 Configure Events Table Columns Dialog
The dialog shows a listing of all the elements which have been set in the current Components
configuration which are appropriate for inclusion in the Method Events Table. Those currently in the
table are highlighted. To add new columns, click on the names of the desired column titles to
highlight them in the listing; to remove now-highlighted column titles, click them again to un-highlight.
When only the desired column items are highlighted, click OK, or Cancel to retain the previous
columns. Since at least one Input Flag for remote injection start was configured for this time base,
you would click to highlight "Input Flags" in the list to add this parameter as a new column for timed
event control. Upon clicking OK, the table will be restructured and the new columns will appear
(Figure 5.50).
Figure 5.50 Events Table With Inputs Column
You can repeat using the Enable/Disable command to add or delete other columns, or return to
Components configuration to make new options available for events, such as pump control,
depending upon the overall Data Ally configuration in this time base.
69
Data Ally Chromatography Manager Operators Manual
Next, you should adjust the size (width) and order of any column(s) in the table in a manner which is
optimized for your applications. Unlike the addition or removal of columns, which can be performed
only in configuration mode, column sizes and order can be modified at any time while running Data
Ally. If you will generally perform the same types of applications in this time base, it may be
convenient to set the best column size and order to avoid the need for further adjustments later on column order and width settings associated with the default method will always be retained when
Data Ally is started.
To change column order, place the mouse pointer on any column header button to be re-positioned
in the table and hold down the left mouse button; now "drag" the column to its new position and
"drop" it by releasing the left mouse button. The table will immediately be redrawn with the column in
its new position. Note that the pointer cursor will change while a column is being dragged to help you
determine in what position you will be "dropping" the column.
To resize any column, move the pointer cursor to the vertical boundary between any two column
header buttons until the pointer changes to a "left/right arrow" cursor. Now hold down the left mouse
button and move the special resize cursor to the left or right to expand or reduce the width of the
column selected - when the desired size is reached, release the left mouse button and the table will
be redrawn showing the column with its new width setting. You can use these tools repeatedly to set
the order and width of any columns in the default method. Note that the reorder and resize tools are
also available outside of Configuration mode for modifying the table columns at any time during
operation.
If the existing names shown on all the column buttons are not satisfactory, or you would like to assign
alternative names or descriptions on each button, click the RIGHT mouse button with the pointer on
any button to see the button edit pop-up (Figure 5.48), and then click on Set Title in the pop-up menu.
The Set Button Title dialog will appear (Figure 5.51).
Figure 5.51 Set Button Title Dialog
Enter the modified title on one or two lines as done previously in the Graph screen. Press CTRL and
ENTER at any time to start a second line. The title text can be of any length up to 256 characters,
but only as many characters will be shown in the table as can fit inside the width allotted for each
button. If you wish to decrease the size of a given column, for example, so that more columns will fit
on the usual single-page Events Table window, you may want to use retitling to enter a more
abbreviated title appropriate for the narrower column needed.
If you want to change the title color, click the TITLE COLOR button at the bottom of the dialog to see
the Button Title Color Select dialog (Figure 5.52).
70
Data Ally Chromatography Manager Operators Manual
Figure 5.52 Button Title Color Select Dialog
Again, a new color can be applied to any individual button as above.
Each column header button can be titled and colored independently of all other buttons using the
button edit pop-up.
If you wish, you can also change the colors and titles of the COPY, CUT, PASTE, INSERT, DELETE,
FILL, HOLD, CLEAR, and METHOD buttons below the table, by using the RIGHT mouse button to
display the same Button Edit Pop-up dialog. You can change the relative order of these buttons
within each group of three on the screen by "drag and drop" in the same manner as reordering the
column header buttons.
You can now proceed, if you wish, to enter an actual Events Table program for the default Method
file. This could be as simple as a one-line program with hold-for-inject input flag S programmed at 1
sec, or as elaborate as a complete "standard" pump and detector control protocol with timed
integration codes. You can type directly into table cells or use the spreadsheet or FILL functions for
cells or ranges. The Clear Method command in the Default Method File submenu can also be used
to clear all existing Events Table entries. See Section 8.3 below for a complete explanation of Events
Table programming.
Any program entered in the default method will always appear as part of this file automatically when
the current time base is initialized or when another loaded method file is cleared. Therefore, it is
recommended that only Events table parameters which are very commonly used in applications be
entered as defaults, since they will have to be cleared for programming or running alternative
methods. For most installations, it will be most appropriate to leave the default method events table
blank (empty) after its configuration has been set.
You have now completed basic method default configuration for this time base, and can proceed to
configuring the Integration programming screen.
5.2.6.3 Integration Default Screen Setup
Click on the INTEGRATION SoftButton to set the Integration Configuration Default Window (Figure
5.53).
71
Data Ally Chromatography Manager Operators Manual
Figure 5.53 Integration Configuration Default Window
This program screen is used to set the default or basic peak integration algorithm and to specify peak
identification options and the format of the peak identification table. Like the Method Default
Configuration screen, it contains two levels - a "top" or "global" window, and a Peak Table window,
which are set up independently.
Top Level Screen Setup
Default Filename: At top left, click inside the NAME field box and enter the filename (eight characters
maximum) for the default Integration program file, if you do not wish to use the already assigned
name "default.int". The name extension ".int" will be added automatically, which designates all Data
Ally Integration files. Alternatively, you can use the File/Assign Integration command in the top
command menu bar to use an existing Integration file already on disk as the new default file in this
time base (see below).
"Algorithm Parameters:" This boxed area at left contains a series of fields comprising the peakfinding algorithms used for automatic chromatogram integration. When shipped, the initial
"default.int" file includes values in each of these fields which may or may not be suitable for the types
of chromatograms or applications to be run in this time base. You can click inside any of these fields
and type in a new value with or without a new units designator - if the units designator is different
from that shown in the gray box to the right of each field, the gray box will change to reflect the new
units when you press ENTER or click inside another field after completing your entry. Note that if you
have already entered or modified the integration algorithm fields in the Graph Edit/Integrate dialog in
Section 5.3 above, those default values will automatically appear in this configuration screen as well;
the two locations in the software are interconnected.
It is normally suggested that you use the default values supplied for these fields when beginning to
use Data Ally, until you acquire some representative chromatograms and gain a better understanding
of the operation of the integration algorithm. However, if you have already used Data Ally or have
other Data Ally units on hand, you may wish to transfer a known integration algorithm parameter set
from another existing program file by using the Assign command (see below).
To enter a description for the default Integration program file, click the File command on the top
command menu bar to see the File submenu (Figure 5.54).
72
Data Ally Chromatography Manager Operators Manual
Figure 5.54 Integration Default File Submenu
Click on Integration Description in the submenu. A Description Entry dialog box will appear (Figure
5.55); type in the desired description of any length on one or more lines and click OK when finished.
Figure 5.55 Integration Default Description Dialog
Assigning an Existing Integration File As Default: Instead of creating a new name and completely
entering a default integration file, you can "re-assign" an existing Data Ally integration file and its file
configuration as the default/configuration for the current time base. An assigned file will replace any
existing file shown in the Configuration Integration Window and will substitute the new file's
parameters and configuration in place of the old.
To do this, click on File in the top command menu bar for the File submenu (Figure 5.54) and select
Assign Integration from the pulldown submenu in the same manner as described for Method files
above - the Integration Default Assignment dialog will appear (Figure 5.56).
73
Data Ally Chromatography Manager Operators Manual
Figure 5.56 Integration Default Assignment Dialog
Select the desired Integration file using the load dialog, by path and name, from any disk or device,
and click OK to enter it as the default - all entry fields and configuration settings will immediately
change to reflect those of the assigned file.
The color and/or title of the PEAK TABLE button at bottom right can be modified by using the RIGHT
mouse button to display the Button Edit Pop-up.
Bottom Level (Peak Table) Setup
When the "top level" integration configuration is completed, proceed to the Peak Table by clicking the
button marked "Peak Table" at lower right. The Configuration Peak Table Window will be displayed
(Figure 5.57).
Figure 5.57 Configuration Peak Table Window
The Peak Table appears along with a Graph Window in a split-screen view similar to that for the
Method Events Table. To set the Peak Table configuration, first click anywhere inside the peak table
window to make it active.
74
Data Ally Chromatography Manager Operators Manual
In the same manner as for the Events Table, you should begin by determining if all the column items
needed for your applications in this time base are present. With the pointer on any table header
button, click the RIGHT mouse button to see the Table Button Edit Pop-up, exactly the same as that
for the Events Table. Click Enable/Disable to view the Configure Peak Table Columns dialog (Figure
5.58).
Figure 5.58 Configure Peak Table Columns Dialog
The list box in the dialog shows the complete set of column elements available for this table - click to
highlight all the desired items and to un-highlight/defeat the unneeded items. When all the required
items are highlighted, click OK, or click CANCEL to restore the previous selection.
The table will immediately be redrawn showing only the columns selected. You can now use the
resize and drag-and-drop reordering tools to reformat the column buttons as you wish, in the same
manner as for the Method Events Table.
Now, use the Button Edit Pop-up to reset the text labels, text colors, or button colors for any or all
column buttons, in the same manner as for the Events Table described above.
If you wish to color or rename the spreadsheet command buttons (COPY, CUT, PASTE, INSERT,
DELETE, FILL), HOLD/CLEAR, or INTEGRATION buttons beneath the Peak Table, use the Button
Edit Pop-up to do so by placing the pointer on the button and clicking the RIGHT mouse button to
access the editing poppa menu.
If you wish, you can now enter peak data into the peak table either by manual entry or by automatic
filling from a chromatogram loaded into the Graph window above the Peak Table (see Section 8 for
instructions on creating a Peak Table). The spreadsheet or FILL functions can be used to edit or
insert new table entries. Any such entries will be saved as the default and will always appear in the
peak table when the time base is initialized. Therefore, if you do not perform applications that nearly
always use the same Peak Table information, it is suggested that you leave the Peak Table
blank/empty in the default Integration file. The Clear Integration command in the Default Integration
File submenu can also be used to clear any existing entries from the Peak Table.
When all Integration screen and Peak Table elements are set as desired, proceed with configuring
the next program screen.
5.2.6.4 Calibration Default Setup
Click on the CALIBRATE SoftButton to display the Configuration Calibration Window (Figure 5.59).
75
Data Ally Chromatography Manager Operators Manual
Figure 5.59 Configuration Calibration Window
The Calibration Default screen contains two general levels, a "top" or "global" window which sets
overall options and defaults, and a lower "table" level which accesses and sets formats for both types
of tables incorporated into the normal Calibration window.
"Top Level" Calibration Functions
Default Calibration Filename: Click inside the NAME field and type in a new filename to be assigned
to the default Calibration file which is loaded when the current time base is initialized, or use the
standard "default.cal" name. The name extension ".cal" will be added automatically. Alternatively,
you can use the File/Assign function to denote an existing calibration file as the default file and
format.
On the left side of the screen, in the area marked "Standard Type", the types of calibrations available
for the current time base are specified by clicking on the check boxes to check the options which are
to be enabled. Click also on the "Def" button corresponding to the option to be defined as the default.
If no internal standard calibrations are to be performed for any applications in this time base, simply
leave the "Internal" type box unchecked and this option will never appear in any calibration screens.
In the area marked "Basis" are the two options - area or height - for quantitating peaks. Click to
check which options are to be available, and on the "Def" button to assign the default condition if
more than one selection is indicated.
In the area marked "Curve Type" click on all the curve fitting options to be accessible in the current
time base for multiple-point standard computations. Also click on the single option to be set as the
default (most often Linear) which will be used in the absence of any manual modifications.
In the area marked "Correction Factors", check the checkboxes of each of the factor types you wish
to be active in this time base. These checkboxes will enable the use of each type of factor in setup of
your Method and Sequence programs, as well as the manual Analyze and Calibrate dialogs in the
Graph screen, for this time base. IF A FACTOR IS NOT ENABLED HERE, IT WILL NOT BE
AVAILABLE FOR USE IN ANY MANNER IN THE CURRENT TIME BASE.
NOTE, AS FOR THE OTHER DEFAULT SETUP SCREENS, THAT THOSE OPTIONS NOT
CHECKMARKED FOR CALIBRATION WILL NOT BE DISPLAYED NOR AVAILABLE FOR USE
WITH ANY CALIBRATION PERFORMED USING THIS TIME BASE CONFIGURATION.
76
Data Ally Chromatography Manager Operators Manual
To enter a description for the default calibration file, click File in the top command menu bar to see
the File submenu (figure 5.60).
Figure 5.60 Calibration Default File Submenu
Click on Calibration Description and enter the desired text description of any length into the
Description dialog entry field - click OK when complete.
To assign an existing Calibration file on disk as the default file for the current time base, click File in
the top command menu bar, and select Assign File to see the Assign Default Calibration File dialog
(Figure 5.61).
Figure 5.61 Assign Default Calibration File Dialog
Choose a Calibration file from any disk or directory using the selector dialog, and click OK - the
selected file will be loaded into the default register and its configuration will update the previous
configuration for calibration.
If you like, you can use the Button Edit pop-up accessed with the RIGHT mouse button to change the
label or color of the Calib. Tables button at bottom right - however, this button will not appear in the
operating software and exists in Configuration mode only.
Calibration Tables
77
Data Ally Chromatography Manager Operators Manual
Now proceed to set up the appropriate calibration tables by clicking the CALIBRATION TABLES
button at bottom right to view the Calibration Tables Configuration Window (Figure 5.62)
Figure 5.62 Calibration Tables Configuration Window
This screen is very similar in appearance to the actual "Calibration Screen" in the Data Ally operating
software - see Section 9 below - and is used to specify the contents of the Calibration Reference
table (top right), which sets standard concentrations, basis, curve fitting, and other parameters for
each peak, and of the Calibration Data Table (bottom), which displays desired information about all
standards which have been run and processed. Before structuring both tables, it is necessary to
perform the Default Calibration Setup using the File/Setup command.
Click File in the top menu bar to see the Calibration Default File Submenu (Figure 5.63).
Figure 5.63 Calibration Default File Submenu
Now click Setup to view the Calibration Default Setup Dialog (Figure 5.64).
78
Data Ally Chromatography Manager Operators Manual
Figure 5.64 Calibration Default Setup Dialog
To create the Default calibration Reference Table, a valid Integration program file saved on disk usually the file designated as the default integration above - is designated as the "model" for defining
the required Peak Table. As for all calibrations, defining the relationship between the default
calibration file and an integration file establishes a permanent link between the two files, so that
whenever the "model" Integration file's peak table is modified, the same modification will
automatically occur in the default Calibration file. Click on the arrow selector to see a listing of all
existing Integration files, which could be used as models, and select one from the list, or simply type
the name of the selected model file.
Now set the number of calibration concentration or standard levels for the default by either clicking
inside the "Standard Levels" field and typing the desired number (between 1 and 16) or clicking the
arrow selector and choosing the desired levels from the listing. When both the Integration file
reference and number of standards are shown as desired, click OK to close the dialog and proceed.
the Data Ally Configuration System now has sufficient information to allow you to fully define the
Reference Table.
If the Integration file referenced in Setup actually contains a defined Peak Table, the data from this
table will now appear in the Calibration Reference Table. It is perfectly legitimate to have actual
calibration data saved in the default Calibration file for general use, although it will be more common
to have only the format of a calibration saved as the default file, and to create new Calibration files
with specified names by using the Default Calibration as a "template" only.
Calibration Reference Table: To review and configure this table, first click anywhere inside this table
window to make it active. Then place the pointer on any of the column header buttons in the table
and click the RIGHT mouse button to display the Header Button Edit Pop-up, which is employed in
exactly the same manner as the pop-ups in the Events and Peak Tables to Enable/Disable table
column items, and change button text labels and colors. Click on Enable/Disable in the pop-up to
see the list selector dialog for the Calibration Reference Table
(Figure 5.65).
79
Data Ally Chromatography Manager Operators Manual
Figure 5.65 Configure Calibration Reference Table Columns Dialog
The RT, Peak No., and Peak Name columns are "imported" from a corresponding Peak Table screen
at the time a calibration file is established. You can select which of these items to show in the
Reference Table by enabling (highlighting) or disabling them. A series of "Level" columns are also
available, according to the maximum number of levels you have permitted in Setup.
You should select only those column functions in the Reference Table that you will wish to use to
change the way calibration data are interpreted for your applications. Columns representing those
parameters which will always remain fixed should normally be omitted by disabling them; they can
always be restored later on by re-configuring. As an example, if your quantitative methods will always
employ peak area rather than height measurements, and if linear regression curve fitting will always
be used for single level calibration, you should disable the Basis and Fit columns and all the Level
columns except for Level 1; in the top level calibration configuration you should check Area Basis
and Linear Regression fit as the only options. This will "lock" all calibrations performed with this
configuration for these settings.
When selecting the number of Calibration Level columns, set the maximum number of different
standard concentration levels you ever anticipate for any application using this time base. Up to 16
different level columns can be chosen. The only drawback to configuring many level columns is that
this will tend to slow down redraws of the Reference table window. Again, if you configure too few
levels now to accommodate a future application, you can always re-configure the time base later
when necessary.
NOTE: IN ORDER TO COMPLETE CONFIGURATION OF THE REFERENCE TABLE YOU MUST
SELECT AT LEAST ONE LEVEL COLUMN. Otherwise an error message will appear when you
attempt to proceed with further configuration or to exit the configuration mode.
Highlight all the column items to be enabled and click OK to redraw the Reference Table. You can
now edit the column header button titles, colors, and column order using the Button Edit Pop-up
dialog and the button drag-and-drop tools in exactly the same manner as for the other tables.
You can type information directly into the Reference Table cells, modify peak table information
already present there, or use the spreadsheet or FILL functions to complete cell entries. See Section
9.0 below for a complete explanation of how calibration reference tables are created and utilized.
Calibration Data Point Table:
The final step in configuring Calibration files is to set the contents of the Data table. Click anywhere
inside the Calibration Data Table window in the bottom portion of the screen to make this window
80
Data Ally Chromatography Manager Operators Manual
active. To review the current contents and available fields for the table, put the pointer on any of the
column header buttons, click the RIGHT mouse button to see the Button Edit Pop-up, and click
Enable/Disable to view the Configuration Calibration Point Table dialog (Figure 5.66).
Figure 5.66 Column Selector Dialog for Calibration Data Table
This table contains selected information about each standard sample used to calibrate the system,
providing a mechanism for reviewing pertinent data during routine calibrations. You should select
any or all of the parameters in the listing which will be of value in monitoring the quality of calibrations
for your applications, and which will help you establish an adequate historical record of series of
calibrations as they are performed and logged. There are a large number of descriptive parameters
available and the table can be as wide or as large as needed or desired.
Parameter items which can be included in this table display include:
Area % - Area Percent
Height % - Height Percent
Level - Calibration Level
Dil - Dilution
Int. File - Integration Filename
IS Area - Internal Standard Area
Method - Method
IS Conc. - Internal Standard Concentration
Cg Filename - Chromatogram Data Filename
IS Height - Internal Standard Height
Date - Date of Calibration
Time - Time of Calibration
Area - Area
KC - Polynomial Coefficients
KB - Polynomial Coefficients
KA - Polynomial Coefficients
Conc. - Concentration
Height - Height
RF - Response Factor
RT - Retention Time
Run Date - Run Date
Run Time - Run Time
Smp. Desc. - Sample Description
Smp. Name - Sample Name
Smp. No. - Sample Number
81
Data Ally Chromatography Manager Operators Manual
Click on as many items as you wish to include in the table to highlight them, disable all unwanted
items by un-highlighting them, and click OK when finished to redraw the table. You can now proceed
to set new titles and colors for any or all of the column header buttons using the Button Edit Pop-up
tools, and to reorder the columns if you wish using the drag-and-drop tool.
You can also change the colors and titles of the spreadsheet function buttons (CUT, COPY, PASTE,
FILL, INS, DEL, CALIB) beneath the Reference and Data Tables using the Button Edit Pop-up,
accessed with the RIGHT mouse button. Within each group of these buttons, you can also use the
"drag-and-drop" tools to reorder the individual buttons.
If you wish, you can now load one or more chromatograms, integrate them in the Graph window, and
use them to create a default calibration data table for one or more peaks. See Section 9
below for a detailed description of how calibrations are performed.
You can use the Clear Calibration command in the Default Calibration File submenu to remove all
existing entries from the Reference or Data tables at any time.
The Calibration defaults should now be completely configured - click on OK to leave the Calibration
defaults screen.
5.2.6.5 Sequence Default Screen Setup
Click on the SEQUENCE SoftButton to view the Configuration Sequence Window (Figure 5.67). This
screen configures all parameters related to batch analysis and reprocessing, and the use of an
autosampler. The contents of this screen may vary depending upon which, if any, autosampler has
been designated in the Components list.
Figure 5.67 Configuration Sequence Window
Default Filename: Click inside the NAME field and type the desired filename for the default
Sequence file, if "default.seq" is not satisfactory. The name extension ".seq" will be added
automatically. Alternatively, use the File/Assign function in the top command bar menu to assign an
existing Sequence file on disk as the new default file and format, in the same manner as described
above for the other default program file types.
Inside the area marked "Process Mode", click on all the options to be available in Sequences in this
time base, and click the "Def" box to mark which mode will be the default. The Acquire mode is for
capturing live run data, and is necessary for connection to chromatographic instruments. If this
82
Data Ally Chromatography Manager Operators Manual
channel is to be used as an edit-only channel, Acquire mode should not be checked, since no data
acquisition can be performed - only Reprocess mode can be used.
In the area marked "Position", you can set the defaults for the number of rows to be processed in the
batch table by clicking inside the Start or End entry fields and typing a row position number.
Regardless of how many rows are actually entered into the batch table below, these entries will force
execution of the batch within the defined range of rows unless changed manually before starting the
Sequence.
In the area marked "Options", click on the check boxes for "Suppress Integration" or "Suppress
Calibration" to set these functions on or off for the default sequence file. These check boxes override
any specific integration or calibration instructions entered in the methods being run in a sequence or
in the sequence table itself.
Click the "Validate" checkbox to specify sequence table validation as the default. With Validation
enabled, all the parameters specified in the sequence table (existence of methods, integration files,
calibration files, etc.) will be verified by Data Ally when a Sequence is started before actually
attempting to perform the first method, to be sure all the required information is available to perform
the entire sequence of operations as stated.
To enter a description for the default Sequence file, click File on the top command menu bar to view
the File Default submenu (Figure 5.68).
Figure 5.68 Sequence File Default Submenu
Click Sequence Description to view the Description dialog box (Figure 5.69). Type the text
description into the entry box in the Description dialog and click OK when finished.
83
Data Ally Chromatography Manager Operators Manual
Figure 5.69 Sequence Default File Description Dialog
To assign an existing Sequence file as the default file, click File in the top command menu bar and
click Assign File. The selector dialog will appear (Figure 5.70); choose a Sequence file from disk or
other device and click OK. The indicated Sequence file will be loaded into the default register and will
be used to reset the default configuration.
Figure 5.70 Assigning Sequence Default File
Sequence Table:
The Sequence or Batch table at the bottom of the screen can include any series of column functions
for complete automated processing of single sample injections or batches of injections.
Begin by reviewing the current contents and available columns for this table; click inside the table
window to make it active, place the pointer on any column header button, and click the RIGHT mouse
button to see the Button Edit Pop-up. Click Enable/Disable to view the Configure Sequence Table
Columns Dialog (Figure 5.71).
84
Data Ally Chromatography Manager Operators Manual
Figure 5.71 Configure Sequence Table Columns Dialog
You can now choose all desired column elements for this table by highlighting those entries and unhighlighting unwanted items. Note that any columns placed in the Sequence table can contain run
instructions which will override the same parameters specified in Method files called by the
sequence. You should include all parameters as sequence table columns you will need if you are
routinely setting up batches of runs and entering sample-specific data, random combinations of
methods, integration files, and calibration instructions, or sample correction factors such as IS
amounts, dilutions, or injection volumes. As with all Data Ally tables, it is advised that only those
columns which will be useful for your anticipated applications be included in the table configuration.
The following column parameters are available for the Sequence Table:
# Injs. - Number of Injections
No. - Vial Number
Method - Method Filename
[Det. A] Cg File - Chromatogram Filename from Detector A input
[Det. A] Int. File - Integration Filename for Detector A input
[Det. A] Cal. File - Calibration Filename for Detector A input
[Det. A] Rpt. Templ. - Sample Report Template File for Detector A input
[Det. A] Cal. Hist. Templ. - Calibration History Report Template for Detector A input
Cal. Level - Calibration Level
Cal. Code - Calibration Code
IS1 - Internal Standard Amount
[Det. A] Rpt. File - Sample Report Filename for Detector A input
PrtCg - Print Chromatogram Command
Dil. - Dilution
Smp. Name - Sample Name
Smp. No. - Sample Number
Smp. Desc. - Sample Description
Comment - Comment
When all desired items are highlighted, click OK to proceed and redraw the table.
You can now use the Button Edit Pop-up tools to retitle or recolor any of the column buttons, or the
drag-and-drop tool to change the column order and relative widths.
85
Data Ally Chromatography Manager Operators Manual
You can also use the Button Edit Pop-up to change the spreadsheet function buttons (COPY,
PASTE, CUT, FILL, INSERT, DELETE), HOLD/CLEAR, and screen selector button (GRAPH) below
the table. The order of these buttons can be changed within each of the three functional groupings
by dragging-and-dropping.
If appropriate, you can now enter information directly into the Sequence table to create a default
table. Entries can be made by typing directly into cells or by using the spreadsheet or FILL functions.
This is recommended only if a "generic" batch listing will be used to run most applications on this time
base. See Section 11 below for a complete explanation of the use of Sequence functions. You can
use the Clear Sequence command in the Sequence Default File submenu to clear all existing entries
from the default sequence table.
The Sequence defaults should now be completely defined. Click on OK to finish.
5.2.6.6 Retitling, Reordering, and Coloring Program SoftButtons
If you have not already done so, like all other Data Ally screen elements, the SoftButtons displayed
on the left screen margin button bar can now be individually renamed and recolored and their order
changed as desired. With the mouse pointer on the desired SoftButton, click the RIGHT mouse
button to see the Button Edit Pop-up; make changes as for any other system buttons above. You
can also drag and drop the SoftButtons to change their relative positions along the height of the
button bar.
In addition to changing the SoftButtons, it is also possible to change the information in and format of
the "Last Changed" field at the bottom of each screen type. To do this, place the pointer on the "Last
Changed" button and click the RIGHT mouse button - the Button Edit Pop-up will appear.
5.2.6.7 Completing Configuration
If all Components specifications are correct and all the default program screens are set up as
desired, you are ready to finish Configuration of the current time base. You may wish to use the Print
Configuration commands for any or all of the program default screens (found in their respective File
submenus) to print a hard copy record of each part of the overall default configuration.
If you wish to set up the configuration for the edit time base associated with the live time base you
have just completed, click on the "Edit TB" SoftButton for the edit time base and review all of its
program screens, making appropriate changes. Note that the Method screen parameters and
default values must be identical for each pair of live and edit time bases - however, all other
screens can be varied markedly by means of configuration.
Once you have reviewed the edit time base configuration, proceed to any other live or edit time bases
available by clicking their respective left-column SoftButtons and then clicking the Util SoftButton to
begin setup of each new time base as described above.
ALL TIME BASES PRESENT MUST BE COMPLETELY CONFIGURED BEFORE EXITING AND
SAVING THE CONFIGURATION FILE. Only one Configuration File sets the characteristics of the
entire Data Ally software regardless of the number of time bases present.
To finish configuration, click the UTIL SoftButton in any time base window to view the Utilities
Configuration screen. Click Files in its Command Menu bar to see the submenu (Figure 5.72).
86
Data Ally Chromatography Manager Operators Manual
Figure 5.72 Utilities/Files Configuration Submenu
To save the new configuration as part of the current configuration file (the name of which is shown on
the top bar) click Save Configuration. To save the new configuration as a new and unique
configuration file, click Save Configuration As to view the Save Configuration dialog
(Figure 5.73).
Figure 5.73 Save As Configuration Dialog
Enter a description of the current configuration by clicking inside the Description box and typing the
desired entry.
5.2.6.8 Completing Time Base Configuration
When all Configuration settings and default files are shown as desired for the current time base (in
other words, the desired configuration file is currently loaded), you can exit Configuration to begin
using Data Ally with any new configuration changes, or you can restore the previous or any other
saved configuration.
87
Data Ally Chromatography Manager Operators Manual
If you wish to load a previously saved Configuration file, either to edit it or to set up the Data Ally
software as it specifies, click on Files/Load in the UTIL screen to view the Load Configuration dialog
(Figure 5.74)
Figure 5.74 Load Configuration Dialog
Select the desired configuration file and click OK to load it, or click CANCEL. You can now edit this
file in the same manner as you have defined a configuration above.
To exit Configuration Mode:
In the UTIL screen, click the File command on the top menu bar to see the Files submenu (Figure
5.72). Click on Exit Configuration - the Exiting Configuration dialog will appear (Figure 5.75).
Figure 5.75 Exiting Configuration Dialog
This dialog specifies whether or not the CURRENTLY LOADED Configuration file will become the
new "default" configuration for Data Ally, or whether the last-used configuration will remain as the
default.
88
Data Ally Chromatography Manager Operators Manual
Click "Yes" to make the current configuration file - which you have loaded and/or edited - the new
"default" configuration and to initialize Data Ally using that configuration.
Click "No" to revert to the previously-used configuration file, located in any disk directory path, and
initialize Data Ally using that configuration.
If you need to make additional configuration changes before initializing Data Ally, click CANCEL to
return to configuration mode.
After clicking Yes or No, the Data Ally software will be restarted according to the instructions in the
selected configuration file. When the hourglass cursor disappears, all time bases will be ready for
use. You can proceed to write programs, or run methods directly using the default program files you
have created.
Any Configuration file can be used at any time to reset and reinitialize the Data Ally software simply
by entering configuration mode, loading the desired configuration file or modifying any configuration
file as needed, and using the Exit Configuration command followed by a "Yes" response in the Exiting
Configuration dialog.
5.3.0 Configuration Files
When you enter Configuration Mode, the Data Ally software changes so that only the contents of
Configuration files are displayed and available for editing. Each time the Configure command is used
in the Utilities screen, the currently-applied Configuration file is loaded for viewing in Configuration
Mode. If you wish to review and edit a Configuration file which is not currently in use, you can easily
load any *.CFG file on any existing disk or device. You can also save the complete contents of
Configuration Mode to overwrite an existing configuration file with new information, or as a completely
new file, in any location on disk.
It is recommended that you create and archive as many different Configuration files as you will need
to properly set up all applications you may perform with your Data Ally system. These files should be
given unique names and descriptions so that they can be located and identified easily, and should be
copied onto floppy disks or some other storage media for secure backup archiving purposes.
REMEMBER THAT THE ONLY WAY THE SOFTWARE CONFIGURATION CAN BE CHANGED IS
BY ENTERING CONFIGURATION MODE, SELECTING A CONFIGURATION SO THAT IT
APPEARS IN CONFIGURATION MODE, AND EXITING CONFIGURATION MODE. The act of
exiting Configuration Mode always automatically applies the Configuration currently loaded and
viewed in Configuration Mode. To change configurations, you must first load the desired new
Configuration file in Configuration mode and then exit Configuration to apply that file to the system.
The Configuration file used to set up the system can be located in any physical path on disk.
5.3.1 Saving Configuration Files
To save the current Configuration on which you have been working under its previous name, click on
Files on the top Command Menu bar, to see the Files submenu (Figure 5.72). Click on Save Config
on the submenu to resave the current configuration, overwriting the old file.
To save the current Configuration under a new name, click on Files on the top command menu bar,
and click on Save As - the Save As dialog box will appear (Figure 5.73).
Enter the desired name, or modify an existing filename, in the dialog box. When the desired
name is shown, click OK to save a new file with that name.
89
Data Ally Chromatography Manager Operators Manual
5.3.2 Loading Configuration Files
The last Configuration file loaded in Data Ally is assumed to be the file which should be loaded the
next time the software is initialized.
In Configuration Mode, you can load any existing *.cfg file for review or modification, or to implement
that file to change the system configuration.
To load a configuration file, click File on the top command menu bar, and then click Load Config in
the submenu. The Files/Load dialog will appear (Figure 5.74).
Select a drive, path, and filename for a *.cfg file to load, and click OK. The selected file will be loaded
and displayed in all the screens in Configuration Mode.
5.3.3 Deleting Configuration Files
You can delete Configuration files which are no longer useful from Configuration Mode by using the
Windows File Manager - there is no direct Delete command within the configuration files dialog.
90
Data Ally Chromatography Manager Operators Manual
6.0 Getting Started
Data Ally Chromatography Manager is a multitasking data acquisition, management, and control
system for use with computers running the Microsoft Windows 3.1 or Windows 95 graphical user
interface. One time base is available with two inputs for detectors. Each detector can have its own
unique "Configuration" based on the analytical instrumentation assigned to that channel and its
specific applications.
6.1.0. Operating Structure and Programs
Data Ally runs one time base with two detectors simultaneously. Each uses the same standard
operating structure, customizing changes made via the unique Configurations of the separate
detectors. The row of SoftButtons at the left of all Data Ally display includes a number of selector
buttons used to set which time base is currently being observed and programmed.
Data Ally user display interface utilizes a set of six basic, distinct screens for visual presentation and
editing of all raw data, calibration, report, and program files. Each of these screens shows a
"snapshot" of information currently in memory which is relevant to the particular part of the system
that screen represents.
The best way to understand the Data Ally user interface is to think of the display as a "viewer" which
focuses on only one part of the overall program., Using the mouse to click on any of the buttons in
the left screen global column selects an alternate view of a current program.
In addition to the program screen and time base selector buttons, a HELP button is available to show
on-screen help messages, and a RUN/STOP button is used to start or terminate runs in the currentlyobserved time base.
Data Ally organizes information into the following screen display types:
GRAPH Screen:
Shows plots of chromatogram files while system is running or for
editing purposes. Provides all raw data file handling, display,
and comparison functions.
METHOD Screen:
Shows system instructions for running a Method to capture
chromatograms, save and analyze them, and make reports.
Also contains all events instructions for instrument control during
the course of the Method.
INTEGRATION Screen: Shows system instructions for integrating a chromatogram and
identifying its peaks. Also contains calibration information
regarding each defined peak.
CALIBRATION Screen: Shows all current calibration information for a loaded
chromatogram, including a summary of selected data from all
standard injections and a graphic plot of the calibration response
curve.
SEQUENCE Screen:
Shows system instructions for running a batch analysis using an
autosampler, or for reprocessing batches of chromatograms.
Selects order of injections and sets all control parameters for an
autosampler.
UTILITIES Screen:
Accesses configuration settings.
91
Data Ally Chromatography Manager Operators Manual
Each screen type has its own associated blue "SoftButton" drawn in the left edge area of every Data
Ally display. Clicking on a SoftButton at any point in the software will display the selected screen type
in the current time base.
The contents of each of the principal display screens can be modified by using Data Ally's
Configuration functions, for complete customization of each time base in the system.
Data Ally is organized into "full screen" or "maximized" time base windows, each of which contains a
family of "program windows" at all times. Changing time base windows by means of the time base
SoftButtons makes the contents of all of the program windows in the new time base immediately
accessible to the operator by clicking their respective SoftButtons.
Each Data Ally time base window can be "minimized" or "iconized" while it is idle or actively running.
Iconizing a channel window captures all its currently loaded program windows, and effectively
removes the time base from the current display, without interfering in any activities proceeding in that
time base. It is possible to iconize all or several time base windows at once and to "remaximize" only
the time base window you wish to review. Whether any time base windows are iconized or not, as a
Microsoft Windows application, Data Ally permits any other software applications to be running
concurrently.
You cannot "iconize" individual program windows, since each is associated with a time base window
at all times. However, you can "maximize" program windows in the same manner as time base
windows, if you wish to see a full-screen display of the information in any such window.
In program windows where "subwindows" appear on the display, such as the Method Events
Table/Graph screen, you can change the relative sizes and positions of any of the subwindows in any
way you like, within the space defined by the time base window.
6.2.0 Files and File Manipulations
The Data Ally system utilizes and creates DOS-compatible files. The following file types can be
produced, and edited, within the data system:
• Chromatogram Raw Data Files (*.PDF): These files contain the set of detector input signal
versus time information corresponding to a chromatogram run, one chromatogram per file. Each
raw data file also contains header information regarding the date, time, and operator for the file,
the time base and programs with which the file was created, all the current integration data, and,
in some cases, calibration information.
Raw data files can be loaded into any Data Ally time base and processed at any time. Raw data
files can also be as long as necessary. The only limitation to file length and complexity is the
available disk space when a file is originally saved.
• Program Files (Method - *.MET, Integration - *.INT, and Sequence - *.SEQ): These files contain
all the information describing each program type. Program files can be of variable size
depending on the length of the Table portion of each file type.
• Calibration Files (*.CAL): These files contain all the calibration data associated with a specific set
of standards, referencing a particular Integration program file and its Peak Table. Calibration
files can be of variable length depending upon the number of standards processed.
• Report Template Files (*.XLS): These files are produced with Microsoft Excel (in Data Ally v.
1.00), and contain a set of instructions for formatting and creating a single report type. Template
files do not actually include any report or results data.
92
Data Ally Chromatography Manager Operators Manual
• Report Files: These files are produced using Report Templates and contain results and graphics
describing one or more chromatograms. Report files can be reviewed and edited within the data
system at any time, and can be exported to other applications or computers.
Microsoft Excel is used via DDE links to create reports. For Excel, *.XLS files are employed as
report templates. These are loaded into a special subdirectory of the main \Data Ally directory
called \REPORTS. Excel can be used directly to edit these *.XLS report template files (See
Section 13).
All Data Ally file types can be listed, copied, edited, and deleted using standard DOS and Windows
commands. Any type of file can be transferred to another application or another computer. You can
translate raw data files and report files into different file formats using the commands in the Utilities
screen, if this is desired. Chromatogram files produced by Axxiom 700 Series Data Systems can be
easily translated directly into Data Ally formats.
6.3.0 Entering the Data Ally Software
Data Ally can be started from Microsoft Windows. Once the software is initialized, it is loaded into
memory and all configured systems are available for running Methods or processing data.
Ü To start Data Ally from Windows:
Double-click on the Program Manager icon to see the Program Manager window. Select the Data
Ally icon from the Applications menu by double-clicking on that icon. The Data Ally software will load
and you will see the Graph screen.
6.4.0 Using the Default System
When you have logged on and obtained entry into Data Ally, you can immediately start collecting
chromatograms or for writing programs.
6.4.1 Starting a Run
Ü To start collecting signal data from any analog detector(s) connected to the current time base, click
the left mouse button with the pointer on the RUN SoftButton, while viewing any screen. If you have
not loaded a Method or Sequence file, the default file(s) will be employed as set in configuration. You
may wish to click on the METHOD SoftButton to see the DURATION (run time) and RESOLUTION
(sampling rate) settings for the current Method before beginning the run. Click inside either of these
fields in the Method to change the parameter(s) for the run to be started. You may also wish to
change the file name(s) assigned for automatic file saving, or for automatic Integration, by changing
the current Method as desired before RUN is executed.
Since Data Ally always logs chromatogram file data directly to the hard disk as it runs, a valid file
name must be provided in the default Method file or assigned in any modified Methods before a run
start can occur. If the filename(s) currently found in the active detector input entry field(s) in the
Method screen is already assigned to any file in the current directory path at the time the RUN
command is given, an error message will appear advising you to change the filename(s) or path
before a run can be initiated.
If you click on RUN while viewing the Sequence screen, the time base will attempt to run the default
Sequence, if any exists.
Ü To see the incoming signal data traces, click on the GRAPH SoftButton, if you are not already
viewing the Graph screen. The trace(s) for each live detector will be visible on the display, scaled as
predefined in the default instructions. Alternatively, you can click on the Graph button at the bottom
right corner of the Sequence screen to replace the top-level portion of the Sequence screen with a
half-screen Graph window while the Sequence Table remains visible at bottom.
93
Data Ally Chromatography Manager Operators Manual
Ü To reset the Display scaling in the Graph, click on Display in the Graph Command Menu bar, and
then on Scaling in the submenu. Turn AutoScaling on or off by checking the appropriate check
boxes in the scaling dialog box, or click inside the MIN or MAX entry fields for any live detector(s) with
AutoScaling off and type in the range value you wish to display. Click on OK to change the display.
Ü To view the Method which is being run (the default Method, unless you have modified it or loaded a
new Method), click on the METHOD SoftButton. The top level Method screen will appear. If you
wish to determine whether any instrument control functions are in process, click on the EVENTS
button to view the Method Events Table display.
Ü To stop the run at any time prior to the programmed DURATION of the current Method, click on the
STOP SoftButton. The run will end and the chromatogram(s) will be integrated according to the
instructions in the Method. The trace(s) will remain in the Graph screen, already having been saved
to disk.
If you allow the current/default Method to run until its DURATION time is completed, the data file(s)
acquired will automatically be saved using the filename(s) in the Method screen, and automatic
integration will occur for all specified input files using the Integration program(s) referenced in the
Method.
Ü To save the Method you have run, click on the METHOD SoftButton to view the Method screen
containing the Method in this time base, and select Files/Save As from the Command Menu bar.
Enter a new name for your Method and click on OK in the Save dialog box to save the Method for
later use.
6.4.2 Analyzing Run Data Manually
If the new data file(s) are not integrated when the Method ends, or if the automatic integration is not
completely satisfactory, you can integrate each file in turn manually.
Ü To integrate manually, click the GRAPH SoftButton and using the Graph/Edit/Integrate command.
The integration algorithm parameters in the current Integration program are employed, and can be
varied as desired.
You can modify the algorithm parameters within the Edit/Integration dialog box as you proceed in
order to obtain the desired peak identification and resolution. Retention times will be computed either
as absolutes or relative to the first defined peak, depending upon the setting in the current top-level
Integration screen.
Ü To manually mark peaks or edit chromatogram baselines, you can use the Graph/Edit/Define
Baseline commands, reintegrating after each manual modification.
When you have achieved suitable integration for the chromatogram(s), you can manually produce
result reports.
Ü To make a manual report, click on the Graph/Edit/Analyze command. In the Analyze dialog box,
select the type of report you want (e.g. Area PerCent) from the Report Library list box, and click on
OK to produce the report. Quantitative result reports can be obtained if a Calibration file for the
current chromatogram already exists.
6.4.3 Completing the Integration Peak Table
When your chromatogram is properly integrated and edited, and all desired retention times for all
peaks are shown in the Graph window, you can easily complete an Integration program suitable for
that chromatogram and save it for later use. An Integration Peak Table will be needed to create a
Calibration file appropriate for your chromatograms.
94
Data Ally Chromatography Manager Operators Manual
Ü To create a suitable integration program, click on the INTEGRATE SoftButton to view the top-level
Integration screen - it should now contain the final set of algorithm parameters you have just utilized.
Click on the PEAK TABLE button to view the split-screen Peak Table display. The chromatogram will
appear in the Graph window at the top of the screen.
Ü To fill the peak retention times into the peak table, click on the RT column header button in the
Table, and then on the FILL button at bottom center beneath the table. The AutoFill dialog box will
appear. Click on the "Fill From Graph" radio button in the top portion of the dialog, and click on the
"Start of Table" and "End of Table" radio buttons in its center section to select filling of the entire peak
list. Click on OK - the marked retention times for all the peaks in your chromatogram will be
immediately filled into the table, one line or row per peak.
Now, click the pointer inside the top row of the WINDOW column (corresponding to the first peak).
Enter a retention window value for the first peak position (a value of 0.1 or 0.2 min should be
adequate if your peaks are well resolved). To use the same window value for all other peaks, click
on the WINDOW column header button, and then on the "Duplicate" radio button in the AutoFill
dialog. Click on OK to copy the first row window value into all other rows in the column. This is the
fastest way to set up a new Peak Table; you can always return and set individual peak windows, or
other information, later on. You may want to proceed and enter peak names for the identified peaks
you will want to include in reports.
If you want to calibrate and quantitate certain peaks in this chromatogram, you will need to enter the
type of calibration you wish to use in the CAL column of the new Peak Table. If all peaks are to be
calibrated with External Standards, simply click the pointer inside the first row in the CAL column and
type "ES". Then click on the FILL button, click on Duplicate, and click OK in the AutoFill dialog to fill
the ES entry into all the peak rows.
If you want to run one or more internal standards for quantitation of your chromatogram, you must
first identify the internal standard peak(s). To do this, find the first internal standard peak in the table
and click the pointer inside its row in the IS column. Type the number "1" in that cell to designate that
peak as Internal Standard No. 1. Assign any other internal standard peaks in the same manner by
giving those peaks unique numbers (up to 5) in the IS column. Then, make entries of "ISx" for each
non-internal standard peak to be computed using any internal standard peak x, either by directly
typing those entries into the CAL column (instead of the ES entry for Ext. Standard). Be sure to
include the correct Internal Standard Peak reference number, 1 through 5, to link each unknown peak
to its corresponding internal standard peak.
You have now defined a basic Peak Table. If you like, you can now edit the table to add peak
referencing, comments, and other instructions, depending upon what table options have been
configured. You can also click on the INTEG button below the table to return to the top-level
Integration screen, to define reports and other options.
Ü To save the Integration program, when both the top-level Integration display and its associated
Peak Table are completed, click on the Files/Save As command to save the new Integration program
for later use.
6.4.4 Setting Up a Calibration File
Now that you have defined a valid Integration file with Peak Table, you are ready to construct a
Calibration file for quantitation.
Ü To create a new Calibration file, click on the Calibrate SoftButton to see the Calibration screen
display. Click on Files on its command bar menu to see the Files submenu, and click on Setup. The
Setup dialog box will appear.
95
Data Ally Chromatography Manager Operators Manual
Click on the arrow selector button to the right of the Reference Integration file entry field to see a
listing of current Integration files in memory. The newly-saved Integration program with your new
peak table should be shown in the listing. Click on the name of that program to insert it into the field.
Now select the number of standard levels you will use to calibrate by clicking on the selector arrow for
the No. of Levels entry field, and choosing the desired number - you must have at least one level
defined in any Calibration file.
When completed, click on OK. The Calibration Reference table in the window at upper right will be
immediately reconstructed to include the peak table from the selected Integration file, and the
number of Level columns you have specified. Depending upon the configuration, other columns (FIT,
BASIS, etc.) may also be found in this table.
For each peak to be calibrated in the Reference Table, you must now specify the concentration value
for the standard(s) to be injected and used to build a Calibration Table. The current Calibration Table
at the bottom of the screen will be empty, since no standards have been run yet.
Click anywhere inside the upper right Reference Table to activate it, and use the scroll bars to move
to the LEVx columns to begin entering the standard concentration values for all peaks. You may
wish to maximize this table using the Maximize command for a better view while editing.
Move the Edit highlight into each cell in the LEVx column(s) corresponding to each peak and type in
the assigned standard concentration values. If the values are the same for a number of different
peaks in a single LEV column, you can use the FILL function to duplicate the value of a single row
into any number of other rows in that column. You can also use the CUT, COPY, and PASTE
command buttons beneath the table to move and copy any set of information in the Reference Table
for one peak to the row for another peak - with these functions, only the editable columns will be
moved or copied, not the fixed columns at left (RT, PeakName, Cal, and IS).
Ü To save the new Calibration file, when you have specified one or more LEV values for each row in
the Reference Table, use the Files/SaveAs command to assign it a new name. This Calibration is
now available for use in performing manual or automated calibrations and for generating quantitative
results.
Ü To perform a manual calibration using a standard chromatogram, load the standard chromatogram
file into the foreground (top left) register of the Graph window, and integrate it as desired, if this has
not already been done. Once all the peaks are marked correctly and desired baselines are drawn,
click on the Edit command in the Graph command bar menu, and click on Calibrate in the submenu
to see the Calibrate dialog. Depending upon the type of standardization desired, you may need to
enter internal standard values or other correction factors in the appropriate fields in this dialog before
proceeding. When such entries are finished, select the New mode to begin building a new calibration
table, and enter the LEV number for the current standard chromatogram. You can begin with any
level, and enter calibrations in any level order.
Click on OK to enter the new calibration data into the calibration table of your new Calibration file.
You can verify that the calibration has been accepted by clicking on the Calibrate SoftButton to see
the Calibration screen again. The Calibration Table at bottom, which previously had no lines, will now
have a single line corresponding to the chromatogram you have just processed manually. You can
move the highlight in the Reference Table at upper right up and down to select any desired peak and
see that individual peak's calibration table and corresponding Calibration Plot.
Ü To perform an automated calibration using a Method, you must first set up the Method screen to
run and process a standard. Click the Method SoftButton to see the Method screen, and click inside
the filename entry field corresponding to the first active detector input you will use. Enter a valid
filename for the standard chromatogram file to be saved from this input. Now, click inside the
Integration filename field to the right of the chromatogram filename field, and enter the name of the
Integration file which contains the peak table corresponding to your chromatogram. Click on the CAL
96
Data Ally Chromatography Manager Operators Manual
selector arrow and select the N(ew) option to specify a new calibration table. Click inside the
Calibration filename field to the right of the CAL field and enter the name of the new Calibration file to
which the new data will be added. Finally, click on the LEV selector arrow at far right and choose
which standard level will be represented by this chromatogram.
If more than one input is to be used, you could repeat the same entry process for the fields
corresponding to the second input, to specify both Integration and Calibration files and the mode and
level of the calibration to be done. These could be the same file(s) as for the first input or an entirely
different set of files.
To validate all your entries, click in any other field on the Method screen. When you are ready to
inject or begin the run, click on RUN to start. The run will proceed until the Duration time is reached.
At that time, the file logging to disk would be completed, integration and peak identification would
occur according to the instructions in the Integration program utilized, and the Calibration table in the
referenced Calibration file would be updated using the new response values for each peak found.
You can further automate this process for a large number of individual standard samples or injections
by placing one or more Methods programmed in this manner into a Sequence.
Once a Calibration file has been updated with at least one standard chromatogram run, and a
Calibration Table exists in that file for each individual peak of interest, unknown samples can be run
or processed to determine concentration results. This can be done manually on a stepwise basis
using the Analyze command as in Section 6.4.1.2 above, or automatically for single injections using a
Method.
Ü To analyze an unknown sample using a Method, you can use the same Method used to run
standards to acquire and analyze unknown samples automatically. Recall the Method you used for
calibrations into the Method screen, and, if necessary, assign a new filename(s) for the active
detector inputs. You should leave the Integration and Calibration filename references as they are,
but you must change the CAL field entry from a calibration mode code value (New, Replace, or
Average) to a "blank" which specifies that the chromatogram(s) to be acquired will not be used as
standards.
Before running the Method, click on the Integrate SoftButton to see the Integration screen, and recall
the Integration file you are using in your Method if it is not already loaded. Click on the Reports
button at the bottom of the top-level screen to see the Reports Selector dialog, and then choose
which report format(s) you want to use for reporting the unknown results automatically. Note that you
do not need to make any reports at this time, if you do not wish to, since the chromatogram can be
reprocessed at any later time for reporting after it has been run and saved. When you have specified
the reports you want, click OK, and then resave the modified Integration file by clicking Files on the
command menu bar and then Save.
You can now start the new Method by clicking the RUN SoftButton while viewing any screen except
the Sequence screen. When the Method finishes, the unknown chromatogram will be logged to disk,
integrated, and peak results computed from the current calibration file. Reports will be made and
either printed, shown, or saved as you have directed in the Integration program.
6.4.5 Programming a Simple Sequence
Ü To use your Method to automate processing of a batch of sample runs using an autosampler, you
can create a new Sequence using the Method along with your new Integration program.
First, click on the METHOD SoftButton to view the top-level Method screen. Check to see if the
name of the new Integration file you have saved appears in the INTEGRATION name reference
field(s) for the active detector(s). If not, click on the arrow adjacent to this field and select the
97
Data Ally Chromatography Manager Operators Manual
Integration filename from the listing by clicking on it. You can use the same Integration for more than
one detector input, or use different Integration files for each input.
Ü To program your Method for starting via a contact closure from the autosampler, you must edit the
Events Table for the Method to include an initial "wait" command using an input flag on the
Communications Processor for this time base. Click on the EVENTS button to see the Events Table.
Click inside the TIME column in the first line of the Events Table, and type in 0. Then move the edit
highlight by clicking inside the FIN column on the first line. Click on the arrow button which appears
at the right of the cell, which will list all the configured input flags for this time base by name. Select
the REMOTE START flag by clicking on it, which will automatically enter the code number for this flag
into the first line.
Click on the METH button below the table to return to the top-level Method screen. Now, resave the
Method with the correct Integration file reference(s) by clicking on the Files/Save command.
Ü To create an appropriate Sequence program for batch processing, click on the SEQUENCE
SoftButton to see the Sequence screen. To use this Sequence to acquire new chromatograms, be
sure the Acquire Mode button is selected at top left.
To automatically fill in a series of twenty lines for 20 samples, click on the METH column cell on the
top line of the table, and type in the Method name you wish to use. Then click the FILL button to see
the AutoFill dialog, click on the "To End of Table" and "Increment" radio buttons. The "Step Value"
field should have a "1" entry - click inside it and change the value to "1" if it does not. Click inside the
"No. of Steps" field and enter "20". Click on OK, and a series of blank rows will automatically be
added; the ENABLE/line number row at left will show line numbers between 1 and 20.
Once the Method is specified for each sample line in the table, sufficient information is available to
run the Sequence. You can make any further edits of the table as desired, using the INSERT, CUT,
COPY, and PASTE commands to work within the spreadsheet.
You have now completed a basic Sequence table for your Method.
Ü To start the Sequence, click on the RUN SoftButton while viewing the Sequence screen, with your
autosampler loaded with the samples to be run. Before starting, you should verify that the Method
DURATION time you are using is sufficiently short so that the next Method will be ready to start
before each new autosampler injection.
After clicking RUN, start the autosampler and all the runs will be processed. All the chromatogram
raw data files will be saved, chromatograms will be integrated, and any reports you have specified in
your Integration program will be printed, displayed, or saved. You can abort the Sequence at any
time by clicking on the STOP SoftButton.
6.5.0 Exiting the Data Ally System
Because Data Ally runs in Windows, you do not need to "exit" the system to run any other
application(s). To start or select another application, click on the RESTORE button (double headed
vertical arrow) at the top right of the current time base window, and then use the mouse pointer to
"resize" the time base window so that you can see the Program Manager icon or any other running
application icons beneath it. Double click on the Program Manager icon or any other application icon
to view a new window and select a new function or application. Data Ally will remain in operation in
the background while this is occurring. You can return to Data Ally at any time by using the SWITCH
TO command in the Control Application Menu of any other application, or by resizing or moving the
other application window(s) to see any Data Ally window, clicking inside the Data Ally window to make
it active, and then resizing it as desired.
When you exit Data Ally, you can choose to either stop operation of the Data Ally system while
remaining in Windows, without affecting any other applications which may be running in Windows, or
98
Data Ally Chromatography Manager Operators Manual
you can exit Windows to DOS. If you exit to DOS, you will end the current Windows session and all
other applications which may be running in Windows will be stopped as well.
Ü To exit Data Ally, press the UTIL SoftButton on any Data Ally screen to switch to the Utilities
screen, and click on Quit in the Command Menu Bar. When the Quit submenu appears, click on
Exit to Application. When you exit Data Ally, any runs currently in progress in Data Ally will be
terminated automatically.
99
Data Ally Chromatography Manager Operators Manual
7.0 Chromatogram Display, Review, and Editing: Graph Screen
The heart of the Data Ally software is the GRAPH screen, which shows a visual image of what is
happening in the currently viewed channel. If live data acquisition is in progress, the Graph will show
trace(s) of the running chromatograms which are updated in real time. If no live run is being
captured, but the Graph is being used to reprocess, review, or edit chromatogram files, traces of
those files and any associated baseline codes or annotations will be displayed. As many different
windows as desired can be shown in a single Graph screen display, in order to observe different
portions of chromatograms at the same time, or to separate individual traces for easier viewing and
analysis.
Ü To see the GRAPH screen for any channel, switch to that channel (click on its SoftButton) and click
the GRAPH SoftButton with the left mouse button, or press the F2 key. The full screen Graph
window (Figure 7.1) will appear.
Figure 7.1 Graph Screen
Fully active and functional Graph screens are displayed as part of Data Ally's Method Events Table,
Integration Peak Table, and Sequence Table screens, for convenience during graphical editing steps
or while live runs are executing. All Graph screens available in a given channel utilize the same
configurable settings, menus, and options, and are essentially identical. However, Graph screens
from different channels may have unique features and options, depending upon how each channel
has been configured.
The main GRAPH screen window, like all Graph windows, has a Command Menu Bar along its top
line. Like all the other program screens, its Command Menu is unique to the Graph screen. It is
used to manipulate and edit chromatogram data files, to change the display and view parameters
defining the current image, to perform mathematical operations on chromatograms, and to print the
contents of the Graph portion of the screen.
The visible contents of the GRAPH screen depend upon the current Configuration file. Elements of
the display and of many of its associated command menus can easily be modified or "hidden"
completely to customize the nature of the GRAPH display for the applications you are performing.
See Section 5 for a complete discussion of configuring the GRAPH screen - if you wish to make any
changes to the current appearance or features of this screen on a permanent basis, you may want to
re-configure this time base to effect such "permanent" changes so that you will not need to reset any
GRAPH screen parameters repeatedly.
100
Data Ally Chromatography Manager Operators Manual
The examples shown in the following sections illustrate a configured GRAPH screen in which certain
elements have been modified.
7.1.0 GRAPH Screen Commands
There are three types of commands which can be executed directly from the Graph Screen:
Windows application control commands, the Graph Command Menu Bar commands, and the
"screen based" commands which change the graph display using the mouse pointer.
7.1.1 Application and Program Control Menu Commands
These commands are accessed by clicking the left mouse button on the "hyphen bar" button at the
top left of either the channel (full screen) window or the Graph program window nested inside the
channel window (Figure 7.2). The Maximize, Minimize, and Restore buttons at the top right of either
window are also available for resizing and/or restoring that window to its previous state.
Figure 7.2 Graph Application Control Menu
7.1.2 Screen-Based Commands
The Graph screen is always first displayed as a "full screen" window. If Display/Attributes are set in
the default Method to show graph axes, a set of axes will be drawn and labeled with the graph units
specified in Configuration, and with the display scaling set by Display/Scaling in the default Method.
After chromatogram files are loaded into the Graph screen using the Files commands, the trace for
each loaded file will appear in the graph window, and the filename of each chromatogram will be
shown inside a "button" in an area below the horizontal graph axis. The display scaling may change
after loading a chromatogram if the "auto scaling" option is active in Display/Scaling.
There are four "screen-based" command types that can be directly accessed from the Graph using
the mouse pointer.
• Panning: The currently-displayed "view" of a loaded chromatogram or chromatograms can
be "panned" horizontally or vertically.
Ü To pan in any direction, move the pointer cursor with the mouse to the inner left, right, top,
or bottom edge of the Graph window until a heavy horizontal or vertical "arrow" appears
(Figure 7.3). Then press and hold the left mouse button, and the chromatogram(s) will begin
to "move" on the display in the direction of the arrow. Holding the button down momentarily
will result in a small shift in position of the chromatogram(s). If the button is held down
continuously, higher-speed panning will begin and the contents of the display window will be
moved and redrawn continuously.
Panning is very useful for moving about chromatograms with a constant display
magnification, in the manner of reviewing a chart recorder plot.
101
Data Ally Chromatography Manager Operators Manual
Figure 7.3 Panning Graph Display At Right Edge
• Zooming: The current display window can be "zoomed" by using the mouse pointer to select
an area of the screen which is to be expanded to fill the full display window. Zooming differs
from panning in that it effectively changes the magnification of the display.
Ü To zoom for expanding the current view, move the mouse pointer cursor to any position
which defines any corner of the desired new full screen view, press the left mouse button,
and move the mouse pointer while holding the left button down (Figure 7.4). A dotted
rectangle will be drawn as the pointer moves, which defines the area of the display to be
zoomed to fill the full screen. When the desired area is "rubber-banded" inside the dotted
line box, release the mouse button, and the display will change to show the "zoomed" view.
Figure 7.4 "Rubber-Band" Display Zooming
The zoom feature can be used repeatedly to expand any area of the screen as much as
desired. Data Ally tracks each zoom command and allows you to instantly "unzoom" back to
the previous view. To unzoom, press and release the right mouse button. The previous
zoomed view will immediately be restored in the active window.
An alternative mode of zooming, "Zoom Center", can be initiated using View/Zoom Center
from the command menu bar (Section 7.5.2 below). If Zoom Center is enabled, a new mode
is available in which double-clicking the left mouse button anywhere in the Graph window will
cause the display to "zoom" by fixed multiplier factors in both the time and signal axes,
centered around the current cursor position at the time of the click. The magnification factors
102
Data Ally Chromatography Manager Operators Manual
for center zoom can be reset at any time. Zoom Center is most convenient for repeated
magnification of the display around a fixed point. Like the normal rubber-band zoom (which
can also be used while Zoom Center is enabled, you can reverse repeated zoom center
actions by clicking the right mouse button.
• Stack Position: Data Ally allows up to sixteen chromatogram files to be loaded into any
Graph window. As each new file is loaded, it is placed in a "stack" of current chromatogram
files (Figure 7.5). The first file in the stack is termed the "foreground" file. Only the
foreground file position in the stack can be used for baseline editing, or for display of baseline
or other integration codes and annotations, to prevent confusion. Any loaded file can be
selected for editing or displaying other attributes such as baseline codes or peak names, but
the desired file must be moved to the "foreground" position in the stack for this to be
possible.
Figure 7.5 Chromatograms Loaded into Register Stack
The first chromatogram register(s) in the stack will usually have names associated with
detectors whose signals are physically connected to those registers via the Communications
Processor. Detector names are assigned in configuration for each channel, and assist you in
identifying each trace during live data acquisition. Up to four of the registers can be assigned
input names, as well as a fifth register which can be designated as a "Reference" register for
automatic loading of a reference chromatogram during live runs. Note that if any detector
input register is assigned a display units scheme in Configuration different from the normal
voltage units, whenever that input register's contents are shown as the "foreground" file, the
signal (y) axis will become labeled with the units appropriate for that input. It is possible to
place additional chromatograms into stack registers for concomitant display during live
detector signal input, if desired.
Whenever a file is loaded manually, or during live file acquisition in a Method, the filename is
listed as an "icon" with a color underline along the bottom of the Graph window. The
underline color is used to show the trace corresponding to that file. The first "filename icon"
on the left side beneath the horizontal Graph axis always denotes the "foreground" file.
Other filename icons are listed horizontally across the screen bottom after the foreground file
button in up to two rows. Each filename "icon" can be used to directly manipulate that file in
the stack.
Ü To move a non-foreground loaded chromatogram file to the foreground position, simply
point to the desired filename icon with the mouse pointer, hold down the left mouse button,
and "drag" that filename icon into the foreground button position. When the new filename is
in that position, release the button. The new file will now become the foreground file and is
103
Data Ally Chromatography Manager Operators Manual
displayed accordingly. All the other loaded files will be shifted in stack position respectively.
The same technique can be used to directly move any loaded chromatogram file to any stack
position, for example, before performing mathematical operations. The Display/Swap
command can also be used to shift file positions in the stack.
• Offset: The filename icons representing loaded chromatograms can also be used to offset
any desired files from their normal positions in the Graph window directly.
Ü To change the offset of any file directly from the Graph screen, click and hold down the
right mouse button with the pointer on the filename icon button corresponding to that file. A
special "offset" cursor will appear in the graph window (vertical up/down arrows). The pointer
cursor will change to a two-pointed arrow symbol. When the symbol appears, hold down the
left mouse button and "drag" the chromatogram to its desired new position on the display, up
or down. At the intended new position, release the mouse button and the chromatogram will
be anchored in its new position. You can use the Status Box (Section 7.6.4) as a guide to
determine how much offset is being applied graphically to any trace.
The Display/Offset command can also be used to offset chromatogram files. Any file offsets
created by "dragging" as above will automatically appear in the Display/Offset dialog box.
• Signal Axis: It is possible to configure Data Ally to show plots of Method program information
such as HPLC pump gradients. In normal Autoscaling graph mode, the relative graphical
scaling of each active signal trace or program profile is determined automatically so that the
entire range of each plot is fit on the same graph as all other plots. As a default, the y-axis or
signal axis for each graph window is labeled with voltage units regardless of whether or not
signals or traces measured in other types of units are present. If pumps are configured in a
time base, you can display pump gradient traces using the Display/Pump Traces command
(see Section 7.6.3 below).
• Monitor Multiple Time Bases: If the Data Ally system is configured with two time bases, you
can use the MONITOR button in the lower right corner of the GRAPH window to split the
main GRAPH window into two panes, each of which shows one of the two active time bases.
This feature allows simultaneous monitoring of active detector inputs or other information
from more than one time base - see Section 7.6.5 below for more information).
If Method parameters such as pump gradient profiles are present in the current Method's Events
Table, a set of small "identifier" icons for each such parameter will appear along the left edge of the
graph window. Each of these icons will consist of a label describing its meaning (e.g. "%A") and a
color code showing the color and style of the plot trace used to show that parameter. The
Display/Traces commands (Section 7.7.3 below) determine whether or not each parameter's trace is
actually plotted and shown in the current Graph Window.
7.1.3 Graph Command Menu Bar
The Graph screen Menu Bar commands (Files, Edit, Math, Display, View, and Print) control most of
Data Ally's chromatogram file display, manipulation, and editing functions (Figure 7.6). Each has its
own corresponding pulldown menu, activated by clicking the left mouse button with the pointer on the
desired command.
Figure 7.6 Graph Screen Command Menu Bar
104
Data Ally Chromatography Manager Operators Manual
The DISPLAY and VIEW Graph commands are accessible both while the channel is running and
while it is idle; other commands which are not effective in either mode are "grayed out". The
commands in the FILES, EDIT, and MATH submenus are generally not available for use while a
Method is being executed.
7.2.0 Working With Chromatogram Files
Graph (chromatogram) files are DOS-compatible files containing the raw data signal versus time data
defining one or more chromatograms. Such files normally also include other information describing
the current channel, programs in use, date, time, and operator values, all current integration data,
and relevant calibration data.
The Command Menu bar Files submenu includes all the commands needed to retrieve and save
chromatogram files manually. Automatic file saving can be programmed as part of any Method or
Sequence.
7.2.1 Files Commands
Clicking the left mouse button with the pointer on Files shows the Files submenu (Figure 7.7). This
submenu controls manual loading, saving, deleting, and clearing of chromatogram files to and from
the Graph window, and supports the handling of "group" files.
Figure 7.7 Graph Files Submenu
7.2.1.1 Clearing Chromatograms
The Clear command clears (removes) a single chromatogram or all current chromatograms from the
displayed stack.
Ü To clear a chromatogram file, click on Files/Clear with the left mouse button to display the
Clear Files dialog box (Figure 7.8). A listing of files currently loaded into defined stack
register positions will be shown. Use the left mouse button to check or uncheck the file(s) to
be cleared, or check the "All" box to clear all displayed files. Once the desired files have
been checked, click on "OK" to execute the clear and remove the files.
105
Data Ally Chromatography Manager Operators Manual
Figure 7.8 Files/Clear Dialog
If files loaded into registers which are not listed in the dialog box are to be cleared, you can
use the filename icons or the Display/Swap command to shift the positions of those files in
the stack so that they can be accessed using the Clear dialog box.
When clearing any chromatogram file(s) which have been altered in the Graph screen, a
message will appear prompting you to save all such files before they are cleared. This is
intended to prevent any unintentional loss of file editing information.
7.2.1.2 Deleting Chromatograms
The Data Ally software does not support direct raw data file deletions from the GRAPH
screen menus. To delete a file, use ALT + ESC to access Windows Program Manager,
select File Manager, and use the Delete command to delete any desired files.
7.2.1.3 Loading Chromatograms
The Load command recalls a chromatogram file from disk memory into the active Graph window. If
several files are to be loaded into the same window, the Load command must be used for each file,
or the files can be grouped using the Save Group command (below) for later recall of all the files
together in one step.
Ü To load a chromatogram file, click the left mouse button while pointing to the Files/Load
command. A menu of files available in the current directory will be shown, with appropriate
descriptions if previously entered (Figure 7.9). Select the desired drive and path where the
file to be loaded is saved, and then select a file from the directory listing by clicking on its
filename. Click on the "radio button" corresponding to the stack register into which the file
will be loaded (the next "open" register will automatically be selected). Once the desired file
is selected, click on "OK" to recall the file and load it into the current active Graph window.
106
Data Ally Chromatography Manager Operators Manual
Figure 7.9 Files/Load Dialog
When you load a chromatogram which has been previously saved after an integration, the last set of
baseline marker codes, which is always saved as part of the raw data file, will also be recalled and
displayed along with baseline corresponding to those codes. You can use the Graph
Display/Attributes settings (Section 7.6.2) to "turn off" baseline and/or code drawing if you prefer.
7.2.1.4 Saving Chromatograms
The Save As command causes a chromatogram currently in the active Graph window to be saved
using the existing filename or a new filename. Each file has a unique name and an optional
description. If no filename is available, Save As will prompt you to enter a new one. The SaveAll
command resaves all loaded chromatograms using their existing names.
Ü To save a chromatogram file, click the left mouse button on the Files/Save As command.
A dialog box will appear showing a listing of files in the current directory path and any
previous name for the currently selected file (Figure 7.10). Click in the FILENAME field and
type in the desired filename. If the filename currently shown is suitable, click on OK to save
the current file in the foreground register using that name. A description can also be entered
when any file is saved or resaved by clicking in the DESCRIPTION field and typing in the
description as needed. Descriptions will appear on the Files/Load dialog box as well and are
useful for identifying the source and nature of your saved files.
107
Data Ally Chromatography Manager Operators Manual
Figure 7.10 Files/Save As Dialog
The Save All command differs from Save As in that all files in the current Graph window are saved
using their existing filenames. If a Save As or Save All command will overwrite an existing
chromatogram file, a trap dialog will appear (Figure 7.11).
Figure 7.11 File Overwrite Trap Dialog
Whenever a chromatogram file is saved, all current baseline marker codes and zone codes will also
be saved as part of the raw data file.
7.3.0 Editing Graph Files
The Graph screen Command Menu provides many tools which are useful for changing the contents
of any chromatogram file, or for generating results from any file.
7.3.1 Editing Commands
The Edit command submenu (Figure 7.12) is used to manually edit and analyze the chromatogram
file in the current foreground position in the Graph register stack. It can also be used to "cut" the
current Graph image directly into the Windows Clipboard for "pasting" into other documents or
applications, or to create a new graphic file using the current image.
108
Data Ally Chromatography Manager Operators Manual
Figure 7.12 Graph Edit Command Submenu
Ü To use the Edit commands, point to "Edit" on the Command Menu Bar and click the left mouse
button. The Edit submenu will appear.
• Analyze: Analyze creates a report for the foreground chromatogram using the report type
specified in the current Method file. This report can be displayed on screen, printed, or
saved to disk memory as a retrievable report file. The chromatogram must already be
integrated in order to be analyzed via this command.
Click the left mouse button with the cursor on Analyze in the Edit submenu to show the
Analyze dialog box. This box gives the filename of the foreground chromatogram, and
summarizes all options available for processing this file.
• Calibrate: Calibrate manually updates the current Calibration file (which can be observed by
clicking on the left column CALIBRATE button) using the peak information from the current
foreground chromatogram. The chromatogram must already be integrated to perform
calibration with this command.
• Cut: Cut captures the current active Graph window image, either placing it in the Windows
Clipboard or saving it as a new graphic file with a specified format. The image can then be
transferred or imported into other documents or applications, which may be running
concurrently in Windows.
• Define Baseline: The Define Baseline command accesses all Data Ally manual baseline
editing functions. You can draw or redraw baseline as desired, place or move individual
baseline peak marker codes, or clear codes using the Define Baseline submenus.
To begin baseline editing, click the left mouse button while pointing at Define Baseline in the
Edit submenu. The Define Baseline Submenu will appear.
• Define Zone Codes: Zone Codes is used to place integration Zone Code markers at any
desired position in the current foreground chromatogram, and, if desired, to transfer the
codes into the current Method file's Events Table.
• Integrate: Integrate causes immediate integration of the chromatogram file in the foreground
register.
• Reintegrate: Reintegrate causes a recalculation of the results using the baseline as marked.
This function is mainly used to update calculations from prior edit sessions,
7.3.2 Integrating Chromatograms Manually
Chromatograms loaded in the active Graph screen window can be integrated manually at any time,
or re-integrated if an automatic integration was performed at the time a chromatogram was first
109
Data Ally Chromatography Manager Operators Manual
acquired. Only one chromatogram in the Graph window, the one loaded into the foreground register
whose filename icon appears at the top left position under the graph time axis, can be manually
integrated at one time. This restriction is intended to prevent confusion in visually understanding the
integration results on screen. Any desired chromatogram in any register can be swapped into the
foreground position for subsequent integration.
Figure 7.13 Integration Dialog
Ü To integrate the foreground chromatogram, click on Edit in the Graph Command Menu bar, and
click the left mouse button on Integrate in the Edit submenu. The Integrate dialog will appear (Figure
7.13), containing several fields with the integration algorithm parameters from the currently-loaded
Integration screen (Section 9.1.2). To perform an integration of the entire chromatogram using these
parameter values, click OK - the hourglass will appear as the integration begins. When completed,
baseline, peak codes, and other information selected by the Display/Attributes setting (Section 7.7.2)
will be shown. NOTE: You may click on “Automatic” to have the software try to determine the
appropriate integration parameters. If you are not satisfied with the results, you may then adjust
them as needed.
When you execute an integration, the system will pause for a moment while completing the
integration process, and will then redraw the screen with baselines, peak labels, retention times, and
other information (e.g. peak names) derived from the current Integration screen, if appropriate.
Chromatograms collected with high sampling rates or with many peaks will require a longer
integration time than those with low sampling rates or few peaks.
If zone codes have been placed in the chromatogram at the time it was acquired or by previous
editing, they will be used by the Data Ally integrator during manual integration unless they are cleared
or edited. You can, of course, place additional zone codes or modify the current codes at any time by
using the Define Zone Codes command in the Edit submenu.
With every integration, all previous baseline codes associated with the foreground chromatogram are
replaced with the new codes from the new integration. However, those codes are not resaved with
the chromatogram file until the chromatogram is cleared from the current Graph window or
overwritten with a new file.
To change the integration algorithm parameters, click inside any desired parameter entry field in the
Integration dialog and type in the new desired value and units (if you wish to change current units).
Double-clicking inside any field will allow you to directly type a new entry to replace the old entry.
Then click OK again with the left mouse button to integrate using the modified parameters. Each
time you modify the algorithm parameters, any changes are automatically duplicated in the
corresponding fields in the currently-loaded Integration program screen (Section 9.1.2).
110
Data Ally Chromatography Manager Operators Manual
View Only: Checking the View Only box in the Integration dialog will cause integration of only the
current view of the foreground chromatogram in the active graph window, instead of the entire
chromatogram. This is useful when you wish to check the effects of the current algorithm on only a
small region or set of peaks rather than all peaks, since it reduces the time required to complete
integration.
7.3.3 Manual Chromatogram Baseline Editing
The chromatogram loaded into the foreground register of the active Graph screen window can be
edited at any time to change baseline markers. New peak labels can be placed graphically, existing
peak labels from the original integration can be moved, changed, or cleared, and the chromatogram
reintegrated to compute new peak areas at any time. Only one chromatogram in the Graph window,
the file in the foreground register whose filename icon appears in the top left position beneath the
graph axes, can be edited at one time.
7.3.3.1 Entering Baseline Edit Mode
Ü To begin editing baseline, with one or more chromatograms visible in the active Graph window,
click on Edit in the Command Menu bar to display the edit submenu. Click on Define Baseline to
show the Define Baseline submenu (Figure 7.14) from which all the manual editing commands are
selected.
Figure 7.14 Baseline Editing Submenu Commands
If the foreground chromatogram has already been integrated, it will already be marked with
integration peak code labels. The Display/Attributes command settings determine whether or not
these labels and corresponding baseline tics will be displayed. You can use Display/Attributes to
select the information you wish to see concerning previous integration. Generally, you will want to
have all existing baseline labels visible when manually reviewing and editing the integration.
7.3.3.2 Drawing New Baselines
Ü To draw baselines under unintegrated peaks, click on Draw Baseline in the Define Baseline
submenu, and then click on Draw Baseline in the poppa menu (Figure 7.15) which appears. A small
"B" will now appear on the Graph window above the cursor position with a vertical line beneath it. You
can move the cursor so that the vertical line coincides with the beginning of a new peak, and then
click the left mouse button to anchor the "B" or Begin Peak code at that position. Now, as you move
the cursor to the right, a new baseline segment will "rubber band" under the chromatogram which
ends with an "E" and another vertical line. To mark the end point of the peak, move the "E" to
coincide with the exact end position and click the left button again to anchor it. The new codes and
joining baseline segment will be anchored to the chromatogram, and the newly defined peak will be
automatically reintegrated, its new retention time, number, and name (if identified in the current Peak
Table) appearing on the display. You can continue to move anywhere in the chromatogram and mark
additional peaks in the same manner.
111
Data Ally Chromatography Manager Operators Manual
Figure 7.15 Baseline Edit Pop-up Selector
If you use Draw Baseline to mark a rider peak on the leading or trailing edge of an already-marked
larger peak, the system will place a "BS" Begin Skim and "ES" End Skim set of codes instead of the
usual "B" and "E". Both forward and backward skims can be accommodated, drawing in either
direction.
Note that while drawing peaks or skims, the system automatically prevents you from placing baseline
marks which would yield "impossible" peak areas, by "forcing" a peak or skim begin or end location
forward or backward from the actual position you placed it to the first "acceptable" position.
This feature avoids errors resulting from poor code placement techniques or inadequate display
resolution.
You can move outside the chromatogram shown in the current Graph window in two ways. First,
moving the cursor to any border of the Graph window will cause the display to "pan" in that direction
by approximately one third of the current full scale. Panning in this manner can be done while you
are drawing a new peak, if necessary, or between defining peaks, without interrupting the Draw
Baseline mode.
The second way to change the view while drawing baseline is to click the right mouse button, which
redisplays the Draw Baseline pop-up submenu. Clicking on Zoom in this pop-up allows you to
temporarily interrupt the peak drawing mode to rubber band a new zoomed view and zoom the
display, or unzoom, in the usual manner. You can use a combination of panning and zooming to
achieve any level of visual magnification you may need. Of course, you can also terminate the Draw
Baseline mode and use the Graph Display and View commands to change the current scaling and/or
view of the chromatogram before restarting Draw Baseline and proceeding.
While drawing baselines and skims, each step will be reintegrated as soon as the necessary code
placement is completed, giving you an "on-line" display of the results.
When you have finished marking peaks with Draw Baseline, click on the right mouse button to bring
up the pop-up submenu, and click on any other option or on End Drawing to leave Draw Baseline
mode. It is possible to use any of the Graph Edit, Display, View, or Print commands without exiting
Draw Baseline mode - simply click on the desired command(s). Clicking the right mouse button after
executing those commands will retrieve the baseline editing pop-up menu.
Ü To place drop lines on the chromatogram, select the Drop Lines option on the pop-up menu (Figure
7.15). A "D" character will appear at the current cursor position with a vertical line underneath it. As
you move the pointer, the "D" will move with it (Figure 7.16). Place the vertical line at the exact
position where you wish to place a drop line and click the left mouse button to anchor the new drop;
the effects of the new drop will automatically be reintegrated and the new peak labeled. You can pan
112
Data Ally Chromatography Manager Operators Manual
and zoom while manually placing drop lines as described above. To terminate Drop line placement
mode, click on the right mouse button and select any other option or End Drawing.
Figure 7.16 Placing a Drop Line With Pointer
7.3.3.3 Reintegration
Reintegration is always automatic, on a stepwise basis, after each new set of baseline codes is
placed to define a new peak, or after existing codes are cleared or moved to re-define the existing set
of peaks.
Note that reintegration will utilize Peak Table information to name newly-integrated peaks. Only
global integration using the Integrate commands, and not Reintegrate, will account for zone codes
placed in the graph window. Both global integration and reintegration will affect every other window in
which the current foreground chromatogram in the active window is also present. You can adjust the
display of baseline codes and other peak information in any window during reintegration by changing
each window's Display and View settings.
7.3.3.4 Moving Baseline Codes
Ü To move baseline codes already on the chromatogram, click on the right mouse button to display
the pop-up editing menu (Figure 7.15), and click on Move Codes. A "hand" icon will replace the
cursor pointer on screen. Place the "hand" on top of the first code to be moved, and click on the left
mouse button to "grab" the code. While holding the left button down, moving the hand icon will cause
the code to be dragged in any direction, and baseline associated with that code to be redrawn. When
the code is in the desired position, release the mouse button to anchor it; the effect of the change will
be instantly reintegrated and displayed.
Ü To terminate moving of codes, click on the right mouse button to display the editing pop-up menu
and click on any other option or on End Drawing.
7.3.3.5 Clearing/Erasing Baseline Codes
Ü To clear individual baseline codes already placed, click on the right mouse button to display the
pop-up editing menu (Figure 7.15), and click on Clear Codes to activate the clear function. A "clear"
icon will replace the pointer cursor. Move the icon on top of any code desired, and click on the left
mouse button to clear that code. After each Clear step its effect is immediately reintegrated and
displayed. Note that clearing one of a pair of B/E codes defining a peak or a skim will automatically
clear both codes; clearing a B or E code defining a range of fused peaks will clear some or all of the
individual fused peaks, depending upon how the peaks have been separated. You can clear as
113
Data Ally Chromatography Manager Operators Manual
many individual codes as desired in this manner. To terminate clearing codes, click the right mouse
button to display the editing pop-up, and click on any other option or on End Drawing.
Ü To erase all codes, or to clear a range of codes in a single step, use the convenient Erase
command in the Define Baseline submenu. Click on Erase, and the submenu (Figure 7.17) will
appear containing two commands: All and Range. To remove all codes from the current foreground
chromatogram, click on All. To remove only a range of codes, click on Range, then move the pointer
into position to draw a "rubber banded" box to define the range of codes to erase. Hold down the left
mouse button, move the pointer to draw the rectangular range, and then release the button - all
codes in the indicated range will be removed. Automatic reintegration will always occur immediately
after any erase command is executed.
Figure 7.17 Erase Baseline Code Commands
7.3.3.6 Undoing Baseline Code Edits
You can "undo" any changes which have been made to the original set of baseline codes for any
chromatogram, one change at a time, by using the Undo command in the editing pop-up menu.
the manual baseline editor keeps track of every recent series of changes, and undo can be used
to "back out" of those changes.
Ü To "undo" a baseline code change made during manual editing, click on the right mouse button to
show the editing pop-up menu (Figure 7.15), and click the left button on Undo. A number next to the
Undo command shows how many baseline modifications are currently registered in memory which
can be "undone". Each time you click Undo, the most recent remaining change is undone, and the
reintegration resulting from the Undo step is shown. You can continue to click on Undo until the
numerical counter reads zero, indicating that all the tracked baseline modifications have been
undone. To terminate Undo, click on any other option in the editing pop-up menu or click on End
Drawing.
When you have completed all the desired editing functions, you can move another chromatogram
into the foreground editing register by dragging its filename icon into the desired top left position, and
then proceed to edit the new chromatogram without leaving editing mode. Alternatively, you can exit
manual editing mode by clicking the right mouse button to show the editing submenu, and click the
left button on End Drawing. When you leave a manual editing cycle, the modified baseline codes you
have placed will remain associated with that chromatogram, and will be resaved with the
chromatogram raw data automatically when that chromatogram is cleared or another is loaded into
its register. This guarantees that the new set of baseline marks will always be present when the
chromatogram is next recalled.
7.3.4 Manual Zone Code Editing
Data Ally allows you to enter timed integration event codes, also known as Zone Codes, directly into
any chromatogram to adjust and influence the integration algorithm in time-dependent regions as
114
Data Ally Chromatography Manager Operators Manual
desired. You can also use Zone Codes in the Method Events Table to automatically insert those
codes into newly-acquired chromatogram data files. Once a Zone Code is used to influence the way
a chromatogram file is integrated, processed, or displayed, it becomes a permanent part of that file
until it is changed or removed.
The menu of available Zone Codes is defined when setting the Integration screen defaults in
Configuration. Automatic insertion of zone codes in a Method is possible only if the Zone Codes
column has been configured for the Events Table.
Zone Codes differ from baseline marker codes in that they affect the way global integrations are
conducted, using the integration algorithm parameters contained in the Integration program screen.
After changing or applying zone codes, you must use the Integration command to see their effects.
Reintegration after changing baseline marker codes in Define Baseline mode will not be affected in
any way by the presence or absence of zone codes.
7.3.4.1 Placing Zone Codes
Ü To manually place Zone Codes in the foreground chromatogram in the Graph window, click the left
mouse button on Edit in the Command Menu bar, and then click on Define Zone Codes in the
submenu. This will display the Zone Codes submenu (Figure 7.18), which works in almost exactly
the same manner as the Draw Baseline edit menu.
Figure 7.18 Define Zone Codes Submenu
Now click on DRAW ZONE CODES to pop-up the Zone Codes dialog box (Figure 7.19). The
commands for placing, moving, and clearing zone codes work in exactly the same manner as the
Draw Baseline commands. See Chapter 9.0 for a complete discussion of all available zone code
types.
115
Data Ally Chromatography Manager Operators Manual
Figure 7.19 Zone Codes Editor Pop-up
The Zone Codes edit menu shows a listing of the available Zone Codes: Check BCD Input,
Integration Off, Group Integrate, Dropline Riders, Skimline Riders, Valley to Valley, and Reset-End
Zone.
To defeat integration in portions of the foreground chromatogram, select Integration Off by clicking it
with the left mouse button. A "box" pointer containing an "IntOff" code will appear, which can be
moved along the time axis. At the first time point where integration is to be disabled, click the left
mouse button and an "IntOff" code will be "dropped" on the time axis. The cursor will then change
into an Reset code pointer. At the following point where integration is to be resumed, click again and
a "Reset" character will appear (Figure 7.20). You can continue to place additional pairs of
IntOff/Reset codes as desired - when complete, click the right mouse button again to redisplay the
zone codes edit pop-up. Note: As you place zone codes on the graph, the time location and
zone code command will be automatically inserted into the Method Events Table’s Time and
Zone Columns.
Figure 7.20 Zone Codes Placed Along Graph Time Axis
116
Data Ally Chromatography Manager Operators Manual
To designate timed regions in which the baseline is to be forced into the valley points, click the left
mouse button on Valley-to-Valley in the pop-up. A special pointer containing "VtoV" will appear.
Move to the first time point where you wish to begin forcing the baseline up into the peak valleys, and
click the left mouse button to drop an "VtoV' zone code on the time axis. Then move to the end of
the negative peaks region and click again to drop a "Reset" code. Continue to graphically indicate
regions for peak quantitation in this manner; when complete, click the right mouse button to
redisplay the edit pop-up.
7.3.4.2 Moving Zone Codes
You can change the current chromatogram view without leaving Zone Code editing mode in two
ways. Moving the pointer to any edge of the Graph window will cause the chromatogram to "pan" in
that direction by approximately one third of the screen scaling. Panning can be done while you are
drawing, moving, or clearing codes. Clicking on Zoom in the pop-up edit menu will enable rubber
band zooming without leaving editing mode, enabling you to zoom or unzoom to a new view as
required. When done zooming, you must click the right button and use the left button to "uncheck"
Zoom in the pop-up menu before continuing your editing.
Ü To move Zone Codes which are already present, click the right mouse button to show the edit popup menu (Figure 7.19), and click the left button on Move Codes. A "hand" icon will appear instead of
the pointer cursor. Move the "hand" on top of the first code you wish to move, and hold down the left
mouse button to "grab" that code. Then drag the code to the desired position while holding the button
down, and release the button when the code is placed correctly. Repeat this procedure for moving
any other codes. To terminate moving codes, click the right mouse button to pop up the edit menu,
and click the left button on any other option or on End Drawing.
7.3.4.3 Clearing Zone Codes
Ü To clear Zone Codes which are already present, click the right mouse button to show the edit popup menu (Figure 7.19), and click the left button on Clear Codes. The Clear icon will replace the
pointer cursor, which can be moved with the mouse to any code. Place the icon on top of the first
code to be cleared, and press the left mouse button to clear that code. Repeat the clear process for
as many codes as desired. To terminate clearing of individual codes, click the right mouse button to
show the pop-up edit menu and click on any other option or on End Drawing.
Ü To clear all Zone Codes or a range of codes rather than individual codes, click on the Erase Codes
function in the Define Zone Codes submenu (Figure 7.18, which operates in exactly the same
manner as the Erase Baseline Codes functions..
7.3.4.4 Undoing Zone Codes
Ü To undo changes in Zone Codes, click the right mouse button to show the pop-up edit menu
(Figure 7.19) and click the left button on Undo. Next to the Undo command is a number indicating
the number of recent changes tracked by the Editor which can be undone one at a time. Click on
Undo to undo the last change. The counter will decrement by one each time you click Undo. When
finished undoing zone code changes, click on any other option in the pop-up menu or on End
Drawing.
7.3.5 Manual Chromatogram Analysis
After you have integrated a chromatogram, you can manually create and see any type of result report
via the Analyze command.
When Analyze is used, the currently loaded Integration program is used to identify peak components,
the Report Template you select from the Report Library (if any) is loaded by the system and "filled in"
with the result data from the chromatogram. If the report chosen includes quantitative results, the
current Calibration file will be employed to compute and show those results. Reports can be shown
on screen, printed out in hard copy, or saved as report files for later recall.
117
Data Ally Chromatography Manager Operators Manual
Ü To Analyze an integrated chromatogram to see results or get a report, click on Edit in the Graph
Command Menu bar, and then on Analyze. The Analyze dialog box will appear (Figure 7.21). The
dialog box includes four types of information: the "Correction Factor" fields as are configured for the
currently loaded Method, for entry of sample-specific data relevant to the report; the "Internal
Standard" concentration values for up to five peaks as configured; sample information as configured
such as name and number; and a Template/Save File Selector allowing a choice of any report
format from the current report template library, and setting a filename for any saved report. A set of
*.XLS report template files are available for printing via Microsoft Excel, which can be edited (or new
templates prepared) for custom reports (see Section 16).
Figure 7.21 Manual Analyze Dialog
If you want or need to enter sample-specific information, such as Sample Name or Dilution factor,
click inside the appropriate field and type in or change the entry as desired. Reconfiguring the
current Data Ally time base to remove certain types of entry fields will remove those fields from the
Analyze dialog as well. Note that only the correction factors, sample information fields, and other
items which have been set in configuration for this time base will be active and visible - in order to
enable additional items, you must re-configure the current time base before proceeding.
For a complete explanation of the use of correction factors and internal standards in quantitative
calculations, see section 10.3 below.
Click on the check boxes to toggle screen display or printing of the report on or off. Any combination
of these options can be used. If you wish to save the report, you must enter a filename in the
filename entry box.
Click on the arrow at the right side of the "roll down" list box labeled TEMPLATE to see a complete
listing of all current report types available. Select the one template to be used for the new report by
highlighting it. These templates are all *.XLS files present in the \Data Ally\REPORTS subdirectory.
Click on OK when you are finished.
The selected report will now be produced by Microsoft Excel either on screen or on the current
printer, or both (Figure 7.22). If you have chosen screen display, you can "page down" through the
report sections for review using the Excel "Page" button, or "zoom in" on any section of the report
with the "Zoom" button.. Note: You must have a Printer Driver configured in Windows else a
report will not be generated.
118
Data Ally Chromatography Manager Operators Manual
Figure 7.22 Example of Typical Area PerCent Report via Excel
Only one report can be generated via Analyze at a time for a single chromatogram. To manually
produce additional reports, repeat the steps above and select a different report template.
To save the report as an Excel .XLS file, type a target directory path and filename for the report file
into the FILENAME entry field before exiting the Analyze dialog box with OK. A new .XLS file will be
created in the target path including all the information and format for the current report template used.
7.3.6 Manual Calibration
You can manually update a Calibration, if the current foreground chromatogram is for a standard,
using the Calibrate command. Based on your entries, Calibrate will recompute the current
Calibration file, which can then be reviewed and edited in the Calibration screen (Section 10). Of
course, in order to perform valid calibration updates via manual calibration, you must be sure that
appropriate Integration and Calibration files are currently loaded.
Ü To perform a manual calibration, with a "standard" chromatogram integrated in the foreground
register, click on Edit in the Graph Command Menu bar, and then on Calibrate. The Calibrate dialog
box will appear (Figure 7.23).
Figure 7.23 Manual Calibration Dialog
119
Data Ally Chromatography Manager Operators Manual
The dialog box contains four types of information: sample-specific factors describing the standard,
such as Dilution, as defined in the Sample Information dialog of the current Method screen; Internal
Standard concentration entry fields for the number of internal standards currently configured; a
Calibration Level selector and Mode radio buttons, for choosing the type of calibration (New Table,
Replace Level, Average); and a template selector box, which specifies the calibration report file
template, if any, and filename if a report file is to be saved.
Click inside any of the standard data entry fields and type in the appropriate values, if any, or change
the default values which appear. If internal standard(s) is called for in the current Peak Table, no
entries need to be made in the IS fields provided the Calibration Reference Table (Section 10.1)
includes appropriate values for the internal standard peak(s). If entries are made here in the IS
fields, they will override any values found in the Reference Calibration Peak Table.
Select the standard level assigned to the current standard for manual calibration. The concentration
of this standard for all component peaks should agree with that listed in the current Calibration Peak
Reference Table for the selected level. Click on the radio button corresponding to the type of
calibration (New, Level Replace, or Average) to be performed - only one option can be marked.
See Section 10.3 below for a complete explanation of calibration functions, including the use of
correction factors and internal standards.
Click on the right arrow button in the TEMPLATE field to see a listing of all the available report
templates. You may select an appropriate report containing calibration information for printout or
display. Of course, calibration data can be included in any Data Ally report, if desired, simply by
editing that report's template format (see Section 13).
Click on the check boxes to select calibration report display (Show) or printing. If you wish to save
the calibration report as a separate file to disk, you must enter a path/filename for that file in the CAL
REPORT entry box. This will result in an .XLS file being saved using the template report format to
the target path.
When complete, click on OK to do the calibration update. The current foreground chromatogram will
be used to increment the current Calibration file. If the SHOW and/or PRINT boxes are checked, a
calibration report will be shown and/or printed (Figure 7.24).
You can click on the CALIBRATE SoftButton to view the current Calibration Table and Plot to verify
that the new standard has been accumulated into the table (see Section 10 below).
Figure 7.24 Example of Calibration Report
120
Data Ally Chromatography Manager Operators Manual
7.3.7 Manual System Suitability Calculations
System Suitability calculations may be performed on any peaks in a chromatogram. Normally peaks
will be baseline resolved to obtain meaningful results.
With Data ally, only selected peaks may have system suitability calculations performed on them.
Normally at least two peaks will be selected to enable all parameters to be calculated. In addition the
unretained peak should be identified in the Peak Table, if available, or in the Column Parameters
section if a specific retention time is required.
Ü To perform a manual System Suitability Calculation
The peaks in the chromatogram should have a corresponding Peak Table relating to them. Select the
first peak in the table that is to have System Suitability calculations performed on it and enter an
upper case 'S' in the Suit Code column for the peak. Repeat for all other peaks for which you wish to
have System Suitability calculations.
If the Unretained or Ko has been integrated, place a 'K' in the Suit Code column corresponding to the
peak. If the Unretained peak has not been integrated the retention time and name may be inserted in
the Column Parameters dialog on the top level of the Integration Screen.
Re-integrate the chromatogram with the Edit,
Integrate Chromatogram option.
The selected peaks will have additional lines drawn on them corresponding to the system suitability
calculations.
To produce a report, go to Edit, analyze and select a Suitability report template (A4SUIT.XLS in
Europe) to either print or show in the normal way.
The System Suitability report will be produced. Each peak will be displayed separately with the
calculations shown next to it. NOTE: For all the calculations to be performed, certain column
information will need to be entered in the Column Parameters dialog in the top level of the integration
screen.
7.3.8 Cutting the Current Display Image
The Cut command allows you to easily transfer the currently-displayed chromatogram image in the
active Graph window into the Windows clipboard or directly into a DOS file which can be passed to
another software application or saved for later use. Cut operates on the complete image in the active
window, which should be rescaled, zoomed, and otherwise adjusted exactly as desired before using
this command.
Figure 7.25 Cut Image Command
Ü To cut a copy of the current Graph image to the Clipboard, begin by making sure the image on
display is totally suitable. If not, make whatever changes are needed using the Graph/Edit,
121
Data Ally Chromatography Manager Operators Manual
Graph/View, or Graph/Display commands. Then, click on Edit, and then on Cut in the submenu
(Figure 7.25). The current image will immediately be copied into the Clipboard, where it will remain
available for pasting into any other compatible application. The image will remain in the Clipboard
until you either clear it, cut or copy a new image to the Clipboard, or exit Windows.
7.4.0 Math Functions
The Math functions on the Graph Command Menu Bar (Figure 7.26) perform mathematical
operations and manipulations upon one or more chromatograms loaded in the current active Graph
window. These functions are executed manually using the Math command; they can also be
performed automatically as part of a Method if the Auto Math options are utilized. Math functions
submenu commands will be "grayed out" and unavailable unless more than one chromatogram file is
loaded into the current Graph screen.
Most Math functions are based upon and/or affect only the first two chromatograms in the stack.
These chromatograms can be identified as those whose filename icon buttons appear at the top left
in the area beneath the horizontal graph axis. You can rearrange the order of chromatograms in the
stack by dragging the filename icons into the desired positions or by using the Display/Swap
command prior to executing any Math commands.
Figure 7.26 Math Functions Menu
7.4.1 Adding/Subtracting/Ratioing Chromatograms
The three math operation functions use the first two chromatograms in the register stack. You must
position the correct chromatograms in those registers via the filename icon buttons or using the
Display/Swap function before executing these commands.
• Add: Adds the first two chromatograms in the stack (foreground plus next file) and places
the result into the first open register in the stack. The result chromatogram is drawn using a
different color trace and is labeled "Sum". If the result chromatogram is to be saved, it can
be renamed as desired and saved as a new file using the Files/Save As command, or it can
be automatically saved via the Result command below.
Ü To add two chromatograms, click the left mouse button with the cursor on the Math/Add
command. The first two chromatograms in the stack will automatically be added and the
result displayed as a new chromatogram named "Sum". If there are no stack register
positions available in which to place the result chromatogram, an information box will appear
when Add is initiated advising that at least one file must be cleared from the stack before
addition is possible.
• Subtract: Subtracts the chromatogram in the second register from the chromatogram in the
foreground register, and places the difference chromatogram into the next available open
122
Data Ally Chromatography Manager Operators Manual
register in the stack. The difference file can then be saved with any desired file name, or
used for additional math operations.
Ü To subtract two chromatograms, click the left mouse button on the Math/Subtract
command. The first two chromatograms in the stack will automatically be subtracted and the
resulting difference chromatogram will be displayed as a result named "Diff", in the first
available stack position. If there are no open stack positions in which to place the result
chromatogram, an information box will appear when Subtract is initiated advising that at least
one file must be cleared from a register before subtraction is possible.
• Ratio: Ratio computes the ratio of the signals of the first two chromatograms, the foreground
chromatogram being divided by the second register file. The result or ratio file is placed into
the first open stack register. It can then be saved using any desired filename.
Ü To ratio two chromatograms, load the desired files into the first two registers and click on
Math/Ratio. The ratio will be computed and will be shown in the first open register with the
name "Ratio". If there are no open stack positions to display the ratio file, an information box
will appear when you select the Ratio command advising that at least one currently-loaded
file must be cleared to open a register before ratioing is possible.
7.5.0 View Commands
The View submenu accesses two special Zoom functions. A "Zoom Box" can be placed in the Graph
window as an indicator of the segment of the current chromatogram included in the current view.
This feature is convenient when reviewing details within a chromatogram at high magnification. A
special "Zoom Center" function is also provided which changes the standard "rubber-band" zoom
mode to a "center-zoom" mode which expands the display centered on the cursor position by fixed
magnification factors set in Configuration.
Figure 7.27 View Submenu Commands
7.5.1 View Commands
The View submenu commands are as follows:
• Zoom Box: Places a special "zoom locator box" on the current Graph window which
indicates the current view in relation to the entire chromatogram. Checking the Zoom Box
command in the submenu activates the Zoom Box (Figure 7.28), and unchecking it defeats
the Zoom Box display. Once displayed, the Zoom Box can be resized and repositioned like
any other window. Inside the bottom portion of the Zoom Box are numerical indicators of the
current time and signal coordinates range covered by the current view in the Graph window.
One Zoom Box can be enabled for each Graph window displayed.
123
Data Ally Chromatography Manager Operators Manual
Ü To enable the Zoom Box in the active Graph window, click on Zoom Box. The Zoom Box
will appear at the upper right of the Graph window. Inside you will be able to see a miniature
image of the current foreground chromatogram file, with the portion of the file "highlighted" in
a rectangular area corresponding to the image actually being observed in the Graph. You
can now resize and/or reposition the Zoom Box as desired.
Figure 7.28 Zoom Box Enabled in Graph Window
• Zoom Center: Enables "zoom center" zooming mode instead of the normal "rubber-band"
zooming. Clicking on the Zoom Center command to check it causes a double-click of the left
mouse button within the current Graph window to "zoom" the display in that window by preset
factors for both the signal and time axes. Zooming is always centered on the current mouse
cursor position. Zoom Center is convenient for repeated zooming at specific points since it
requires only one click rather than a rubber-banded definition of an area to zoom, and allows
the cursor to remain fixed during zooming..
Ü To enable Zoom Center in addition to rubber-banding zoom, click on Zoom Center to see
the subcommands "Enable" and "Set Zoom Scale Factors" (Figure 7.29). Click on "Enable"
to activate zoom center. When Enable is checked, a left double click anywhere in the Graph
window will cause the display to be zoomed around that point. Clicking the right mouse
button will cause "unzooming" by the same factor.
Figure 7.29 Zoom Center Commands
To disable Zoom Center, click on the Zoom Center command again to uncheck it.
Ü To set the zoom center expansion factors, click on Set Zoom Scale Factors. A dialog
box will appear (Figure 7.30). Click inside the "Horizontal" or "Vertical" axis fields and enter
124
Data Ally Chromatography Manager Operators Manual
the desired expansion factor value. An entry of "10" for either field will cause the display to expand
by a factor of ten times in that field's dimension. When the values are set as desired, click OK.
Figure 7.30 Zoom Center Scale Factors Dialog
Zoom Center can be enabled for any specific Graph window(s). It is possible to have
some windows set for standard rubber band zooms only and some for zoom center. The
rubber band zoom option is always available whether zoom center is active or not.
7.6.0 Changing Graph Display Characteristics
The Display submenu of the Graph Command Menu Bar (Figure 7.31) sets and modifies most
aspects of the current active Graph window, including what information is displayed, the colors and
relative positions of chromatogram and other traces, the relative placement of multiple
chromatograms, and the order of chromatograms in the register stack. Some of the Display
functions can also be performed using the filename icon buttons at the bottom of the Graph window.
Figure 7.31 Graph/Display Submenu Commands
7.6.1 Display Attributes
Attributes settings modify the type of graphical information shown in the current Graph
window, and provide a wide range of flexibility. As an example, in certain instances, only
some types of information may need to be displayed describing the integration of the loaded
chromatogram, so it may be desirable to "turn off" baseline markers, peak names, and
125
Data Ally Chromatography Manager Operators Manual
retention values. Disabling such selected data from the Graph can be done via the Attributes
table.
Ü To change current Graph Attributes, click on Display/Attributes to see the Attributes dialog
box (Figure 7.32). Any combination or all of the following items can be checked (enabled) to
place each checked item on the display whenever it is appropriate (unchecked items will
never be displayed):
Figure 7.32 Graph Display/Attributes Dialog
• Fill Above CG: This "fills" the display with a color above the foreground chromatogram
trace. The color used can be modified with the Display/Colors command below. Fill is
often useful for graphically distinguishing peaks by increasing contrast against the screen
background. The normal default for Fill Above CG is disabled.
• Fill Below CG: This "fills" the display with a color below the foreground chromatogram
trace, which can be changed via the Display/Colors command. The normal default is fill
off.
• Fill CG Above BL: This "fills" the actual areas of all peaks in the foreground
chromatogram between the trace and drawn baselines. This Fill Attribute can be very
useful if it is enabled during manual baseline drawing, since peaks are filled actively with
color as baselines are adjusted. The color can be reset using Display/Colors. The
normal default is fill disabled.
• Show Zone Codes: This turns on or off display of zone codes. The normal default is for
all codes to be displayed.
• Show Baseline: This defeats or enables display of baseline drawn under all found peaks.
The normal default setting is baseline enabled.
• Show Baseline Marks: This Attribute shows the locations of all baseline codes by
"tic" marks.
• Show Baseline Codes: This causes baseline codes to be displayed or omitted. The
normal default for baseline codes is enabled. Note that any combination of codes and
their corresponding tic marks can be selected.
126
Data Ally Chromatography Manager Operators Manual
• Show Peak Names: This causes peak names to be shown or omitted. If enabled,
names of all identified and named peaks will always appear in the Graph window for
every appropriate peak. The normal default is peak names shown.
• Show Peak Numbers: This shows peak numbers, provided they are assigned in the
Peak Table. The normal default is for peak numbers shown.
• Show Retention Times: This causes absolute retention times to be shown or omitted on
the Graph display, if an integration has occurred to assign them.
7.6.2 Screen Display Characteristics Settings
Several of the Display submenu commands change the overall appearance of chromatograms and
other types of plots, their order and hierarchy, and their relative positions.
• Colors: The Colors command changes all colors assigned to the basic Data Ally Graph
screen displays and functions. This includes colors for chromatogram traces, hardware
function traces (pump or temperature profiles), graph axes, annotations, chromatogram
names, buttons, baseline and zone codes, etc.
Figure 7.33 Display/Colors Dialog
Ü To modify Graph screen colors, click on Colors to see the Colors dialog box (Figure 7.33).
The box includes sample color fields for all the components of the screen. To change any
color setting, clicking the left mouse button on the sample field for that item - a color "palette"
will pop up, showing the selection of possible colors. Select the desired color by clicking on
it. The selected color "box" in the palette will have a dark outline drawn around it. Repeat
the same process to reset the colors for additional items in the listing. When you are
finished, click on OK.
You can change any of the colors assigned to loaded chromatogram traces by clicking on the
right arrow in the Traces selection field and highlighting the desired trace name to find and
edit its color.
System colors can be changed for each Graph window independently, and can be modified
while any window is running or idle. Colors for SoftButtons, program screens, and other Data
Ally graphics must be changed in Configuration for each channel, or via the Windows
Program Manager/Control Panel.
127
Data Ally Chromatography Manager Operators Manual
• Offset: The Offset command is used to "move" the apparent position of any chromatogram
in the active Graph window in the signal dimension only. You must use the Math/Move
command to displace chromatograms in the time dimension Offset performs the same
function which can be done by double-clicking on any chromatogram filename icon and then
dragging the chosen trace to a new position directly on the screen.
Figure 7.34 Display/Offset Dialog
Ü To offset one or more chromatograms, click on Offset in the Display submenu. The
Offset dialog box will appear (Figure 7.34). It contains offset fields for each defined stack
register and for other displayable parameters, such as pump or temperature profiles. Offset
entries can be defined differently for the same chromatogram in separate Graph windows.
To specify the amount of offset applied to any chromatogram only, click on its offset entry
field, and type in a positive or negative value in appropriate signal units for the desired offset.
Then click on OK.
Note that when you offset a chromatogram graphically by using its filename icon button to
drag the entire chromatogram to the desired position, the offset created for that
chromatogram will appear in its offset field in this dialog. You can refer to either this
value or the status box signal value to determine the exact offset applied to a chromatogram.
Offsetting a chromatogram or chromatograms does not change the raw data signal values
for that chromatogram but only the apparent display position.
The same technique is utilized for offset control parameter traces also listed in the Offset
dialog, depending upon time base configuration. Appropriate units must be entered for each
item selected; offsets will, of course, only be relevant if the Traces command (below) is used
to enable display of that item in the Graph window.
• Scaling: Scaling sets the overall scaling for all types of screen display registers, and enables
"Autoscaling" if this is appropriate. The default Scaling mode is usually Autoscaling, which
will redraw the active Graph window display axes to contain the dimensions of the largest
chromatogram file (signal level or time) in any stack register. Autoscale allows approximately
10% of available screen space for any window to accommodate drawing of baseline codes,
retention times, and other labels and annotations, and for easier legibility.
Ü To reset Graph scaling, click on Scaling to see the Scaling dialog box (Figure 7.35). This
box contains scale factor boxes for all the named (up to five) input register signal ranges, the
time range, and the range for any HPLC or GC control parameter values which are enabled
in Configuration. The hardware, input, and time registers also each have separate check
128
Data Ally Chromatography Manager Operators Manual
boxes for "AutoScaling", which can be enabled independently for any of these parameter
types.
Figure 7.35 Display/Scaling Dialog
To set a fixed range (maximum and minimum value) for the current active graph window for
any item, click on the Autoscale check box for that item to defeat Autoscaling, and then click
inside that item's corresponding MIN or MAX entry field and type in the desired value. If no
MIN is entered, zero value will be assumed. If no MAX is entered, Autoscaling will be
enabled automatically. If Autoscaling is checked, Autoscale display will override any
simultaneous values in the MIN and MAX fields for each parameter.
Since Autoscaling can be independently set for each Graph axis, it is possible, for example,
to set the display for auto-expansion only in the time axis during live runs, or only in the signal
axis with fixed-window scrolling in the time axis. The settings for scaling will determine
exactly how the display appears during live acquisition runs. Like all the other Display
functions, scaling can be changed on a real-time basis while runs are in progress to observe
the resulting effects.
All Method Events table parameters which are plottable (pump %, GC oven temp) will appear
as separate items in the Scaling dialog for each channel, and can be switched between
Autoscaling (the normal mode) and manual scaling in the same manner as the input signal
traces.
To set scaling for HPLC pump profiles if these are to be plotted, click Pumps in the Scaling
dialog (Figure 7.35) to view the Pumps/Scaling Dialog (Figure 7.36).
Figure 7.36 Pumps/Scaling Dialog
129
Data Ally Chromatography Manager Operators Manual
If the Method Events Table in the current time base has a pump control program loaded, this
dialog will control scaling of the pump gradient traces superimposed on the signal graph
window plot. Enter the desired values for scaling as in Figure 7.35 and click OK when
complete.
• Pump Traces: If HPLC pumps have been configured for the current time base, a separate
command will appear at the top of the Display submenu, Pump Traces (Figure 7.37).
Figure 7.37 Display Submenu with HPLC Pumps
Click Pump Traces to pop up a listing of all configured pumps (Figure 7.38). Click on each
pump related parameter (total flow or individual gradient percents for each pump) to checkmark that parameter and display a plot of that parameter on the GRAPH window along with
the signal information.
Figure 7.38 Setting Pump Trace Plotting
Traces will now appear as long as their corresponding parameters are "checked" in this
menu - to remove the traces, click on Pump Traces again and click to "uncheck" each item.
• Swap: Swap shifts all loaded chromatograms in the current Graph window into the next
forward register, with the previous foreground chromatogram being moved into the "last"
register. Repeated use of Swap will place any chromatogram in the stack into the foreground
position for editing operations. The alternative to Swap is to drag the chromatogram
filename icons into the desired positions.
Ü To swap the second-register chromatogram into the foreground register, click on Swap.
130
Data Ally Chromatography Manager Operators Manual
7.6.3 Status Box
The Status box is a powerful and flexible tool which can provide much additional information about
the course of a running Method in real time, or assist you with editing functions while the current
channel is idle. Using this command will place a "status box" window on the active Graph windows
(and in all program windows in the current channel) which contains only the items you select from a
configurable listing of many system and computer parameters. The status box can be moved to any
position on the display for maximum convenience. When the Status Box is placed in the Graph
screen in any channel, it will automatically also appear in all other program window screens in that
channel. It is possible to disable the appearance of the Status Box in any or all program windows
using the Options/Status command in each such window.
Ü To set up and enable the status box, if it is configured, click on Status Box. The Status
Box dialog box will appear (Figure 7.39). In the dialog box are a number of items with
corresponding check boxes. You can check each item you wish to appear in the status box.
When selecting items, you should consider that more items will require a larger box which
may obscure some of the active Graph window. It is only possible to have a single status
box open in any Graph program window regardless of how many panes you have opened
within that window.
Figure 7.39 Display/Status Dialog
Be sure to check the top box for "Enable Status Box", and click on OK. The Status Box will
appear as you have defined it in the active window (Figure 7.40). You can now move the
box at will.
If the channel is running (you click on RUN), the status box will show a "live" readout of any
parameters included, indicating detector input conditions, time, Method program conditions
such as pump flows/gradients, flags executing, etc. If the channel is idle (no Method is
running), the status box time values will correspond to the current pointer position, signal
values will correspond to the signal values of any chromatograms in the selected register(s)
at the current pointer position, and Method parameters will correspond to the value of each
item in the current Method at the current pointer location. The Status Box can be very useful
while editing chromatograms as a time/signal counter, or to track the exact position in a
Method where a peak or event appears. If an offset is applied to any trace graphically or by
using the Offset command, the signal value shown for that trace in Status will reflect the
offset.
131
Data Ally Chromatography Manager Operators Manual
Figure 7.40 Status Box Enabled in Graph Window
Ü To disable the status box at any time, click on Status again, and uncheck the Enable
Status Box item, then click on OK. The Status Box will disappear until you re-enable or redefine it.
If the Status Box signal display is active during a HOLD condition, or between runs in a
Sequence, the signal register(s) will show the current status of each live detector - this can
provide valuable information for assessing whether run conditions are suitable for starting the
next injection, or if the system has re-equilibrated from a previous run.
Like the other Graph Display parameters, the state and contents of the Status Box can be
preset and associated with each individual Method so that it automatically assumes a given
"default" state whenever that Method is loaded.
7.6.4 Monitor Time Bases Function
There are two means by which Data Ally allows an operator to monitor the progress of active detector
methods or reprocesses in more than one time base at once on the same screen - the MONITOR
button at lower right of the GRAPH window (Section 7.1.2) and the Monitor Time Bases command in
the Display submenu (Figure 7.31). Both have exactly the same function, and both are only effective
if the Data Ally system is configured for two or more time bases.
To use the Monitor Time Bases command to place two windows showing two different active time
bases on one display screen, click on the command. The GRAPH window will split horizontally into
two panes, each showing one of the two time bases (Figure 7.41).
Figure 7.41 Monitor Time Bases Screen Display
132
Data Ally Chromatography Manager Operators Manual
All actions in either time base will now be observed on this screen. You can, of course, resize and
reshape each pane as desired using the standard commands and cursors. To restore a singlewindow view, either simply click the MONITOR button in the lower right hand corner of the screen, or
select Display/Monitor Time Bases again from the command menu bar.
7.7.0 Manual Printing of Graph Documents
The Print submenu of the Graph Command Menu Bar (Figure 7.42) allows manual printing of
chromatogram files and other information in the current active Graph window. These Print functions
can be executed at any time the channel is not running a Method.
Data Ally normally prints via the Windows Print Manager. This means that Windows itself manages
the setup of printers and all printing operations, including spooling and print queuing.
Printing images from the active Graph window is based on the Windows "what you see is what you
get", or WYSIWYG, convention; the printed image will represent exactly those fonts, characters, and
graphics shown on the display.
You can use Print Manager spooling by setting its "Low Priority" option to delay print operations to
cause minimal slowdown of on-screen displays while Data Ally is running. Alternatively, you can set
the "High Priority" option to achieve faster printouts, usually at the expense of screen update times. It
is possible and sometimes desirable to use Windows-compatible print spooling or buffering
accessories with Data Ally if heavy printing workloads are anticipated, especially if multiple Data Ally
Interfaces will be running on a single PC.
Figure 7.42 Print Commands Submenu
Printers are defined for each channel in Configuration/Utilities. You can use the Windows Print
Manager at any time while Data Ally is running to change the specifications for a current printer, but
you cannot change the printer assigned to a given Data Ally channel without reconfiguring the
system.
7.7.1 Printing Chromatograms
Ü To print various images of chromatograms in the current Graph Window, click on Print and then on
"Chromatograms" to see the Chromatograms Print dialog box (Figure 7.43).
133
Data Ally Chromatography Manager Operators Manual
Figure 7.43 Chromatograms Print Dialog
The Print dialog allows direct printing of various options, utilizing the printer noted in its top line:
Whole Document: Prints the current active Graph window as a single page, autoscaled for the
largest chromatogram loaded in the window.
Current View: Prints the current view of any chromatogram(s) loaded in the active Graph window on
a single page.
In Sections: Prints the current active Graph window sized to show the longest loaded chromatogram
on several pages, with each page time-scaled to the current scaling. The "From" and "To" entry
fields allow selection of only a partial set of pages - the total number of pages to be printed is
automatically computed and shown as soon as the option is selected.
The "Copies" field can be used to change the number of copies to be printed. If the "Collate Copies"
check box is checked, all copies will be collated on the printer into complete sets.
If the "Include Printout Info" check box is checked, the informational items chosen using the Printout
Info command (see 7.7.2 below) will be included in an area at the top of the printout. Leaving this
check box unchecked will cause only the chromatogram file name(s), axis labels, date and time of
printout, and page number(s) of printout to be included.
If the current setup is as desired, click OK. To reset the printer, select portrait or landscape printing,
or change other printer parameters, click on the Setup button. The Setup dialog box (Figure 7.44)
will appear.
Figure 7.44 Printer Setup Dialog
134
Data Ally Chromatography Manager Operators Manual
Click on the appropriate radio buttons to select either the current printer or select a new printer from
the list of Print Manager compatible printers. If you wish to change the orientation for the printout, the
page size, or the paper tray used, click these options as desired. Click OK when you are finished.
You can also click on the Options button at center right to make additional modifications in the
printout with the Print Options dialog (Figure 7.45).
Figure 7.45 Print Options Dialog
Use the Options shown specific to the current printer driver to change the appearance and handling
of printouts as desired. When finished making changes, click on OK or Cancel.
NOTE: THE "PRINT TRUETYPE AS GRAPHICS" CHECK BOX, IF SHOWN, MUST BE
CHECKED IN ORDER FOR Data Ally PRINTOUTS TO BE PROCESSED CORRECTLY.
The settings made in the Chromatograms dialogs will remain in effect to control manual
chromatogram printing until they are changed again. The same settings will apply to separate-page
chromatogram printouts made automatically as part of Method or Sequence execution.
7.7.2 Selecting Information Included On Chromatogram Printouts
The Printout Info command allows a set of informational parameters to be included in any
chromatogram printout, whether performed manually using the Print submenu or automatically at the
end of a Method or Sequence. Once a group of parameters is chosen using the Print Info dialog, that
information is always printed along with chromatogram graphics.
Ü To set up information on chromatogram printouts, click on the Printout Info command to see the
Printout Info dialog box (Figure 7.46).
135
Data Ally Chromatography Manager Operators Manual
Figure 7.46 Printout Info Dialog
Inside the Printout Info dialog are a number of check boxes corresponding to various system
information items. All the items in the Run Info, Chromatogram Info, and Sample Info blocks are
relevant to the "foreground" loaded chromatogram file only.
To select the set of desired items, check their respective check boxes, and then click OK. Any or all
of the items can be chosen for inclusion.
Once a series of items are checked, they will be printed in a space above the chromatogram printout
on each printed page. If multiple-page prints are made using the "In Sections" printing option, all the
selected information items will be printed on each page.
The Printout Info parameters will always be included in every chromatogram printout produced
manually or automatically via a Method or Sequence. To change the current set of Info parameters,
you must use the Printout Info dialog again.
Note that every page of every chromatogram printout will always be numbered at bottom right,
whether portrait or landscape orientation, with a page number and the total number of pages (e.g.
"Page 1 of 4").
7.7.3 Specifying Report Types
The Report command in the Print submenu allows any type of report for which a template *.XLS file
exists to be produced using the foreground chromatogram data currently loaded. To use this
function, simply click Report to see the Print Report dialog (Figure 7.47).
Figure 7.47 Print Report Dialog
136
Data Ally Chromatography Manager Operators Manual
This dialog allows you to select a report template by name using the entry box with right selector
arrow - click on the down arrow button to see a listing of all available types in the reports subdirectory,
highlight the one to be used, and click the left mouse button. If you wish to save the new report as an
Excel report file, enter a name in the "Save As Filename" entry box. Check either the Print or Show
check box, to print out or display the report on screen. When done, click OK to produce the report
desired in Excel, or Cancel to abort.
7.8.0 Running From the Graph Screen
Runs can be initiated from the Graph screen, or from any other screen in Data Ally, by doubleclicking on the RUN button on the bottom of the left switchbar at any time. Function key F12 on the
PC keyboard can also be used to issue the RUN command. When RUN is clicked, the button
changes to STOP, which can then be used to terminate the current run at any time. If a manual run
is in progress, the STOP button will include the word "RUN" indicating that a single, manual run and
not a Sequence is being performed. You must double click on both RUN and STOP to execute those
commands.
When a run is executing, the top bar which contains the name of the current channel will include a
notation that the channel is running, along with a "three-dot" live indicator which visually prompts that
a run is being processed. You can use any of the left switchbar buttons to view the contents of any
screen in the current channel, or to switch to any other available channel, during any run.
The following steps occur each time the RUN button is clicked in the Graph screen:
1. Data Ally reviews the Method now present in the current channel. If this Method specifies the use
of Integration or Calibration files for processing any data, the referenced files will be loaded for the
first designated active detector input.
2. All chromatogram or other files currently loaded into the Graph screen registers corresponding to
the detector inputs which are active in the Method are cleared. If those files have not been saved,
the software will direct the operator to save those files before proceeding to execute the Method.
Chromatogram files not occupying registers assigned to the signal inputs for the Method will remain
in the Graph window.
3. The channel will begin to execute the Events Table for the current Method. The "Active" light on
the panel of the Communications Processor module for the channel will illuminate while the Method is
running. If no Events are included in the table, the Method will simply acquire the data from the
specified detectors for the DURATION time and at the RESOLUTIONs specified for each input.
As the data are acquired, the Graph window will either rescale itself automatically, if AutoScaling is
specified in the Method, or will assume the fixed scaling directed by the Method. If fixed scaling is
used, the active window will "scroll" forward each time the trace approaches 80% of the full screen
time value, with the total time span for the window remaining constant. With AutoScaling, the display
will resize itself at continual intervals to accommodate the increasing length of the chromatogram
traces. Signal Autoscaling can be used with either fixed or auto time scaling. If signal is autoscaled,
the signal axis of the active Graph will expand to contain the largest excursion of any chromatogram
being acquired.
4. While new chromatograms are being acquired in real time, the operator can pan the display to any
previous position, reset the scaling, and use any zoom functions to examine any portion of the
already-plotted traces. The Display can be reset between AutoScaling and fixed scaling/scrolling
modes. Offset can also be adjusted for any individual trace using either the Display/Offset command
or by manipulating the filename icon buttons. Colors of any trace(s) can be changed using the
Display/Colors command, and additional graphics such as pump or temperature profile plots can be
placed in the active window or removed.
137
Data Ally Chromatography Manager Operators Manual
Of course, you can also use the SoftButtons to switch to any of the other program screens in the
same channel, or to move to any other channel, without interfering in any way with the run in
progress. If more than one channel is configured, you can use the Monitor Timebases display
function to show windows for different Timebases on a single screen.
5. When the Method DURATION is finished, the run will stop and the green RUN button will
reappear on the left switchbar. The active run indicator will disappear from the top bar. The
chromatogram file(s) will be integrated and analyzed automatically if specified in the Method. If
multiple chromatograms are to be integrated and analyzed, the first file will be handled with the
current Integration and Calibration screens, and then the next file will be integrated after loading its
specified Integration file from the Method. Any reports specified in the Integration files being used for
the Method will be shown on screen or printed (via Microsoft Excel) following the completion of
analysis of each file.
Note that at the completion of each run all chromatogram files are already saved to disk. They will be
named according to the instructions in the Method, if any, before the Method ends.
After RUN is pressed to begin a run, the RUN SoftButton will be redrawn as a STOP button.
You can click the STOP button at any time to abort the run. If you abort a run before the DURATION
time of the currently-loaded Method is completed, you will be prompted as to whether or not you wish
to save the "incomplete" data file now written on the disk, and whether you wish to make reports
using the partially-acquired chromatogram. If you indicate yes, you will be asked to assign a file
name for each captured input signal you wish to save.
138
Data Ally Chromatography Manager Operators Manual
8.0 Programming and Executing Runs: The Method Screen
The Data Ally Method program screen manages the definition, setup, and execution of
chromatography runs performed with the analytical instruments connected to each time base.
You can view the current Method by clicking the left mouse button on the METHOD SoftButton on the
left side of the screen at any time.
8.1.0 Method Functions
A Method determines the following parameters:
• The active detector signal inputs and their respective sampling rates.
• The duration time for the run.
• The path and filename for the chromatogram corresponding to each active input, if such files are
to be saved.
• The Integration/Peak Identification program which is to be used to process each chromatogram
for peak finding and generation of result reports.
• The Calibration program which is to be used to perform or update a calibration, or to compute
results.
• Any information pertinent to the sample being injected, including correction factors, internal
standard amounts, name, number, and other descriptive items.
• Timed control of relays or contact closures required for system operation.
• Timed control of pumps, GCs, detectors, fraction collectors, or any other programmable
instruments.
In other words, every procedural aspect of a run is controlled by the information in a Method.
The Method program consists of and is displayed in two portions: a "top-level" dialog box containing
global instructions relevant to the entire Method, and an "Events Table" which contains specific
directions for controlling all instrumentation, relay flags, and conditional response mechanisms. The
Method screen display should be considered as a "window" showing only one part of the overall Data
Ally software on a single screen.
Both the "top-level" screen and the Events Table are saved together comprising a Method file.
By loading a saved Method, the user can recall all the parameters associated with automatic
operation for a particular application at once. Methods can be loaded manually or automatically as
part of a Sequence.
Only one Method program can be present in any time base at any one time. In Configuration, a
"default" Method filename is defined, which will always be loaded automatically into the Method
screen whenever Data Ally is initialized or when the Method screen is cleared. Configuration also
permits many of the settings, display fields, and options in the Method screen to be enabled or
disabled, allowing total customization of Method contents for each individual time base. The contents
of the default Method file can be changed at any time by reconfiguring. It is recommended that each
user set the default file for the most common run conditions, which will minimize the amount of
additional programming needed later on.
Ü To run the currently-loaded Method program at any time, click on the RUN SoftButton at bottom
right. The system will immediately load all the files specified in the current Method, change the
Graph display according, and begin to display the signals from all active detector inputs in real time.
139
Data Ally Chromatography Manager Operators Manual
After the Method starts, the RUN SoftButtton will immediately change to a "STOP" button with an
octagonal red "stop" image.
Ü To stop the currently-running Method, click on the STOP button at any time. If you do not terminate
the Method early, it will continue to run until its DURATION time is completed, and will then process
any resulting chromatogram data as specified.
The currently-viewed display can be any screen (Graph, Method, Integrate, Calibrate, or Utilities)
except the Sequence screen when starting and stopping Methods with the RUN/STOP SoftButton.
If the Sequence screen is being viewed, the system will attempt to start the currently loaded
Sequence instead of the current single Method.
8.2.0 The Top Level Method Dialog
When you first click on the METHOD SoftButton, you will see the top-level Method dialog box (Figure
8.1). If the system has just been initialized and a saved Method file has not been loaded, the screen
will show all the parameter values associated with the default Method program.
Figure 8.1 Top-Level Method Screen
8.2.1 Method File Identification
The top bar of the Method dialog box shows the current Method filename. A new name can be
assigned by using the Files/Save As command to resave the Method with a different name.
To make identification of Method files easier when selecting a Method using the Files/Load
command, a description can be entered in the Save As dialog (see section 8.5.3 below) which will
appear in the Load dialog box for each Method file.
The remainder of the top-level Method is divided into four "boxed" sections which group items related
to the same functions for "Run", "Detectors", "Options", and "Results". At the bottom of the screen is
a large center button which switches the display to the Events Table portion of the Method.
8.2.2 Setting Inputs Criteria
The "Detectors" boxed area (Figure 8.2) contains the names of all the active detector inputs which
were defined for the current time base in Configuration. Each detector name has an associated
check box to its left, which must be checked to enable acquisition from that input, and a Resolution
140
Data Ally Chromatography Manager Operators Manual
entry field to its right, which contains the effective sampling rate parameter for that input. Up to four
different signal inputs can be set in this area, based on Configuration.
Figure 8.2 Detectors Setup Fields
Ü To enable detector inputs for a Method, move the mouse pointer to the check boxes to the left of
the available detector names, and click, if necessary, to check the detectors to be active for this
Method. If a box is unchecked, that detector signal will not be acquired nor displayed.
Note that unchecking to disable any detector in this box will cause that detector's "Results" fields
below to be "grayed out" and inoperable - these fields can only be set for active inputs.
Ü To set RESOLUTION (sampling rate) for each input, click the left mouse button with the pointer
inside the RESOLUTION field for any selected input. Type in the desired setting in points per
second. If a number only is entered with no units code, the system will assume you are using the
same units shown for the previous entry. If entering a time, the time should represent the expected
width at baseline for the narrowest peak to be found with your application and samples. All
RESOLUTION fields for all active detectors must have an entry before a Method can be started. In
general, you can set the defaults for RESOLUTION for each channel to be appropriate for the type of
procedure (e.g. HPLC) during Configuration, so that you will not need to make frequent adjustments
when writing new Methods.
IMPORTANT: NOTE THAT AFTER TYPING ENTRIES INTO FIELDS IN ANY PROGRAM
SCREEN, YOU MUST EITHER CLICK INSIDE A DIFFERENT FIELD, CLICK ON ANOTHER
SCREEN FUNCTION, OR PRESS ENTER IN ORDER FOR THE LAST FIELD ENTRY TO
BECOME "PERMANENT".
RESOLUTION values cannot exceed the equivalent of 400 points/second
8.2.3 Setting Run Criteria
Parameters in the Run boxed region include the total run time for the Method, or DURATION, and
any sample-specific information, accessed by clicking the SAMPLE button.
Ü To set the DURATION or run time for the Method, click with the pointer inside the DURATION field
and type in the desired total run time. The range for run time is determined in Configuration. A time
value can be entered in minutes or seconds.
Ü To set sample-specific information, click on the SAMPLE button to open Sample Info dialog
(Figure 8.3).
141
Data Ally Chromatography Manager Operators Manual
Figure 8.3 Sample Information Dialog
This dialog contains only those parameter entry fields which were specified for the Method screen
configuration in this time base. You can click inside any of the fields and enter values for each
parameter as desired. All this information will be available for inclusion in any reports made with this
method - if correction factors such as dilution and weight, or internal standard amounts, are entered,
these values can be used to compute reported results.
If Internal Standardization is used, the values for each Internal Standard peak may be defined in the
appropriate Calibration file's Reference Peak Table. Those values will be used when a Method is
employed to run a standard, if no IS AMT values are entered into the Sample Info dialog. Entries
made for any standard Method in the IS AMT fields will override existing values for internal standard
concentrations found in the Calibration file. ENTRIES OF IS AMT MUST ALWAYS BE MADE FOR
UNKNOWN SAMPLES EITHER HERE IN THE SAMPLE INFO DIALOG OR IN THE SEQUENCE
TABLE, or when using the Analyze command.
When all the desired information is entered correctly, click OK to return to the top level Method
screen, or click Cancel.
8.2.4 Setting Results Criteria
The boxed area in the center of the screen labeled "Results" (Figure 8.4) instructs the Method to
save and integrate chromatogram files which are captured from each detector input, and allows
designation of specific calibration schemes if so desired. Default settings and filenames may be
present in the fields in this section, entered in Configuration, or they may be blank.
Figure 8.4 Result Files Definition Fields
Ü To set names for the chromatogram files captured from any active detector(s), click the left button
inside the FILENAME box adjacent to the name of a detector, and type in a path (optional) and
filename up to five characters (the last three characters of the eight-character filename are used for
automatic series numbering). If the current path is to be used, no path entry needs to be made.
These filenames will be assigned to raw chromatogram data files produced when this Method is run.
Every active detector input name must be provided with a valid filename here in order to start the
142
Data Ally Chromatography Manager Operators Manual
Method. Different files can be saved to different paths or disks, if desired. Note that the final three
characters of each filename will ALWAYS be inserted automatically by Data Ally and will overwrite
any characters entered in those positions in the file naming fields..
Ü To set reports to be automatically produced for each detector input at the end of this Method, click
the Reports button at the right of each detector's filename entry field. The Report Set dialog (Figure
8.5) will appear.
Figure 8.5 Report Set Dialog
Up to four different sets/rows of report specifications are shown in this dialog, based on your
configuration settings for this time base. To use any combination of the reports shown, click the
Enable check boxes at left of each report Template field to checkmark those which are to be used in
running and processing this Method. Alternatively, click to uncheck and disable those not needed.
Unchecking each row "grays out" the other items in that row which are not required once that report
has been disabled.
For each enabled/checked report row, click inside the Template field and enter a template *.XLS
filename and path, or click on the adjacent right down arrow selector to see a listing of all report
template files present in the current reports subdirectory. Click to highlight and select the one
desired. If the report is to be saved as an Excel *.XLS file, click inside the Filename field and type a
unique name and path for that report.
To include a separate page printout of the chromatogram information with any report, check the Print
CG checkbox in its row. Also click to check (enable) or uncheck (disable) the Print and Show boxes
for each report.
Repeat the same steps for each different report desired for this Method. When all reports are
entered, click OK to exit, or Cancel to escape with no changes.
Ü To select the Integration program used to identify peaks for each detector input, click inside the
INTEGRATION field for the first active detector name and type in the desired Integration file, which
must exist on disk in the current directory path for this channel. To choose from a selection of all
integration program files found in the current path for this file type, click the down selector arrow at
right of the field - a list of integration filenames in the currently selected integration program path will
appear. Click the desired name to enter it. Repeat this selection for all other inputs which will be
active in this Method - chromatograms from any inputs not assigned an Integration program in this
manner will not be integrated automatically. The Integration file(s) selected will define what types of
reports are created at the end of the Method.
Ü To specify automatic calibration with this Method, if the sample to be run is a standard, click with
the pointer inside the CAL box for any active input name and type in the desired calibration Type
code, which can be either blank (No calibration), N (New calibration), R (Replace calibration for
current level), or A (Average into current calibration).
143
Data Ally Chromatography Manager Operators Manual
NOTE: The CAL field should only be used (have a non-blank entry) if the sample to be run is
a standard which will be used to update an existing Calibration file.
N indicates a new file will be started with this run (all previous data in the calibration file will be
replaced), R means the current calibration level will be replaced beginning with this run, and A
indicates the new standard's response will be added to the existing calibration table. If you specify a
non-blank value in the CAL field, you must also give a level value in the LEV field, which selects the
concentration level to be assigned to the standard material being run. Click in the LEV field and type
in the desired level number.
If you have configured the Method program in this time base without automatic calibration capability,
the Calibration, Lev, and Type fields will be "hidden" and will not be available for programming. You
can still perform manual or Sequence-based calibrations unless these functions have also been
suppressed in Configuration.
Ü To select a Calibration file to be loaded automatically for each input, click inside the CALIBRATION
field for that input and type in the path and filename of any current Calibration file. If an invalid
Calibration filename is entered, an error message will appear when an attempt is made to start the
Method advising that a Calibration file must be initialized and saved. If you intend to use this Method
for quantitative result calculations, you should define a Calibration file for each input, whether the
sample(s) to be run are standards or unknowns. If the Method will process a standard, the standard
at the assigned LEV will be used to increment the assigned CALIBRATION filename automatically as
defined in CAL. If the Method will run an unknown, the Calibration filename in CALIBRATION will be
automatically loaded and that file will be used to compute the results for the unknown.
You have now provided the Method with all the essential instructions for acquiring and processing
new chromatograms. Your Method could be run at this time by simply clicking on the RUN
SoftButton at the lower left. There are, of course, additional parameters, settings, and commands
you may wish to use, which are accessed by the buttons at the bottom of the screen.
8.3.0 Events Table
Ü To show the Method Events Table, click on the EVENTS TABLE button at bottom right. The
screen will change to a horizontally split orientation (Figure 8.6) with a working Graph window at the
top and a table on the bottom.
Figure 8.6 Method Events Table
8.3.1 Events Table Functions
The Events Table is generally displayed along with a Graph window so that many graphical features
for modifying the table entries can be conveniently used. The top Graph window is exactly the same
as the full screen Graph accessed by clicking the GRAPH SoftButton, and can be used for both real-
144
Data Ally Chromatography Manager Operators Manual
time chromatogram display while a Method is running, or for loading, reviewing, and editing
chromatograms when idle. Either the Graph or the Table window can be made active by clicking the
pointer anywhere inside either window. The Command Menu bar will change depending upon which
window is currently active. Either the Graph or Events window can be resized using Windows
conventions or moved around on the display at any time as desired.
The Events Table itself, like all other Data Ally tables, is a "spreadsheet" consisting of an expandable
set of columns and rows. At the top of the Events Table is a special header line consisting of a set of
"buttons" holding the name of each column entry. The selection of buttons present is defined in
Configuration. Each button represents one parameter which can be controlled by the Method from
the table, usually on a time basis according to the entry in the TIME column. When each channel is
configured, only the types of columns which will actually be relevant to that channel's instruments and
applications should be included in the Events Table. The order in the table and column sizes for
each column button can be set in the Events Table screen as described below.
Programming a Method which includes control of various instruments or relay flags, time dependent
responses to various conditions, or other time dependent events such as Zone Codes is performed
by completing rows and columns in the Events Table. Each event which occurs at a specific time in
the Method run is normally entered on a separate line labeled with that time value. If more than one
type of event or setting is associated with a single time value, several columns may have entries in
the single row corresponding to that time.
As a "spreadsheet", the Events Table acts like and can be edited like other types of spreadsheets
found in other software applications. A series of buttons along the bottom edge of the table assists in
performing spreadsheet operations such as inserting, copying, cutting, and pasting lines or ranges.
An extensive set of "Fill" functions can be used to automatically enter lines and/or values into the
table, and the interactive graphical editing tools permit fast and simple changes to any table
parameter(s).
Whenever the Events Table is displayed, one "cell" is always highlighted, corresponding to the
current "editing cell" into which entries can be made. The edit cell can be moved anywhere in the
table by moving the cursor pointer to the desired cell and clicking the right mouse button.
Alternatively, the <ENTER> or <TAB> key can be used to move the edit cell highlight across each
line in the table column by column, from left to right. Pressing <ENTER> at the end of the last
existing row in the table will cause a new blank row to be added.
Each row or horizontal line in the Table automatically receives a line number which appears in the
column at far left. This column can be used not only as a guide when writing or editing Method
programs, but also to disable any individual line(s) during Method execution.
Within each cell, you can place the vertical bar cursor to change the entry at any desired character,
and the left and right arrow keys can be used to "step" through characters in any entry one character
at a time.
When a Method is running and its Events Table is being executed, the current line being processed,
or the last line which was processed, is "highlighted" in the table. The view of the table will
automatically be adjusted so that the "highlighted" current line is always approximately two lines from
the top line shown in the table window, as the highlight moves down through all the events lines. You
can use the vertical scroll bar, or the PgUp/PgDn or CTRL-PgUp/CTRL-PgDn functions to move
around in the Events Table while it is running. In order to change a running Method, you must either
STOP the Method or wait until its DURATION has elapsed and it stops automatically.
8.3.2 Events Table Column Parameters
The Events Table parameters which may be selected as headers for table columns during
Configuration are listed below. In most cases, all available parameters will not be used in any one
145
Data Ally Chromatography Manager Operators Manual
Table. Some parameters are appropriate only for certain types of instrumentation. Certain items
such as TIME must always be present in the table, and these items are listed as "non-configurable".
Note that the actual names for each functional column in the Events Table, along with the widths,
colors, and order of those buttons/columns in the table, can be modified in Configuration.
You can easily re-order the columns in the Events Table from left to right or change their individual
widths at any time. Both the column order and widths are set as defaults in Configuration.
To move a column to another position in the table, simply place the pointer cursor on that column's
header button, hold down the left mouse button, and "drag" the header button left or right to the new
desired position relative to the other columns. When the pointer is in the desired position, release the
mouse button and the entire column will be moved, and the table redrawn accordingly. Modifying the
order of columns may make certain types of table editing or review easier by allowing placement of
all columns currently being manipulated in view on a single screen - you can easily move
"unimportant" column information to the right and off of the displayed table window area.
To change the width of any individual column, move the pointer cursor to the border of its header
button and the next column header button in the direction in which you wish to expand or reduce the
column width. The cursor will become a "double-sided horizontal arrow" (ç |è ); when this change
occurs, immediately hold down the left mouse button and move the arrow cursor in the direction you
wish the button edge to expand or contract. When the desired column width is indicated by the
position of the cursor, release the mouse button and the column will be resized and the entire table
redrawn accordingly. This feature permits you to match the exact sizing of each column to the
expected character width of the entries expected in that column - you can also effectively "remove"
certain columns without actually eliminating them from the table by reducing their widths to a very
small size.
Ü To directly enter a value into any cell in the table, simply click inside that cell so that it becomes
highlighted and the vertical entry bar cursor appears. Then type in the desired information. If you
wish to delete the entire previous entry, double-click the left mouse button with the entry bar inside
the desired cell, so that the entire entry becomes highlighted - typing the first character of the new
entry will cause the old entry to be completely deleted.
Available parameters in the Table are:
• TIME: (Non-Configurable) This specifies the time for each event or action in each row to occur.
Every active row in the table must have a TIME value specified. TIME is entered as a value of
minutes or seconds (a numerical value followed by a units designator code). If no units code is
given, the units assigned to the previous entry are retained.
Ü To edit TIME, click the left mouse button with the pointer cursor inside any cell in the TIME
column and type in the desired entry and units code. This column can also be edited using the
AutoFill functions or graphical entry of controllable column parameters (see below).
• %PUMPA, %PUMPB, %PUMPC, %PUMPD: (Configurable, HPLC Channel only): The %PumpX
columns set relative mixing percentages for from two to four pumps running simultaneously for
gradient HPLC. These columns are only included in the Table based on the number of
controllable HPLC pumps actually connected in this channel. Entries in each column are in
percent, from 0 to 100. The system automatically adjusts entries into each of the columns so
that the total per cent for all pumps is always 100%. The entries made in all the %X columns in
the table are plotted on the channel's current Graph window if the Graph/Display commands are
set accordingly.
When the Events Table is executed during a Method, the software sets all pumps as required at
each time point when it finds a command to change any pump. Between the previous command
and the next command, the system assumes changes in the pump status/gradient will be linear
in nature, and ramps between time dependent states in a linear fashion.
146
Data Ally Chromatography Manager Operators Manual
Ü To edit any of the %PUMPX fields, click the left mouse button with the pointer cursor inside any
cell in any of these columns and type in the desired value in per cent. If certain pumps are not
used in certain Methods, their columns can be left blank. These columns cannot be edited using
the AutoFill function. As soon as an entry is made and "entered" by pressing ENTER, CTRLarrow, or TAB, or you click in any other cell in the Table, the entire row immediately updates as
the system forces all pump % column entries accordingly to maintain a total of 100%.
• FLOW: (Configurable, HPLC or GC) This sets the total flow of solvent in either an HPLC or GC
system. FLOW values in any column cells must be within the limits specified in Configuration for
the Pump or GC in this channel, and are generally entered in the units specified in Configuration.
When the system encounters FLOW settings, it always assumes that changes from one flow
value to the next value encountered are done linearly.
Ü To edit the FLOW field, click the left mouse button with the pointer cursor inside any cell in the
FLOW column and type in the desired value and units code. Units can be ml/min, ml/sec, etc.
If no units code is entered, the units designation for the previous entry is used. This column can
also be edited using the AutoFill function (see below).
• FOUT: (Configurable) This column sets utilization of any external output relays or contact
closures available in the Communications Processor dedicated to this channel, and defined in
Configuration. Normally, each configured output relay flag is given a name identifier during
Configuration to make it more convenient to program each flag in the Events Table. A flag is
entered either by typing its number into the FOUT column. One flag can be used as many times,
in as many different rows, as desired in a single Events Table program; any single FOUT column
cell can contain multiple flag entries.
Ü To edit the FOUT field, click the left mouse button with the pointer cursor inside any cell in the
FOUT column and type in the desired flag number.
Each time a flag number code is entered, the flag assumes the "polarity" defined for it during
Configuration (High or Low = Closed or Open contact). If polarity is set high for a flag, that flag
contact will close when it is executed and remain closed until it is defeated via a second later
entry of the same flag in the Events Table. Polarity for flags can only be changed via
Configuration. The time duration for each flag execution is adjusted automatically by Data Ally.
You can also use AutoFill editing (below) to change FOUT column entries.
• FIN: (Configurable) This column sets utilization of any external input relays or contact closures
available in the Communications Processor dedicated to this channel, and defined in
Configuration. Normally, each configured input relay flag is given a name identifier during
Configuration to make it more convenient to program each flag in the Events Table. A flag is
entered by typing its code (S or 1 through 3) into the FIN column. One flag can be used as many
times, in as many different rows, as desired in a single Events Table program. The S input flag is
usually reserved for remote start of the data system from a contact closure from another device.
Ü To edit the FIN field, click the left mouse button with the pointer cursor inside any cell in the FIN
column and type in the desired name and/or flag code. As for FOUT, the FIN column can be
modified using AutoFill editing (see below).
Each flag entry assumes the "polarity" defined for it during Configuration (High or Low = Closed
or Open contact). If polarity is high, a flag will cause the system to "hold" execution if the contact
being read is open, and the flag will execute and "unhold" when the contact closes. Note that the
time each flag is executed is adjusted automatically.
147
Data Ally Chromatography Manager Operators Manual
In the most typical case, you can program the Events Table to use input flag S, Remote Start, to
start the Method from an external contact closure by entering "S" into the FIN column at TIME = 1
sec or greater in a Method. Sensing the contact closure will produce the same result as clicking
on the RUN SoftButton. A hold-to-inject flag should not be entered at TIME = 0.
• ZONE: (Configurable) This permits entry of integration zone codes such as ON/OFF to be
executed directly from the timed events table.
Ü To edit the ZONE field, click the left mouse button with the pointer cursor inside any cell in the
ZONE column and type in the desired zone code.
• COMMENT: (Configurable) This permits entry of row-specific comments as part of the Events
Table. It is often useful to include remarks or comments describing each step in the table as an
aid to later understanding of how and why the table was created.
Ü To enter text into the COMMENTS column, click inside the column and type the desired entry,
or edit the previous entry.
Other columns may be added to the Events Table as required for certain special instrument control
interfaces, such as electrochemical detectors (as in Figure 8.6).
8.3.3 Entering Events Table Parameters
There are three ways to enter values for any parameter into the Events Table:
1. Move the pointer into any "cell" in the table and click so that the highlight and the vertical bar entry
cursor are moved into that cell. Then, type any desired entry into the cell directly, or, if appropriate,
click on the right arrow button to view a listing of all possible entries from which the desired item can
be chosen. To move to any other cell, either point to a different cell and click the left mouse button,
or press the ENTER key to move the highlight from cell to cell, left to right, and then downward row
by row until the desired cell is reached.
2. Copy information from an already entered row into a new row using the COPY and PASTE
commands. To copy a row, move the pointer to the row to be copied, and click the left button to
place the highlight in that row. Click on the COPY button to make a copy of the highlighted row.
Now, move the pointer to the row just below where you want to insert the copied row, and click
anywhere in that row to place the highlight. Click the left mouse button on PASTE, and the copied
row will be pasted in as a new line above the highlighted row. You can now make any other changes
to the new row by directly entering those changes into each cell.
3. Fill information into any column in the table using the FILL button below the table. The FILL
function is a convenient way to fill any table column with a series of entries based on one or more
entries already made, or to compute and enter a new series, freeing you from the need to manually
type in those entries.
8.3.3.1 Using the FILL Functions
AutoFill operations are performed on one column in the table at a time.
To fill entries into a column, click inside the top cell in that column or the cell containing the entry on
which other row values in the column are to be based. Normally a value must be inserted in the
column cell as a basis for fill operations. The AutoFill dialog box (Figure 8.7) will appear.
148
Data Ally Chromatography Manager Operators Manual
Figure 8.7 AutoFill Dialog for Events Table Time Column
The AutoFill dialog contains three sets of selections: the "Operation" or mechanism of filling on the
top portion, the extent or range of filling desired in the middle portion, and special Options for filling in
the lower portion.
There are two filling Operations, all of which proceed from the specified Starting Row to the Ending
Row:
• "Duplicate" - copy the entry value in the highlighted row of the current column into a range of
column cells beginning either after the Current Cell, from the Start of Table, or at any Specified
row number, into all the cells in that column until either the Next Entry (next row with a non-blank
cell), the End of Table, or any Specified row number. You can also specify the total Number of
Steps/cells, set a range for copying based on row time designations via First and Last Times, or
overwrite current information in the range of cells specified by setting the appropriate Options.
• "Increment" - increment (or decrement) the value in the highlighted row of the current column by
the "Step Value" and copy it into the next row, beginning with the Current Cell or at any Specified
row number, and proceeding with consecutive increments until either the "No. of Steps" value is
met ("End of Table") or until the next existing entry is found in the column ("Next Entry"). If the
"No. of Steps" value requires that new lines be added before the end of the table or the next
entry, respectively, new lines will be inserted if the "Allow Insertions" option is checked.
The Increment function can also be used in a "force" mode to automatically compute and fill row
values with evenly-spaced increments between two consecutive row entries, or between all sets
of consecutive row entries in the entire table. For "forcing", no Step Value is given; this causes
the system to find the next consecutive column row entry from the starting point, compute the
difference between the highlighted (start) and next entries, divide this difference by the number of
empty lines between the two entries, and fill numbers into all intervening rows in even
increments.
Note that in most cases the highlighted row must be on the "basis" value to define filling before the
AutoFill dialog box is used. If a blank cell is highlighted at the time of fill selection, a blank value
(empty) will be filled into the defined range in "Duplicate" mode, and "Increment" mode cannot be
used.
Table columns which have numerical entries (e.g. TIME, FLOW) will have the "Increment" function
available in their AutoFill dialogs. Columns with non-numerical entries (e.g. FOUT, FIN, COMMENT)
will have only the "Duplicate" mode available. Because many instrument control columns include
149
Data Ally Chromatography Manager Operators Manual
automatic "ramping" of values linearly between consecutive entries (such as %X, FLOW, or OVEN),
filling of intermediate values is not necessary to set gradient functions.
There are four general "ranges" for filling functions:
• (Start Row) "Current Cell"/(End Row) "To Next Entry" - this selection will cause filling in the
selected mode based upon the highlighted cell value into existing or newly-inserted blank lines up
to the next currently-existing entry in the column.
• (Start Row) "Current Cell"/(End Row) "End of Table" - this selection will cause filling of entries
into all remaining rows in the current column, based on the highlighted cell, according to the
mode selected and the value set for "No. of Steps".
• (Start Row) "Start of Table"/(End Row) "To Next Entry" - this selection will cause filling in the
selected mode from the first row in the current column into existing or newly-inserted blank lines
up to the next currently-existing entry in the column. If the highlighted cell is in the top row of the
column when this command is used, its effect is identical to that of the "Current Cell" to "To Next
Entry" range. This setting is most appropriate when using the "Fill From Graph" mode for Zone
Code entries.
• (Start Row) "Start of Table"/(End Row) "End of Table" - this selection will cause filling of entries
ranging from the first column row to the end of the table, according to the mode selected and the
values set for "No. of Steps". If the highlighted cell is in the top row of the table when this
command is used, its effect is identical to that of the "Current Cell" to "End of Table" range.
This setting is most suitable when using the "Fill From Graph" mode for Zone Codes.
• (Start Row) "Start of Table"/(End Row) "Specify" - this selection will cause filling of entries from
the current highlighted cell (at start of table) to a specified row number.
The "qualifying" commands and fields at the bottom of the AutoFill dialog provide great flexibility for
the filling functions. These are:
• "Step Value" - when in Increment mode, this field sets the value, in units corresponding to the
current column, by which the highlighted basis cell is to be incremented or decremented. If this
value is not given during an increment operation between two existing entries in a column, the
system will automatically compute and "force" a series of evenly-incremented values in empty or
newly inserted rows between those entries.
• "No. of Steps" - when in Duplicate, Increment, or Fill From Graph modes, this field sets a limit to
the number of rows in the current column which are to be filled with new values. If the number of
existing empty rows in the specified range exceeds the "No. of Steps" value, only part of that
range will be filled; if the "No. of Steps" value exceeds the number of existing empty rows, new
rows will be added to the table and filled as specified (provided "Allow Row Insertions" is
enabled).
• "First Time" - in Fill From Graph mode, this field allows selection of any starting time for filling a
new or existing Events table with Zone Codes, other than the normal time = 0 start. This permits
only a partial set of timed zone codes to be automatically filled in any one fill cycle.
• "Last Time" - in Fill From Graph mode, this field allows selection of any ending time for filling a
new or existing Events table with Zone Codes, other than the normal "end of table" end. This
permits only a partial set of timed zone codes to be automatically filled in any one fill cycle.
• "Allow Insertions" - this checkbox command, if checked, allows automatic insertion and filling of
new rows in an existing table if this is necessary to meet the "No. of Steps" criteria in a
Duplicate, Increment, or Fill From Graph operation.
150
Data Ally Chromatography Manager Operators Manual
• "Allow Progressions" - this checkbox command, if checked, allows values in column cells below
the base (start) cell to be employed for filling subsequent rows or for "forcing" values of
intermediate rows.
• "Allow Overwrites" - this checkbox command, if checked, allows replacement of existing values in
rows in the current table with new values over the selected range in any filling mode.
You can choose various combinations of options in the AutoFill dialog as described below to
accomplish the following tasks (click on OK after setting up the Fill dialog as directed):
Ü To fill an existing row's value into all currently empty rows in the column up to the next entry,
place the edit highlight on the "basis" row, click FILL to see the AutoFill dialog, select "Duplicate",
"Current Cell", and "To Next Entry", with all other fields and options blank/off. If the "basis" row is the
first row in the column, you can select "Start of Table" instead of "Current Cell" without highlighting
the basis row.
Ü To fill an existing row's value into all currently empty rows in the entire column, place the edit
highlight on the "basis" row, click FILL to see the AutoFill dialog, select "Duplicate",
"Current Cell", and "End of Table", with all other fields and options blank/off.
Ü To fill an existing row's value into more or less empty rows than the number of empty rows found in
the current column up to the next entry, place the edit highlight on the "basis" row, click FILL to see
the AutoFill dialog, select "Duplicate", "Current Cell", and "To Next Entry". Type the actual number of
empty rows to be filled into the "No. of Steps" column, with all other fields and options blank/off. If the
"No. of Steps" value exceeds the number of actual intervening empty rows, sufficient new rows will be
added and filled to meet the "No. of Steps" criteria.
Ü To fill all currently empty series of consecutive rows in the column with the values found in the rows
prior to each empty group of rows, click FILL to see the AutoFill dialog, select "Duplicate",
"Start of Table", "End of Table", and "Allow Progressions" with all other fields and options blank/off.
Ü To overwrite existing values (along with any blank rows) with duplicated values in an entire column,
place the edit highlight on the "basis" row for copying, click FILL to see the AutoFill dialog, select
"Duplicate", "Current Cell", and "End of Table", and check the "Allow Overwrites" command, with all
other fields and options blank/off.
Ü To clear (remove) existing values in an entire column, insert a blank row at the beginning of the
table, place the edit highlight on that row, click FILL to see the AutoFill dialog, select "Duplicate",
"Current Cell", and "End of Table", and check the "Allow Overwrites" command.
Ü To overwrite existing values in a portion of a column with a duplicated value, place the edit highlight
on the "basis" row for copying, click FILL to see the AutoFill dialog, select "Duplicate", "Current Cell",
"End of Table", and "Allow Overwrites", and enter a "No. of Steps" value corresponding to the number
of existing rows to be filled with duplicates. All other fields and options should be blank/off. If the
number of steps exceeds the number of blank rows in the column, the "Allow Insertions" box must be
checked to add sufficient rows to meet the "No. of Steps" criteria.
Ü To clear (remove) existing values in a portion of a column, insert a blank row at the beginning of the
range to be cleared (or remove an existing row entry), place the edit highlight on that row, click FILL
to see the AutoFill dialog, select "Duplicate", "Current Cell", "End of Table", and "Allow Overwrites",
and enter a "No. of Steps" value corresponding to the number of existing rows to be cleared (filled
with a blank entry). If the number of steps exceeds the number of blank rows in the column, the
"Allow Insertions" box must be checked to add sufficient rows to meet the "No. of Steps" criteria.
151
Data Ally Chromatography Manager Operators Manual
Ü To fill a column in a new table with incremented values, enter the beginning "basis" value in the first
row, place the edit highlight on that row, click FILL to see the AutoFill dialog, select "Increment",
"Current Cell", and "End of Table", enter the increment value in the "Increment" field, and enter the
number of rows for which incremented values are to be inserted in the "No. of Steps" field.
Ü To fill a column with incremented values in blank rows up to the next existing entry, place the edit
highlight on the "basis" row, click FILL to see the AutoFill dialog, select "Increment", "Current Cell",
and "To Next Entry", and enter the increment value in the "Increment" field; leave other fields and
options blank/off.
Ü To fill an existing row's incremented value into more or less empty rows than the number of empty
rows found in the current column up to the next entry, place the edit highlight on the "basis" row, click
FILL to see the AutoFill dialog, select "Increment", "Current Cell", and "To Next Entry". Type the
increment value into the "Increment" field, and the actual number of empty rows to be
filled/incremented into the "No. of Steps" column, with all other fields and options blank/off. If the "No.
of Steps" value exceeds the number of actual intervening empty rows, sufficient new rows will be
added and filled to meet the "No. of Steps" criteria.
Ü To fill all currently empty series of consecutive rows in the column with incremented values based
on the rows prior to each empty group of rows, click FILL to see the AutoFill dialog, select
"Increment", "Start of Table", "End of Table", and "Allow Progressions". Type the increment step
value for each row into the "Increment" field, with all other fields and options blank/off.
Ü To fill a column with incremented values in all blank rows based on an existing entry, place the edit
highlight on the "basis" row, click FILL to see the AutoFill dialog, select "Increment", "Current Cell",
and "End of Table", and enter the increment value in the "Increment" field; leave other fields and
options blank/off.
Ü To fill a range of rows with evenly-spaced, automatically computed values, with each row's value
corresponding to the difference between the basis cell's value and the value of the next row having a
non-blank entry in the column divided by the number of intervening rows, place the edit highlight on
the "basis" cell (first row in the range), click FILL to see the AutoFill dialog, select "Increment",
"Current Cell", and "To Next Entry". If you wish to fill only the existing number of blank intervening
rows, leave the "No. of Steps" field and all other commands blank/off. If you wish to fill either only
some of the intervening rows, or to add new intervening rows, enter a number in the "No. of Steps"
field specifying the total number of intervening rows to be filled. If "No. of Steps" exceeds the number
of existing blank lines in the range, you must check the "Allow Insertions" box to automatically add
and fill sufficient lines to match the "No. of Steps" entry.
Ü To fill all existing ranges of empty rows in the column with evenly-spaced, automatically computed
values, with each filled row's value corresponding to the difference between the value of the cell
immediately preceding that range and the value of the next row having a non-blank entry following
the range divided by the number of intervening rows, click FILL to see the AutoFill dialog, select
"Increment", "Start of Table", "End of Table", and "Allow Progressions". Leave all other selections
blank/off.
Ü To overwrite existing values (along with any blank rows) with incremented values in an entire
column, place the edit highlight on the "basis" row for incrementing, click FILL to see the AutoFill
dialog, select "Increment", "Current Cell", and "End of Table", enter the increment value in the
"Increment" field, and check the "Allow Overwrites" command, with all other fields and options
blank/off.
Ü To overwrite existing values in a portion of a column with incremented values, place the edit
highlight on the "basis" row for copying, click FILL to see the AutoFill dialog, select "Increment",
"Current Cell", "End of Table", and "Allow Overwrites", enter the increment value in the "Increment"
field, and enter a "No. of Steps" value corresponding to the number of existing rows to be filled with
duplicates. All other fields and options should be blank/off. If the number of steps exceeds the
152
Data Ally Chromatography Manager Operators Manual
number of blank rows in the column, the "Allow Insertions" box must be checked to add sufficient
rows to meet the "No. of Steps" criteria.
Use of AutoFill commands will only overwrite existing cell entries in any table if you have checked the
"Allow Overwrites" option checkbox.
After using the automatic fill function, you can of course make any desired changes in any of the filled
times before saving the Method program and its Events Table. The FILL feature can be used
repeatedly to set up any series of table columns.
8.3.3.2 Method Change Restrictions
Every change made in a current Method screen in any channel is preserved until one of the following
occurs:
• Another change is made to that parameter or value by any available means.
• The Method is overwritten by loading a new Method with the Files/Load command.
• The Method is cleared and the default Method loaded with the Files/Clear command.
Before modifying or overwriting a Method, you should save any changes to that Method using the
same Method name or as a different Method. Each time you attempt to overwrite a previous Method
by resaving it using the same filename, a "trap" message will appear prompting you to confirm that
you wish to replace the old Method.
8.4.0 Manual Operation
After you click on RUN to begin a Method, the instructions in the Method program will control the
entire operation of the channel while that Method is in process. It is possible to interrupt or override
the programmed control in several ways, which permits you to make changes in the executing
Method in real time, to manually operate any controllable instrumentation such as HPLC pumps, or to
"pause" or "hold" the Method for any length of time until you are ready to proceed.
While a Method is running, you have access to changing any time-dependent steps or events in the
Events Table. However, you cannot change the commands and parameters set in the "top-level"
Method dialog after a Method has begun to execute.
8.4.1 Hold Function
When a Method starts, you can observe its progress by viewing the Graph screen, with any display
criteria desired, or you can select either the "top-level" Method screen or the Method Events Table
screen with its companion upper Graph window. If you have configured the top level method to
display information such as actual signal values for operating detectors, or current wavelength
values, these will be shown in real time in the appropriate fields - if the Status Box is active in the
current channel's Graph screen, it can also be viewed while observing the top-level Method. The
Events Table screen will show both the Graph window with the chromatogram(s) currently being
acquired and Status Box, and the course of execution of any lines and events listed in the table. As
the Method proceeds, the table lines will "index" downward with a "highlight" on the currently
processed row. At any time during a Method, you can use the scroll bars in the Events Table to
change the display to see any line(s), whether or not they have already been executed. The
"running" highlight will remain on the current (last executed) line as a constant indicator of the
position of that line in the Events Table.
The HOLD button at the bottom of the Events Table can be used to "pause" the Method at any time.
153
Data Ally Chromatography Manager Operators Manual
Ü To hold or pause the Method at its current status, click the HOLD button. If the Status Box is
active, its registers will remain active, but all its status indicators except for time and signal input
values should remain constant during the hold.
Ü To clear a hold and proceed with the current Method program, click on the HOLD button again.
The Method will automatically resume its programmed status at the now current time - this may
require rapid execution or even skipping of some number of programmed lines in the Events Table to
"catch up" to the programmed state of the system for the present time. Data Ally will attempt to
execute all delayed rows in the Events Table as quickly as possible after a hold is cleared.
Normally the timer will continue to run during a hold, unless the hold is generated by an Input flag
such as "wait for injection". This is because even if you wish to temporarily stop further execution of
a Method program, it is important to have a valid record of overall elapsed time once the sample is on
the column.
8.5.0 Working with Method Files
The Method program filing system permits you to save and recall complete Methods quickly and
easily. The Method screen display, comprising both the top-level dialog box and the Events Table, is
configured as a "template" to show information about the current chromatogram acquisition and
processing instructions loaded into the channel being observed. This template can be edited using
many graphical and other tools to change its contents. The contents of the Method screen display
can be saved as a "Method" file, with a unique filename and description, so that it can be recalled and
reused at any future time either manually, or as part of an automated Sequence of Methods.
The default Method file, whose name is assigned during Configuration, is always loaded
automatically into the Method display screen at the time Data Ally is initialized. You can change any
aspects of the default file, including its Events Table, within the active software, except for the
features and options which are either "fixed" or "removed" in the Configuration. These items can, of
course, also be reset or restored, but the channel must be disabled and a re-Configuration performed
to accomplish this.
The Files commands in the Method Command Menu bar (Figure 8.8) are used to load, save, clear,
and delete Method program files.
Figure 8.8 Method Files Commands Submenu
8.5.1 Loading Methods
Ü To load a saved Method file from disk memory into the current channel, click the left mouse button
on Files in the Command menu bar, and then click on Load. A directory dialog box will appear
(Figure 8.9) which lists the Method files (*.MET) available in the current directory path for this
channel. If any Description has been entered for individual Methods, this information will appear at
the bottom of the directory dialog. Select the desired disk, path, and file by clicking on the desired list
items, or by typing the path/filename directly into the entry box. Click on OK to load the new file.
154
Data Ally Chromatography Manager Operators Manual
Figure 8.9 Method Files/Load Dialog
If the previous file has been edited and has not been saved or resaved, an information message will
appear before the new file is loaded asking if the previous file should be saved. If so, click on YES
and assign either the same filename or a new name as desired. If you do not wish to save the edited
file, click on NO to proceed. If you are operating in GLP Mode and the previous Method file was used
to generate or reprocess chromatograms, you will be forced to save this file if it was not saved before
in its current state, before a new Method file can be loaded. When a new file is loaded, it will
overwrite the previous Method file.
Load Default File: The Load Default File command causes loading of the Method file defined as the
default method in Configuration (see Section 5.2.5.2). Since the default Method file, like all Data Ally
defaults, is a "read-only" file, it cannot be changed and resaved, unless the system is reconfigured.
Use the Load Default File command to restore the default method whenever you wish, regardless of
what other Methods are saved and/or loaded in the current time base.
8.5.2 Clearing Methods
The Clear command allows all entries from the Method Events Table to be cleared in one step.
Global parameters in the top-level Method dialog must be individually deleted.
Ü To clear the current Method Events Table, click on File in the Command Menu bar and then click
on Clear. A trap message will appear asking you to confirm the clear (Figure 8.10). Click OK, and
the Events Table will be cleared. If the previous file has been edited and has not been saved or
resaved, an information message will appear before the table is cleared asking if the previous file
should be saved. If so, click on YES and assign either the same filename or a new name as desired.
If you do not wish to save the edited file, click on NO to proceed.
155
Data Ally Chromatography Manager Operators Manual
Figure 8.10 Clearing Method Events Table
8.5.3 Saving Methods
Ü To save a Method file, click on Files in the Command Menu bar, and then click on Save.
The Method will be resaved under its current name. A new version number will be assigned and the
date/time of save and current operator name will be recorded.
Ü To save a Method with a new name, click on Files and then Save As. The Save dialog box will
appear (Figure 8.11). Click inside the filename entry field and type in the desired new filename. If
you wish, click inside the DESCRIPTION field and type a description of the new file, which may help
identify this file in the directory listing for future recall. When the correct name and description
appear, click on OK to save the file to the current disk path. If another file already exists in that path
with the same name, an error message will instruct you to change the filename before saving.
Figure 8.11 Method File/SaveAs Dialog
It is recommended that Method program files saved to disk be "backed up" by simply copying the
*.MET files to a floppy disk, removable hard disk, or tape and preserving the copies in a secure
place. If modifications are routinely made to the library of *.MET files, backups should occur at
routine intervals or even on a daily basis.
8.5.4 Deleting Methods
Use the Windows File Manager Delete function to delete any Data Ally *.met files which are no longer
useful.
156
Data Ally Chromatography Manager Operators Manual
8.5.5 Printing Methods
Ü To print a summary of the current Method file, click on Print Method in the File submenu - the
Reporting status window (Figure 8.12) will appear. This window indicates which Method file (the
default method is part of the configuration *.cfg file) is currently loaded, the report template file
configured for printing the method summary, and any configured saved report name.
Figure 8.12 Reporting Status Window
The method file printing template saved as \reports\met\met.xls can be modified as desired by using
Excel (see Section 13).
157
Data Ally Chromatography Manager Operators Manual
9.0 Integration Screen: Finding and Identifying Peaks
The Integration program screen, which can be viewed by clicking on the INTEGRATE button on the
left SoftButton bar, contains the instructions required for finding peaks during integration of
chromatograms, and for identifying individual peaks based on retention times, peak referencing, and
other information. It also specifies the type(s) of reports to be prepared after each chromatogram file
is processed. You may wish to rename the Integration screen SoftButton "Peak Ident." to clarify its
true function for other operators.
Like the other Data Ally programming screens, the Integration screen display should be considered
as a "window" showing one portion of the overall software settings utilized in and associated with the
current channel. The contents of the Integration screen are in two sections: the so-called "top-level"
dialog box, which includes global parameters, and the Peak Table, which comprises a listing of
assigned peaks and their identification criteria. Both sections are contained in a single Integration
program file.
The values associated with each of the Integration screen fields have defaults which are set during
Configuration. Also, various options can be enabled or disabled in both the top-level dialog box and
the Peak Table based on the Configuration. Each user can modify all parts of the Integration
program screen and save as many modified versions as desired as unique "Integration program
files", which have the file extension code ".INT". To distinguish Integration files appropriate for one
configured channel from those for a different channel, each channel usually employs a separate
directory path for archiving of its program files, that path being assigned during Configuration.
Since the parameters associated with the Integration screen and its Peak Table are essential for
identifying peaks, all Data Ally Calibration files are constructed based upon already-defined
Integration files. Therefore, a valid Integration file and Peak Table must always be generated for a
given chromatogram type before any calibration and quantitations can be done. One Integration file
can have an unlimited number of independent and separate Calibration files which use it as a
reference, but each Calibration file can have only one Integration file upon which it is based.
9.1.0 Top-Level Integration Screen
The top level Integration screen (Figure 9.1) is used to name the Integration file, to set the global
integration algorithm for that file, to specify options for peak finding and calibration, and to select the
names and types of reports to be created after processing chromatograms automatically. A large
button at the bottom of the screen is used to switch to a view of the Peak Table portion of the
Integration file. A second button is used to enter Comments describing the nature of the Integration
file.
Figure 9.1 Top Level Integration Screen
158
Data Ally Chromatography Manager Operators Manual
9.1.1 File Identification
Like Methods, the filename for the current Integration program file is defined when the file is saved,
and is shown in the top window bar. When each channel is first initialized, its Integration screen will
display the contents of the default Integration file which has been defined in Configuration using the
default file name. If you wish to change any of the information in the Integration screen, you can save
the modified Integration file using the same default file name, or as a new file with any desired file
name. The extension for filenames of all Integration files is always .INT; only .INT files will be shown
in the Integration file directory system and only .INT files can be loaded into the Integration screen.
Descriptions of Integration files can be entered at the time the Save As command is used (see
Section 9.3.3).
9.1.2 Integration Algorithm
The center portion of the top-level Integration dialog box is portioned into three "boxed" sections.
The section on the right labeled "INTEGRATION ALGORITHM" lists a series of entry boxes for the
values of each of the integration algorithm settings (Figure 9.2). When the default Integration file is
loaded, the values shown in these fields are those assigned as defaults in Configuration. They can,
of course, be changed in any way by directly entering new values, or by replacing existing values
during manual integration in the Graph screen (which causes the current entries in the ALGORITHM
PARAMETERS box to change accordingly).
NOTE: You may click on “Automatic” to have the software try to determine the appropriate
integration parameters. If you are not satisfied with the results, you may then adjust them as needed.
Figure 9.2 Integration Algorithm Parameter Fields
9.1.2.1 Algorithm Parameters
The Integration Algorithm parameters are defined as:
Slope Sensitivity: The value of baseline slope (first derivative) at which the integrator
determines the start of (positive value on leading edge) or the end of (negative value on
trailing edge) a peak. Beginning and end points of peaks are detected as the first point or
bunch of points found at which the slope drops below this slope threshold value (Figure 9.4).
The default range for slope sensitivity is zero to 1,000,000 microvolts/sec, or zero to 1
Volt/sec. As the value for slope sensitivity decreases, the sensitivity of finding peaks
increases, and smaller or broader peaks are detected.
159
Data Ally Chromatography Manager Operators Manual
Figure 9.3 Use of Slope Sensitivity Parameter
Slope Interval: The number of consecutive bunched points which are analyzed for each
slope/derivative computation when analyzing baseline slope. If the slope interval increases,
the sensitivity of finding peaks decreases, since slopes are averaged over larger ranges of
signal values. The default range for slope interval is 1 to 100 points.
Slope interval can also be expressed in time units (sec or min) if desired.
Baseline Drift: The maximum positive or negative slope possible for baseline drawn under
single peaks or groups of co-eluting peaks (Figure 9.4). Baseline drift is often used to limit
the integrator in situations where valley-to-valley baselines might be drawn for a series of
peaks, in order to force a flatter overall baseline. The default range for baseline drift is zero
to 1,000,000 microvolts/sec, or zero to 1 Volt/sec. As baseline drift value decreases, flatter,
more horizontal baselines are forced underneath regions of co-eluting peaks.
Figure 9.4 Use of Baseline Drift Parameter
Noise Reject: The noise reject parameter is not functional in v. 1.00.
Minimum Height: The height threshold which must be exceeded for any peak to be detected.
The default range for minimum height is zero (no threshold) to 1,000,000 microvolts. This
threshold value is expressed as the height of each peak above the apparent baseline. If its
value is set at zero, all peaks of any height can be detected and reported.
160
Data Ally Chromatography Manager Operators Manual
Minimum Width: The minimum number of points, or minimum time value, for the width of
any detected peak at baseline. Peaks which do not exceed this setting will not be reported.
The default range for minimum width is 3 points to 1,000,000 points. This value can also be
expressed as time in min or sec.
Minimum Area: The area threshold which must be exceeded for a peak to be detected and
reported. The default range for minimum area is zero (no threshold) to 10,000,000 microvoltsec. If this value is set at zero, all peaks of any area can be detected and reported.
Drop Ratio: The drop ratio parameter is not functional in the current version.
9.1.2.2 How Integration is Performed
When a chromatogram is integrated manually, or automatically during Method execution, a global
integration algorithm is executed which makes use of the algorithm parameters found in the
Integration screen dialog box. The global integration process consists of three fundamental steps, in
which a chromatogram is scanned, segments containing peaks are identified, those segments are
broken down into individual peaks and groups of peaks, and, finally, coeluting peak groups are
analyzed and their component peaks separated.
A brief description of the integration process is as follows:
1. The chromatogram to be integrated is scanned and the highest signal value present is found and
marked. This point is assigned as the top of the highest peak. The integrator then scans in both
directions from the maximum signal point to find the leading and trailing edge thresholds, if they exist,
where baseline slopes fall below the Slope Sensitivity value. These points are tentatively marked as
begin and end points of the primary peak if they are located.
The integrator then treats the two segments of the chromatogram before and after the borders of the
primary peak in the same manner as above, searching for the highest signal value in each segment
and then attempting to find borders for each peak based on the Slope Sensitivity threshold. This
process is reiterated in as many cycles as necessary until the entire chromatogram has been
tentatively classified into one of three categories:
a. A peak with defined beginning and end thresholds which meet the Slope Sensitivity
criteria.
b. A non-peak "baseline" region which falls between two peaks in category (a).
c. A "valley" or "saddle" segment which falls between the maxima of two peaks but in which
region no leading or trailing edges of peaks can be defined because either the slope
sensitivity criteria are not exceeded or because they are not exceeded for a region of more
data points than are specified by the Minimum Peak Width value.
When this "stage one" integration is complete, every potential peak has been found.
2. The integrator finds all segments in the chromatogram which correspond to "peaks" bounded by
"baseline" on both sides. From left to right, the integrator chooses the first such segment, scans
down either side of the "peak", compares the slope/derivative to the Slope Sensitivity threshold, and,
when the threshold is passed, uses the Noise Reject value to select a number of data points to test
beyond the threshold point to determine if any other peak is encountered.
If this test on either side of the peak finds no unexpected "noise" or sub-peaks, trial baseline is drawn
under the peak between the threshold locations. A final test is done to be certain that no
"negative area" has been denoted under the trial baseline. If "negative area" is found, the baseline is
"backed off" until the negative area is eliminated. The trial baseline is then fixed in that segment, and
the process is repeated for all other similar segments.
161
Data Ally Chromatography Manager Operators Manual
When this "stage two" integration is complete, all baseline-resolved peaks have been fully identified
and marked.
3. For those segments classified as "peak groups", based on the observation that the Slope
Sensitivity threshold is not met within the group area but only at its edges, trial baselines are drawn
"valley to valley" under each group. The slopes of those valley-to-valley baselines are tested against
the Baseline Drift parameter. If Baseline Drift is exceeded by any valley-to-valley baseline, the trial
baseline is forced to a lower slope so that its slope does not exceed the drift threshold. All group
baselines are tested and redrawn in this manner.
When this "stage three" integration is complete, all co-eluting peak groups have been drawn with
baselines, but individual peak components in each group are not yet resolved.
4. For each peak group, the largest (highest maximum signal) peak is found. The integrator scans
down from that peak's maximum value along both sides until it finds the first "valley" or location on
either side where the Slope Sensitivity threshold is not passed for a number of points exceeding the
minimum peak width threshold. At those positions, lines are dropped to the current baseline and the
area of the largest peak within those drops is computed. On the trailing side, all the remaining area
left in that group of peaks before the next "baseline" segment is computed, and compared to the area
of the primary peak. If the ratio of the primary to remaining areas exceeds the Drop Line Ratio value,
the drop line is considered valid, and the process is repeated on each side of the large peak using
the next peaks found. In any cases where the Drop Ratio is not exceeded, the trailing peaks are
skimmed. Leading edge peaks are skimmed only if a Forward Skim Zone Code is present allowing
this treatment.
When this phase is completed, all co-eluting peak groups are resolved via either drop lines or skims
according to the integration algorithm criteria.
5. For each skimmed peak in each co-eluting group, a final test is applied to determine if a skim or
tangential separation should be employed. This test is only performed if the Tangent option is
enabled in Configuration - if it is not, the integration finishes at the end of step 4 above.
A test tangent line from the point at which each skim begins to baseline is drawn for each skim line,
and its slope is computed. The slope of the current skim line is also computed, and the ratio of the
Skim/Tangent slopes is found. If this ratio is less than the Skim Ratio value, the skim line is used. If
the ratio exceeds the Skim Ratio value, a tangent is substituted for the existing skim and the
integrator repeats the process for the next skimmed peak.
When this phase is completed, all "shoulder" peaks have been classified into either skimmed or
tangentially-separated peaks and all final baselines drawn.
After completing step 4 or step 5 (if Tangent drawing is enabled), the integrator displays all retention
time values computed for all peaks, draws all tic marks and peak labels, and draws peak names and
numbers if available from the peak table. If relative retention times are specified in the Integration
screen (see below), the integrator finds the appropriate reference peaks or points before computing
and displaying retention times.
It is important to remember that when running Methods, different chromatograms associated with
various detector inputs can be assigned different Integration files, which can include algorithm
parameter settings most suitable for each unique input. If only one Integration program file is
specified for a Method when more than one detector input is active, the same Integration file will be
used for automatic integration of all chromatograms from all inputs acquired with that Method.
162
Data Ally Chromatography Manager Operators Manual
9.1.2.3 Zone Codes
Zone Codes can be used to create time-dependent modifications in the way the integration algorithm
is applied for any specified Method or chromatogram. Any combination of Zone Codes can be placed
into a Method Events Table for automatic execution in any chromatogram produced using that
Method. Alternatively, Zone Codes can be manually inserted into chromatograms at any time. The
can be incorporated into a Method manually or by using the Fill From Graph function (Section 8.3.2)
for automatic application to any chromatogram run using the Method. Each time zone codes are
applied and utilized during integration, they are included with the chromatogram raw data and other
baseline information if the chromatogram is saved or resaved after processing.
A list of all available Zone Codes is as follows:
• Negative Peaks: Enables integration of "negative" peaks with areas below baseline in time
window until next instance of code is found. All peaks reported with "negative" areas (below
baseline) will be marked to indicate this.
• Integrate Off/Reset: First code (earliest) defeats integration until second code is encountered. A
Reset code enables Integration when it follows an Integrate Off code. Can be used to modify
start/end positions for peaks and to ignore solvent fronts, column switch points where baseline
shifts, etc.
The Data Ally file storage system saves all baseline codes resulting from each integration operation
along with the raw data set for every chromatogram, enabling the results of the last integration
performed to be immediately accessible each time a given chromatogram is recalled or reprocessed.
If a previously integrated chromatogram is integrated again, the new set of baseline codes from the
last integration overwrites the old codes when the data file is resaved.
9.1.3 System Suitability
9.1.3.1 System Suitability Calculations
System Suitability calculations are displayed for each individual peak selected in the Peak Table. The
peak itself is displayed with the baseline used and the relevant calculation lines. Calculations where
appropriate are calculated according to the USP or EP specifications.
The basic System Suitability calculations performed are:
Name
The Peak Name from the Peak Table
Retention Time
The actual Retention Time at peak top.
Capacity Factor
RTretainedpeak − RTunretainedpeak
RTunretainedpeak
Area
The actual area of the peak
Height
PW at 50%
The actual height of the peak
The actual width of the peak at half height (min)
PW at 10%
The actual width of the peak at 10% height (min)
PW at 5%
The actual width of the peak at 5% height (min)
163
Data Ally Chromatography Manager Operators Manual
PW at Base
The calculated width of the peak at base using tangent method (min)
CFR Asymmetry Factor
RTpeakend − RT
at10% peakheight
RT − RTpeakbegin
Tailing/Symmetry
RTpeakend − RTpeakbegin
at5% peakheight
2 * RT − RTpeakbegin
Plates
USP=
16 * ( RT 2
)
atbase
2
(( RTpeakend − RTpeakbegin ) )
5.54 * ( RT 2 )
at50% height
EP=
(( RTpeakend − RTpeakbegin ) 2 )
Plates/meter
USP=
USPPlates
EPPlates
EP=
ColumnLenght
ColumnLenght
Resolution
USP =
EP =
2 * ( RTPeak 1 − RTPeak 2)
atBase
(( RTPeak 1end − RTpeak 1begin) + ( RTpeak 2end − RTpeak 2begin)
1.18 * ( RTPeak 1 − RTPeak 2)
at50%
(( RTPeak 1end − RTpeak 1begin) + ( RTpeak 2 end − RTpeak 2begin)
HETP mm
USP =
ColumnLength
USPPlates
EP =
EPPlates
ColumnLength
Note: USP calculations use Tangent Method. EP Calculations use Half Width Method.
9.1.3.2 System Suitability Column Parameters
The Column Parameters options permit input of additional information used in some of the System
Suitability calculations. Specific Unretained Peak information may also be input in this dialog.
The Column Parameters are:
Column Length
The actual length of the column in millimeters.
Particle Diameter The size of the packing material in microns. This figure
may not be used in the main report but may be accessed
for special calculations.
Flow Rate
164
The actual flow rate of the solvent through
the column. This figure may not be used in
the main report but may be accessed for
special calculations.
Data Ally Chromatography Manager Operators Manual
The Unretained Peak Parameters are:
RT
The actual retention time for the Unretained Peak. A value
should be entered here if the unretained peak was not
integrated in the chromatogram or a specific retention time
is required for the calculations.
NameThe Name of the Unretained Peak if desired will be placed in the system
suitability report.
Note: Do not enter a RT or a Name here if a K is used to mark the Unretained Peak in the Peak
Table or vice versa.
System Suitability calculations may be performed on any peaks in a chromatogram. Normally peaks
will be baseline resolved to obtain meaningful results.
With Data Ally, only selected peaks may have system suitability calculations performed on them.
Normally at least two peaks will be selected to enable all parameters to be calculated. In addition the
unretained peak should be identified in the Peak Table, if available, or in the Column Parameters
section if a specific retention time is required.
Ü To Program System Suitability Codes
Enter a 'S' in the Suit Code column for each peak to have System Suitability Calculations performed
on it. If the Unretained or Ko has been integrated, place a 'K' in the Suit Code column corresponding
to the peak.
If the Unretained peak has not been integrated the retention time and name may be inserted in the
Column Parameters dialog on the top level of the Integration Screen.
Note: For all the calculations to be performed certain column information will need to be entered in
the Column Parameters dialog in the top level of the integration screen.
Hint: The same Window value may be quickly programmed for all peaks in the Peak table by using
The Fill Function.
9.1.4 Peak Identification
Only absolute retention times and windows and "largest area within window" peak logic are available
for identifying peaks in the current version.
9.2.0 Integration Peak Table
Ü To view the Peak Table for the current Integration program, click on the large PEAK TABLE button
at bottom center of the top-level Integration dialog. The Peak Table screen (Figure 9.5) will appear.
165
Data Ally Chromatography Manager Operators Manual
Figure 9.5 Integration Peak Table Window
The Peak Table is displayed in split-screen fashion beneath a working Graph screen. The Graph
screen can be used to display chromatograms during real-time processing or during review, and is
"connected" to the Peak Table below to allow graphical updates and modifications of the Peak Table.
Click the left mouse button with the pointer anywhere inside either the Graph window or the Peak
Table window in this screen, to make that window active.
Ü To return to the top-level Integration dialog box display, click on the INTEG button at the bottom
right edge below the Peak Table.
9.2.1 Peak Table Functions
The Peak Table consists of a series of columns defined in Configuration, each of which contains
information concerning peak component identification. By definition, every Peak Table must include
columns for Retention Time and Window; all other parameters are optional.
Each Peak Table is a "spreadsheet" which operates in much the same fashion as common
"spreadsheet" software programs. The Table "spreadsheet" consists of columns and rows, which
can be typed into, copied, cleared, deleted, pasted, and appended to. The four buttons at left
beneath the table marked Insert, Delete, Copy, and Paste allow rows in the table, and ranges of
rows, to be manipulated easily.
Each Peak Table is defaulted to a single horizontal row. Rows are added by either clicking the left
mouse button on the INSERT button at bottom, or by repeatedly pressing the ENTER key, which will
move to the last column in the last current row and then create a new row below. You must create a
new row before entering information into that row.
The INSERT button can be used to insert new blank rows within a series of already-completed rows
at any desired position. Move the pointer to any cell in the row below where you wish to add a new
row, and click the left button to place the highlight/cursor in that row. Then click the INSERT button
to insert the new row above the highlighted row. Repeated clicks on INSERT will insert a series of
rows.
The DELETE button is used to permanently delete rows in the table. Move the pointer to the row to
be deleted and click the left mouse button to anchor the highlight/pointer in that row. Then click the
left button on DELETE to remove that entire row and its contents.
166
Data Ally Chromatography Manager Operators Manual
The CUT button can be used to "cut" rows which are already in the table and subsequently "paste"
them into a new position. Move the pointer to the row to be cut and click the left mouse button to
anchor the highlight/pointer in that row. Then click the left button on CUT to remove that entire row
and its contents - the row is placed into an internal memory and can now be recalled using the
PASTE command.
Rows which have been cut can be replaced into the table in a different position by using the PASTE
command after a CUT. Immediately after cutting a row, move the pointer and click to highlight
anywhere in the row just below where you want to re-insert the cut row. Then, click on PASTE and
the cut row or rows will be inserted. PASTE cannot be used after rows have been DELETEd since
deleted rows are permanently discarded. If a row is CUT and not PASTEd back into the table, the
row is effectively deleted in the same manner as via the DELETE command.
You can easily re-order the columns in the Peak Table from left to right or change their individual
widths at any time. Both the column order and widths are set as defaults in Configuration.
To move a column to another position in the table, simply place the pointer cursor on that column's
header button, hold down the left mouse button, and "drag" the header button left or right to the new
desired position relative to the other columns. When the pointer is in the desired position, release the
mouse button and the entire column will be moved, and the table redrawn accordingly. Modifying the
order of columns may make certain types of table editing or review easier by allowing placement of
all columns currently being manipulated in view on a single screen - you can easily move
"unimportant" column information to the right and off of the displayed table window area.
To change the width of any individual column, move the pointer cursor to the border of its header
button and the next column header button in the direction in which you wish to expand or reduce the
column width. The cursor will become a "double-sided horizontal arrow" (ç |è ); when this change
occurs, immediately hold down the left mouse button and move the arrow cursor in the direction you
wish the button edge to expand or contract. When the desired column width is indicated by the
position of the cursor, release the mouse button and the column will be resized and the entire table
redrawn accordingly. This feature permits you to match the exact sizing of each column to the
expected character width of the entries expected in that column - you can also effectively "remove"
certain columns without actually eliminating them from the table by reducing their widths to a very
small size.
9.2.2 Peak Table Components
The contents of the Peak Table columns may be configured for any channel so that some column
options are not used, or the order of the columns is different. The column header titles marked
"Configurable" are non-essential for running the system and can be omitted from the Peak Table in
Configuration if desired. The complete set of options are as follows:
• ENABLE: (Not Configurable) This column is both a graphic indicator/selector for whether a row
entered in the Peak Table will be used for processing chromatograms and generating reports,
and a "peak number" tracking column. If the line number cell in this column is highlighted for a
given row, that row is active and will be used - active peaks will be identified as found in reports
and calibrated as instructed. If the cell is not highlighted, that row is inactive and will not be used
- inactive peaks will still be included in reports, but will not be named and/or calibrated, and no
quantitative reports can be generated for such peaks. The ON column is useful for temporarily
omitting rows assigned to specific peaks if those rows are not required for a given analysis,
without actually deleting the information in that row.
Ü To manually edit the ENABLE column, move the pointer cursor to the desired cell in that
column and double-click the left mouse button to toggle the highlight on or off.
167
Data Ally Chromatography Manager Operators Manual
• RT: (Not Configurable) This column shows the absolute retention time for the peak component
identified in each row. A value for RT is essential for every row which defines a peak. RT is
always entered in time units (min or sec).
Ü To manually edit RT, move the pointer cursor to the desired RT cell, click to highlight, and type
in the desired value along with a units code, if desired. If no units code is entered, it will be
assumed you are entering the value in the units used for the previous entry. The range for RT is
-100 to 10,000 minutes. Retention times can be filled automatically from the current foreground
chromatogram by using the FILL function (see below).
• PEAK NAME: (Configurable) This column shows the name assigned to the peak defined in the
current row. Names of up to 30 characters can be given if the column width is set sufficiently
large in Configuration.
Ü To manually edit PEAK NAME, move the pointer cursor to the desired cell, click to highlight it,
and type in the desired name.
• WINDOW: (Non-Configurable) This column defines the retention window for the peak in the
current row, as a range of time on either side of the RT value. Windows must be defined for
every peak in every row, and must have a value greater than zero. If the top-level Integration
dialog specifies Absolute windows, a time value in minutes or seconds is entered.
The WINDOW setting must be entered for each row, and can have a unique value for each row.
You can use the FILL function below to "fill in" Window settings.
The Data Ally integrator employs the WINDOW along with the RT to distinguish individual peaks
when evaluating a chromatogram. The time window defined by each RT value in the current
Peak Table, plus or minus the WINDOW value, is examined in each just-integrated
chromatogram to determine if any peaks appear inside that region. If so, the largest peak
appearing in the retention window is assigned the peak name given in the table. Retention
windows are permitted to overlap adjacent windows, the logic rules being applied separately in
each window.
Ü To manually edit peak WINDOW, move the pointer cursor to the desired cell, click to highlight
it, and type in the desired window value along with a units code, if needed. If no units code is
entered, the system will assume that the units of the previous entry are used. WINDOW values
can be AutoFilled or graphically edited (see below).
• RRT Code: This column is used to designate peaks where the peak windows will be adjusted
according to the difference between the expected time and the actual time. The windows for
peaks that follow will be shifted by the error amount to compensate for any time skew found.
Peaks are designated by placing an upper case R in this column for any peaks to be used for
time window adjustments. This can be very helpful when the peaks are taking more or less time
that usual to come off the column.
• Suit Code: See System Suitability (section 9.1.3) for details on producing System Suitability
Reports. Codes are “S” or “K”.
• IS: (Configurable) This column identifies up to five peaks in the table as Internal Standards,
which can be applied to any specified peaks to correct for method and sample variations.
Entries in the IS column are in the form of numbers, with a maximum range of 1 through 5. Only
one peak component in each table can be assigned one particular IS number. The IS row is left
blank for peaks which are not Internal Standards.
Ü To manually edit IS, click the pointer cursor inside the desired cell to highlight it, and type in the
new value of IS from 1 to 5. An error message will appear if you attempt to designate an internal
standard peak number which has already been assigned in the table.
168
Data Ally Chromatography Manager Operators Manual
The contents of the IS column will be automatically transferred into a Calibration screen
Reference Peak Table when a new Calibration file is set up (Section 10.1). The identities of
internal standard peaks can only be edited in the Integration Peak Table, which affects all
existing Calibration Reference Tables which reference a given Peak Table.
• CAL: (Configurable) This column assigns which peaks/rows in the table can be calibrated, and
on what basis. Choices for CAL values are blank (not calibrated), ES (External Standard basis),
or IS1 - IS5 (Internal Standard basis with IS peak number). If Internal Standards have been
disabled in Configuration, the IS options are excluded. Each peak for which quantitative results
are to be determined MUST have an entry in its CAL column.
Ü To manually edit CAL, click the pointer cursor inside the desired cell to highlight it, and type in
the new value of CAL. You can also use the FILL function below to fill in CAL entries which are
repeated for a series of rows, or graphically select which peaks are to be calibrated (see below)
The contents of the CAL column will be automatically transferred into a Calibration screen
Reference Peak Table when a new Calibration file is set up (Section 10.1). The calibration type
for each peak can only be edited in the Integration Peak Table, which affects all existing
Calibration Reference Tables which reference that Peak Table. Note that only those peaks
which have an associated ES or IS code in the CAL column will be accessible to any Calibration
file referencing this Peak Table. Therefore, you must determine which peaks are to be
calibrated, and the method of calibration desired, before initializing any calibrations based on any
peak table.
• COMMENT: (Configurable) The COMMENT column is used for entry of text comments
describing any line in the Peak Table.
Ü To make a comment entry, click inside the COMMENT cell in the desired row and type in the
entry.
9.2.3 Entering Peak Table Values
There are three ways to enter values for any parameter into the Peak Table:
1. Move the pointer into any "cell" in the table and click so that the highlight and the flashing text
entry cursor are moved into that cell. Then, type any desired entry into the cell directly.
To move to any other cell, either point to a different cell and click the left mouse button, or press the
ENTER key to move the highlight from cell to cell, left to right, and then downward row by row until
the desired cell is reached.
2. Copy information from an already entered row into a new row using the COPY and PASTE
commands. To copy a row, move the pointer to the row to be copied, and click the left button to
place the highlight in that row. Click on the COPY button to make a copy of the highlighted row.
Now, move the pointer to the row just below where you want to insert the copied row, and click
anywhere in that row to place the highlight. Click the left mouse button on PASTE, and the copied
row will be pasted in above the highlighted row. You can now make any other changes to the new
rows by directly entering those changes into each cell.
3. Fill information into any column in the table using the FILL button below the table. The FILL
function is a convenient way to transfer information from a chromatogram loaded in the Graph
window to the table directly, without any typed or transposed entries, or to automatically compute and
fill in table values. It works in a manner identical to that of the FILL function for the Method Events
Table.
169
Data Ally Chromatography Manager Operators Manual
9.2.3.1 FILL Function
The FILL button operates in exactly the same manner as in the Method Events Table and all other
Data Ally tables.
Figure 9.6 Automatically Filling Retention Times
The AutoFill dialog box (Figure 9.6) which defines all fill functions is the same dialog as used to fill
columns in the Method, Calibration, and Sequence screens - see Section 8.3.3 above for a complete
explanation of all terminology. After using the automatic fill function, you can make any desired
changes in any of the filled retention times before saving the Integration program and its Peak Table.
In the Peak Table, the "Fill From Graph" function applies only to automatic filling of the RT column
with current chromatogram retention times. In order to use this function, a valid integration must
already have been completed on the foreground chromatogram in the active Graph window, with all
desired peaks and/or peak groups identified by individual RTs. Automatic filling of retention times is
an extremely fast and accurate means of completing even long peak tables. When filling from the
graph, retentions will be expressed in the current time units shown in the graph window (min, sec).
The AutoFill "Duplicate" mode is available for the PEAKNAME, WINDOW, CAL, and COMMENT
columns. Increment mode can be used with the RT, and WINDOW columns.
You can choose various combinations of options in the AutoFill dialog as described below to
accomplish the following tasks (click on OK after setting up the Fill dialog as directed):
Ü To fill an existing row's value into all currently empty rows in the column up to the next entry,
place the edit highlight on the "basis" row, click FILL to see the AutoFill dialog, select "Duplicate",
"Current Cell", and "To Next Entry", with all other fields and options blank/off. If the "basis" row is the
first row in the column, you can select "Start of Table" instead of "Current Cell" without highlighting
the basis row.
Ü To fill an existing row's value into all currently empty rows in the entire column, place the edit
highlight on the "basis" row, click FILL to see the AutoFill dialog, select "Duplicate",
"Current Cell", and "End of Table", with all other fields and options blank/off.
Ü To fill an existing row's value into more or less empty rows than the number of empty rows found in
the current column up to the next entry, place the edit highlight on the "basis" row, click FILL to see
the AutoFill dialog, select "Duplicate", "Current Cell", and "To Next Entry". Type the actual number of
empty rows to be filled into the "No. of Steps" column, with all other fields and options blank/off. If the
170
Data Ally Chromatography Manager Operators Manual
"No. of Steps" value exceeds the number of actual intervening empty rows, sufficient new rows will be
added and filled to meet the "No. of Steps" criteria.
Ü To fill all currently empty series of consecutive rows in the column with the values found in the rows
prior to each empty group of rows, click FILL to see the AutoFill dialog, select "Duplicate",
"Start of Table", "End of Table", and "Allow Progressions", with all other fields and options blank/off.
Ü To overwrite existing values (along with any blank rows) with duplicated values in an entire column,
place the edit highlight on the "basis" row for copying, click FILL to see the AutoFill dialog, select
"Duplicate", "Current Cell", and "End of Table", and check the "Allow Overwrites" command, with all
other fields and options blank/off.
Ü To clear (remove) existing values in an entire column, insert a blank row at the beginning of the
table, place the edit highlight on that row, click FILL to see the AutoFill dialog, select "Duplicate",
"Current Cell", and "End of Table", and check the "Allow Overwrites" command.
Ü To overwrite existing values in a portion of a column with a duplicated value, place the edit highlight
on the "basis" row for copying, click FILL to see the AutoFill dialog, select "Duplicate", "Current Cell",
"End of Table", and "Allow Overwrites", and enter a "No. of Steps" value corresponding to the number
of existing rows to be filled with duplicates. All other fields and options should be blank/off. If the
number of steps exceeds the number of blank rows in the column, the "Allow Insertions" box must be
checked to add sufficient rows to meet the "No. of Steps" criteria.
Ü To clear (remove) existing values in a portion of a column, insert a blank row at the beginning of the
range to be cleared (or remove an existing row entry), place the edit highlight on that row, click FILL
to see the AutoFill dialog, select "Duplicate", "Current Cell", "End of Table", and "Allow Overwrites
Data", and enter a "No. of Steps" value corresponding to the number of existing rows to be cleared
(filled with a blank entry). If the number of steps exceeds the number of blank rows in the column,
the "Allow Insertions" box must be checked to add sufficient rows to meet the "No. of Steps" criteria.
Ü To fill a column in a new table with incremented values, enter the beginning "basis" value in the first
row, place the edit highlight on that row, click FILL to see the AutoFill dialog, select "Increment",
"Current Cell", and "End of Table", enter the increment value in the "Increment" field, and enter the
number of rows for which incremented values are to be inserted in the "No. of Steps" field.
Ü To fill a column with incremented values in blank rows up to the next existing entry, place the edit
highlight on the "basis" row, click FILL to see the AutoFill dialog, select "Increment", "Current Cell",
and "To Next Entry", and enter the increment value in the "Increment" field; leave other fields and
options blank/off.
Ü To fill an existing row's incremented value into more or less empty rows than the number of empty
rows found in the current column up to the next entry, place the edit highlight on the "basis" row, click
FILL to see the AutoFill dialog, select "Increment", "Current Cell", and "To Next Entry". Type the
increment value into the "Increment" field, and the actual number of empty rows to be
filled/incremented into the "No. of Steps" column, with all other fields and options blank/off. If the "No.
of Steps" value exceeds the number of actual intervening empty rows, sufficient new rows will be
added and filled to meet the "No. of Steps" criteria.
Ü To fill all currently empty series of consecutive rows in the column with incremented values based
on the rows prior to each empty group of rows, click FILL to see the AutoFill dialog, select
"Increment", "Start of Table", "End of Table", and "Allow Progressions". Type the increment step
value for each row into the "Increment" field, with all other fields and options blank/off.
Ü To fill a column with incremented values in all blank rows based on an existing entry, place the edit
highlight on the "basis" row, click FILL to see the AutoFill dialog, select "Increment", "Current Cell",
171
Data Ally Chromatography Manager Operators Manual
and "End of Table", and enter the increment value in the "Increment" field; leave other fields and
options blank/off.
Ü To fill a range of rows with evenly-spaced, automatically computed values, with each row's value
corresponding to the difference between the basis cell's value and the value of the next row having a
non-blank entry in the column divided by the number of intervening rows, place the edit highlight on
the "basis" cell (first row in the range), click FILL to see the AutoFill dialog, select "Increment",
"Current Cell", and "To Next Entry". If you wish to fill only the existing number of blank intervening
rows, leave the "No. of Steps" field and all other commands blank/off. If you wish to fill either only
some of the intervening rows, or to add new intervening rows, enter a number in the "No. of Steps"
field specifying the total number of intervening rows to be filled. If "No. of Steps" exceeds the number
of existing blank lines in the range, you must check the "Allow Insertions" box to automatically add
and fill sufficient lines to match the "No. of Steps" entry.
Ü To fill all existing ranges of empty rows in the column with evenly-spaced, automatically computed
values, with each filled row's value corresponding to the difference between the value of the cell
immediately preceding that range and the value of the next row having a non-blank entry following
the range divided by the number of intervening rows, click FILL to see the AutoFill dialog, select
"Increment", "Start of Table", "End of Table", and "Allow Progressions". Leave all other selections
blank/off.
Ü To overwrite existing values (along with any blank rows) with incremented values in an entire
column, place the edit highlight on the "basis" row for incrementing, click FILL to see the AutoFill
dialog, select "Increment", "Current Cell", and "End of Table", enter the increment value in the
"Increment" field, and check the "Allow Overwrites Data" command, with all other fields and options
blank/off.
Ü To overwrite existing values in a portion of a column with incremented values, place the edit
highlight on the "basis" row for copying, click FILL to see the AutoFill dialog, select "Increment",
"Current Cell", "End of Table", and "Allow Overwrites Data", enter the increment value in the
"Increment" field, and enter a "No. of Steps" value corresponding to the number of existing rows to be
filled with duplicates. All other fields and options should be blank/off. If the number of steps exceeds
the number of blank rows in the column, the "Allow Row Insertions" box must be checked to add
sufficient rows to meet the "No. of Steps" criteria.
Ü To fill Retention Times into the RT column from the current Graph window, click on the RT column
header button (or move the edit highlight into that column), click FILL to see the AutoFill dialog
(Figure 9.8), select "Fill From Graph", "Start of Table", and "End of Table", leaving all other fields and
options blank/off. Lines will be added to the table with RT entries corresponding to the positions of all
currently found peaks. If the "Allow Overwrites Data" box is checked, any existing RT column entries
will be replaced by newly filled entries at the times assigned to such rows.
Ü To fill Retention Times into a timed region of the RT column from the current Graph window, click
on the RT column header button (or move the edit highlight into that column), click FILL to see the
AutoFill dialog (Figure 9.8), select "Fill From Graph", "Start of Table", and "End of Table", and enter
the time range for filling RTs into the "First Time" and "Last Time" fields, leaving all other fields and
options blank/off. Lines will be added to the table with RTs corresponding to the positions of all
current peaks, within the specified time limits. If insufficient blank lines exist in the current table to fill
all the RTs in the region given, the "Allow Insertions" box must be checked.
Ü To fill Retention Times into a range of rows in the RT column from the current Graph window, click
on the RT column header button (or move the edit highlight into that column), click FILL to see the
AutoFill dialog, select "Fill From Graph", "Start of Table", and "End of Table", leaving all other fields
and options blank/off. Lines will be added to the table with RT entries corresponding to the positions
of all current peaks. The number of filled rows can be limited by specifying a "No. of Steps" value
less than the total number of peaks in the current graph window.
172
Data Ally Chromatography Manager Operators Manual
9.3.0 Working with Integration Files
The Integration program filing system operates in a manner identical to that of every other Data Ally
programming screen. The Integration screen display, comprising both the top-level dialog box and
the Peak Table, is configured as a "template" to show information about the current integration, peak
finding, and reporting instructions loaded into the channel being observed. This template can be
edited using many graphical and other tools to change its contents. The contents of the Integration
screen display can be saved as a unique "Integration" file, with a unique filename and description, so
that it can be recalled and reused at any future time either manually, or as part of an automated
Method or a Sequence of Methods.
The default Integration file, whose name is assigned during Configuration, is always loaded
automatically into the Integration display screen at the time Data Ally is initialized. You can change
any aspects of the default file, including its Peak Table, within the active software, except for the
features and options which are either "fixed" or "removed" in the Configuration. These items can, of
course, also be reset or restored, but the channel must be disabled and a re-Configuration performed
to accomplish this.
The Files commands in the Integration Command Menu bar (Figure 9.7) are used to load, save,
clear, and delete Integration program files.
Figure 9.7 Integration Files Command Submenu
9.3.1 Loading Integration Files
Ü To load a saved Integration file from disk memory into the current channel, click the left mouse
button on Files in the Command menu bar, and then click on Load. A directory dialog box will appear
which lists the Integration files (*.INT) available in the current directory path for this channel (Figure
9.8). Select the desired file by clicking on its name in the directory list, or by typing its name into the
entry box. Click on OK to load the new file.
173
Data Ally Chromatography Manager Operators Manual
Figure 9.8 Integration Files/Load Dialog
If the previous file has been edited and has not been saved or resaved, an information message will
appear before the new file is loaded asking if the previous file should be saved. If so, click on YES
and assign either the same filename or a new name as desired. If you do not wish to save the edited
file, click on NO to proceed.
When a new file is loaded, it will overwrite the previous Integration file.
To reload the default Integration file programmed during Configuration, use the Load Default
command in the Files submenu. This default file can have a complete Peak Table for a "default"
chromatogram, if desired - loading it will overwrite any other Integration file currently present in the
time base. The default file can be modified at any time for manual operation, but can only be
permanently changed in Configuration Mode (Section 5.2.5.3).
9.3.2 Clearing Integration Peak Table
Rather than deleting all lines in an existing peak table when creating a new table, a Clear function is
provided to remove all existing values from the current table.
Ü To clear the current Integration Peak Table, click on File in the Command Menu bar and then click
on Clear. Then click on Clear Peak Table (Figure 9.9). The Peak Table will be emptied. If the
previous file has been edited and has not been saved or resaved, an information message will
appear before this file is cleared asking if the previous file should be saved. If so, click on YES and
assign either the same filename or a new name as desired. If you do not wish to save the edited file,
click on NO to proceed.
Figure 9.9 Clearing Peak Table
174
Data Ally Chromatography Manager Operators Manual
9.3.3 Saving Integration Files
Ü To save an Integration file using the same filename, click on Files in the Command Menu bar, and
then click on Save. A trap message box will appear prompting you to confirm that you wish to
overwrite the old file with the same filename. Click on Yes, and the previous version of the file will be
overwritten and a new version recorded in the same path.
Ü To save a modified Integration file with a different filename, click on Files and on the Save As
command in the pulldown. The Save As dialog box will appear (Figure 9.10). Click inside the
filename entry field and type in the desired new filename. If you wish, click inside the DESCRIPTION
field and modify any existing description of the file, which may help identify this file in the directory
listing for future recall. When the correct name and description appear, click on OK to save the file to
the current disk path. If another file already exists in that path with the same name, an error
message will instruct you to change the filename before saving.
Figure 9.10 Integration Files/Save As Dialog
It is recommended that Integration program files saved to disk be "backed up" by simply copying the
*.INT files to a floppy disk, removable hard disk, or tape and preserving the copies in a secure place.
If modifications are routinely made to the library of *.INT files, backups should occur at routine
intervals or even on a daily basis.
You can use the Files/Integration Description command to directly enter a single or multiline
description of the current Integration file. Alternatively, you can enter such a description using the
Save As dialog (Figure 9.10) when saving a new or modified Integration file. Any descriptive text
entered using the Integration Description command will be shown in the "Description" field when
reviewing saved files via the Load dialog (Figure 9.8).
9.3.4 Deleting Integration Files
Ü To delete an Integration file from the current disk directory, use the Windows File Manager Delete
command.
9.3.5 Printing The Integration File
Use the Print Integration command in the Files submenu to print a summary of the current Integration
program file. The template for this printout is saved as \reports\int\int.xls and can be modified as
desired using Microsoft Excel (Section 13).
175
Data Ally Chromatography Manager Operators Manual
10.0 Reviewing and Editing Calibrations: Calibration Screen
Data Ally Chromatography Manager provides many features for quantitating results to generate
calibrations and reports for unknown samples. Any chromatogram acquired or reprocessed in any
available mode can be utilized for creating a new calibration or for updating an existing one.
10.1.0 Calibration File Definition
A Data Ally Calibration file is a set of data corresponding to peak components from a specified
Integration file's Peak Table, which represents the cumulative responses of the standards already
analyzed for determining the concentration of each component in unknown materials Each time a
new standard is injected and its chromatogram is captured, the peak responses in that
chromatogram can be applied to any Calibration file(s) associated with the Integration program(s)
being executed. Each Calibration file not only holds the actual peak response information, but also
contains other items which describe each calibration standard run as predefined in the Configuration
for each channel. When the Calibration function is configured, the system manager selects which
types of data are to be displayed in the Calibration table, and which options are to be made available
for analyzing and interpreting the calibration data.
Calibration files can consist of results from only a single standard chromatogram, and can be as large
or contain information from as many different standard runs as desired. Calibration files are updated
via instructions from a running Method or Sequence, or from use of the manual Edit/Calibrate
command in any Graph window. Only one standard chromatogram can be applied to a Calibration
file at one time for updating.
When a calibration is performed manually or as part of a Method or Sequence using a defined
Calibration file, one of three options is always selected:
• The standard chromatogram being analyzed is used to establish a new calibration in the file,
clearing any previous responses at all levels in that file (the New mode);
• The standard chromatogram is used to clear and update any existing responses in an alreadyexisting calibration in the file for the single calibration level represented by that standard (the
Replace Level mode) - all other responses for all other levels in the Calibration file are retained.
• The standard chromatogram is used to update the existing responses in an already-existing
calibration in the file by averaging its response at the appropriate level with all other existing
responses (the Average mode). This mode is essentially a "moving average" computation since
each new standard response is averaged against the previous average response for its unique
level.
Regardless of which of the three modes above is used to update a calibration table, every single
standard run used for such updates has equal "weighting" of its data compared to all other standard
runs, with the overall calibration curve being recalculated at each update from all the available
standard results.
Each new calibration file must have an assigned, valid file name, which will end with the
automatically-assigned name extension ".CAL". If the currently-loaded Method contains a Calibration
filename reference, that calibration file will be automatically loaded when that Method is executed. If
the Method does not contain a Calibration filename reference, the Calibration file present in the
current channel will be used. If no specific Calibration file has been loaded, the default Calibration
filename, if any, assigned in Configuration will be loaded automatically.
Since Calibrations are performed by instructions from a Method, Sequence, or Graph Edit/Calibrate
command, actual calibration is always done "behind the scenes". The Calibration file(s) used for
real-time or other calibrations need not be loaded into the current Calibration screen display. The
176
Data Ally Chromatography Manager Operators Manual
purpose of the Calibration screen, which is viewed by clicking the CALIBRATE SoftButton on the left
screen, is to provide a convenient and accessible means of reviewing, editing, and manipulating any
desired Calibration file. It is possible to be editing one Calibration file in the Calibration screen of the
current channel while that channel is processing standards with one or more different Calibration files
in the background.
In order to perform calibrations, either the "default" calibration filename or another user-defined
calibration filename must be referenced by the Method or in the manual Calibration command. At
any time, only those calibration files actually established and named (regardless of whether they
actually contain any calibration data) are accessible for accumulating real calibration data. Data Ally
is capable of automatically "resaving" calibration files as updates are made so that the cumulative
data is not lost; alternatively, a user can opt for manual-only calibration file saving.
10.2.0 The Calibration Display
Ü To see the Calibration screen (Figure 10.1), click on the CALIBRATE SoftButton. This screen
consists of three sections, each of which is a resizable and movable window:
• The Reference Peak Table, at upper right, which captures the table of all calibrated peaks from
the Peak Table of the referenced Integration screen, and sets the maximum number of
standards to be used and the concentrations of those standards.
• The Calibration Table, at bottom, which lists data describing every standard chromatogram which
has been used to construct this calibration file.
• The Calibration Plot window, at upper left, which shows a graphical representation of the
calibration data for each individual peak.
All three window sections are interactive, so that changing the presentation in one window will often
change the contents or display in the other windows.
Figure 10.1 Calibration Screen
10.2.1 The Reference Peak Table
Every Calibration file, when it is defined, must establish a "connection" with the Peak Table in one
Integration program, which is used to identify peaks and set the basic calibration instructions for the
177
Data Ally Chromatography Manager Operators Manual
type of chromatogram to be run with a particular Method. Once a reference is entered, each peak in
that Peak Table marked for calibration in the Table's CAL column is transferred into the Reference
Peak Table window at the upper right of the Calibration screen (Figure 10.2). The referenced
Integration file must either be saved to disk in some accessible directory path, or it must be loaded
into the current channel, in order to be used properly by the Calibration file.
Figure 10.2 Reference Peak Table Window
The Reference Peak Table actually specifies the calibration basis, curve fitting for multiple level
calibrations, units, number of possible standard concentration levels, and concentration target values
for standards at each of those levels. The type of standardization (external or internal standard,
internal standard references for each peak) is actually defined in the Peak Table of the referenced
Integration screen. This means that a single Integration screen/Peak Table can have multiple
associated Calibration files, each with its own specific calibration instructions and responses. In
order for a successful calibration to be completed, both the Integration file and Peak Table
appropriate for the current standard chromatogram (which identifies all desired peaks correctly and
specifies which peaks are standardized and in what modes), and one Calibration file which
references that Integration Peak Table must be loaded in memory. When you load a new Calibration
file, you will be automatically prompted to load the actual referenced Integration file, if this has not
already been done. Alternatively, when you perform a manual or Method-based calibration using a
loaded Integration file, Data Ally will automatically make sure you have in fact also loaded an
adequate Calibration file which references your Integration file.
A new Calibration file can be created by modifying an existing Calibration file, or the default
Calibration file, and then resaving it with a different name using the Save As command (Section 10.
below). In order to utilize a Calibration file, it must be saved to disk with a unique filename, and must
include a valid Reference Peak table with at least one calibration level defined for at least one peak.
If a Calibration file specified when running a Method or Sequence is not valid, or does not contain the
proper information, the Method or Sequence will not be permitted to start and an error message will
appear advising that an invalid Calibration file was found.
The Reference Peak Table, like other Data Ally tables, is a "spreadsheet" consisting of a series of
rows and columns, which can be edited by placing the Edit cell highlight in any row corresponding to
a peak, or by using the Fill dialog in the same manner as for other tables. Columns indicating Peak
Name, RT, and Calibration Type are automatically filled in with information from the Integration Peak
178
Data Ally Chromatography Manager Operators Manual
Table being referenced, to provide the user with a complete description of each peak. Additional
columns are provided for FIT, BASIS, UNITS, and LEV for levels from 1 to 16.
You can easily re-order the columns in the Reference Table from left to right or change their
individual widths at any time. Both the column order and widths are set as defaults in Configuration.
To move a column to another position in the table, simply place the pointer cursor on that column's
header button, hold down the left mouse button, and "drag" the header button left or right to the new
desired position relative to the other columns. When the pointer is in the desired position, release the
mouse button and the entire column will be moved, and the table redrawn accordingly. Modifying the
order of columns may make certain types of table editing or review easier by allowing placement of
all columns currently being manipulated in view on a single screen - you can easily move
"unimportant" column information to the right and off of the displayed table window area.
To change the width of any individual column, move the pointer cursor to the border of its header
button and the next column header button in the direction in which you wish to expand or reduce the
column width. The cursor will become a "double-sided horizontal arrow" (ç |è ); when this change
occurs, immediately hold down the left mouse button and move the arrow cursor in the direction you
wish the button edge to expand or contract. When the desired column width is indicated by the
position of the cursor, release the mouse button and the column will be resized and the entire table
redrawn accordingly. This feature permits you to match the exact sizing of each column to the
expected character width of the entries expected in that column - you can also effectively "remove"
certain columns without actually eliminating them from the table by reducing their widths to a very
small size.
An ENABLE column which numbers lines in the Reference Table is provided as for the other Data
Ally tables. This column can be used to enable or disable individual peaks from the Peak Table in
order to select whether they are calibrated or not. Normally, each enabled or active row
corresponding to one peak will have a colored highlight in this first left hand column. To disable a
peak, double-click inside the enable column in its row to remove the highlight. To re-enable it, double
click again to restore the highlight.
The CUT/COPY/PASTE command buttons found at the bottom of the Calibration screen can be used
with both the Reference Peak Table and, to a limited extent, with the Calibration Data table below.
The active table window in this screen will access these buttons. In the Reference Table, because
the row contents of this table are fixed by its relationship to a predefined Integration Peak Table, the
RT and Peakname columns cannot be edited directly - to change RT or Peakname, simply change
the source Integration screen Peak Table, which will automatically modify these parameters in all
Calibration Reference Tables based on that Peak Table. However, all other columns in the
Reference Table can be cut or copied, pasted, and filled; the FILL button is provided for automatic
filling of columns which define Basis, Fit Type, Units, and Levels via the standard AutoFill dialog box.
Every calibrated peak in the Reference Peak Table has its own unique Calibration Table and its own
Calibration plot. The Reference Peak table is utilized to select any particular peak, in order to view
the Calibration Table and Plot specific to that peak. Both the Table and the Plot will immediately be
updated for the newly selected peak. This interactive display mode helps you easily review the
current status of calibration of any peak, and modify the calibration quickly if necessary.
It may be most convenient to maximize the Peak Reference Table when editing it, by clicking on the
Program Control/Maximize button at the window's upper right, especially if a large number of levels is
being input. You can use the table's vertical and horizontal scroll bars to move around in the table, as
well as the PageDown and PageUp keys (to move up or down a fixed number of rows of peaks), the
CTRL-Home or CTRL-End commands (to move to the first or last column on the current row in the
table), and the CTRL-PgDn or CTRL-PgUp commands (to move to the beginning or end row/peak in
the table, respectively).
The following series of steps must be performed in order to modify an existing or default Calibration
Reference Peak Table in order to initialize a new one.
179
Data Ally Chromatography Manager Operators Manual
10.2.1.1 Setting Up a New Reference Table
Ü To select the Integration screen which includes the Peak Table for reference for a new calibration
file, click on Files in the Calibration Screen Command Menu Bar, to see the Files submenu (Figure
10.3).
Figure 10.3 Calibration Files Submenu
Now, click on Setup to see the Calibration Setup dialog box (Figure 10.4).
Figure 10.4 Calibration Setup Dialog
The Setup dialog defines the Integration File/Peak Table reference for the current Calibration file,
which must be an existing Integration file.
Ü To select the referenced Integration file name, click inside the Integration entry field and type in the
desired Integration path/filename as reference for constructing the required Peak Table, or click the
down-arrow button to the right of the field to see a listing of all Integration files in the current path. To
select one of these files as the reference source file, click its name to enter it.
Note that changing the Integration source file name using Setup will cause all data in the current
Calibration file to be deleted as the Calibration Reference Table is reconstructed.
180
Data Ally Chromatography Manager Operators Manual
Ü To set the total number (maximum number) of different standard concentrations for this calibration,
click on the right arrow next to the No. of Standard Levels field, and choosing the desired number of
levels (1 to 16). This will cause the selected number of columns to be placed into the current
Calibration Reference Table to accommodate all levels. If the Integration source filename is not
changed but the number of levels is modified using Setup, existing data in the current Calibration
table will not be lost, and the Reference Table will show added levels.
When both the Reference filename and number of levels are shown as desired, click on OK to
restructure the Calibration Reference Table. Immediately, the listing of peaks by name and RT in the
referenced Integration file will appear in the Calibration Reference window, replacing any previous set
of peaks. Also, the Reference Table will immediately update so that it contains the number of level
columns specified via Setup. NOTE THAT EACH TIME SETUP IS USED TO CHANGE THE
INTEGRATION FILE REFERENCE, THE EXISTING CALIBRATION TABLE IN THE CURRENT
CALIBRATION SCREEN IS CLEARED, AS WELL AS ALL PREVIOUS ENTRIES IN THE
REFERENCE TABLE (since presumably a different set of peaks is being defined). Therefore, you
should be certain the previous Calibration file has been saved before using Setup, if it is to be
preserved for later use. If you use Setup to change only the number of levels, the existing calibration
Reference Table and Calibration Table data will be retained, with the loss or addition of any levels
specified. If levels are removed, their data will be lost from the associated Calibration Table.
It is possible to modify the Reference Table of an existing Calibration file without using Setup, if the
same set of peaks is to be used for the new table. To change the peaks themselves, the types of
calibration (ES, ISx, or none), and the identity or number of Internal Standard peaks (as shown in the
IS column), simply load the referenced Integration file, make the desired changes in its Peak Table,
and resave the modified Integration with the same filename - the changes made will automatically be
echoed into all Calibration files with Reference Tables using that Integration file. To change
information other than the peak definitions, you can directly edit the Reference Peak Table at any
time.
Ü To use Setup again to change the number of levels in any existing Reference Table, without
clearing the entire contents of the Calibration file, bring up the Setup dialog and change the No. of
Standard Levels entry. To do this, you must not change the Integration file reference before clicking
OK. If the new number of standard levels is greater than the old number, the existing values in all the
LEV columns will be preserved, and one or more new blank LEV columns will be added to the
Reference Table. If the new number of standard levels is less than the old number, pre-existing LEV
columns will be deleted from the old Reference Table along with their contents, beginning with the
last LEV column present.
10.2.1.2 Setting Curve Fit Types for Each Peak
The Reference Table defines the manner in which multiple standard levels will be mathematically fit
to compute the overall "standard response curve" for each peak. To do this, each peak or row in the
Reference Table must have a code entry which determines the type of curve fitting to be done for
multilevel calibrations. The FIT column is provided for this function if the number of levels is set to
any value greater than one - the default fit type is Linear Regression. Each peak may have its own
unique curve fitting type/code, regardless of that used for any other peaks. The Data Ally calibration
system treats each peak totally independently of all others.
The following codes are available for programming various types of curve fitting:
L
L0
I
Q
Q0
=
=
=
=
=
Linear Regression
Linear Regression, force through zero
Interpolated Point to Point
Quadratic/Polynomial
Quadratic/Polynomial force through zero
181
Data Ally Chromatography Manager Operators Manual
Note that if only one calibration level has been selected, none of these options will apply and only a
simple single-level response factor calculation will be made - this is essentially a Linear fit through
zero. If only two calibration levels are allowed, only Linear Regression fitting is permitted. If three or
more levels are specified, all the fit options are allowed.
FIT codes must be provided for each row in the FIT column. If all peaks will use the same fit, that
code needs to be entered only once in the FIT column, in its top row, and the AutoFill function used to
fill all subsequent peak rows with the same command.
Ü To define the curve fit for any peak, click inside the FIT column cell in that peak's row and either
type the code for the desired fit type. You can also use the FILL command to AutoFill Duplicate
values of any entered fit code into other rows. To AutoFill the FIT column, place the Edit cell highlight
on any desired row, and click on the FILL button to display the AutoFill dialog box. Select Duplicate,
select the range desired, and click OK to fill the column.
Figure 10.5 AutoFilling Curve Fit Type
You can change the FIT instructions for any peak(s) at any time after a Reference Table is set up
and calibration data have been logged for those peaks. Simply click on the FIT cell for the peak to be
modified, and type in the new FIT command code. Press ENTER, CTRL-arrow, or click inside any
other cell in the table to make the entry see the results in the Plot window or on Cancel to abort the
change. If Cancel is selected, the previous FIT command entry will be automatically restored.
Note that in Configuration each time base can be defaulted to only a limited number of curve fit
options or to only a single option. If one fit option only is permitted, usually the FIT column will not be
selected for display when configuring.
10.2.1.3 Defining Calibration Basis for Each Peak
Each peak in the Reference Table can be calibrated on either an Area basis (the default) or Height
basis. The basis can differ for any individual peak according to the code (A or H) placed in each
peak's BASIS column.
Ü To set the basis for any peak, click inside the BASIS column cell in that peak's row, and type in the
desired basis code (A or H).
182
Data Ally Chromatography Manager Operators Manual
If you wish to AutoFill the BASIS column values by Duplicating an existing entry (or clearing a range
of rows), click on the BASIS column header button to bring up the FILL dialog box (Figure 10.5). Set
the mode and range and click on OK to fill.
Note that the BASIS column can be omitted from the Reference Table when configuring the
Calibration screen if the calibration basis is to permanently locked for either area or height for all
peaks. The system defaults to an A (Area) BASIS at the time a new Reference Table is set up.
You can change the BASIS for any peak(s) at any time after a Reference Table is set up and
calibration data have been logged for those peaks. Simply click on the BASIS cell for the peak to be
modified, and type in the new BASIS command code. Press ENTER, CTRL-arrow, or click inside any
other cell in the table to make the entry - a dialog box (Figure 10.6) will appear prompting that you are
changing the current calibration and asking for approval. Click OK to make the change for the peak
and see the results in the Plot window or on Cancel to abort the change. If Cancel is selected, the
previous BASIS entry will be automatically restored.
Figure 10.6 Changing Basis for Existing Peak in Reference Table
10.2.1.4 Setting Concentration/Reporting Units for Each Peak
The UNITS column for each peak defines the label to be applied to all reported results. In Data Ally,
units are completely arbitrary for any individual peak. For example, one peak can be reported as
mg/µl, with another peak reported as g/ml. It is possible to enter a units label along with any numeric
concentration value in any LEVx column in the Reference Table. If such units terms are provided,
Data Ally will automatically compensate for differences among units input in different LEV columns
for any single peak. However, if an entry is made in the UNITS column, any individual units labels
inserted in any LEV column must be interpretable into the type of units specified in the UNITS
column. For example, if the UNITS column entry for a peak is "mg/dl", you can make entries of
"µg/ml" or "g/l" into any LEVs columns for that peak - however, you cannot make an entry of "L"
(liters) or "G" (grams) in any of the LEV columns, since Data Ally has no way to determine the
relationship between these entries and the UNITS of mg/dl.
Generally, you will want to use the units designator for each peak component in which the numerical
standard concentration values will be entered in the LEVX columns. UNITS entries will be used in
every on-screen or printed report, and as part of any saved report files. Note that UNITS values need
not be entered in each row in the UNITS column - any entered value will also apply to blank rows in
the UNITS column below that value, until the next value in a subsequent row is encountered. For
example, if all peaks will be reported with the same units designator, that designator needs to be
entered only once in the UNITS column, in its top row corresponding to the first peak.
183
Data Ally Chromatography Manager Operators Manual
Ü To set quantitative reporting units for any peak, click inside the peak's UNITS column cell, and type
in the desired units. Note that there is no right-button selector available for units entry, since any
alphanumeric units designator can be used. You can also use AutoFill to Duplicate or Clear entries
in the UNITS column by clicking on the UNITS column header button, and setting the fill mode and
range.
There is no UNITS default in the Peak Reference Table - if no entries are made for any peak, no
units designator will be printed along with any numerical results. The presence or absence of a units
designator will not affect whether or not a peak is actually calibrated and quantitated.
10.2.1.5 Entering Concentration Levels for Each Peak
At the right side of the Reference Peak Table, one or more LEV columns are provided, depending
upon the entry made for No. of Standard Levels in Setup. At least one LEV column must always be
present in order to define a valid Calibration file. The LEV columns represent up to sixteen different
standard samples, with unique or replicate concentration values, to be used to calibrate each peak. It
is assumed that when a level is defined in the Reference Table, that level refers to an actual
preparation or vial of standard material which will actually include the stated concentrations for each
peak component to be calibrated.
LEV values can be entered in any manner desired. At least one LEV concentration value must be
entered for at least one peak in a valid Calibration file. Not every LEV column has to contain values
for every peak. For any given peak, LEV values consecutive columns can be ascending,
descending, mixed, random, or the same. LEV columns can be skipped as desired for any peak.
As an example, you can enter LEV1=50, LEV2=100, LEV3 and LEV4 blank, and LEV5=20 for peak
A, and LEV3=400, LEV4=400, LEV5 through LEV8 blank, and LEV9=400 for peak B. It is important
to make absolutely sure that the concentration values entered for any peak/level actually represent
the composition of the standard material to be injected which corresponds to that level.
Ü To enter a LEV concentration value for any peak, click inside the desired peak's LEVX column cell,
and type in the numeric concentration value for the standard assigned to that level. You can use
AutoFilling to Duplicate or Increment LEV column entries as desired, by clicking on the LEVX column
header button and completing the FILL dialog box instructions.
LEV column entries are numerical only and should not have units designators such as g/dl entered as
well in addition to a numerical value. The UNITS column should be employed for this purpose.
If you reset No. of Standard Levels to reduce the number of level columns present in an existing
Reference Peak Table, by repeating the Setup command, existing LEV column entries in the to-bedeleted columns will be removed and lost.
It is usually advisable to program the Reference Peak Table with sufficient LEV columns to represent
the maximum number of different standards you may theoretically wish to use for calibration
purposes. Any subset of levels for any combination of peaks can be programmed in the Reference
Table at any time.
Once you have assigned all the desired level information for your standards for each peak, you must
save your calibration file to prepare it for use in executing calibrations. At least one level
concentration value must be defined for at least one peak in order for calibration responses and
results to be generated. Note that as many different Calibration files as desired can exist at any time
referencing the same Integration Peak Table. However, only one Calibration file can be used in
conjunction with any single Integration file at any time. A description can be entered for a Calibration
file at the time the Save As command is used (see Section 10.5.3 below).
184
Data Ally Chromatography Manager Operators Manual
Ü To save the Calibration file with the newly-edited Reference Peak Table, use the Files/Save As
command (Section 10.5.3 below). Once a Calibration file is saved, it can be called automatically in
any Method or Sequence for updating or use in results quantitation.
10.2.1.6 Using FILL Functions in the Reference Table
The standard AutoFill functions are accessible for completing entries in the BASIS, FIT, UNITS, and
LEVx columns in the Calibration Reference Table. Use the FILL button at bottom right of the
Reference Table window to bring up the AutoFill dialog after selecting the desired column to be filled
by clicking on its header button. The AutoFill dialog (Figure 10.5) operates in exactly the same
manner as that provided in the Events, Peak, and Sequence tables. A complete explanation of the
features of the AutoFill dialog is found in Section 8.3.
In the Calibration Reference Table, the "Duplicate" mode is active for the UNITS, BASIS, FIT, and
LEVx columns. "Increment" mode operates on the LEVx columns only, and there is no "Fill From
Graph" mode.
The following actions can be performed using the AutoFill dialog:
Ü To fill an existing row's value into all currently empty rows in the column up to the next entry,
place the edit highlight on the "basis" row, click FILL to see the AutoFill dialog, select "Duplicate",
"Current Cell", and "To Next Entry", with all other fields and options blank/off. If the "basis" row is the
first row in the column, you can select "Start of Table" instead of "Current Cell" without highlighting
the basis row.
Ü To fill an existing row's value into all currently empty rows in the entire column, place the edit
highlight on the "basis" row, click FILL to see the AutoFill dialog, select "Duplicate",
"Current Cell", and "End of Table", with all other fields and options blank/off.
Ü To fill an existing row's value into more or less empty rows than the number of empty rows found in
the current column up to the next entry, place the edit highlight on the "basis" row, click FILL to see
the AutoFill dialog, select "Duplicate", "Current Cell", and "To Next Entry". Type the actual number of
empty rows to be filled into the "No. of Steps" column, with all other fields and options blank/off. If the
"No. of Steps" value exceeds the number of actual intervening empty rows, sufficient new rows will be
added and filled to meet the "No. of Steps" criteria.
Ü To fill all currently empty series of consecutive rows in the column with the values found in the rows
prior to each empty group of rows, click FILL to see the AutoFill dialog, select "Duplicate",
"Start of Table", "End of Table", and "Allow Progressions", with all other fields and options blank/off.
Ü To overwrite existing values (along with any blank rows) with duplicated values in an entire column,
place the edit highlight on the "basis" row for copying, click FILL to see the AutoFill dialog, select
"Duplicate", "Current Cell", and "End of Table", and check the "Allow Overwrites" command, with all
other fields and options blank/off.
Ü To clear (remove) existing values in an entire column, insert a blank row at the beginning of the
table, place the edit highlight on that row, click FILL to see the AutoFill dialog, select "Duplicate",
"Current Cell", and "End of Table", and check the "Allow Overwrites" command.
Ü To overwrite existing values in a portion of a column with a duplicated value, place the edit highlight
on the "basis" row for copying, click FILL to see the AutoFill dialog, select "Duplicate", "Current Cell",
"End of Table", and "Allow Overwrites", and enter a "No. of Steps" value corresponding to the number
of existing rows to be filled with duplicates. All other fields and options should be blank/off. If the
number of steps exceeds the number of blank rows in the column, the "Allow Insertions" box must be
checked to add sufficient rows to meet the "No. of Steps" criteria.
185
Data Ally Chromatography Manager Operators Manual
Ü To clear (remove) existing values in a portion of a column, insert a blank row at the beginning of the
range to be cleared (or remove an existing row entry), place the edit highlight on that row, click FILL
to see the AutoFill dialog, select "Duplicate", "Current Cell", "End of Table", and "Allow Overwrites",
and enter a "No. of Steps" value corresponding to the number of existing rows to be cleared (filled
with a blank entry). If the number of steps exceeds the number of blank rows in the column, the
"Allow Insertions" box must be checked to add sufficient rows to meet the "No. of Steps" criteria.
Ü To fill a column in a new table with incremented values, enter the beginning "basis" value in the first
row, place the edit highlight on that row, click FILL to see the AutoFill dialog, select "Increment",
"Current Cell", and "End of Table", enter the increment value in the "Increment" field, and enter the
number of rows for which incremented values are to be inserted in the "No. of Steps" field.
Ü To fill a column with incremented values in blank rows up to the next existing entry, place the edit
highlight on the "basis" row, click FILL to see the AutoFill dialog, select "Increment", "Current Cell",
and "To Next Entry", and enter the increment value in the "Increment" field; leave other fields and
options blank/off.
Ü To fill an existing row's incremented value into more or less empty rows than the number of empty
rows found in the current column up to the next entry, place the edit highlight on the "basis" row, click
FILL to see the AutoFill dialog, select "Increment", "Current Cell", and "To Next Entry". Type the
increment value into the "Increment" field, and the actual number of empty rows to be
filled/incremented into the "No. of Steps" column, with all other fields and options blank/off. If the "No.
of Steps" value exceeds the number of actual intervening empty rows, sufficient new rows will be
added and filled to meet the "No. of Steps" criteria.
Ü To fill all currently empty series of consecutive rows in the column with incremented values based
on the rows prior to each empty group of rows, click FILL to see the AutoFill dialog, select
"Increment", "Start of Table", "End of Table", and "Allow Progressions". Type the increment step
value for each row into the "Increment" field, with all other fields and options blank/off.
Ü To fill a column with incremented values in all blank rows based on an existing entry, place the edit
highlight on the "basis" row, click FILL to see the AutoFill dialog, select "Increment", "Current Cell",
and "End of Table", and enter the increment value in the "Increment" field; leave other fields and
options blank/off.
Ü To fill a range of rows with evenly-spaced, automatically computed values, with each row's value
corresponding to the difference between the basis cell's value and the value of the next row having a
non-blank entry in the column divided by the number of intervening rows, place the edit highlight on
the "basis" cell (first row in the range), click FILL to see the AutoFill dialog, select "Increment",
"Current Cell", and "To Next Entry". If you wish to fill only the existing number of blank intervening
rows, leave the "No. of Steps" field and all other commands blank/off. If you wish to fill either only
some of the intervening rows, or to add new intervening rows, enter a number in the "No. of Steps"
field specifying the total number of intervening rows to be filled. If "No. of Steps" exceeds the number
of existing blank lines in the range, you must check the "Allow Insertions" box to automatically add
and fill sufficient lines to match the "No. of Steps" entry.
Ü To fill all existing ranges of empty rows in the column with evenly-spaced, automatically computed
values, with each filled row's value corresponding to the difference between the value of the cell
immediately preceding that range and the value of the next row having a non-blank entry following
the range divided by the number of intervening rows, click FILL to see the AutoFill dialog, select
"Increment", "Start of Table", and "End of Table". Leave all other selections blank/off.
Ü To overwrite existing values (along with any blank rows) with incremented values in an entire
column, place the edit highlight on the "basis" row for incrementing, click FILL to see the AutoFill
dialog, select "Increment", "Current Cell", and "End of Table", enter the increment value in the
186
Data Ally Chromatography Manager Operators Manual
"Increment" field, and check the "Allow Overwrites" command, with all other fields and options
blank/off.
Ü To overwrite existing values in a portion of a column with incremented values, place the edit
highlight on the "basis" row for copying, click FILL to see the AutoFill dialog, select "Increment",
"Current Cell", "End of Table", and "Allow Overwrites", enter the increment value in the "Increment"
field, and enter a "No. of Steps" value corresponding to the number of existing rows to be filled with
duplicates. All other fields and options should be blank/off. If the number of steps exceeds the
number of blank rows in the column, the "Allow Insertions" box must be checked to add sufficient
rows to meet the "No. of Steps" criteria.
10.2.2 The Calibration Point Table
The Calibration Point Table, like the Method Events and Peak Tables, is a "spreadsheet" with
columns and rows (Figure 10.7). It is intended as a simple means of displaying all the desired
information about each standard calibration run which is currently accumulated in the Calibration file.
The columns listed in the Table are configurable, so that only the types of information needed can be
included in the Table, in the order desired. When you view the calibration screen, you are seeing the
Point Table (and Plot) corresponding to the currently-selected peak in the Peak Reference table;
highlighting a different peak in the reference table will cause that peak's Calibration Point Table and
Plot to be displayed instantly. The name of the currently-selected peak will always appear on the top
bars of both the Calibration Point Table and Plot windows.
Because you can select which columns/types of information will appear in this table, and change the
column order and individual widths, the Calibration Point Table is an extremely versatile way to
display data regarding standard chromatograms. The table is also fully interactive with the Plot
window (below) to assist in reviewing the nature of this data. Of course, the Calibration Point Table
window can be moved or resized as desired at any time.
Ü To view the Calibration Point Table and Plot for any peak in the Reference Table, move the
Reference Table highlight to the desired peak's row by clicking anywhere in that row, or by using the
scroll arrows. The Point Table and Plot will immediately change to show the current data for the new
peak - the top bars of both these windows will show the name assigned to the peak.
Figure 10.6 Calibration Table
Each time a new standard is run and its responses applied to a component peak at any defined level,
a new line is added to the Calibration Point Table describing that standard. Each line includes
information on the Level, Concentration, Area Response, Height Response, Response Factor, and
Chromatogram filename for that standard, as well as dilution or weighting factors (see Section 5.2.5.4
for a complete list of configurable column items for the Calibration Point Table). Lines describing
standard runs are listed in the order which corresponds to the position of columns in the table.
Entries are sorted based first on the contents of the leftmost column in each row (in ascending
order), then on the contents of the second column, third column, etc.
Like all other Data Ally tables, the Calibration Point Table features a dual-function line numbering
ENABLE column at far left, which is always visible regardless of the current view of the table
187
Data Ally Chromatography Manager Operators Manual
selected. Each time a new line is added to the table it automatically receives the next available line
number. Normally, all new lines have the ENABLE column highlighted, the data in each line being
enabled and used to compute the calibration response or curve fit. Double-clicking on the ENABLE
column cell for any row in the table causes the highlight to disappear and that row to become
disabled, thus removing it from the computation and effectively "failing" that standard from the
calibration of that peak. This is an extremely convenient tool for testing the effect of removing outlier
runs from certain calibrations.
You can use the scroll bars at the bottom and right of the table to move through all of the rows and
columns, as well as the <PgUp>/<PgDn> keys (to move up and down a fixed number of rows), the
CTRL-Home and CTRL-End commands (to move to the leftmost and rightmost columns), the <TAB>
or <ENTER> keys (to move one cell to the right), and the CTRL-PgUp and CTRL-PgDn commands
(to move to the first row or last row). At any time, one line in the table will be highlighted. The
highlight can be moved to a different line by clicking the left mouse button on any desired column in
the row to be highlighted. As in the other Data Ally tables, the highlight represents the "editing point"
inside the table. Unlike the other Data Ally tables, the Calibration Point Table is mainly a reviewing
tool rather than a programming tool and thus permits very limited editing.
Like all the other Data Ally tables, you can resize any table columns at any time by using the special
header column button double-arrow cursor to "drag" column header borders to desired positions.
You can also "drag" entire columns to any relative position in the table in order to achieve the most
useful view of the table contents at any time.
Note that the COPY/CUT/PASTE/FILL command buttons at the bottom of the Calibration screen are
not active for the Calibration Point Table window. This is because the values in the Calibration Point
Table are derived from actual standard runs, and are not intended for manual editing. The only ways
to remove standard run data which has been logged into the Calibration Table via manual or
automatic calibration is to either use Setup again to restructure and reinitialize the table or to use the
Clear Calibration/Clear Point Table command (Section 10 below).
Every line in the Table, representing a single standard injection with all its corresponding data, has a
corresponding "data point" on the graphical plot in the Calibration plot window above. If standards at
more than one concentration level have been run, a "multilevel calibration" has been produced, and a
calibration curve is fit and plotted to the points in the Plot Window representing all the data.
The current "highlighted" position in the Calibration Point Table is dynamically linked to the Plot
window, so that the plotted data point corresponding to that line is always itself highlighted (circled) in
the plot. Moving the highlight to a different point in the plot automatically moves the table highlight to
indicate the data for that new point, and vice versa.
10.2.3 The Calibration Plot
The Calibration Plot (Figure 10.7) is a visual tool for analyzing the quality and characteristics of a
Calibration file for any peak which is being used to generate quantitative results for unknowns. All
standard response data in the Point Table will always be plotted automatically, in a manner selected
via Calibration Options (see Section 10.3.6 below). Usually, the default plot setup is for a plot of
standard area versus concentration; the nature and axes units for this plot can be modified. Each
time a new calibration run is completed and its result added to the calibration table, a corresponding
point representing that result is added to the plot. Points corresponding to individual standard runs
which are currently "active" (included in the Calibration Curve computation) are shown in one color in
the Plot, while points which are "disabled" (via double-clicking the ENABLE/line number column) and
not included in the current Calibration computation are shown in red. The Plot window normally uses
AutoScaling to size its axes to contain the highest-value points from the current calibration. It is also
normally defaulted to plot standard concentration (corrected concentration) versus basis (area or
height).
188
Data Ally Chromatography Manager Operators Manual
Figure 10.8 Calibration Plot Window
Superimposed over the scatter plot of all the standard data points is the current "calibration curve"
which is computed using the curve fit method currently selected in the Reference Peak Table for the
current peak. The fit method can be changed easily for replotting. For close visual inspection of a
calibration plot, it may be convenient to maximize the Plot window by clicking on its Program Control
Maximize button at upper right. The Plot window can, of course, also be resized and moved to any
desired location or shape on screen.
The current curve fitting coefficients and FIT mode are displayed in the upper left corner of the Plot
window at all times for the peak whose data is being viewed.
The Plot window is normally autoscaled so that the scaling in both axes represents the range
between zero and the maximum actual response and concentration values logged into the Calibration
table. If no data are present in the Calibration table (i.e. no standards have actually been run yet), the
scaling of the plot window represents the full range of the calibration levels defined in the Reference
Peak Table. Each time you change the Fit type, Basis, standardization type (external or internal), or
other relevant criteria defined in the Reference Table for any peak, the Plot will immediately be
modified and replotted accordingly. You can use this feature to graphically and quickly test the
effects of, for example, changing a curve fit for any peak, or deleting certain standard points from a
calibration curve as a trial.
It is possible to use "rubber-band" zooming in the Plot Window to see an expanded view of the
plotted information. This is done in exactly the same manner as normal zooming in the Graph
windows. Zooming is useful to get a clearer view of regions in which several replicate points may be
nearly overlapping.
Ü To execute a zoom inside the calibration plot, move the pointer cursor to the position in the plot
where you want the zoomed view to begin, hold down the left mouse button, and rubber-band the
desired view - when the dotted line on the plot shows this view, release the mouse button and the
new view will be drawn. You can zoom repeatedly as many times as you like until the limit of
resolution is reached. To unzoom, click the right mouse button to see the previous view. Repeated
clicking of the right button will always return to the original autoscaled plot.
Note that when a peak is first selected via the Reference Table, one point in the Plot window is
always highlighted (surrounded with a small circle), which corresponds to the top calibration run row
highlighted in the Calibration Point Table. Double-clicking the left mouse button on a different point in
the plot will cause the highlight in the Table to move instantly to the run represented by that point. By
189
Data Ally Chromatography Manager Operators Manual
the same token, clicking the edit cell anywhere in any row of the Calibration Point Table will cause the
circle highlight in the Plot to move to the point represented by that row’s standard injection. Thus, the
Plot and Point Table windows are completely interactive.
If any rows are present in the Calibration Point Table, and/or any points are present in the Plot, for
any peak, that peak has been calibrated and a result can be computed, since a response factor is
present for the peak in memory. An unlimited number of additional calibrations (lines and points) can
be added for any given peak(s). In typical operating mode, Data Ally will continue to capture
cumulative calibration data into an open Calibration file until the user decides to either clear and
restart a new calibration in that file (via the New calibration command option) or the user selects the
Files/Clear command to remove all existing calibration information from the current file.
As soon as a single point appears for any peak in the Calibration Point Table, a plotted line will be
drawn in the plot window between that point's position and the plot's origin. This line represents the
relationship between concentration and response, and will be updated and re-averaged as additional
points are added. Use of the Linear (L) and Quadratic (Q) curve fit options will result in a plot of
multiple standard level data ranging from the highest standard run to the x or y axis of the plot - the yintercept value will always be included in the plot. If the fit through zero option codes are used (L0 or
Q0), the plotted line will always pass through the origin. For Interpolated fit options, the plot will only
span the actual range of standards run and shown in the Calibration table. An Interpolated fit plot will
only pass through the origin if one or more standards run has been designated as a zero
concentration level (blank) or if the I0 code has been used for FIT to extrapolate through the origin.
If the current Calibration includes internal standardization, or correction factors for dilution, weight,
injection volume, or user-defined factors, the Plot Window will generally show a plot of "corrected"
concentration and/or basis (area or height) values, with the plot labeling indicating the correction. For
example, if weight factors are used for all standards and unknowns, the standard curve in the plot
window will actually be a graph of area/height versus a "corrected" concentration which equals the
given concentration for each standard level in the Reference Table multiplied by its given Weight
factor.
10.3.0 Theory of Calibration
Data Ally calibrations are performed using standard models for computing response factors and
multiple level curve fits, with or without internal standards and the use of other correction factors to
account for sample dilutions, injected volumes, and measured weights.
There are two basic modes of calibration available. In External Standard mode, standards consisting
of varying known amounts of mixtures of the peak components to be measured in all unknowns are
injected, and response factors or curves generated from the known responses of the standards. In
Internal Standard mode, each peak to be quantitated is assigned one Internal Standard peak as a
reference, and the responses computed via external standards are corrected on a peak-by-peak
basis to account for differences in recovery of the Internal Standard peak(s) from run to run. Any
individual peak in a Peak Table and any Calibration Reference Table using that Peak Table can be
calibrated in External (ES) or Internal (IS) Standard mode, provided suitable Internal Standard peaks
are incorporated in each run and identified as references in the Peak Table's IS column. All curve
fitting, basis, and correction factor options are available, regardless of the mode selected for any
peak.
10.3.1 External Standard Calibration
In External Standard calibrations, an ES code is placed in the CAL column of the Peak Table for all
peaks to be calibrated in this mode. Up to sixteen different concentration levels for external
standards are specified for each individual peak in the Calibration Reference Table, which must
correspond to the exact concentration values expected for each external standard mixture injected.
190
Data Ally Chromatography Manager Operators Manual
For single point External Standard mode, the Response Factor is defined as
RF =
Corrected Concentration
Basis (Area or Height)
where
Corrected Concentration = Nominal Concentration (from Ref. Table LEV value)(Weight)(Inj. Vol.)
Dilution
In most cases, the nominal concentration given for each level in the Reference Table should
represent the actual concentration of the standard in the injected aliquot. If the injected volume will
vary among standards and unknowns, an Injection Volume can be input for each sample. If a
predilution of stock standards is to be injected, Dilution factors can be entered to compensate for the
dilution of the injected material. If standards and unknowns are to be weighed out for injection, a
Weight factor can be input for each sample. Note that if Injection Volume or Weight factors are input
for any individual standard, they must be input for all standards and all unknowns for results to be
obtained. If such a factor is not input, an error condition will result when attempting to perform or
update a calibration or generate quantitative results for unknowns. Dilution factors can be entered as
needed on an individual basis for standards or unknowns at any time - if no specific dilution factor is
provided, Data Ally assumes the dilution factor is one.
The standard definition of RF above, the change in concentration versus change in basis, is
represented by the default plotting of Corrected Concentration as the ordinate and Basis (area or
height response) as the abscissa in the Calibration Plot window.
10.3.1.1 Single Level Calibration
For single level calibration, the results for each unknown are computed by the formula
Actual Concentration = (RF)(Basis of unknown)(Dilution)
(Weight)(Injection Volume)
Single-level calibration can include as many replicates of the same corrected concentration as
desired, all replicates being averaged together with equal weighting. As long as at least one standard
run appears in the Calibration Point Table, a single level calibration will be plotted in the Plot window
with the theoretical response curve drawn from the plot origin through the logged response value.
For multiple level external standard calibrations, corrected concentrations for each standard are
compared to measured peak areas or heights via regression fitting, utilizing either linear, quadratic,
exponential, or interpolated methods, to determine the relationship between concentration and
response over a range of values.
10.3.1.2 Multiple Level Calibration - Linear Regression
If linear regression curve fit is selected, regression is used to determine the coefficients which best fit
the linear relationship
Corrected Concentration = KB (Basis) + KC, where
KB =
nΣCxBx - (ΣBx)(ΣCx)
nΣBx2 - (ΣBx)2
(slope)
191
Data Ally Chromatography Manager Operators Manual
KC =
ΣCx
n
with
Cx = the corrected concentration of component x
Bx = basis (area or height) of component x
n = number of standards run
- (KB)(ΣBx)
n
(concentration intercept)
Once the corrected concentration is found for a peak's basis, the actual concentration for that peak is
computed by
Actual Concentration = (Corrected concentration)(Dilution)
(Weight)(Injection Volume)
For linear fits, a correlation coefficient (r) can also be computed as a measure of goodness of fit:
r=
n(ΣCxBx) - (ΣBx)(ΣCx)
√[nΣBx2 - (ΣBx)2][nΣCx2 - (ΣCx)2]
In most instances, when linear regression fitting is used, the concentration intercept term KC will not
be zero. If you wish to cause the KC term to be "forced" to go through zero, in order to equate a peak
basis (area or height) of zero with a concentration of zero, you can use the "L0" curve fit option
instead of the normal "L" fit. The L0 fit code causes the regression to be computed in the usual
manner, as above, and then changes the KC term to zero regardless of its computed value to force
the curve through the origin. It is advisable to evaluate the true responses of low-concentration
standards before using the L0 option, in order to avoid inappropriate alterations of unknown results.
With either L or L0 curve fits, the Calibration Plot will always draw the plotted theoretical response
curve from the concentration intercept value through the maximum standard concentration/basis
value found in the Calibration Point Table.
10.3.1.3 Multiple Level Calibration - Quadratic Regression
If quadratic (polynomial) regression fitting is selected, the existing standards will be used to
determine the coefficients which best fit the polynomial curve
Corrected Concentration = KA (Basis2) + KB (Basis) + KC, where
KA =
n[(ΣBx2)(ΣBx2Cx) - (ΣBxCx)(ΣBx3)] + ΣBx[(ΣCx2)(ΣBx3) + (ΣBxCx)(ΣBx2)] - (ΣBx2Cx)(ΣBx)2 - (ΣCx2)(ΣBx2)
n[(ΣBx2)(ΣBx4) - (ΣBx3)2] + 2(ΣBx)(ΣBx2)(ΣBx3) - (ΣBx)2(ΣBx4) - (ΣBx2)3
KB =
n[(ΣBxCx)(ΣBx4) - (ΣBx3)(ΣBx2Cx)] + ΣBx[(ΣBx2)(ΣBx2Cx) - (ΣCx2)(ΣBx4)] + ΣBx2[(ΣCx2)(ΣBx3) - (ΣBx2)(ΣBxCx)]
n[(ΣBx2)(ΣBx4) - (ΣBx3)2] + 2(ΣBx)(ΣBx2)(ΣBx3) - (ΣBx)2(ΣBx4) - (ΣBx2)3
KC =
192
ΣCx2[(ΣBx2)(ΣBx4) - (ΣBx3)2] + ΣBxCx{(ΣBx2)(ΣBx3) - (ΣBx)(ΣBx4)] + ΣBx2Cx[(ΣBx)(ΣBx3) - (ΣBx2)2]
n[(ΣBx2)(ΣBx4) - (ΣBx3)2] + 2(ΣBx)(ΣBx2)(ΣBx3) - (ΣBx)2(ΣBx4) - (ΣBx2)3
Data Ally Chromatography Manager Operators Manual
After determining the corrected concentration for any unknown peak from the standard curve, its
actual concentration is computed from
Actual Concentration = (Corrected concentration)(Dilution)
(Weight)(Injection Volume)
If the "Q" curve fit option is used in the Calibration Reference Table, the concentration intercept KC
will usually not equal 1. The "Q0" fit option can be employed to force a quadratic curve fit to go
through the origin so that KC = 0. For the Q or Q0 fit options, the Calibration Plot window will always
draw the theoretical best-fit response curve plotted from the concentration intercept value through the
maximum standard concentration/basis found in the current Calibration Point Table.
10.3.1.4 Multiple Level Calibration - Interpolation
To use the Interpolated curve fitting option, select the "I" code in the Reference Table FIT column for
any peak(s). Interpolated fitting computes linear curve fit segments between each corrected
concentration level found in the current Calibration Point Table, with all replicates at any single level
cumulatively averaged to find the response for that level. Within each segment, the same linear
regression curve fitting procedure is applied as described above in Section 10.3.1.1, to determine a
slope (KB) and intercept (KC) specific for that segment. The curve fit for each segment is used only
to compute results for unknowns whose response basis falls within that particular segment. As many
different segments are calculated as needed to represent the entire response curve in the Calibration
Point Table. Although a maximum of 16 nominal concentration levels can appear in the Calibration
Reference Table, the number of corrected concentration levels can exceed 16 if various correction
coefficients such as dilution, weight, injection volume, or user defined factors are utilized.
With Interpolated fits, the Calibration Plot window always plots only the theoretical curve between
each of the interpolated segments. The I0 "fit through zero" code can be used to extend an
interpolated fit from the lowest standard response value in the Calibration Point Table to the origin.
Unknown peaks which have a response basis below the lowest value in the plot or above the highest
value will not be computed, and will be labeled "beyond interpolation limits" in any quantitative reports
produced.
10.3.2 Internal Standard Calibration
In order to compensate for inter-run or inter-sample differences, internal standard components can
be added to all standard and unknown samples and employed to correct for such variations.
Although no single component peak in any chromatogram can have more than one associated
internal standard peak, it is possible to have up to five different sets of peaks associated with five
different internal standard components in a single chromatogram. It is also possible for some peaks
in a chromatogram to be calibrated only with external standards, while others are referenced to
internal standards.
Note that when Internal Standards are used, all calibration standards and unknowns must have
values supplied by the operator indicating the concentrations of every Internal Standard peak.
Normally, when running standards during calibration, the Internal Standard concentrations for each
standard level will be listed in the Calibration Reference Table LEV columns for each IS peak, and
will be employed automatically for the required calculations each time a standard is run and used to
update the Calibration Point Table. Alternatively, the operator can key in exact values for each IS
peak at each standard level manually or as part of a Method or Sequence program. If all required IS
peak concentration values are not supplied when running a standard, those peaks which are
calibrated against IS peaks lacking values will not have their current Calibration Point Tables
updated. If all required IS peak concentration values are not supplied when running any unknown
sample, those peaks calibrated against IS peaks lacking values will not be reported.
Components added to a sample mixture as internal standards must normally not be expected to
occur in unknowns to be analyzed. It is helpful if internal standard peaks are well resolved from other
193
Data Ally Chromatography Manager Operators Manual
peaks, so that their areas can be clearly determined in each run. Use of differing Internal Standard
peak concentrations is allowed for different standard levels during calibration, or for different
unknowns. However, most internal standard calibration techniques involve the "spiking" of the same
known amount of each internal standard component into all standards and unknowns,
making programming and computational requirements very simple.
For a single-level internal standard calibration for any peak x, the "relative response factor" is defined
as
RFRel = (Corrected Concentration of x)(Basis of IS)
(Basis of x)(Concentration of IS)
where IS is the internal standard peak used for peak x. By this definition, peaks used as internal
standards will always have a defined RFRel = 1. Whenever any internal standards are used in any
Calibration file's Reference Table, it is assumed that all calculated and reported RF values are RFRel.
Note that internal standard concentrations are never corrected in any manner for dilution, weight, or
injection volume, since it is always assumed that the stated value for the amount/concentration of
internal standard injected represents the exact injected value. In most cases, if internal standards
are used, factors correcting for dilution, weight, injection volume, or other sample-specific differences
are not necessary since the recovery of the internal standard itself will automatically compensate for
any of these elements and conditions. The value input as IS AMT for any internal standard in the
Graph/Edit/Calibrate or Analyze dialogs, the Method Sample Info dialog, or the Sequence table will
always be returned in any result reports as the actual target value, regardless of any other correction
factors used.
Correction factors such as Dilution, Weight, Injection Volume, and User-Defined factors may still be
used with Internal Standardization, but such factors will be applied only to the final result after any
internal standard correction is made. To avoid confusion and potential result errors, it is strongly
recommended that such factors should not be employed when internal standard calibrations are
performed.
10.3.2.1 Single Level Calibration With Internal Standard
For single level calibration, the results for each unknown are computed by the formula
Concentration = (RFRel )(Rel. Basis)(Dilution)
(Weight)(Injection Volume)
where
Rel. Basis =
(Basis (Area or Height) of Unknown)(Conc. of Internal Standard)
(Basis of Internal Standard)
As for external standard calibrations, single-level internal standard calibration can include as many
replicates of the same corrected concentration as desired. The basis used for each Internal
Standard peak can be either area or height regardless of the basis of the unknown peak to be
measured, as long as the same basis is used for any single Internal Standard peak in all standards
and unknowns.
For multiple level internal standard calibrations, the corrected concentration for each standard level is
compared to its measured relative basis (area or height) against its internal standard peak, via
regression fitting, utilizing either linear, quadratic, exponential, or interpolated methods. Relative
basis is computed for each unknown peak in each unknown run, and then employed to convert the
relative RF obtained from the curve fit to the final result.
194
Data Ally Chromatography Manager Operators Manual
10.3.2.2 Multiple Level Internal Standard Calibration - Linear Regression
If linear regression curve fit is selected, regression is used to determine the coefficients which best fit
the linear relationship
Corrected Concentration = KB (Rel. Basis) + KC, where
KB =
nΣCxRx - (ΣRx)(ΣCx)
nΣRx2 - (ΣRx)2
(slope)
KC =
ΣCx
n
(concentration intercept)
with
Cx =
the corrected concentration of component x
Rx =
(basis of component x)(concent. of IS)
(basis of IS)
n =
number of standards run
- (KB)(ΣRx)
n
The actual concentration of an unknown peak is then found as
Actual Concentration = (Corrected concentration)(Basis of IS)(Dilution)
(Concent. of IS)(Weight)(Injection Volume)
For linear fits, a correlation coefficient (r) can also be computed as a measure of goodness of fit:
r=
n(ΣCxBx) - (ΣBx)(ΣCx)
√[nΣBx2 - (ΣBx)2][nΣCx2 - (ΣCx)2]
As with external standard calibrations, the "L0" curve fit option can be used instead of the normal "L"
fit to change the KC term to zero regardless of its computed value, to force the curve through the
origin. With either L or L0 curve fits, the Calibration Plot will always draw the plotted theoretical
response curve from the concentration intercept value through the maximum standard
concentration/basis value found in the Calibration Point Table.
10.3.2.3 Multiple Level Internal Standard Calibration - Quadratic Regression
If quadratic (polynomial) regression fitting is selected, the existing standards will be used to
determine the coefficients which best fit the polynomial curve
Corrected Concentration = KA (Basis2) + KB (Basis) + KC, where
KA =
n[(ΣBx2)(ΣBx2Cx) - (ΣBxCx)(ΣBx3)] + ΣBx[(ΣCx2)(ΣBx3) + (ΣBxCx)(ΣBx2)] - (ΣBx2Cx)(ΣBx)2 - (ΣCx2)(ΣBx2)
n[(ΣBx2)(ΣBx4) - (ΣBx3)2] + 2(ΣBx)(ΣBx2)(ΣBx3) - (ΣBx)2(ΣBx4) - (ΣBx2)3
KB =
n[(ΣBxCx)(ΣBx4) - (ΣBx3)(ΣBx2Cx)] + ΣBx[(ΣBx2)(ΣBx2Cx) - (ΣCx2)(ΣBx4)] + ΣBx2[(ΣCx2)(ΣBx3) - (ΣBx2)(ΣBxCx)]
195
Data Ally Chromatography Manager Operators Manual
n[(ΣBx2)(ΣBx4) - (ΣBx3)2] + 2(ΣBx)(ΣBx2)(ΣBx3) - (ΣBx)2(ΣBx4) - (ΣBx2)3
KC =
ΣCx2[(ΣBx2)(ΣBx4) - (ΣBx3)2] + ΣBxCx{(ΣBx2)(ΣBx3) - (ΣBx)(ΣBx4)] + ΣBx2Cx[(ΣBx)(ΣBx3) - (ΣBx2)2]
n[(ΣBx2)(ΣBx4) - (ΣBx3)2] + 2(ΣBx)(ΣBx2)(ΣBx3) - (ΣBx)2(ΣBx4) - (ΣBx2)3
The actual concentration of each unknown peak is then found as
Actual Concentration = (Corrected concentration)(Basis of IS)(Dilution)
(Concent. of IS)(Weight)(Injection Volume)
If the "Q" curve fit option is used in the Calibration Reference Peak Table, the concentration intercept
KC will usually not equal 1. The "Q0" fit option can be employed to force a quadratic curve fit to go
through the origin so that KC = 0. For the Q or Q0 fit options, the Calibration Plot window will always
draw the theoretical best-fit response curve plotted from the concentration intercept value through the
maximum standard concentration/basis found in the current Calibration Table.
10.3.2.4 Multiple Level Internal Standard Calibration - Interpolation
To use the Interpolated curve fitting option, select the "I" or "I0" code in the Reference Table FIT
column for any peak(s). Interpolated fitting operates in exactly the same manner as for external
standard calibrations; the only distinction is that Relative Basis is used to fit each linear response
curve segment between adjacent concentration levels. Each segment has a unique slope (KB) and
intercept (KC), which is used only to find results for relative responses falling within that segment.
As for external standardization, the Calibration Plot window plots only the theoretical curve between
each of the interpolated segments, unless the I0 code is used to force the lowest standard response
value in the Calibration Point Table to be extrapolated through zero level. With the I code, unknown
peaks which have a response basis below the lowest value in the plot or above the highest value will
not be computed, and will be labeled "beyond interpolation limits" in any quantitative reports
produced.
10.4.0 Building, Reviewing and Modifying Calibrations
10.3.1 Building a New Calibration Table
Posting the results of standard chromatograms into a Calibration Point Table can be done manually
or automatically in a Method or Sequence of Methods. Any existing Calibration file can be updated at
any time, as long as that file's Reference Peak Table matches the Integration Peak Table used to
find and identify peaks. NOTE THAT ANY STANDARD CHROMATOGRAM WHICH WILL BE USED
TO PERFORM A CALIBRATION (UPDATE THE CALIBRATION POINT TABLE) MUST BE
INTEGRATED USING THE MATCHING INTEGRATION PEAK TABLE SO THAT ALL PEAKS TO
BE CALIBRATED ARE PROPERLY IDENTIFIED. To assure that this occurs, in some cases
already-integrated chromatograms must be re-integrated with the desired Integration screen/Peak
Table loaded in the current time base.
Each time a "calibration" is performed, one line is added to the Calibration Point Table, and its
corresponding response point to the Calibration Plot, for each identified peak. Only the found peaks
which match the Reference Peak Table specifications, and which have a concentration value
assigned for the standard level being processed, can actually have results accumulated into the
calibration. For example, if a certain series of peaks are not found in a new standard chromatogram,
the Calibration Point Tables for those peaks will not and cannot have a new line appended
representing the results for those peaks in that chromatogram.
196
Data Ally Chromatography Manager Operators Manual
If Internal Standardization is called for in the Integration Peak Table being used to identify peaks,
valid entry values for the concentrations of all the assigned internal standard peaks must be present
in the existing Calibration Reference Table, or must be entered by the operator in the Graph
Edit/Calibrate dialog, Method Sample Info dialog, or Sequence table, as appropriate. The Calibration
Reference Table window includes a column identifying which peaks represent internal standards, for
convenience when assigning and reviewing such standards.
If Dilution or Weight correction factors are entered for any standard sample, they will be automatically
accounted for in the calibration computations, and listed in the Calibration Table if suitable columns
have been configured. It is recommended that if such correction factors are frequently used,
appropriate columns should be included in the Calibration Table to assist operators in recognizing the
effects of these factors upon calibrations.
To perform a manual calibration and add a standard response for each peak to the current
Calibration file's Point Table, load the standard chromatogram desired into the Graph window and be
sure the correct, matching Integration file is loaded in the current time base. Check to verify that the
standard chromatogram has already been integrated and all its peaks are identified properly - if this is
not the case, use the Graph Edit/Integrate command to integrate again. Then select Edit/Calibrate
(Figure 10.9) and complete the required entries for correction factors such as Dilution, Weight, or
Sample Volume (if configured), Internal Standard Amounts/Concentrations, Level No., and Mode
(New, Average, Replace Level). Click OK to proceed with the manual calibration.
Figure 10.9 Using Manual Calibrate Function to Process a Standard Chromatogram
Click the Calibration SoftButton to view the Calibration screen - the previous Calibration Point Table
and Plot will be updated with a new row/point corresponding to the newly processed standard
chromatogram. All its relevant data will be shown in the Point Table.
10.3.2 Reviewing the Calibration Point by Point
Since the Table and Plot are interactive, it is possible to examine the nature of each individual plotted
point in detail, by graphic selection.
First, click inside the Reference Peak Table window to make this the active window, and use the
scroll bars to select the peak of interest with the highlight, and to update the Table and Plot windows.
197
Data Ally Chromatography Manager Operators Manual
Ü To select a point in the Plot, make the Plot Window active by clicking anywhere inside it. Now,
move the pointer cursor to the point about which you would like information, and double-click the left
mouse button on that point.
If the Plot window is too small and the points too closely placed for individual point selections, you
can expand the Plot window to any desired size by clicking the expansion arrows for its sides or
corners and "dragging" its borders to the new position. You can also rubber-band zoom inside the
Plot window to see an expanded view. It is suggested that you leave the first two lines of the Table
showing on the display at the bottom, so that you can see the information on each peak.
When you double-click on a single point inside the Plot window, the Table will automatically scroll
backward or forward so that the descriptive line corresponding to that point will appear highlighted on
the top line of the table (Figure 10.10). In this manner, you can check the detailed characteristics of
any points in the Plot quickly and easily.
Figure 10.10 Automatic Indexing of Calibration Table After Plot Point Selection
Ü To select a row/standard in the Table, use the pointer and table scroll bars to move to any row in
the table corresponding to the standard chromatogram whose corresponding point you would like to
locate on the plot. Click anywhere on that row, and the point representing that line will be highlighted
in the Plot window. You can zoom the plot display for closer study if you like.
You can use this mechanism to review, check, and verify any standard chromatogram or replicate
included in the Calibration file, for any peak.
10.3.3 Editing Individual Standard Points
In addition to locating and studying individual points, you can also test the effect of each point on the
current Calibration curve fit. To perform point-by-point editing, you must have configured the
ENABLE column to be present in the Calibration table in this channel.
The ENABLE column is identical to that found in the other Data Ally program tables. Each cell in the
column contains either a colored highlight, indicating that cell's row is enabled or active in the current
calibration, or is blank, indicating that cell's row is disabled or inactive in the calibration. If this column
is not present, you will not be able to edit individual replicate points.
Ü To disable a single point and remove it from the current Calibration curve, enter the Plot window
and double-click on the desired point. The Table will immediately index to the line corresponding to
that point. Now double-click on the ENABLE cell of the highlighted row in the Table - the ENABLE
198
Data Ally Chromatography Manager Operators Manual
highlight will be toggled off. The point in the Plot window will change to a red "x", and a new
calibration curve fit will appear superimposed over the old fit (Figure 10.11).
Figure 10.11 Failing a Calibration Data Point
Alternatively, you can directly click on any row in the Table to be removed from the calibration, and
double-click its ENABLE cell to toggle that standard replicate on or off.
Ü To re-enable a point, which has been disabled, repeat the above procedure and double-click on the
un-highlighted ENABLE cell of any disabled row to re-highlight it and re-insert it into the curve fit.
Note that it is not possible to completely "delete" calibration values from the table under normal
circumstances.
When you have finished designating all points/rows to be disabled for the current calibration for all
peaks, you can either Analyze chromatograms manually in any Graph window using the modified
calibration, or you can save the modified calibration with the same or with a different filename and
then run new Methods or Sequences to process unknowns using the new calibration. If you have
edited calibration points, you will be prompted to save the modified Calibration file before you run a
new Method or Sequence or load a new Calibration. SAVING A CALIBRATION FILE WITH ROWS
DISABLED FOR ANY PEAK(S) WILL PRESERVE THE DEFEAT OF THOSE ROWS UNTIL THEY
ARE RE-ENABLED AND THE FILE RESAVED AGAIN.
10.3.4 Changing the Calibration Curve Fit
You can change the type of calibration curve fit performed for any peak at any time using the Peak
Reference Table.
Ü To change the curve fit type for a peak, click inside the Reference Table Window to make it active,
click inside the desired peak's FIT column cell, and change the entry as desired. Press ENTER,
TAB, or CTRL-arrow, or click inside any other cell, to make the new entry. A dialog box will appear
advising that the calibration is being changed and prompting for approval. Click OK to proceed with
the change - the curve fit will immediately be recomputed and the new Plot drawn. Clicking Cancel
will circumvent the change and restore the previous entry.
You can change the fit type as often as you like in this manner. When the desired fit is determined,
you can manually process chromatograms using Analyze, or save the modified Method file and run
new Methods or Sequences to process unknown samples.
199
Data Ally Chromatography Manager Operators Manual
The FIT parameter only changes the curve fit mathematics used if more than one level of standards
have been run and included in the Table. If only a single level is present, the FIT column button will
be non-functional until additional levels are entered.
10.3.5 Changing the Calibration Basis
Each peak in the Calibration file can have its own individual "basis" for calibration, either area or
height. You can change the basis for any peak by modifying the BASIS column code for that peak in
the Reference Peak Table; this can be done in conjunction with changing the current
plotting/weighting for any peak, or its curve fit type.
Ü To modify the basis for a given peak, first click on that peak's BASIS column cell in the Reference
Peak Table to select it, and type in the desired code (A or H). Press ENTER, TAB, or CTRL-arrow,
or click inside any other cell, to make the new entry. A dialog box will appear advising that the
calibration is being changed and prompting for approval. Click OK to proceed with the change - the
Plot window will instantly change to show the effects of using the new basis. You can use this
switching to quickly assess the impact of changing basis from area to height or vice versa on any
peak. Clicking Cancel will disable the command and restore the previous entry.
10.5.0 Working With Calibration Files
The Calibration filing system permits you to save and recall calibrations quickly and easily. The
contents of the current Calibration table and its Reference Peak Table, as well as all the options and
plot settings, can be saved as a "Calibration" file, with a unique filename and description, so that it
can be recalled and reused at any future time either manually, in an automated Method, or in a
Sequence of Methods.
You can specify a default Calibration file by name during Configuration, which is always loaded
automatically into the calibration display screen at the time Data Ally is initialized. You can change
any aspects of the default file within the active software, except for the features and options which
are either "fixed" or "removed" in the Configuration, but you can only save such changes to the
default file in Configuration Mode (Section 5.2.5.4). If you wish, it is possible to run a series of
standard chromatograms, use them to update any calibration file you create, and then use that file to
"assign" parameters to the default Calibration file in Configuration mode.
The Files commands in the Calibration Command Menu bar are used to load, save, clear, and delete
Calibration files, and can also provide a calibration version historical record.
10.5.1 Loading Calibration Files
Ü To load a saved Calibration file from disk memory into the current channel, click the left mouse
button on Files in the Command menu bar, and then click on Load. A directory dialog box will appear
(Figure 10.12) which lists the Calibration files (*.CAL) available in the current directory path for this
channel. Select the desired file by clicking on its name in the directory list, or by typing its name into
the entry box. Click on OK to load the new file.
200
Data Ally Chromatography Manager Operators Manual
Figure 10.12 Calibration Files/Load Dialog
If the previous file has been edited and has not been saved or resaved, an information message will
appear before the new file is loaded asking if the previous file should be saved. If so, click on YES
and assign either the same filename or a new name as desired. If you do not wish to save the edited
file, click on NO to proceed.
When a new file is loaded, it will overwrite the previous Calibration file.
At any time, you can re-load the default Calibration File which is set in Configuration (Section 5.2.5.4).
This file is unique in that it can only be modified in Configuration mode - it can contain a complete set
of calibration data, if desired. To load the default file, use the Files/Load Default command, which will
show the name of the default calibration. When this command is executed the default file will
overwrite any existing calibration file present in the current time base.
10.5.2 Clearing Calibrations
The Clear function allows individual clearing of either the Calibration Point Table (the standard data)
or the Reference Table (the Level values, plus fit, basis, and units parameters) without using Setup or
deleting an existing file, or both.
Ü To clear any part of the current Calibration file, click on File in the Command Menu bar and then
click on Clear. The Clear Select submenu will appear (Figure 10.13).
Figure 10.13 Clear Submenu for Calibration Files
Click on the desired command to clear either or both tables. If the previous file has been edited and
has not been saved or resaved, an information message will appear before this file is cleared asking
if the previous file should be saved. If so, click on YES and assign either the same filename or a new
name as desired. If you do not wish to save the edited file, click on NO to proceed.
201
Data Ally Chromatography Manager Operators Manual
10.5.3 Saving Calibrations
Ü To save a modified Calibration file using the same filename, click on Files in the Command Menu
bar, and then click on Save. A trap message will appear prompting for confirmation that file should
be resaved with the current name, overwriting the previous file. Click on OK to proceed and resave the file's internal version number will be updated.
Ü To save a modified Calibration file using a new name, click on the SaveAs item in the Files menu.
The SaveAs dialog box will appear (Figure 10.14). Click inside the filename entry field and type in
the desired new filename. If you wish, click inside the DESCRIPTION field and type a description of
the new file, which may help identify this file in the directory listing for future recall. When the correct
name and description appear, click on OK to save the file to the current disk path. If another file
already exists in that path with the same name, an error message will instruct you to change the
filename before saving.
Figure 10.14 Calibration Files/SaveAs Dialog
Ü To apply a description to the current Calibration file, click on Calibration Description in the Files
submenu. The Description dialog box (figure 10.15) will appear. You can type in a single or multiline description which will be saved with the file and will appear in the Description box in the Load
directory (Figure 10.12). Alternatively, you can enter the description directly into the Description box
in the Save As dialog (Figure 10.14) at the time a new or modified Calibration file is saved.
Figure 10.15 Set Calibration Description Dialog
202
Data Ally Chromatography Manager Operators Manual
10.5.4 Deleting Calibrations
Ü To delete a Calibration file from the current disk directory, use the Windows File Manager Delete
function.
10.5.5. Printing Calibrations
Use the Files/Print Calibration command to print a complete summary of the current calibration file.
Normally, each single page in such a printout will summarize the tabular data in the Calibration Point
Table for one peak over the complete "history" of the current Calibration file. You can modify the
format of this report by using Excel to edit the \reports\cal\cal.xls template file (see Section 13).
203
Data Ally Chromatography Manager Operators Manual
11.0 Running and Reprocessing Batches: The Sequence Screen
Data Ally can operate in conjunction with and control virtually any automatic sampler for the capture
and reprocessing of batches of chromatogram files. All batch processing operations are
programmed in the Sequence screen, which is viewed by clicking on the SEQUENCE SoftButton on
the left screen.
The Sequence screen is useful if more than one sample or chromatogram is to be run automatically
or an autosampler is being controlled by Data Ally. If only single injections are required, the entire
process of acquiring, saving, analyzing, calibrating, and reporting chromatograms can be automated
via the Method program screen alone. Effectively, the Sequence function allows you to run a series
of Method programs as a single operation. It is possible to configure each Data Ally channel so that
the Sequence function is not accessible to users, if it will not be needed in that channel.
11.1.0 Sequence Screen Functions
Click on the SEQUENCE SoftButton to display the Sequence program screen. This screen consists
of two sections: a "top-level" dialog box in the upper screen, which includes settings and parameters
affecting the entire Sequence, Autosampler Dialog access via the “Autosampler” button and the
"Sequence Table" in the lower screen, which is a "spreadsheet" containing a list of samples and
Methods to be processed. The Table portion of the screen operates in a very similar fashion to that
of the Method Events and Integration Peak Tables.
The default Sequence file selected in configuration will be automatically loaded into the Sequence
screen display whenever each channel is initialized, or when a different Sequence is cleared. It is
recommended that the default Sequence file name be programmed for the most common running
conditions, to insure the least possible amount of subsequent programming required for routine
users.
If you wish to "split" the screen with a Graph window on top and the Sequence Table below it, click on
the GRAPH button at bottom right. This type of display is useful during the processing of live
Sequences, since it allows viewing of chromatograms developing in real time as well as the current
injection position in the sample table.
11.2.0 Top-Level Sequence
The "top-level" Sequence dialog identifies global sequence processing parameters (Figure 11.1).
Figure 11.1 Sequence Screen
204
Data Ally Chromatography Manager Operators Manual
Ü To program a new Sequence or modify a Sequence program already loaded, click the left mouse
button with the pointer cursor inside any of the entry fields, and enter the desired value.
Like other program files, Sequence files are assigned names and descriptions at the time they are
saved using the Files/SaveAs command (Section 11.5.3 below).
11.2.1 Operating Modes
There are two Modes available for Sequences, listed in the very top left of the dialog (Figure 11.1)..
• Acquire Mode: For acquiring new chromatograms from live detector inputs as specified in the
Method program files associated with each line in the Table. This mode is not available in any
Edit Time Base.
• Reprocess Mode: For reprocessing chromatograms already acquired in previous runs and
saved to disk. Reprocess loads each chromatogram file specified from a given disk location,
integrates and analyzes the file as instructed by the elected Method, and creates reports
according to the selected Integration file(s). Reprocess will perform the above operations as
quickly as possible and in a continuous manner. Reprocess mode can be accessed in both
"live" and Edit time bases.
• Summarize Mode: For producing tabulated Summary Reports from an entire sequence of runs
which have existing integration results. NOTE: A Summary Report can also be automatically
produced at the end of an Acquire Mode sequence by enabling the Summary Report and
choosing a Summary Template via the Summary Dialog box. Click on the Summary button
located in the Reports sections of the top level sequence screen to display the Summary Dialog
box. See example of a Summary Reports dialog box below:
Summary Reports Dialog
Ü To run a Sequence in any mode, click the RUN button while the Sequence screen is displayed IF THE SEQUENCE SCREEN IS NOT VIEWED, A SINGLE METHOD WILL BE RUN. Only one
mode can be selected at any one time, and only those modes which are supported by the current
Configuration will be available; the mode cannot be changed after a Sequence has been started. If
the current channel is to be used for data acquisition only, only the Acquire mode should be allowed
in Configuration. For an Edit-Only channel, only the Reprocess modes are available.
Select the desired mode by clicking on its button to enable it before using RUN to start.
Ü To stop a running Sequence, click the STOP SoftButton in any Data Ally display screen. Both the
currently executing Method and the Sequence will be halted.
The top-level Sequence also contains fields for START and END rows in the Sequence Table.
These operate interactively with the ENABLE column (see below) to define which lines in a
preprogrammed Sequence table will actually be executed each time a Sequence is run.
Ü To limit Sequence processing to any consecutive series of rows in a programmed Sequence
Table, click inside the START entry box and type the number of the first row to be processed, then
205
Data Ally Chromatography Manager Operators Manual
click inside the END box and type the number of the last row to be processed. Only those rows
inclusive of the START and END row number will actually be executed in the Sequence.
You can also select whether or not the reports associated with the Methods to be run as part of a
Sequence will be printed or shown on screen. In order to print, the Print checkbox in top center of the
screen must be checked - in order to show programmed reports on screen, the Show checkbox must
be checked. Leaving both checkboxes unchecked during a Sequence run or reprocess will cause all
reports, either printed or shown, to be skipped during the entire Sequence. Note that you cannot
check or uncheck these boxes after a Sequence has been started in order to change the reporting
mode during a Sequence. The most common utilization of the check boxes for reporting is to defeat
reporting without changing the report specifications for any of the programmed Methods, for example,
during a reprocess Sequence in which a recalibration is performed.
At top right of the Sequence screen is another group of check boxes inside a boxed area marked
Options. These check boxes are for Validation, Suppression of Integration, and Suppression of
Calibration during the Sequence.
Checking the Validation box causes the Sequence to verify that all programmed files (Method,
Integration, Calibration, chromatogram raw data) called for during all rows in the Sequence table are
in fact present in the defined directory paths. This is a useful feature to avoid errors during long term,
unattended Sequence processing - the drawback to checking the Validation check box is that a
certain amount of time is required before actual Sequence processing begins in order for Data Ally to
perform all the necessary file checks. It is recommended that the Validation feature be used if
multiple-row Sequences will be processed without operator attention such as during overnight
sessions.
Checking the Suppress check box for either Integration or Calibration disables any integration or
calibration commands which may be included in the Methods incorporated into the Sequence table.
These commands are most useful if you wish to recall previously-integrated (and manually edited)
chromatograms for reprocessing purposes, or if you wish to use only the current Calibration file data
sets in order to produce reports. Suppressing Integration or Calibration by checking the respective
boxes will avoid any new integrations, which could change the quantitation of identified peaks, or
calibrations, which could inadvertently modify the calibration response factors.
11.3.0 Sequence Table
The Sequence Table (Figure 11.1) is a queuing list for processing a series of samples using any
selected group of Methods. Each line or row in the "spreadsheet" corresponds to a single vial on the
typical autosampler, from which one or more injections can be made. Processing of an entire
programmed Sequence can be done continuously, under Data Ally control, or the series of runs and
samples programmed can be interrupted at will by the operator. You are free to disable or modify
any lines or commands in the Sequence Table which have not yet been executed, including the
number of samples or injections, the Methods used, or other information. Sequence Tables can be
of any desired length, but will usually correspond to the maximum tray size assigned for the current
autosampler, if this is chosen in Configuration.
11.3.1 Sequence Table Functions
Unlike the Method and Integration tables, the Sequence Table has no "graphical" editing functions,
since it is basically a worksheet list of runs to be performed and has no relationship to graphic events.
The Sequence Table can be edited in a number of ways, and a set of FILL functions are available to
make programming new Sequences less tedious.
The simplest way to make any entry in the Table is to move the highlighted edit cell inside the desired
cell (column and row), click to anchor the highlight there, and type in the desired value. You can use
the <ENTER>, <TAB> and PgDn/PgUp keys to move around within the Table when reviewing or
editing, as well as the usual CTRL-Home, CTRL-End, CTRL-PgUp, CTRL-PgDn, and CTRL-arrow
206
Data Ally Chromatography Manager Operators Manual
key commands. The vertical and horizontal scroll bars at the bottom and right of the Table can be
used in conjunction with the mouse to quickly change your position in the Table when editing.
Each time a new line is added to the Table, a new number will automatically be assigned in the
ENABLE/line number column at far left. This column is always visible regardless of the view of the
table to make it easier to locate and edit particular items or entries.
The "spreadsheet" commands, INSERT, DELETE, COPY, PASTE, and CUT, at the bottom of the
Table operate in exactly the same way as for the Events, Peak, and Calibration Reference Tables.
Ü To INSERT new lines into the Table, position the edit highlight anywhere in the line/row below the
intended insertion point, and click to anchor it. Then click the INSERT button to insert one or more
empty lines above that position. You can also insert new lines at the end of the Table by moving the
highlight to the last cell in the table and pressing ENTER.
Ü To delete a row, move the edit highlight into any column in the row to be deleted, and click on
DELETE. The line will be removed. The DELETE command differs from CUT in that a row's
contents cannot be PASTEd back into a different position after being DELETEd.
Ü To copy a row, move the edit highlight to the desired row to be copied, and click to anchor. Then
click on the COPY button to copy an image of that row.
Ü To cut (move) a row from one position in the table to another, click the edit highlight in the desired
row to be moved, and click on the CUT button.
Ü To paste a copied or cut image of a row into the Table, move the edit highlight anywhere in the row
below the position for the row to be pasted. Then click on the PASTE button to paste the copied or
cut row above the highlighted row.
If you INSERT or CUT rows from a Sequence, the line number listing in the ENABLE column will
automatically be altered to renumber rows accordingly.
You can re-order the columns in the Sequence Table from left to right or change their individual
widths at any time. Both the column order and widths are set as defaults in Configuration.
To move a column to another position in the table, simply place the pointer cursor on that column's
header button, hold down the left mouse button, and "drag" the header button left or right to the new
desired position relative to the other columns. When the pointer is in the desired position, release the
mouse button and the entire column will be moved, and the table redrawn accordingly. Modifying the
order of columns may make certain types of table editing or review easier by allowing placement of
all columns currently being manipulated in view on a single screen - you can easily move
"unimportant" column information to the right and off of the displayed table window area.
To change the width of any individual column, move the pointer cursor to the border of its header
button and the next column header button in the direction in which you wish to expand or reduce the
column width. The cursor will become a "double-sided horizontal arrow" (ç |è ); when this change
occurs, immediately hold down the left mouse button and move the arrow cursor in the direction you
wish the button edge to expand or contract. When the desired column width is indicated by the
position of the cursor, release the mouse button and the column will be resized and the entire table
redrawn accordingly. This feature permits you to match the exact sizing of each column to the
expected character width of the entries expected in that column - you can also effectively "remove"
certain columns without actually eliminating them from the table by reducing their widths to a very
small size.
207
Data Ally Chromatography Manager Operators Manual
11.3.2 Sequence Table Columns
The following is a listing of possible columns which can be included in a Sequence Table. Typically,
not all items are present in any single Table. It is indicated whether or not each individual item is
configurable or must always be present in the Table.
• ENABLE: This field determines whether any individual lines/rows in the Sequence Table will be
executed once the Sequence is started. Each row in this column can be either highlighted
(enabled) or not highlighted (disabled) - disabled rows will not be executed. Double-clicking the
left mouse button inside any cell in this column will "toggle" the highlight on or off. Disabling or
enabling of rows in this manner can be done while a Sequence is executing if desired.
• NO: (Configurable) This field specifies VIAL NUMBER for an autosampler tray if autosampler
control is included and configured (this column should only be configured if such control is
provided with the Data Ally system for the current time base).
• # INJS: (Configurable) This field sets the variable number of injections (from 1 to 9) for the
current row/sample in the Sequence table.
• SMP. NAME: (Configurable) This field defines the sample name to be run on any line/row in the
Table. The sample name can have up to 30 characters, depending upon the column width for
SAMPLE NAME set in Configuration.
• SMP. DESC.: (Configurable) This field can be used to enter a sample description of up to 30
characters in length.
• CG FILENAME (For each configured detector input): (Configurable) This field defines the
chromatogram raw data path\filename to be created/saved for the incoming data from the first
detector configured. Although the name can be specified in the Method file, this row entry
permits a different filename to be used on a row by row basis, if desired, from the name specified
in the selected Method file - any entry in the CG FILENAME fields will override the filename entry
for this detector signal input in the corresponding Method file. sample number for the line/row,
with up to 30 characters depending upon the column width value set in Configuration. Note that if
more than one detector input is available in this time base, each detector can have its own
chromatogram filename set independently of each other and of the Method file specifications.
The ability to enter unique chromatogram filenames for each row also allows the creation of
"reprocessing" sequences which handle any group of data files from any source and directory.
Note: Exclusive of the Drive and Path portion of the filename, the actual filename is limited to 5
characters maximum because the right most 3 character positions will be used to construct line
number/injection number for each file. XXXXX011.PDF for example would be the first injection
from the first sequence line. XXXXX021.PDF would be the first injection from sequence line
number two. The PDF extension is automatically added by Data Ally.
• INT. FILENAME (For each configured detector input): (Configurable) Like the CG FILENAME
field, this column permits Integration files to be assigned in the Sequence independently of those
selected in any included Methods, on a sample or row-specific basis if desired. This field is used
to enter a path/filename for integration and peak identification - a separate column will be
available for configuration for each detector input assigned in each time base. Entries in the INT.
FILENAME columns will override any Integration filename entries in any Method in the same row
in the Sequence table. This feature provides maximum flexibility for either modifying how a
Sequence will be processed without actually changing and resaving any Method files, or for
reprocessing a series of chromatogram files requiring vastly different integration criteria.
• CAL. FILENAME (For each configured detector input): (Configurable) As with the CG and INT.
FILENAME fields, this column permits Calibration files to be used as desired in the Sequence
regardless of those selected in any included Methods, on a sample or row-specific basis if
208
Data Ally Chromatography Manager Operators Manual
desired. This field is used to enter a path/filename for calibration information - a separate column
will be available for configuration for each detector input assigned in each time base. Entries in
the CAL. FILENAME columns will override any Calibration filename entries in any Method in the
same row in the Sequence table.
• RPT. TEMPL. (For each configured detector input): (Configurable) This column permits Excel
report template files to be used in the Sequence independently of those selected in any included
Methods, on a sample or row-specific basis if desired. This field is used to enter a path/filename
for the *.XLS file describing the desired report. In the current version, only one such report
template can be entered per input in a single Sequence. These entries will override any
Integration filename entries in any Method in the same row in the Sequence table.
• RPT. FILE (For each configured detector input): (Configurable) Like the previous fields, this
column permits independent specification of saved report file names for each defined detector
input, regardless of those names selected in any included Methods, on a sample or row-specific
basis if desired. This field is used to enter a path/filename for the report(s) defined either as part
of called Methods in the Sequence or by the RPT. TEMPL. column entry. Entries in this column
will override any report save filename entries in any Method in the same row in the Sequence
table. Again, this offers ultimate flexibility in determining specific report generation for each
Sequence without having to review or modify any saved Methods you wish to use.
• CAL. HIST. TEMPL. (For each configured detector input): (Configurable) This column permits
row by row definition of the Calibration History reports to be prepared describing the current
calibration for each configured detector input. These entries will override any Method-based
entries for calibration reports. The CAL. HIST. column identifies a path/filename for the *.XLS
Excel template file used to create each desired calibration report.
• WEIGHT: (Configurable) This factor allows corrections for weighed samples, as configured in
the Method default set screen.
• DILUTION: (Configurable) This factor allows corrections for sample dilutions, as configured in
the Method default screen.
• METH: (Configurable) This field determines which Method program is loaded from disk when
this Sequence Table is executed. A different Method can be associated with each line in the
Table, in any order or combination. Note that the Method references Integration and Calibration
files in the normal manner. If the METH column is disabled in Configuration, the system will
always load the default Method file for all lines in every Sequence Table.
Entries in the METH column rows are always valid Method filenames, with or without path
names. You can double-click on any row in the METH column to see a pop-up listing of all
available Method files in the current path.
Method Name must be set for all rows in the table, but it is also possible to modify most of the
parameters in each Method on a sample or row-specific basis by configuring and using the series
of sample-specific entry rows for chromatogram filename, integration and calibration filename,
report template and saved filenames, and calibration report filename described above. Any
entries in any of these columns will override any entries of the same parameters in the
referenced Method file on the same row in the Sequence table. Note that it is thus possible to
create a Sequence table using one basic source Method file and to modify the actual processing
of each row in the Sequence in a nearly unlimited manner without incorporating many different
Method files.
• CAL. CODE: (Configurable) This field identifies the current line/row as a standard sample which
is to be used to update the selected Calibration file(s). Entries in the CAL. CODE field can be
either N, start new calibration file, R, replace existing level, or A, average new result into current
209
Data Ally Chromatography Manager Operators Manual
calibration. Entries in this field will override any calibration instructions contained in any Method
files in the Sequence on a row specific basis.
• CAL. LEVEL: (Configurable) This field selects the calibration level for the standard defined in
the current line/row. The range of level entries depends upon the number of levels programmed
for the currently referenced Integration file(s). Entries in this field will override any calibration
instructions contained in any Method files in the Sequence on a row specific basis.
• IS1 AMT - IS5 AMT: (Configurable) These five fields set concentration values for the Internal
Standard peaks number 1 through 5, if such peaks have been defined in the Integration Peak
Table. These columns are only configured for as many Internal Standards as are to be used.
• PRT. CG: (Configurable) This column defines whether or not the chromatogram generated
during processing of each row in the Sequence Table will be printed according to its respective
Method instructions. Entries in this column are either Y for Yes or N for No. Any entry in this
column, if configured, will override any printing instructions contained in any Method specified for
any sample/row.
• COMMENT: (Configurable) The COMMENT field for each line/row can be used to make notes
on a line-by-line basis which will be saved with the Sequence Table. Comments can be up to 30
characters depending upon the column width setting in Configuration.
Note that many of the Sequence Table column parameters can be defined either here or in the
Method screen Sample Information button dialog box. If a Method is designated in a Sequence
Table which has Sample Information associated with it, those values will be automatically used for
processing or reporting as long as the corresponding cells in the Sequence Table remain blank for all
lines/rows employing that Method. ANY AND ALL SAMPLE-SPECIFIC ENTRIES MADE IN THE
SEQUENCE TABLE WILL ALWAYS OVERRIDE ANY CORRESPONDING ENTRIES MADE IN ANY
METHOD FILES.
11.3.3 Fill Functions
Information can be entered into the Sequence Table by using the automatic FILL functions
associated with certain columns in the Table. The FILL button beneath the Table can be used in a
similar manner to that in the Method Events or Integration Peak Tables to "fill" series of new values
into blank column cells. The AutoFill dialog box (Figure 11.2) used to set all filling functions is of the
same format and works in exactly the same manner as that for the other Data Ally tables (see
Section 8.3 for a detailed explanation of its features and terminology).
The "Duplicate" filling mode is useable for the # INJS, METH, CAL CODE, CAL LEVEL, ISAMT, WT,
DIL, SAMPLE NAME, SAMPLE DESC., SAMPLE NO., and COMMENT columns, as well as all
configured filename and report specification fields.
The "Increment" filling mode is operable for the # INJS, CAL LEVEL, ISAMT, WT, DIL, and SAMPLE
NO., columns.
In Data Ally Sequence programming, incrementing filling is normally used to begin by setting up a
series of METH entries to define the length of the Sequence table, one line/row per sample. Other
information can then be entered using fill functions or via manual entries. .
210
Data Ally Chromatography Manager Operators Manual
Figure 11.2 Auto Filling the METH Column
The following AutoFill operations can be performed for the Sequence table:
Ü To fill an existing row's value into all currently empty rows in the column up to the next entry,
place the edit highlight on the "basis" row, click FILL to see the AutoFill dialog, select "Duplicate",
"Current Cell", and "To Next Entry", with all other fields and options blank/off. If the "basis" row is the
first row in the column, you can select "Start of Table" instead of "Current Cell" without highlighting
the basis row.
Ü To fill an existing row's value into all currently empty rows in the entire column, place the edit
highlight on the "basis" row, click FILL to see the AutoFill dialog, select "Duplicate",
"Current Cell", and "End of Table", with all other fields and options blank/off.
Ü To fill an existing row's value into more or less empty rows than the number of empty rows found in
the current column up to the next entry, place the edit highlight on the "basis" row, click FILL to see
the AutoFill dialog, select "Duplicate", "Current Cell", and "To Next Entry". Type the actual number of
empty rows to be filled into the "No. of Steps" column, with all other fields and options blank/off. If the
"No. of Steps" value exceeds the number of actual intervening empty rows, sufficient new rows will be
added and filled to meet the "No. of Steps" criteria.
Ü To fill all currently empty series of consecutive rows in the column with the values found in the rows
prior to each empty group of rows, click FILL to see the AutoFill dialog, select "Duplicate",
"Start of Table", "End of Table", and "Allow Progressions", with all other fields and options blank/off.
Ü To overwrite existing values (along with any blank rows) with duplicated values in an entire column,
place the edit highlight on the "basis" row for copying, click FILL to see the AutoFill dialog, select
"Duplicate", "Current Cell", and "End of Table", and check the "Allow Overwrites" command, with all
other fields and options blank/off.
Ü To clear (remove) existing values in an entire column, insert a blank row at the beginning of the
table, place the edit highlight on that row, click FILL to see the AutoFill dialog, select "Duplicate",
"Current Cell", and "End of Table", and check the "Allow Overwrites" command.
Ü To overwrite existing values in a portion of a column with a duplicated value, place the edit highlight
on the "basis" row for copying, click FILL to see the AutoFill dialog, select "Duplicate", "Current Cell",
"End of Table", and "Allow Overwrites", and enter a "No. of Steps" value corresponding to the number
of existing rows to be filled with duplicates. All other fields and options should be blank/off. If the
211
Data Ally Chromatography Manager Operators Manual
number of steps exceeds the number of blank rows in the column, the "Allow Insertions" box must be
checked to add sufficient rows to meet the "No. of Steps" criteria.
Ü To clear (remove) existing values in a portion of a column, insert a blank row at the beginning of the
range to be cleared (or remove an existing row entry), place the edit highlight on that row, click FILL
to see the AutoFill dialog, select "Duplicate", "Current Cell", "End of Table", and "Overwrite Existing
Data", and enter a "No. of Steps" value corresponding to the number of existing rows to be cleared
(filled with a blank entry). If the number of steps exceeds the number of blank rows in the column,
the "Allow Insertions" box must be checked to add sufficient rows to meet the "No. of Steps" criteria.
Ü To fill a column in a new table with incremented values, enter the beginning "basis" value in the first
row, place the edit highlight on that row, click FILL to see the AutoFill dialog, select "Increment",
"Current Cell", and "End of Table", enter the increment value in the "Increment" field, and enter the
number of rows for which incremented values are to be inserted in the "No. of Steps" field.
Ü To fill a column with incremented values in blank rows up to the next existing entry, place the edit
highlight on the "basis" row, click FILL to see the AutoFill dialog, select "Increment", "Current Cell",
and "To Next Entry", and enter the increment value in the "Increment" field; leave other fields and
options blank/off.
Ü To fill an existing row's incremented value into more or less empty rows than the number of empty
rows found in the current column up to the next entry, place the edit highlight on the "basis" row, click
FILL to see the AutoFill dialog, select "Increment", "Current Cell", and "To Next Entry". Type the
increment value into the "Increment" field, and the actual number of empty rows to be
filled/incremented into the "No. of Steps" column, with all other fields and options blank/off. If the "No.
of Steps" value exceeds the number of actual intervening empty rows, sufficient new rows will be
added and filled to meet the "No. of Steps" criteria.
Ü To fill all currently empty series of consecutive rows in the column with incremented values based
on the rows prior to each empty group of rows, click FILL to see the AutoFill dialog, select
"Increment", "Start of Table", "End of Table", and "Allow Progressions". Type the increment step
value for each row into the "Increment" field, with all other fields and options blank/off.
Ü To fill a column with incremented values in all blank rows based on an existing entry, place the edit
highlight on the "basis" row, click FILL to see the AutoFill dialog, select "Increment", "Current Cell",
and "End of Table", and enter the increment value in the "Increment" field; leave other fields and
options blank/off.
Ü To fill a range of rows with evenly-spaced, automatically computed values, with each row's value
corresponding to the difference between the basis cell's value and the value of the next row having a
non-blank entry in the column divided by the number of intervening rows, place the edit highlight on
the "basis" cell (first row in the range), click FILL to see the AutoFill dialog, select "Increment",
"Current Cell", and "To Next Entry". If you wish to fill only the existing number of blank intervening
rows, leave the "No. of Steps" field and all other commands blank/off. If you wish to fill either only
some of the intervening rows, or to add new intervening rows, enter a number in the "No. of Steps"
field specifying the total number of intervening rows to be filled. If "No. of Steps" exceeds the number
of existing blank lines in the range, you must check the "Allow Insertions" box to automatically add
and fill sufficient lines to match the "No. of Steps" entry.
Ü To fill all existing ranges of empty rows in the column with evenly-spaced, automatically computed
values, with each filled row's value corresponding to the difference between the value of the cell
immediately preceding that range and the value of the next row having a non-blank entry following
the range divided by the number of intervening rows, click FILL to see the AutoFill dialog, select
"Increment", "Start of Table", "End of Table", and "Allow Progressions". Leave all other selections
blank/off.
212
Data Ally Chromatography Manager Operators Manual
Ü To overwrite existing values (along with any blank rows) with incremented values in an entire
column, place the edit highlight on the "basis" row for incrementing, click FILL to see the AutoFill
dialog, select "Increment", "Current Cell", and "End of Table", enter the increment value in the
"Increment" field, and check the "Allow Overwrites" command, with all other fields and options
blank/off.
Ü To overwrite existing values in a portion of a column with incremented values, place the edit
highlight on the "basis" row for copying, click FILL to see the AutoFill dialog, select "Increment",
"Current Cell", "End of Table", and "Allow Overwrites", enter the increment value in the "Increment"
field, and enter a "No. of Steps" value corresponding to the number of existing rows to be filled with
duplicates. All other fields and options should be blank/off. If the number of steps exceeds the
number of blank rows in the column, the "Allow Insertions" box must be checked to add sufficient
rows to meet the "No. of Steps" criteria.
Ü To fill information from the current Method into a column for the entire table, click on the desired
column header button (or move the edit highlight into that column), click FILL to see the AutoFill
dialog, select "Fill From Method", "Start of Table", and "End of Table", leaving all other fields and
options blank/off. If the "Allow Overwrites" box is checked, any existing values in the selected
column will be replaced by newly filled values from the current Method.
Ü To fill information from the current Method into a portion of a column, click on the desired column
header button with the edit highlight in the first row to be filled in that column), click FILL to see the
AutoFill dialog, select "Fill From Method", "Current Cell", and "End of Table", and set the number of
rows to be filled with the value from the current Method as "No. of Steps". If existing row values are
to be overwritten, you must also check the "Allow Overwrites" box. If the "No. of Steps" entry
exceeds the number of existing blank rows to be filled, the "Allow Insertions" box must be checked in
order to automatically add sufficient new lines to meet the "No. of Steps" filling criteria.
Alternatively, you can fill a range of blank rows in any column from the edit highlight cell up to the next
entry in that column by using the "Fill From Method", "Current Cell", and "To Next Entry" commands,
leaving all other fields and options blank/off.
11.4.0 Running a Sequence
A properly-programmed Sequence can be started simply by clicking on the RUN SoftButton at lower
left while the Sequence screen is in the active window. This will cause the first Method in the Table
to be loaded along with its referenced Integration and Calibration files, if any, and will start that
Method's execution. Any specific file references programmed in the Sequence table for that row will
be used in place of those specified in the Method, if different. After the first Method is complete, the
second row Method will be loaded and executed, and all other rows in the Table processed in turn.
The Sequence can be aborted at any time by clicking on the STOP/RUN SoftButton. If a Sequence
is aborted before completion, it can be restarted at the Table row where the termination step
occurred by double-clicking the ENABLE column cells in all the rows for which execution was
completed to disable them and then restarting the Sequence by clicking RUN.
As the Sequence runs, the table will be "indexed" upward so that the currently-in process row
(highlighted) which corresponds to the currently-running Method/injection always appears two lines
from the top of the table window. You can use the horizontal and vertical scroll bars while running to
examine any row in the table, even those rows which have already been processed. The SoftButtons
can be used to jump to any other screen or channel and back to the running Sequence display. You
can also press the GRAPH button at bottom right to select a split-screen view of the Sequence table
while it is executing and an active top Graph screen (Figure 11.3). Click on the SEQ button at bottom
right of this display to switch back to the complete Sequence dialog screen.
213
Data Ally Chromatography Manager Operators Manual
Figure 11.3 Split-Screen Sequence Table with Graph
When a Sequence is executing, the Status Box can be placed on screen to monitor the progress of
individual Methods and the entire Sequence.
While between Methods, or while holding at the start of each new Method, the input signal Status
registers will be "live" and will show the actual signals being read in real time, to help the operator
judge baseline level and stability, even though the signal data are not being saved during such
periods because the system timer is not running.
11.4.1 Modifying a Sequence While Executing
Like all other Data Ally tables, it is possible to modify a running Sequence Table while the Sequence
is executing. You can use the INSERT, DELETE, COPY, PASTE, and CUT commands to add new
rows or delete existing rows, change command settings for any row, or even use the FILL functions
as described above to complete programming of new rows. The only limitation to on-line changes in
the Table is that only those lines which have not yet been executed can be modified. One very
convenient tool for on-line Sequence changes is the ENABLE column, which can be employed to
quickly disable selected groups of vials without rewriting the Table.
If the Reprocess mode is in use, you will observe each chromatogram loaded from disk using the
filename(s) in the selected Method(s) in any Graph window as it is redrawn and integrated. In
Browse mode, the reprocessing operations will be on a stepwise basis after starting. The first
chromatogram will be displayed and integrated with the currently referenced Integration, and the
results will be shown in all Graph window. When all steps are complete for the programmed
reprocessing of the first chromatogram file, the next will be loaded and these steps repeated, and so
on.
11.5.0 Working with Sequence Files
The Sequence program filing system operates in a manner identical to that of every other Data Ally
programming screen. The Sequence screen display, comprising both the top-level dialog box and
the Sequence Table, is configured as a "template" to show information about the current sequence
instructions loaded into the channel being observed. The contents of the Sequence screen display
can be saved as a unique "Sequence" file, with a unique filename and description, so that it can be
recalled and reused at any future time.
The default Sequence file, whose name is assigned during Configuration, is always loaded
automatically into the Sequence display screen at the time Data Ally is initialized. You can change
any aspects of the default file within the active software, except for the features and options which
214
Data Ally Chromatography Manager Operators Manual
are either "fixed" or "removed" in the Configuration. These items can, of course, also be reset or
restored, but the channel must be disabled and a re-Configuration performed to accomplish this.
The Files commands in the Sequence Command Menu bar (Figure 11.4) are used to load, save,
clear, and delete Sequence program files.
Figure 11.4 Sequence Files Menu
11.5.1 Loading Sequence Files
To load a saved Sequence file from disk memory into the current channel, click the left mouse button
on Files in the Command menu bar, and then click on Load. A directory dialog box will appear which
lists the Sequence files (*.SEQ) available in the current directory path for this channel (Figure 11.5).
Select the desired file by clicking on its name in the directory list, or by typing its name into the entry
box. Click on OK to load the new file.
Figure 11.5 Sequence Files/Load Dialog
If the previous file has been edited and has not been saved or resaved, an information message will
appear before the new file is loaded asking if the previous file should be saved. If so, click on YES
and assign either the same filename or a new name as desired. If you do not wish to save the edited
file, click on NO to proceed.
To load the default Sequence file programmed during Configuration, click the Load Default command
in the Files submenu - the default sequence will be loaded and will overwrite the previous
Sequence file in the current time base. The default file can be modified only by performing
Configuration.
11.5.2 Clearing Sequence Files
A Clear function allows you to remove all entries from the Sequence Table without deleting the lines,
or deleting the entire file.
215
Data Ally Chromatography Manager Operators Manual
To clear the current Sequence Table, click on File in the Command Menu bar and then click on
Clear. Click Clear Sequence Table to clear the entire table (Figure 11.6). If the previous file has
been edited and has not been saved or resaved, an information message will appear before this file
is cleared asking if the previous file should be saved. If so, click on YES and assign either the same
filename or a new name as desired. If you do not wish to save the edited file, click on NO to proceed.
Figure 11.6 Sequence Clear Function
11.5.3 Saving Sequence Files
To save a Sequence file using the same name, click on Files in the Command Menu bar, and then
click on Save. A trap message box will appear prompting confirmation of whether the existing file
with the current name should be overwritten - click OK if you wish to resave the file. The previous
version will be overwritten with the current contents of the Sequence screen.
To save a modified Sequence under a new name, click on Save As in the Files menu. The Save As
dialog box will appear (Figure 11.7). Click inside the filename entry field and type in the desired new
filename. If you wish, click inside the DESCRIPTION field and type a description of the new file,
which may help identify this file in the directory listing for future recall. When the correct name and
description appear, click on OK to save the file to the current disk path. If another file already exists
in that path with the same name, an error message will instruct you to change the filename before
saving.
Figure 11.7 Sequence Files/Save As Dialog
It is recommended that Sequence program files saved to disk be "backed up" by copying the *.SEQ
files to a floppy disk, removable hard disk, or tape and preserving the copies in a secure place. If
modifications are routinely made to the library of *.SEQ files, backups should occur at routine
intervals or even on a daily basis.
You can enter a text description for the current Sequence file, which will appear in the "Description"
field in the Load dialog box when scanning saved files, either by directly typing a description into this
field when using the Save As dialog above, or by selecting the Sequence Description command in the
216
Data Ally Chromatography Manager Operators Manual
Files submenu, which permits you to type a multi-line text entry into the description field which will be
saved with the Sequence file.
11.5.4 Deleting Sequence Files
To delete a Sequence file from the current disk directory, use the Windows File Manager Delete
command.
11.5.5 Printing Sequence Files
Use the Print Sequence command in the Files submenu to print a summary report for the current
Sequence file. The Print function utilizes an Excel template file which is saved as
reports\seq\seq.xls, and which can be modified like any other report template using Excel (see
Section 13).
11.5.6 Automatically Starting Sequence Files
A special feature built into the Data Ally System is the ability to automatically run the default
Sequence file at boot up time. You may specify which time bases’sequence files are started via the
command line switches. The following is an example of a command line switch to start time base
TB1 and TB1 EDIT. This command could be placed in the program group/program item command
line area of your Windows Data Ally Group. If you wanted to start automatically from the DOS prompt
you would need to precede the command with WIN and a space or whatever command and path to
start your particular Windows program.
C:\Data Ally\Data Ally.EXE /start/1/2
217
Data Ally Chromatography Manager Operators Manual
12.0 Utilities
The Data Ally Utilities screen (Figure 12.1), displayed via the UTIL SoftButton in any channel,
includes the Configuration functions accessible only to the System Manager, and the Exit command
which terminates Data Ally operation.
None of the Utilities functions are essential to routine acquisition, processing, and reporting of
chromatography data. Any function in the Utilities Command Menu can be used at any time in any
channel, whether or not that channel is actively running a Method or Sequence. In many cases, the
Utilities screen and its contents will not be required at all by certain system operators.
Figure 12.1 UTILITIES Screen
12.1.0 Utilities Files Commands
The Utilities screen contains a set of file-related functions accessible by clicking the Files command
on the menu bar to see the Files submenu (Figure 12.2).
Figure 12.2 Utilities Files Submenu
The two commands available in the submenu allow you to load a new configuration file to reset the
overall system parameters, without entering Configuration mode, or to translate existing data system
raw data files from other formats into Data Ally-readable format.
12.1.1 Resetting Configuration
To change the configuration file which controls the current setup of the entire system, click on Load
Configuration in the submenu - the Load Configuration dialog will appear (Figure 12.3). Select the
desired Configuration file from any path or directory, and click OK, or CANCEL to abort reconfiguring. Clicking OK causes the selected configuration to be initialized - the system may "time
out" briefly and show the hourglass cursor while this is happening.
218
Data Ally Chromatography Manager Operators Manual
Figure 12.3 Load Configuration Dialog
Use of the Load Configuration command provides instant and easy access to any alternative
programmed configuration. For example, if you wish to set two different configurations specifying
completely different detector inputs and controlled instrumentation, representing two totally different
HPLC setups, creating and saving two specific configuration files which select each of the optional
system configurations allows you to switch the Data Ally software to match the analytical components
and functions as needed, at any time.
12.1.2 Translate Functions
The Translate command can convert files saved using Axxiom Chromatography 700 Series data
systems to Data Ally compatible formats, or can convert Data Ally-generated data files to ASCII and
other output formats for use with other software or devices. Click Translate in the Files submenu to
see the Translate submenu (Figure 12.4).
NOTE: Your version of Data Ally may contain other translator utilities that have been added since the
user manual was published. Contact your distributor for translator information.
Figure 12.4 Translate Submenu Commands
Ü To convert Axxiom 700 Series chromatogram data files to Data Ally data file (*.pdf) format, click
"Axxiom 700 to Data Ally" to see the 700 Series conversion dialog (Figure 12.5).
219
Data Ally Chromatography Manager Operators Manual
Figure 12.5 Axxiom 700 Series File Conversion Dialog
This function will find all files in the typical 700 series data file format, with file names having the
extensions *.0*, in any disk path, and will allow you to convert any or all of the files to Data Ally *.pdf
format. You can also type in the name of a known 700 Series data file (path and filename) to convert
single files on a one-at-a-time basis.
To convert one data file only, click inside the "File to Convert" entry box at upper left and type in any
valid path/filename for a 700 Series raw data file. The name of the new converted file will appear in
the box marked "Data Ally PDF Files" at right, which will have the same root filename as the existing
700 series file and will appear in the same path by default. If you wish to edit the new filename or
path location, simply click on the PDF file name shown in the right hand box and edit its name and
path as desired. Then click the Convert Single File button at bottom right to perform the file
conversion. Both a copy of the existing 700 Series data file and the new converted file will remain on
disk after each conversion event.
To convert a series of files, select the disk path and directory using the selector dialog in the center
box for the 700 series files desired. All the names of the relevant data files in the selected path will
appear in the box at left. Now, click to highlight each of the desired filenames in the box for
conversion - their respective converted *.pdf filenames will appear in the box at right after each file is
chosen. When all files are selected and highlighted, click the Convert All Files button at bottom to
perform all the conversions as a batch.
When all conversions are completed, click the Quit button to quit the conversion function.
Ü To export Data Ally *.pdf data files, click the Export Data Ally To ... command in the Translate
submenu. The Export dialog will appear (Figure 12.6).
220
Data Ally Chromatography Manager Operators Manual
Figure 12.6 File Export Dialog
This dialog allows reformatting of single *.pdf files from any disk path into ASCII format, or
reconversion to native Data Ally or "binary" format. This dialog can also be used to "scan" files to
evaluate their data structures and determine the range of signal values in each file.
To select a data file, click File in the dialog's command menu bar to view the Files Recall dialog
(Figure 12.7). Use this dialog to choose a Data Ally chromatogram file in any disk path - when the
desired file is shown, click OK, or on CANCEL to abort.
Figure 12.7 Export/Files Dialog
After clicking OK, the Files dialog will disappear and the name of the selected file will appear in the
filename field of the File Export Dialog. This file will be scanned, requiring a few seconds, and when
the scan is finished the number of data points, minimum and maximum signal values, and maximum
signal delta value (difference between highest and lowest point values) will be computed and will
appear in their respective boxes. You can scan through the file on a point by point basis by clicking
the Next Point button at the bottom - each time this is clicked the next data point in the file, beginning
with the first point, will be scanned individually and data describing that point will appear instantly in
the fields in the upper right portion of the dialog. Click on the Do All Points button to repeat the scan
of the entire file. You can click the STOP button at any time to immediately halt the scanning
process.
221
Data Ally Chromatography Manager Operators Manual
To convert to ASCII format, click the radio button marked ASCII at lower right and then click the Do
All Points button. The file will be reprocessed point by point and resaved as a new file in ASCII
format with the same name in the same directory path - this file will no longer be readable as a Data
Ally *.pdf binary file. However, you can reconvert to Data Ally ("binary") format by selecting an ASCII
format file and choosing the radio button marked Binary, then repeating the Do All Points command
to rescan and reformat the file.
12.2.0 Configure
The Configure command in Utilities accesses the Configuration Mode (Section 5). This is the only
point in the Data Ally software at which Configuration Mode can be entered. Instructions for using the
Configure submenu are found in the section on Configuration.
12.2.1 Exiting the Data Ally System
You can quit the Data Ally software only from the Utilities screen via the Quit command.
Ü To quit running Data Ally and remain in Windows, click on Quit in the Command Menu bar, then
click on Exit to Application. A trap message dialog box will appear to verify that you wish to quit.
Click on YES to quit. All active Data Ally windows and icons will be closed and any other software
running in Windows will continue unaffected.
222
Data Ally Chromatography Manager Operators Manual
13.0 Data Ally Help Functions
Like other Windows applications, Data Ally provides a substantial amount of built-in "Help" which is
instantly accessible from anywhere in the software. The yellow HELP SoftButton at the top left of
each Data Ally screen can be used to display Help dialog boxes at any time.
13.1.0 Using the HELP System
Ü To get HELP at any time while running Data Ally, click the HELP SoftButton or click the "Help"
command in the current dialog menu bar, if one is present - a HELP window will appear (Figure 13.1).
Figure 13.1 Data Ally Help Window
The overall Data Ally HELP system is organized into a series of topics, any of which can be reviewed
each time you select HELP. The Help topics are indexed by both topic categories and classes and
by "key words". You can move forward or backward to scan through the entire listing of Help topics
until you find what you need, or you can Search through all topics for a key word or phrase describing
the feature or action desired.
Key words in the Help dialogs can be marked with either a dotted or a solid underline. If you click the
left mouse button with the pointer on a word having a solid underline, the Help system will "jump" to a
new Help topic related to that word. Clicking on a word or phrase having a dotted underline will show
a definition of that word or phrase.
All Data Ally Help screens are context sensitive in that they will appear with specific topics keyed to
the current program screen or function being used. Figure 13.1 shows the initial Help display keyed
to the Graph screen, which deals with explaining chromatogram manipulation and other graphical
functions. You can of course select any Help topics at any time once any Help screen is being
displayed in an open window.
Ü To see a listing of main Help topics, click the Contents button on the Help window command
menu. The Contents listing window will appear (Figure 13.2) showing all the primary Help topics
available.
223
Data Ally Chromatography Manager Operators Manual
Figure 13.2 Help Contents Index Window
Ü To search for a specific desired topic in Help, click the Search button on the Help window
command bar menu. The Help Search dialog (Figure 13.3) will appear.
Figure 3.3 Help Search Dialog
The top portion of this dialog contains a selection box which pages down through all the listed Help
topic headings in the Help system alphabetically. Scan down through the listing to find the desired
heading and click on it to highlight - it will appear in the upper entry box. Alternatively, click inside this
box and directly type in any topic description in which you are interested. To see the list of
associated items with each topic, click the Show Topics button, and such a listing will appear in the
lower list box in the window. You can now highlight any item in the sublisting (these are the specific
items in the Help system) and then click the Go To button to see that specific Help window with a
detailed explanation. Click Close if you wish to close the dialog and escape.
To step back to the last Help window/topic viewed before the currently-displayed topic, click the Back
button on the top.
224
Data Ally Chromatography Manager Operators Manual
To view a "history" of all recent Help topic windows you have viewed, in order, click the History button
- a Help History window (Figure 13.4) will appear. This window lists in descending chronological
order all the recent screens and items you have viewed.
Figure 13.4 Help History Window
You can also use the ">>" and "<<" buttons to move, one screen at a time, through all the available
Help topics in the Data Ally Help system. Stepping through the available screens in this manner is a
good way to get an overview of all the topics which are covered.
All the other Help functions, as well as the overall organization of Data Ally Help, are standard
Windows functions and operate the same way as for Windows applications of all types in general.
You can get Help which describes how to use the Data Ally Help system by selecting the Help
command on the Command Menu bar of the Help dialog box, and then clicking on How to Use Help
in the submenu. Clicking the "Always on Top" item in this submenu to checkmark it will maintain the
current Help window on top of any other Data Ally display window to make using Help easier.
Any Help dialog box can be moved or resized in any position on the display. You may wish to change
the location of the Help box in order to see something it otherwise obscures underneath. Any Help
dialog can be "minimized" to an icon by clicking the down arrow/minimize button at the upper right
corner of the Help dialog, or by using Minimize in the Application Control Menu at upper left. After
iconizing, the Help window will remain on screen as an icon, and can be redisplayed at any time by
double-clicking on that icon.
Ü To close Help dialog boxes, click on Files/Exit in the Command Bar menu or use the Application
Control Menu Close command. Whenever you re-open Help, the Help window will retain its last size
and location.
Note that most of the topics and entries in the Data Ally Help system are indexed with a section
number reference for this Operators Manual, to assist you in quickly finding the most appropriate
explanation in the manual for any item you are viewing in Help.
13.2.0 Marking Help Topics
You can use the Help "bookmark" function to indicate specific reference points within the Help
system to which you want to return often. After a "bookmark" has been inserted in Help, you can
return instantly to that place by using the Bookmark menu in the Help window.
225
Data Ally Chromatography Manager Operators Manual
Ü To insert a "bookmark" at a Help topic, first show the desired topic in the Help window, and then
click on Define in the Bookmark menu. The Bookmark Define dialog (Figure 13.5) will appear. Click
on OK to use the title of the Help topic as the bookmark name, or click inside the name field and type
a new bookmark name, then click on OK. This will now cause the new bookmark name to appear on
the Help Bookmark menu.
Figure 13.5 Bookmark Define Dialog
Ü To move to a "bookmarked" topic, click on Bookmark in the Help window Command Menu bar, and
select the name of the bookmark to be viewed. You can also press the underlined number assigned
to the desired bookmark instead of clicking on its name. The bookmarked topic will appear.
Ü To remove a bookmark, click on Bookmark to see the submenu, then click on Define. Click on the
name of the bookmark to be removed, and click on Delete. Click on OK to execute the deletion.
13.3.0 Annotating Help Topics
It is possible to add your own customized annotations and notes to any of the Data Ally Help topics.
Annotations can be up to 2000 characters long and can include any type of characters.
Ü To add an annotation to a Help topic, with that topic in the current Help window, click on Edit and
then on Annotate in the submenu - the Annotation dialog (Figure 13.6) will appear. Type in the
annotation text you wish to add. The text will automatically "wrap" from line to line as you type.
When you have finished the annotation, click on OK to complete it.
Figure 13.6 Help Annotation Dialog
These steps can be repeated to add more text after existing annotation(s). However, only the sum of
all annotations made can be erased (below).
226
Data Ally Chromatography Manager Operators Manual
Ü To see a Help annotation, view the Help topic with the annotation, then click on the "paper clip"
symbol. Alternatively, you can press the TAB key to highlight the paper clip symbol, and then press
ENTER. The annotation will appear.
Click on CANCEL to clear the annotation.
Ü To erase an annotation, click the paper clip symbol on the current Help topic to see the annotation.
Click on the DELETE button to remove the annotation. Use of DELETE will remove all the contents
of the annotation window, even if the window includes several "annotations" added at different times.
227
Data Ally Chromatography Manager Operators Manual
14.0 Reporting with Microsoft Excel
Data Ally utilizes Microsoft Excel, v. 5.0 or higher, to format, prepare, display, and print any type of
customized report desired. Italicized words in this section are intended to be consistent with terms referred to
in Excel documentation. Information is passed from the Data Ally software to Excel via Direct Data Exchange
(DDE) and Visual Basic for Applications (VBA) functions. Desired information fields and records are placed
into positions on a report worksheet contained in an Excel .XLS workbook file, called a template by Data Ally,
residing in a subdirectory under ..\REPORTS. Any number of template .XLS files can be reviewed and edited
for use in reporting with Data Ally.
Each time the Data Ally software is initialized, a copy of Excel is also automatically loaded, so that Excel is
available for creating any run, calibration, or program summary reports whenever these are desired. Excel
generates each report from the information in Data Ally, and actually manages the display and/or printing of the
report, supplying such functions as print preview and view expansion. The Data Ally data system should not be
running, however, when modifying or creating new templates.
14.1.0 Using Excel to Review and Edit Report Templates
Microsoft Excel is generally loaded from its own directory on the computer’s hard drive. It can be accessed
while the Data Ally software is running via Windows Program Manager directly or through File Manager.
14.1.1 Loading Excel
To load Excel from Program Manager, activate the Program Manager window and select the Excel program
icon from its own application window or from an “Applications” icon/group, depending upon how it has been
installed. Double click with the left mouse button on the Excel icon to load Excel. The Excel spreadsheet will
appear.
To load Excel from File Manager, find the Excel directory in the master directory listing and click on its
directory icon to open the files. Locate the “excel.exe” file and click on its icon to execute it and load Excel.
14.1.2 Opening An Existing Report Template File
To open a Data Ally report template, .xls file, for any report type, left-mouse click on the Files command in the
main Excel worksheet screen and click on Open. The Open dialog will appear (Figure 16-1).
Double-click on the “C:\” drive icon, and then double-click on the ..\Data Ally directory icon to open it and
expose its subdirectories. Then double-click on the ..\REPORTS directory icon to open it and expose its
subdirectories. A listing of files contained in the ..\Data Ally\REPORTS directory will appear. This directory
will contain files like pyramid.xls and pyrrpt.xll which communicate with the data system and should not be
touched.
UNDER NO CIRCUMSTANCES SHOULD ANY OF THE FILES PRESENT IN THIS ..\REPORTS
DIRECTORY BE CHANGED OR DELETED! DOING SO CAN CAUSE FAILURE OF Data Ally
REPORTING MODES.
Double-click on the ..\REPORTS\ directory icon to open it and expose its subdirectories:
..\REPORTS\CAL
..\REPORTS\INT
..\REPORTS\MET
..\REPORTS\SEQ
..\REPORTS\PDF
..\REPORTS\SUM.
Now, double-click on one of these directories to open it and expose its template files. To load one of these
templates, select the specific template file, then PRESS AND HOLD DOWN THE SHIFT KEY and
228
Data Ally Chromatography Manager Operators Manual
simultaneously click on OK (or double-click on the template filename.) The template file selected will appear
showing the Excel worksheet (Figure 14.2). Note that it is important to hold the SHIFT key down while
opening template files so that the Auto_Open macro, which normally generates the report during the running of
Data Ally, will not execute now and thereby corrupt the template you expect to modify. If you accidentally
open a template without using the shift key, simply close the template answering no to the question: “Do you
want to save it?”. Then open the template as described above. Any of the .XLS template files in these
directories can be recalled, viewed, and edited.
Figure 14.1 Excel Files/Open Dialog Box
Figure 14.2 Examining an Excel Worksheet Report Template
14.1.3 Elements of a Report Template File
An Excel report template file for Data Ally usually contains several elements:
• A common header section with information about the user, the analytical system, the method, etc.
• One or more sections containing information about the files used (names and descriptions, date/time of
changes, etc.), the operator (name, position, etc.), or other data concerning a chromatogram run.
• A “table” section in which run data (peak numbers, names, areas, heights, concentrations, other
parameters) is summarized in a tabular format, with a top title line and a sum line at its bottom giving totals
for certain parameters in the table.
229
Data Ally Chromatography Manager Operators Manual
• An embedded graphic(s) or chromatogram(s) occupying a specified range of cells in the worksheet. The
image of one or more chromatograms can be directly imported from Data Ally into Excel via DDE, also
certain other information (such as peak data) could be “graphed” as a bar chart, pie chart, or x-y plot in a
saved report with the aid of user programming.
• Individual or groups of “calculated fields” which utilize various data elements from Data Ally for
performing some calculation or manipulation in the report.
A single report can include any combination of these elements in any desired order.
When an existing report template file is opened in Excel, any fixed text it contains will be shown in the
currently selected font and style, and in the correct position. Fields which will contain data captured from Data
Ally via DDE links are shown with a proprietary notation that contains a leading exclamation point indicating
that a DDE reference will be created for the field in that position. These DDE fields will be activated when
they are listed in a defined name, Dde_Cells (See section 14.2.6).
You can use the scroll bars at the right side and bottom of the Excel worksheet, or the PageDown/PageUp keys,
or the up/down/left/right arrow keys to move through the worksheet and to advance to subsequent pages, if
more than one page is formatted.
____________________________________
14.2.0 Excel Basics
PLEASE REFER TO YOUR MICROSOFT EXCEL USERS MANUAL AND DOCUMENTATION
FOR A MORE DETAILED EXPLANATION OF EXCEL’S FEATURES AND CAPABILITIES. THE
FOLLOWING SECTION IS A BRIEF INTRODUCTION TO THE BASIC ELEMENTS AND
FUNCTIONS IN EXCEL NEEDED IN FORMATTING REPORTS WITH Data Ally.
The Excel worksheet consists of a series of numbered rows and columns making up a large number of
individual cells, which can be assigned values or formulas and can be edited or moved. A complete set of tools
for formatting the appearance of the worksheet (fonts, borders, shading) and for performing graphical and
mathematical functions is available. These tools are usually accessed via the tool bars located above the top of
the worksheet. A formula bar appears immediately below the toolbars showing the value entered in the
currently selected cell (text or formula). To the far left of the formula bar is the name box which contains the
currently-selected worksheet cell reference number in its left corner (e.g. R10C2 for Row 10, Column 2). If the
current selection has a name associated with it, the name will show up in the name box instead of the cell
reference. Defined names are employed for a number of Data Ally reporting options. Defined names can be
used to reference a cell, a range of cells or even a Visual Basic procedure. Open the name box by clicking the
arrow to the right of it to see the names that correspond to cell references (See section 14.2.4). To see all the
names, it is necessary to choose open the Define Name Dialog Box (See section 14.2.5).
The Excel worksheet has a “what you see is what you get” display format, so that the actual appearance of text,
graphics, and other elements in the worksheet window reflects the appearance of these items when printed. A
print preview function is available in the File submenu to allow examination of the final format of reports
without having to print them.
When the mouse pointer is inside an Excel worksheet, it looks like a “white cross”. It can be used to select any
cell or cell range in the worksheet. You can move the mouse pointer over any cell and click the left mouse
button to place the insertion point in the cell which permits editing its contents. A range or series of cells can
be selected by clicking the left mouse and holding it down as the pointer is dragged across a series of rows
and/or columns to highlight a range. Excel draws a solid border line around the selected cell range to make it
visible. This temporary border will not be visible on the printed report. Menu item Format-Borders-AndShading is used to create borders and patterns that will print.
230
Data Ally Chromatography Manager Operators Manual
14.2.1 Changing Column Widths and Row Heights
The width of columns and height of rows can be changed in two ways:
• Move the mouse pointer in the worksheet over the top column “button” (with the column number) or onto
the left-edge row “button” (with the row number) which is to be resized. When you move the pointer over
either edge of the column or row button, the pointer will change to a split horizontal (column) or split
vertical (row) arrow. Hold down the left mouse button and drag the edge of the button in either direction
to make the button (and the attached row or column) larger or smaller. The entire column or row border
will be redrawn to follow the button dragging. When the desired size is obtained, release the mouse button
and the worksheet will be redrawn.
• Select the desired column or row or range with the mouse pointer. Click on Format in the Excel
Command Menu bar to see the Format submenu. Click on either Row Height or Column Width to bring up
the dialog box for changing that parameter. Type in the new desired height or width, or specify the
“standard” value, and click on OK. The selected range will be resized.
14.2.2 Changing Contents of a Single Cell
In Data Ally report template .XLS files, each cell may contain either no information, a value of fixed alphabetic
or numeric data of any type, an Excel formula, a function call or a Data Ally DDE field.
Once the insertion point is set in a cell, the following changes can be made to it:
• Text or numbers can be directly typed into the report cell.
• An Excel formula can be directly typed into a report cell. Formulas must always begin with the “=”
character. Read your Excel User’s Guide and Excel Function Reference to find out all you need to know
about available formulas, functions and their use.
• A proprietary Data Ally DDE field can be directly entered into a report cell. Data Ally DDE references all
contain an exclamation point as the first character. The name is taken from the list of available DDE fields
as listed in Section 14.4. It is also required that each DDE field be individually listed in a Dde_Cells
defined name as described below.
• You can clear any existing or previous DDE field entry by selecting the cell where that field appears,
clicking on the right button to see the Edit pop-up, and clicking on Clear Contents
• You can directly type fixed text characters into any cell(s) adjacent to a DDE field cell as labels or
explanations for the DDE field parameter. Cells containing descriptive text of this nature can be moved or
copied from other locations in the existing worksheet using the Cut or Copy commands in Excel as
described in section 14.2.3.
14.2.3 Moving Data From One Cell To Another
• Cut or move the value, formula or DDE field from an already-existing cell in the current worksheet by
selecting that cell, clicking the right mouse button to see the Edit pop-up menu, and clicking on Cut. Move
the mouse pointer to the desired new cell position, click on that cell to highlight it, and click the right
button for the Edit pop-up menu. Then select Paste to place the contents in the new cell.
• Copy the value, formula or DDE field from an already-existing cell in the current worksheet by selecting
that cell, clicking the right mouse button to see the Edit pop-up menu, and clicking on Copy. Move the
pointer to the new cell position, click on that cell to highlight it, and click the right button for the Edit popup menu. Then select Paste to place the contents in the new cell.
14.2.4 Using The Name Box
• The name box appears in the top left corner of the top screen message line and has a down arrow to the
right of it. When a cell is selected, the name box usually displays row/column description for the cell.
231
Data Ally Chromatography Manager Operators Manual
When a cell has a name associated with it, however, the name shows up in the name box instead. The
down arrow to the right opens the name box. Then selecting a particular name causes the cells named to be
highlighted. This is very useful for verifying that defined names have the correct syntax and thus point to
all and only the desired cells. The name box can also be used to define names. However, since the
Dde_Cells name described below requires cells to be listed with comma separators, it is necessary to
define them using the menu bar to open the Define Name Dialog Box instead.
14.2.5 Using the Define Name Dialog Box
• Make a pre-selection and open the Define Name Dialog Box by clicking menu items Insert then Names
then Define. At this point, one can select a predefined name or enter a new name to be defined in the box
at the top. The RefersTo: box at the bottom of the dialog contains the references for the name. In the case
of a new name, it contains the reference to the current selection. See sections below regarding the
appropriate methods for pre-selection of cells in each case. If the contents of the RefersTo: box, at the
bottom, is not correct, it can be manually edited. As with all formulas, the first character must be the
character =. When the RefersTo: box is correct, click the Add button and OK to exit.
14.2.5.1 Defining A Named Range
• Preselect the range before opening the dialog. To preselect a range, click on the top left cell and press and
hold the left mouse button while dragging the mouse to highlight the desired range. Open the Define Name
Dialog Box and the range as necessary (See section 14.2.5). Examples of defined names that require ranges
are: Table_Origin, Summary_Origin (See section 14.2.6).
14.2.5.2 Defining A Named Row Reference
• Preselect the row(s) before opening the dialog. To preselect a row or rows, click on the row heading and
draw the mouse down to select the row(s) to highlight the desired rows. Open the Define Name Dialog
Box and edit the row reference if necessary (See section: 14.2.5) Examples of defined names that require
row references are Print_Titles and Summary_Bound (See section 14.2.6).
14.2.5.3 Defining A Named Multiple Selection Of Cells
Make a multiple selection of cells before opening the dialog. To make a multiple selection of cells, left mouse
click on the first cell in the list, press and hold down the control key, clicking on each successive cell in the list.
Open the Define Name Dialog Box and edit the list of cells if necessary (See section 14.2.5). An example of a
Defined Name that requires a list of cells is Dde_Cells (See section 14.2.6). Though the process is more
arduous, the RefersTo: box at the bottom could be edited by hand without preselecting cells. A sample entry
might be “=R5C2,R6C2,R7C2,R8C4”. Colon characters are not permitted in multiple selections for use with
Dde_Cells.
14.2.6 Inspecting Defined Names Used in Report Templates
• Dde_Cells Every cell in the report template containing a DDE name must be separately listed in a
Dde_Cells separated by a comma with the exception of cells which are contained within the ranges of
Table_Origin or within Summary_Origin. This is essential for proper operation of DDE when reports
are produced. Regardless of where or how many times any DDE field is placed, all its cell references
MUST be included in Dde_Cells. It makes no difference in what order these fields are listed but each
DDE field must be separated from each other with a comma. Since selection of cells by dragging the
cursor results in ranges (includes a colon), the procedure in section 14.2.5.3 must be followed instead.
• Dde_Cells1 through Dde_Cells9 Since defined names have room for a maximum number of fifteen or so
cell references, additional defined names may be used to list all the DDE fields. The defined names
reserved for this purpose are Dde_Cells1 through Dde_Cells9. It makes no difference which of the
Dde_Cells names are used for which DDE field. It is convenient if all the DDE fields listed in a name are
grouped together. If the particular Dde_Cells name is clicked on in the name box, the spreadsheet will
232
Data Ally Chromatography Manager Operators Manual
scroll to the first DDE field and all of the DDE fields listed will be highlighted for inspection. These are
also comma delimited multiple selections of cells.
• Print_Titles This name is used to define headings for tables which will print at the top of each page. This
must be a row(s) reference which is created as described in section 14.2.5.2.
• Summary_Bound This name, when it is used, describes the row below Summary_Origin. It is only used
when Summary_Origin defines multiple rows and is then only required when using the special Visual
Basic Routines for manipulating tuples with multiple rows. This must be a row(s) reference which is
created as described in section 14.2.5.2.
• Summary_Origin
This name is used to describe a range on a Summary Report that contains summary
data. This must be a Named Range which is created as described in section 14.2.5.1.
• Table_Origin This name is used to describe a table containing DDE names on a report template. This
must be a Named Range which is created as described in section 14.2.5.1. When more DDE fields are
required than will fit on the page, the report can be adjusted for landscape mode to add the extra fields or
the DDE fields can be divided among multiple tables. Additional tables can be included on the report by
defining their rectangles using of DDE name Table_Origin1, Table_Origin2 under Table_Origin.
____________________________________
14.3.0 Modifying Existing Report Template Styles
It is easy to change Excel-based report template files to create exactly the report formats desired using
information that will be sent from Data Ally. To get started, the best approach is usually to change an alreadyexisting working report format and then resave it as a new template file. Modifying and saving templates
should be done without Data Ally running and the template opened with the shift key (See Section 14.1.2).
14.3.1 Modifying A Template Paper Size
Data Ally templates are designed for three pauper sizes: A4, Letter and Legal. They are designed so that the
template can be converted from one paper-size to another with a modicum of effort.
• Setting Default PaperSize. The program files: Calibration, Integration, Method and Sequence each have
a default template that is used whenever the Files-Print menu item is used. This system default template
can be modified in the Data Ally.ini file. Under the [ini.rpt] section, define: PaperSize=Letter or
PaperSize=Legal or PaperSize=A4. If this definition is missing, the Data Ally data system assumes
PaperSize=A4.
• Required Program Filenames. The following table summarizes the program templates that will be
opened depending upon the PaperSize option.
Path:
In Europe:
PaperSize=A4
In the U.S.A.
PaperSize=Let
PaperSize=Legal
.\reports\cal
.\reports\met
a4cal.xlsa4met.xls
a4int.xls
.\reports\int
.\reports\seq
a4seq.xls
letcal.xlsletmet.xls
letint.xls
letseq.xls
lglcal.xls
lglmet.xls
lglint.xls lglseq.xls
• Hints for Designing A Template For More Than One Paper Size. The Summary Info Dialog Box can
be opened with menu item File-Summary Info.... For program files, the comment box contains
information about the Top Margin and the Bottom Margin. This comment should be consistent with the
actual Top and Bottom Margins set in the Page Setup Dialog Box opened by File_Page Setup.... In the
Page Tab, select the paper size; in the Margins Tab, select the Top and Bottom margins. These are the
only parameters that need to be changed to convert from one Paper size to another once you figure out
what the correct Top and Bottom margins are for the different page sizes. If you want to be able to create a
233
Data Ally Chromatography Manager Operators Manual
report from scratch that converts easily this way, a landscape report should be created based upon letter
paper because it has the shortest length. A portrait report should be created based upon A4 paper because
it has the narrowest width.
14.3.2 Placing And Formatting Report Headers
A report header is a set of information and/or graphics that prints once at the beginning of a report. In most
cases, the report header will include some identification of the type of report, the institution or laboratory, the
date and time of the report, the operator name, the data file(s) used for the report, the analytical instrumentation
or system employed for the run, sample-specific information, and a description of the procedural files used to
generate the run and report. Generally, report header information is global in nature.
When DDE fields are placed on the report, they must be preceded by an exclamation point and the cell
containing the DDE reference must be listed in one of the Dde_Cells defined names as described in Section
14.3.2. DDE names available for reports are summarized in section 14.4.
14.3.3 Placing And Formatting Page Headers Using Print_Titles
A page header is a set of information that prints at the top of each page. If you wish some DDE fields to be
included in the header to be repeated on each page of the report they must be included in a Dde_Cells name.
Also, you must include any rows containing desired header fields, labels, and graphics in the range of rows that
define the name Print_Titles. This name assignment will cause those rows to be printed at the top of each page,
along with any table column titles which may be present in the named range of rows. Usually, the column
headings for the table will be the last row or two of the Print_Titles range. Indeed, Print_Titles usually only
contains column headings.
14.3.4 Placing and Formatting Data/Result Tables
Tables in Data Ally reports are of three fundamental types:
Peak information tables based on the set of “enabled” peaks from the current Integration Peak Table, with
selected result and/or calibration parameters listed for each peak in a series.
Summary peak tabulation tables based on “enabled” peaks found in a Sequence of runs, with selected
parameters listed for the same peak over a series of runs or injections.
Summary run tabulation tables, with selected parameters listed for each chromatogram filename over a series or
group of runs. For these tables,
The last two types of tables can only be placed into “summary reports” executed as part of Sequences. Only
one table can be placed into any single report.
14.3.4.1 Defining The Table Position
The position of each table in any report is defined by the range of the first data row being named
“Table_Origin”. Any table will be printed only if a cell with this name appears on the worksheet. In an existing
report template, select “Table_Origin” in the name box (See section 14.2.4) to see the present location of the
table origin cell, if any. In order to define a new table position, use the Define Name Dialog Box to define
Table_Origin (See section 14.2.4.1) as a rectangular region. You can click inside the location box in the
Define Names dialog and edit the current cell reference, or delete it and then use the cross pointer to select the
new desired cell for the table origin. Alternatively, the named cell can be moved to a different location by
using the Cut/Paste function.
14.3.4.2 Tables With Folded Rows Or Tuples
For most Data Ally Templates, all the printed data for a data row (called a tuple) fits on one printed row on the
report. The first tuple in this case is simply the first printed row of the table and Table_Origin is a range one
234
Data Ally Chromatography Manager Operators Manual
row high. When all the data for one tuple will not fit on one row, the data may be folded onto several rows and
Table_Origin may be many rows high. That is the case for the Summary and System Suitability reports. In that
case, the bottom row of Table_Origin usually does not contain any data and is reduced in height to form a tuple
separator. This allows the tuples to be visibly separate on the report instead of blending in with all of the rest
of the rows. Tables with tuples of more than one row have a restriction that all rows in a given column must be
similar. That is, a column defined in Table_Origin may contain only DDE fields or text labels, but not both.
14.3.4.3 Defining Table Contents/Fields
Once the position of the table is set by Table_Origin, the actual contents of the table must be defined. To do
this, individual fields containing the information reference formulas must be entered into their positions in the
first tuple of the table.
Type the name of each table field representing the items to be included in the table in a set of consecutive
columns within Table_Origin, in the same format as for the DDE fields described above. The table can include
as many field entries as desired. To make all the table data fit on one row, if the column widths and number of
field columns exceed the total width available on a single page, you can either select a page width appropriate
for printing the table on more than one page, or change column widths used to decrease the total table width, or
change from portrait to landscape orientation for printing the page. If you would rather have multiple report
rows per data row (or tuple), you must follow the restrictions described in section 14.3.3.2 for folded rows.
Section 14.4 contains the list of fields available for a peak information table (from a single run).
Note that column width, which can be set for each table column, will effectively determine how many digits or
characters can be shown or printed for each field. You can also format numerical results in the table using the
Excel Format/Number command, and align text or numerical column values in each column using the
Format/Align commands.
To insert one or more blank columns between any other columns in a table, simply leave them blank.
____________________________________
14.4.0 Data Ally DDE Names For Use On Reports
The easiest way to create a user specific report is to modify an existing report template that starts out working
perfectly. Test this original template yourself with the data system before you make any modifications or you
might end up starting all over. Make a copy of this template and step-wise modify and test it. Make small
modifications, saving and testing each of them by running the data system, before you change more things. For
instance, it is reasonable to add many DDE fields to a report header, edit the appropriate Dde_Cells for them
and then test the whole lot. It is not reasonable to also start changing column widths and modifying table
entries at the same time and expect it all to work the first time. Don’t forget that you must not have the data
system running when you step-wise modify a template. Also don’t save a template if you forgot to hold down
the Shift key when you opened it.
The following sections list the proprietary DDE fields available for placement on reports. The column labeled
as Templates Using This Field include some of the report Templates that now use the field. It may be helpful
to you to examine those templates and notice how the DDE field is entered and how the cell is included in a
Dde_Cells name.
235
Data Ally Chromatography Manager Operators Manual
14.4.1 Current Context Sensitive DDE Names
DDE names specific to the current context: Method, Integration, Sequence or Calibration
Proprietary DDE Field
!hdr.Description
!hdr.Filename
!hdr.Type
!hdr.Version
!hdr.stamp.Date
!hdr.stamp.Time
!signal.Cols
!signal.Description
!signal.Name
!sum.pdf.Description
!sum.pdf.Filename
!sys.Description
!sys.Name
!sys.Number
!sys.SerialNumber
!sys.box.Id
!sys.box.slave.Enable
!sys.box.slave.Id
Range
Templates Using This Field
Cal, Int, Met, Seq
Cal, Int, Met, Seq, Full
Cal, Int, Met, Seq
Met, Seq
Full
Cal, Int, Met, Seq, Full
14.4.2 Calibration DDE Names
For Report Heading: DDE names referring to fields stored in Calibration files (.cal)
Proprietary DDE Field
!cal.int.Filename
!cal.is.Peaks:1
!cal.levels.Cols
!cal.peaks.Rows
!cal.points.Rows
Range
Templates Using This Field
(to 5 is)
Cal
Cal
For Tables: DDE names referring to fields stored in Calibration file tables (.cal)
!cal.peaks.enable.Row::<“ “,*>
!cal.peaks.enable.Row::<#,#>
!cal.peaks.table.Basis
!cal.peaks.table.cal.Mode
!cal.peaks.table.Conc:1
!cal.peaks.table.Fit
!cal.peaks.table.is.Number
!cal.peaks.table.Name
!cal.peaks.table.RT
!cal.peaks.table.Unit
Enable
Line No.
!cal.points.enable.Row::<“ “,*>
!cal.points.enable.Row::<#,#>
!cal.points.table.cal.Level
!cal.points.table.correction.Dilution
!cal.points.table.correction.InjectionVolume
!cal.points.table.correction.Weight
!cal.points.table.int.Filename
!cal.points.table.is.Area
Enable
Line No.
236
(to 16 levels)
Cal
Cal
Cal
Cal
Cal
Cal
Cal
Cal
Cal
Cal
Cal
Cal
Cal
Cal
Cal
Cal
Data Ally Chromatography Manager Operators Manual
!cal.points.table.is.Conc
!cal.points.table.is.Height
!cal.points.table.met.Filename
!cal.points.table.pdf.Filename
!cal.points.table.process.Date
!cal.points.table.process.Time
!cal.points.table.results.AdjConc
!cal.points.table.results.AdjResp
!cal.points.table.results.Area
!cal.points.table.results.AreaPct
!cal.points.table.results.Coefficients:1
!cal.points.table.results.Conc
!cal.points.table.results.Height
!cal.points.table.results.HeightPct
!cal.points.table.results.RF
!cal.points.table.results.RT
!cal.points.table.run.Date
!cal.points.table.run.Time
!cal.points.table.sample.Description
!cal.points.table.sample.Name
!cal.points.table.sample.Number
Cal
Cal
Cal
Cal
Cal
Cal
(to 3 coeff.)
Cal
Cal
Cal
Cal
Cal
Cal
Cal
Cal
Cal
Cal
Cal
Cal
Cal
For Tables: Column heading or field label text for calibration file tables (.cal)
!view.cal.peaks.enable.Row.ShortTitle
!view.cal.peaks.table.Basis.ShortTitle
!view.cal.peaks.table.cal.Mode.ShortTitle
!view.cal.peaks.table.Conc.ShortTitle:1
!view.cal.peaks.table.Fit.ShortTitle
!view.cal.peaks.table.is.Number.ShortTitle
!view.cal.peaks.table.Name.ShortTitle
!view.cal.peaks.table.RT.ShortTitle
!view.cal.peaks.table.Unit.ShortTitle
Cal
Cal
(to 16)
!view.cal.points.enable.Row.ShortTitle
!view.cal.points.table.cal.Level.ShortTitle
!view.cal.points.table.correction.Dilution.ShortTitle
!view.cal.points.table.correction.InjectionVolume.ShortTitle
!view.cal.points.table.correction.Weight.ShortTitle
!view.cal.points.table.int.Filename.ShortTitle
!view.cal.points.table.is.Area.ShortTitle
!view.cal.points.table.is.Conc.ShortTitle
!view.cal.points.table.is.Height.ShortTitle
!view.cal.points.table.met.Filename.ShortTitle
!view.cal.points.table.pdf.Filename.ShortTitle
!view.cal.points.table.process.Date.ShortTitle
!view.cal.points.table.process.Time.ShortTitle
!view.cal.points.table.results.Area.ShortTitle
!view.cal.points.table.results.AreaPct.ShortTitle
!view.cal.points.table.results.Coefficients.ShortTitle:1
(to 3)
!view.cal.points.table.results.Conc.ShortTitle
!view.cal.points.table.results.Height.ShortTitle
!view.cal.points.table.results.HeightPct.ShortTitle
!view.cal.points.table.results.RF.ShortTitle
!view.cal.points.table.results.RT.ShortTitle
!view.cal.points.table.run.Date.ShortTitle
Cal
Cal
Cal
Cal
Cal
Cal
Cal
Cal
Cal
Cal
Cal
Cal
Cal
Cal
Cal
Cal
Cal
Cal
Cal
Cal
Cal
Cal
Cal
Cal
Cal
237
Data Ally Chromatography Manager Operators Manual
!view.cal.points.table.run.Time.ShortTitle
!view.cal.points.table.sample.Description.ShortTitle
!view.cal.points.table.sample.Name.ShortTitle
!view.cal.points.table.sample.Number.ShortTitle
Cal
Cal
Cal
Cal
14.4.3 Integration DDE Names
For Report Heading: DDE names referring to fields stored in Integration files (.int)
Proprietary DDE Field
!int.column.Flow
!int.column.Length
!int.column.ParticleDiameter
!int.parm.BaselineDrift
!int.parm.DroplineRatio
!int.parm.MinArea
!int.parm.MinHeight
!int.parm.MinWidth
!int.parm.NoiseReject
!int.parm.SlopeInterval
!int.parm.SlopeSensitivity
!int.peaks.Rows
!int.retention.Time
!int.suit.Enable
!int.unretained.Name
!int.unretained.RT
!int.window.Logic
Range
Templates Using This Field
Int
Int
Int
Int
Int
Int
Int
Int
Int
Int
Int
For Tables: DDE names referring to fields stored in Integration file tables (.int)
!int.peaks.enable.Row::<“ “,*>
!int.peaks.enable.Row::<#,#>
!int.peaks.table.cal.Mode
!int.peaks.table.Comment
!int.peaks.table.is.Number
!int.peaks.table.Name
!int.peaks.table.rel.Code
!int.peaks.table.RT
!int.peaks.table.suit.Code
!int.peaks.table.Window
Enable
Line No.
Int
Int
Int
Int
Int
Int
Int
Int
Int
For Tables: Column heading or field label text for integration file tables (.int)
!view.int.peaks.enable.Row.ShortTitle
!view.int.peaks.table.cal.Mode.ShortTitle
!view.int.peaks.table.Comment.ShortTitle
!view.int.peaks.table.is.Number.ShortTitle
!view.int.peaks.table.Name.ShortTitle
!view.int.peaks.table.rel.Code.ShortTitle
!view.int.peaks.table.RT.ShortTitle
!view.init.peaks.table.suit.Code.ShortTitle
!view.int.peaks.table.Window.ShortTitle
Int
Int
Int
Int
Int
Int
Int
14.4.4 Method DDE Names
For Report Heading: DDE names referring to fields stored in Method files (.met)
238
Data Ally Chromatography Manager Operators Manual
Proprietary DDE Field
!met.cal.Code:1
!met.cal.Filename:1
!met.cal.Level:1
!met.cal.rpt.Enable:1
!met.cal.rpt.Template:1
!met.correction.Dilution
!met.correction.InjectionVolume
!met.correction.Weight
!met.events.Rows
!met.int.Filename:1
!met.is.Conc:1
!met.pdf.Filename:<1,1>
!met.pdf.rpt.Chromatogram:<1,1>:”Y”,”N”>
!met.pdf.rpt.Enable:<1,1>:<”Y”,”N”>
!met.pdf.rpt.Filename:<1,1>
!met.pdf.rpt.Print:<1,1>:<“Y”,”N”>
!met.pdf.rpt.Show:<1,1>:<“Y”,”N”>
!met.pdf.rpt.Template:<1,1>
!met.run.Duration
!met.sample.Description
!met.sample.Name
!met.sample.Number
!met.signal.Enable:1
!met.signal.Resolution:1
Range
(to 2 signals)
(to 2 signals)
(to 2 signals)
(to 2 signals)
(to 2 signals)
(to 2 signals)
(to 1 is)
(to 2 sig,4 files)
(to 2 sig,4 files)
(to 2 sig,4 files)
(to 2 sig,4 files)
(to 2 sig,4 files)
(to 2 sig,4 files)
(to 2 sig,4 files)
(to 2 signals)
(to 2 signals)
Templates Using This Field
Met
Met
Met
Met
Met
Met
Met
Met
Met
Met
Met
Met
Met
Met
Met
Met
Met
Met
Met
Met
Met
Met
For Tables: DDE names referring to fields stored in Method file tables (.met)
!met.events.enable.Row::<“ “,*>
!met.events.enable.Row::<#,#>
!met.events.table.Comment
!met.events.table.Time
!met.events.table.det.EC.Command
!met.events.table.det.EC.dc.Command:1
!met.events.table.det.EC.dc.guard.Command
!met.events.table.det.EC.pulse.Command
!met.events.table.det.EC.pulse.guard.Command
!met.events.table.det.WL.Command:1
!met.events.table.det.WL.Lambda:1
!met.events.table.flag.in.Code
!met.events.table.flag.out.Code
!met.events.table.oven.Temp
!met.events.table.pump.Flow
!met.events.table.pump.Pct:1
!met.events.table.zone.Code
Enable
Line No.
(to 4 ecdc)
(to 2)
(to 2)
(to 4 pumps)
Met
Met
Met
Met
Met
Met
Met
Met
Met
Met
Met
Met
Met
Met
Met
Met
Met
For Tables: Column heading or field label text for method file tables (.met)
!view.met.events.enable.Row.ShortTitle
!view.met.events.table.Comment.ShortTitle
!view.met.events.table.det.EC.Command.ShortTitle
!view.met.events.table.det.EC.dc.Command.ShortTitle:1 (to 4)
!view.met.events.table.det.EC.dc.guard.Command.ShortTitle
!view.met.events.table.det.EC.pulse.Command.ShortTitle
!view.met.events.table.det.EC.pulse.guard.Command.ShortTitle
!view.met.events.table.det.WL.Command.SuperTitle
Met
Met
Met
Met
Met
Met
Met
Met
239
Data Ally Chromatography Manager Operators Manual
!view.met.events.table.det.WL.Lambda
!view.met.events.table.flag.in.Code.ShortTitle
!view.met.events.table.flag.out.Code.ShortTitle
!view.met.events.table.oven.Temp.ShortTitle
!view.met.events.table.pump.Flow.ShortTitle
!view.met.events.table.pump.Pct.ShortTitle
!view.met.events.table.Time.ShortTitle
!view.met.events.table.zone.Code.ShortTitle
Met
Met
Met
Met
Met
Met
14.4.5 PDF DDE Names
DDE names referring to fields stored in PDF files (.pdf)
Proprietary DDE Field
!pdf.cal.Code
!pdf.cal.Description
!pdf.cal.Filename
!pdf.cal.Level
!pdf.correction.Dilution
!pdf.correction.InjectionVolume
!pdf.correciton.Weight
!pdf.int.column.Flow
!pdf.int.column.Length
!pdf.int.column.ParticleDiameter
!pdf.int.Description
!pdf.int.Filename
!pdf.int.unretained.Name
!pdf.int.unretained.RT
!pdf.is.Conc:1
!pdf.met.Description
!pdf.met.Filename
!pdf.process.Date
!pdf.process.Time
!pdf.results.Rows
!pdf.run.Date
!pdf.run.Time
!pdf.sample.BCD
!pdf.sample.Description
!pdf.sample.Injection
!pdf.sample.Name
!pdf.sample.Number
!pdf.sample.Vial
!pdf.seq.Description
!pdf.seq.Filename
!pdf.totals.Area
!pdf.totals.AreaPct
!pdf.totals.Conc
!pdf.totals.ConcPct
!pdf.totals.Height
!pdf.totals.HeightPct
Range
Templates Using This Field
Full
Full
Full
Full
Full
Full
Full
Full
Full
(to 5 is)
Full
Full
Full
Full
Full
Full
Full
Full
Full
Full
Full
Full Area%
Area%
Full
Full
Full
Full
For Tables: DDE names referring to fields stored in PDF files (.pdf)
Proprietary DDE Field
!pdf.results.table.Area
!pdf.results.table.AreaPct
240
Range
Templates Using This Field
Full, Area%, RFKC
Area%
Data Ally Chromatography Manager Operators Manual
!pdf.results.table.Coefficients:1
!pdf.results.table.Conc
!pdf.results.table.ConcPct
!pdf.results.table.Height
!pdf.results.table.HeightPct
!pdf.results.table.int.RT
!pdf.results.table.Name
!pdf.results.table.Number
!pdf.results.table.RF
!pdf.results.table.RT
!pdf.results.table.suit.Code
!pdf.results.table.suit.begin.Signal:1
!pdf.results.table.suit.begin.Time:1
!pdf.results.table.suit.end.Signal:1
!pdf.results.table.suit.end.Time:1
!pdf.results.table.Unit
(to 3 coeffs.)
RFKC
Full, RFKC
Full, RFKC
Full
Full
Full, Area%, RFKC
Full, Area%, RFKC
Full, RFKC
Full, Area%, RFKC
(to 5 suitability cols)
(to 5 suitability cols)
(to 5 suitability cols)
(to 5 suitability cols)
Full, RFKC
14.4.6 Sequence DDE Names
For Report Heading: DDE names referring to fields stored in Sequence files (.cal)
Proprietary DDE Field
!seq.auto.Enable
!seq.auto.FillTime
!seq.auto.FlushCount
!seq.auto.InjectionVolume
!seq.auto.NeedleWash
!seq.auto.PreflushVolume
!seq.cal.Suppress
!seq.int.Suppress
!seq.process.First
!seq.process.Last
!seq.process.Mode
!seq.process.Validate::<“Y”,”N”>
!seq.rpt.Print::<“Y”,”N”>
!seq.rpt.Show::<“Y”,”N”>
!seq.sequence.Rows
!seq.sum.rpt.Enable:1
!seq.sum.rpt.Filename:1
!seq.sum.rpt.Print:1
!seq.sum.rpt.Show:1
!seq.sum.rpt.Template:1
Range
Templates Using This Field
Seq
Seq
Seq
Seq
Seq
Seq
Seq
(to 2 signals)
(to 2 signals)
(to 2 signals)
(to 2 signals)
(to 2 signals)
For Tables: DDE names referring to fields stored in Sequence file tables (.cal)
!seq.sequence.enable.Row::<“ “,*>
!seq.sequence.enable.Row::<#,#>
!seq.sequence.table.auto.FillTime
!seq.sequence.table.auto.FlushCount
!seq.sequence.table.auto.InjectionVolume
!seq.sequence.table.cal.Code
!seq.sequence.table.cal.Filename:1
!seq.sequence.table.cal.Level
!seq.sequence.table.cal.rpt.Template:1
!seq.sequence.table.Comment
Enable
Line No.
(to 2 signals)
(to 2 signals)
Seq
Seq
Seq
Seq
Seq
Seq
Seq
Seq
241
Data Ally Chromatography Manager Operators Manual
!seq.sequence.table.correction.Dilution
!seq.sequence.table.correction.InjectionVolume
!seq.sequence.table.correction.Weight
!seq.sequence.table.Injections
!seq.sequence.table.int.Filename:1
(to 2 signals)
!seq.sequence.table.is.Conc:1
(to 5 is)
!seq.sequence.table.met.Filename
!seq.sequence.table.pdf.Filename:1
(to 2 signals)
!seq.sequence.table.pdf.rpt.Filename:1
(to 2 signals)
!seq.sequence.table.pdf.rpt.Template:1
(to 2 signals)
!seq.sequence.table.rpt.Chromatogram:1:<“Y”,”N”> (to 2)
!seq.sequence.table.sample.Description
!seq.sequence.table.sample.Name
!seq.sequence.table.sample.Number
!seq.sequence.table.sample.Vial
Seq
Seq
Seq
Seq
Seq
Seq
Seq
Seq
Seq
Seq
Seq
Seq
Seq
Seq
Seq
For Tables: Column heading or field label text for sequence file tables (.seq)
!view.seq.sequence.enable.Row.ShortTitle
!view.seq.sequence.table.auto.FillTime.ShortTitle
!view.seq.sequence.table.auto.FlushCount.ShortTitle
!view.seq.sequence.table.auto.InjectionVolume.ShortTitle
!view.seq.sequence.table.cal.Code.ShortTitle
!view.seq.sequence.table.cal.Filename.ShortTitle
!view.seq.sequence.table.cal.Level.ShortTitle
!view.seq.sequence.table.cal.rpt.Template.ShortTitle
!view.seq.sequence.table.Comment.ShortTitle
!view.seq.sequence.table.correction.Dilution.ShortTitle
!view.seq.sequence.table.correction.InjectionVolume.ShortTitle
!view.seq.sequence.table.correction.Weight.ShortTitle
!view.seq.sequence.table.Injections.ShortTitle
!view.seq.sequence.table.int.Filename.ShortTitle
!view.seq.sequence.table.is.Conc.ShortTitle:1 (to 5 is)
!view.seq.sequence.table.met.Filename.ShortTitle
!view.seq.sequence.table.pdf.Filename.ShortTitle
!view.seq.sequence.table.pdf.rpt.Filename.ShortTitle
!view.seq.sequence.table.pdf.rpt.Template.ShortTitle
!view.seq.sequence.table.rpt.Chromatogram.ShortTitle
!view.seq.sequence.table.sample.Description.ShortTitle
!view.seq.sequence.table.sample.Name.ShortTitle
!view.seq.sequence.table.sample.Number.ShortTitle
!view.seq.sequence.table.sample.Vial.ShortTitle
242
Seq
Seq
Seq
Seq
Seq
Seq
Seq
Seq
Seq
Seq
Seq
Seq
Seq
Seq
Seq
Seq
Seq
Seq
Seq
Seq
Data Ally Chromatography Manager Operators Manual
15 Hardware Specific Interface Information
15.1 Autosamplers
15.1.1 Marathon Autosampler by Spark-Holland
Three Marathon Autosampler models are currently controlled by Data Ally. They are the Marathon
Basic™ , the Marathon-XT™ , and the Marathon Basic-Plus™ . The Marathon Basic does not support
variable injection volume. The user is advised to study the Marathon user's manual to become
familiar with the operational details of the specific model in use.
15.1.1.1 Working with Spark Marathon Autosamplers
Data Ally provides control over the Marathon Autosampler via the Sequence mode of operation. In
order to control the Marathon, the Marathon control must be configured in by entering the
configuration mode and then adding the Marathon autosampler model to be controlled. Next while
still in configuration, you must go to the Sequence screen and click on the “Autosampler button”.
This will open the Autosampler setup dialog box, where default values can be entered if desired. The
“Enable” checkbox must be checked for autosampler control to be enabled.
figure 15.1 Marathon Autosampler Setup Dialog
While still in configuration and on the Sequence screen, enable the columns in the Sequence Table
that are desired for control of the autosampler. Typically the Vial Number column, Number of
injections per vial and volume(for the XT model) are enabled. See section 5 for general configuration
details. Figure 15.2 shows a typical Sequence Table. Note Figure 15.2 does not show an injection
volume column because the Marathon Basic model was configured in and it does not support
variable injection volume.
Figure 15.2 Typical Sequence Table For Autosampler Operation
243
Data Ally Chromatography Manager Operators Manual
15.1.2 Parameters which can be controlled on all Models
• Loop Fill Time
• Pre Flush Volume
• Needle Wash
Range is 1 to 999 seconds **
Range is 50* to 999 mL **
On or Off
*Preflush range is minimum of 50 mL when using variable injection volume, else 30 mL.
** Only one of these parameters should be used! If you are using the “Dispenser
controlled Injection” only fill in the Pre Flush Volume. (see discussion of modes below)
15.1.3 Parameters which apply to XT and Basic-Plus Models Only
• Variable Injection Volume
10 to 490 mL in 10 mL Steps (maximum of
50% of loop volume)
15.1.4 Connections Between Data Ally and Marathon
1. Locate the Serial Control Cable provided and connect the DB25 connector end to the
Marathon RS232 plug. Connect the other end to the autosampler control port of the Data
Ally System. For a Data Ally P1/P2 Interface Module, connect it to the port labeled SER 2.
For a Data Ally Personal System, connect it to the forth serial port connection. This is the top
port when the connector bracket is installed vertically in the computer chassis.
2. Locate the Inject Flag cable and connect the DB15 end to the Marathon XT I/O Control port.
Connect the other end to the S input on the Data Ally Interface Module or the S input of the
Data Ally Personal flag connector.
3. If the Marathon does not have a DB15 it may have a terminal strip. In the case of the
terminal strip type I/O control connector, use a standard Data Ally Flag cable and connect the
leads to the N.O. and COMM. positions of the CONTACT section of the Injection Marker.
15.1.5 Placing the Marathon in Remote Control Mode
• You must always manually place the autosampler into the Remote (Serial Control) mode by first
turning on the autosampler and then pressing the keys “F,4” The autosampler display should
show “Serial Mode”
• NOTE The Autosampler should always be ready prior to booting up the Data Ally software. If this
is forgotten, initialization commands will be missed. Should this happen, you may reset the Data
Ally Interface Module or press the reset button located on the rear edge of the Data Ally Personal
main PCB. This will cause the initialization commands to be re-transmitted to the autosampler.
15.1.6 Autosampler Sequence Control Issues
• It is necessary to configure the Data Ally Control Setup for either Marathon or Marathon-XT
autosampler control. Choose the Marathon-XT for either the XT or the Basic-Plus Model. These
models support variable injection volume.
• While in Data Ally Configuration, you may enable the Vial No. column so that you can perform
random vial number selection during a run. Also enable the number of injections column and
enable the autosampler enable check box in the top Sequence screen after clicking the
Autosampler button. NOTE: The maximum number of injections per vial in Data Ally is
limited to 9. This is due to the way file names are constructed from the sequence line and
injection numbers.
• When a Sequence is started, Data Ally waits for the autosampler to communicate and start
before the Method file is allowed to run. Should the autosampler send an error message to Data
Ally, you will be informed that the autosampler is not responding and to check the connections.
This error can be a result of invalid parameters. See the ranges listed above.
244
Data Ally Chromatography Manager Operators Manual
• Usually the method events table will be programmed to contain an S input flag at 0.10 minutes.
This allows any pump control to begin and hold until an injection contact closure is sent from the
autosampler.
15.1.7 Injection Modes
There are two mode of filling the injection loop. The first mode is the Dispenser Controlled Injection
mode. This mode uses the Digital Dispenser System pump. The second mode is the Pressure
Controlled Injection Mode. The latter mode requires Air pressure to operate.
15.1.8 Dispenser Controlled Injection Mode
1. Dispenser aspirates approximately 10 mL air bubble in the sample needle for
more efficient removal of the previous sample.
With the injection valve in inject position, the coaxial needle pair is inserted into
the sample. Air pressure, applied to the sample through the outer air needle,
ensures that no air or vapor bubbles are formed during sample withdrawal.
2. Dispenser withdraws “Pre Flush Volume” from sample vial to fill the sample line
with sample and to remove previous sample. (50--999 mL, programmed via the
sequence screen)
3. Injection valve switches into load position; dispenser transports 2 or 3 x loop
volume through the loop to fill the loop quantitatively, in case of flushed lop
injections.
4. Injection valve switches into inject position. Sample loop is now part of the
HPLC mobile phase flow path: sample is transported to the column. Analysis
time starts.
15.1.9 Pressure Controlled Injection
Requires Air pressure and uses the Loop Fill Time parameter to determine how long
the loop if filled. See the Marathon user’s manual section 2 for complete details.
Should you need further assistance, contact your distributor.
15.1.9 Marathon Error Codes
The table below list the Error Code and the Marathon Function associated with them as an aid to
solving any Errors reported during control the Autosampler via Data Ally.
Code
Function
107
Loop Volume
108
First Vial
110
Flush Time
111
PreFlush Volume
150
Vial Number
Notes
maximum of 50% of loop
volume
If you are using the
“Dispenser controlled
Injection” only fill in the Pre
Flush Volume
15.2 Kontron 460 Autosampler
The Kontron 460 family of autosamplers can be controlled by Data Ally. Parameters which can be
controlled are injection volume, needle wash, vial number selection and the number of injections per
vial (1 to 9)
245
Data Ally Chromatography Manager Operators Manual
15.2.1 Setting up the Kontron for Remote Control
In order for the Kontron autosampler to be controlled remotely by Data Ally, the baud rate setting
must be set for 9600 baud. This is accomplished by setting DIP SWITCH Position #8 to the ON
position inside the autosampler. Please review the instructions in the autosampler instruction manual
for details on how to set the DIP SWITCH.
Failure to set the baud rate properly will produce an error #3 on the autosampler display when control
is attempted.
15.2.2 Connections Between Data Ally and Kontron 460
1. Locate the Serial Control Cable provided and connect the DIN connector end to the Kontron
RS232 plug. Connect the other end to the autosampler control port of the Data Ally System.
For a Data Ally P1/P2 Interface Module, connect it to the port labeled SER 2. For a Data Ally
Personal System, connect it to the forth serial port connection. This is the top port when the
connector bracket is installed vertically in the computer chassis.
2. Locate a Flag cable and attach a proper connector to the other end to connect to the
connect the DB9 RELAY CONTROL port located on the autosampler. Use the REMOTE
CONTINUE contact positions #1 & #6. Connect the other end to the S input on the Data Ally
Interface Module or the S input of the Data Ally Personal flag connector.
15.2.3 Working with Kontron 460 Series Autosamplers
Data Ally provides control over the Kontron Autosampler via the Sequence mode of operation. In
order to control the Kontron, the Kontron control must be configured in by entering the configuration
mode and then adding the Kontron autosampler model to be controlled. Next while still in
configuration, you must go to the Sequence screen and click on the “Autosampler button”. This will
open the Autosampler setup dialog box, where default values can be entered if desired. The
“Enable” checkbox must be checked for autosampler control to be enabled.
figure 15.3 Kontron Autosampler Setup Dialog
While still in configuration and on the Sequence screen, enable the columns in the Sequence Table
that are desired for control of the autosampler. Typically the Vial Number column, Number of
injections per vial and volume are enabled. See section 5 for general configuration details. Figure
15.4 shows a typical Sequence Table.
246
Data Ally Chromatography Manager Operators Manual
figure 15.4 Typical Sequence Table For Autosampler Operation
15.2.4 Kontron Autosampler Sequence Control Issues
• It is necessary to configure the Data Ally Control Setup for Kontron 460 autosampler control.
Choose the Kontron 460 Autosampler Model from the ADD dialog while in
Utilities/Configuration/Setup mode.
• While in Data Ally Configuration, you may enable the Vial No. column so that you can perform
random vial number selection during a run. Also enable the number of injections column and
enable the autosampler enable check box in the top Sequence screen after clicking the
Autosampler button. NOTE: The maximum number of injections per vial in Data Ally is
limited to 9. This is due to the way file names are constructed from the sequence line and
injection numbers.
• When a Sequence is started, Data Ally waits for the autosampler to communicate and start
before the Method file is allowed to run. Should the autosampler send an error message to Data
Ally, you will be informed that the autosampler is not responding and to check the connections.
This error can be a result of invalid parameters.
• Usually the method events table will be programmed to contain an S input flag at 0.10 minutes.
This allows any pump control to begin and hold until an injection contact closure is sent from the
autosampler. This mode of synchronization requires a flag cable between the Data Ally S input
connection and the inject relay contact connector of the autosampler.
15.3 Detectors
15.3.1 General Instructions for connection of detectors to Data Ally
Detectors with analog outputs are connected to the PCP via the Detector Signals INPUT 1 and
INPUT 2 on the rear of the unit. On Data Ally Personal the connectors are located on the rear of the
Data Ally Personal card in the computer system.
Two cables with mini-phono plugs on one end and 'spade connectors' on the other end are supplied
with each PCP or Data Ally Personal board.
Tip: To Connect a Detector connect the spade connectors to the + and - integrator output of the
detector. This output may be marked 'Integrator' or '1 Volt'. Where possible avoid using the
10mv chart recorder output. Plug the RCA Phono plugs into INPUT 1 or INPUT 2 on the rear of
the PCP or board. Repeat for an additional detector on the same time base or second signal
from the same detector.
247
Data Ally Chromatography Manager Operators Manual
Warning: The voltage input range of Data Ally is 0 - 1 Volt. Do not connect a 10 Volt signal to the
PCP or board using standard cables. If a 10 Volt output is required then contact Axxiom
Chromatography or your dealer to obtain 0 - 10 Volt cables.
15.3.2 UV and Fluorescence Detector Control
Most UV and Fluorescence detectors are controlled in the same way regardless of the brand or
model. The number of possible control columns may vary depending on the detector.
Tip: To Program UV Detectors, In the 'Time' column of the Events Table enter the first time for
detector control followed by the Enter key. In the 'Command' column for the specific detector enter
the desired command and value.
See details on specific detectors for commands. These are:
Detector Command
Where x =
Meaning
ZEROx 0, 5, 10, 50,100 Zero to preset mv level
RESPx 0,1,2
Fast, Standard, Slow
RANGEx
0,,13
In the UV-Vis column enter the required Wavelength for detection for a UV detector.
Fluorescence detectors have a Em Wvlgth and Ex Wvlngth column for programming emission and
excitation wavelengths. If a wavelength change is required during the run, enter the time for the next
step and repeat step Repeat until the required commands are complete.
15.3.3 Controlling the Antec Decade Electrochemical Detector
Both Pulse and DC modes are supported.
• The detector is connected to SER1 on the PCP via a multi-colored cable to the RS232 port on
the rear of the unit.
• Check the Decade EPROM version for RS232 support option. (See the Decade manuals for
details) Contact your Decade dealer if you do not already have the RS232 support option
installed.
• The Decade Detector must be placed in the RS232 mode by pressing the F5 key on the Decade
front panel.
• The Decade may be run in DC Mode or Pulse Mode. The choice of mode is made in Data Ally
System Configuration and may only be changed if Data Ally is re-started.
Since most applications require only one mode, the decision on which mode to use may be made at
installation after which time it will remain the same.
The control of the detector is made through the Method Screen Events Table in which a number of
dedicated columns are displayed.
In order to control the Decade detector the Decade driver must be configured in by entering the
configuration mode in Data Ally. Choose either the DC or Pulse driver and then, while still in
configuration mode, go to the Method screen events table and enable the columns desired to control
the Decade detector. (See section 5 in the Data Ally User’s manual for general configuration details.
248
Data Ally Chromatography Manager Operators Manual
Below are the commands for the two modes:
Global Commands for either mode
Commands
INJECTx (Valve option)
RESETx (Resets time)
TEMPx (Sets oven temp)
MARK (Crashes comm!)
AUXx (Various outputs)
TCx (Time Constant Clamp)
KBx (Keyboard lock)
Cell Commands DC mode
OFFx (Offset %)
MVx (DC Cell Pot.)
FILTERx (Time Const.)
CELLx (On/Off)
PAx (Range)
NAx “
UAx “
Cell Commands Pulse Mode
OFFx (Offset %)
P1Tx (Pulse Time1)
P2Tx (Pulse Time2)
P3Tx (Pulse Time3)
STIMEx (Sample Time)
CELLx (On/Off)
PAx (Range)
NAx “
UAx “
P1MVx (Pulse Pot.)
P2MVx (Pulse Pot.)
P3MVx (Pulse Pot.)
Value
1=load, 2=inj.
1
00=off, else 15-60
1* Dangerous!
0, ?, 1111-2222
1=on, 2=off
1=locked, 2=not locked
Value
10-15(1=+), 20-25(2=-)
1000-1200(1=+), 2000-2200(2=-)
1-6 = 0.1-5
1=on, 2= off)
11-19= 10pA-5nA
21-29 = .1nA-50nA
31-39 = 10uA-5.0uA
Value
10-15(1=+), 20-25(2=-)
10-200
10-200
10-200
1-5 = 20, 40, 60, 80, 100 ms.
1=on, 2= off)
11-19= 10pA-5nA
21-29 = .1nA-50nA
31-39 = 10uA-5.0uA
1000-1200(1=+), 2000-2200(2=-)
1000-1200(1=+), 2000-2200(2=-)
1000-1200(1=+), 2000-2200(2=-)
15.3.4 Controlling the ESA Electrochemical Detector
The Coulochem is connected to COM1 on the PCP via a multi-colored cable to the RS232 port on the
rear of the unit. Before it can be used with Data Ally it is necessary to switch the detector to Remote
Communication Mode. To Switch the Coulochem to Remote Mode
1. Press the MODE button on the front panel of the detector.
2. Press the UP arrow key 4 times until 'SYSTEM MENUS' is shown in the display.
3. Press the Enter key.
4. Press the UP arrow key 4 times until 'ENTER
REMOTE COMMUNICATIONS MODE' is shown in the display.
5. Press the Enter key.
The detector will now be in Remote Mode and the green REMOTE light will show.
15.3.4.1 General Notes about Coulochem II Operation with Data Ally
Coulochem II may be run in DC Mode or Pulse Mode. The choice of mode is made in Data Ally
System Configuration and may only be changed if Data Ally is re-started. Since most applications
249
Data Ally Chromatography Manager Operators Manual
require only one mode, the decision on which mode to use may be made at installation after which
time it will remain the same.
The control of the detector is made through the Method Screen Events Table in which a number of
dedicated columns are displayed.
These are:
EC Cmd
Sends global commands which effect the whole detector, e.g. Autozero, Cell on
etc.
Guard
Sends commands which effect only the guard cell, e.g. Potential setting.
Anal #1 - #4
Send commands to each of 4 possible analytical electrodes.
Note: Only one command may be input on a single time line of the Events Table for the Coulochem.
If multiple events are programmed on a single line the detector may not be able to accept all of the
necessary codes sent to it.
15.3.4.2 Global Coulochem Commands
Global commands are programmed through the EC Cmd column in the Events Table. Global
commands may be used in both DC and Pulse detector modes.
The possible commands are:
CELL
Switches Analytical Cells in or out. Signals may only be measured when cells are placed in.
Command
Where x =
CELLx 0
Cells Out
1
Effect
Cells In
LOCAL Returns detector to local control. Once in local mode, the detector cannot be returned to
remote control except through the front panel.
Command Effect: LOCAL
Return to local
ZERO Sends an Autozero command to detector. No other commands will be accepted by the
detector during Autozero.
Command Effect: ZERO
Sends Autozero
RDCx Sends a run command to the detector using the currently defined DC parameters. This
command must be sent after all cell parameters have been set. NOTE: Failure to send
and RDC will result in the detector not running correctly.
Command
Where x =
Effect
RDC0 Puts detector into run.
15.3.4.3 Analytical Cell Commands - DC Mode
Analytical Cell commands are programmed through the ANAL#1 to ANAL#4 columns in the Events
Table.
The DC mode of operation is set through the system configuration. The possible commands are:
MV
MVx
Sets the analytical cell potential.
Command
Where x =
- 2000 to
Sets -2000mV
+2000 (any integer between)
250
Effect
Sets +2000mV
Data Ally Chromatography Manager Operators Manual
CU
Sets the full scale current.
Command
CUx
0
100pA
1
200pA
2
500pA
3
1nA
4
2nA
5
5nA
6
10nA
7
20nA
8
50nA
9
100nA
10
200nA
11
500nA
12
1 µA
13
2 µA
14
5 µA
15
10 µA
16
20 µA
17
50 µA
18
100 µA
Where x =
Effect
FILTER Sets the filter time constant
Command
Where x =
Effect
FILTERx
OFF
0
0.2sec
1
0.5sec
2
1.0sec
3
2.0sec
4
5.0sec
5
10.0sec
Sets the channel offset in %.
Command
OFFx
Where x =
Effect
-100 to Sets -100%
+100 (and any integer between) sets +100%
251
Data Ally Chromatography Manager Operators Manual
15.3.4.5 Analytical Cell Commands - Pulse Mode
In Pulse Mode, Analytical Cell commands are programmed through the ANAL#1 column in the
Events Table. The Pulse mode of operation is set through the system configuration. The Possible
Commands are:
PMV
Sets the analytical pulse potential E1.
Command
PMVx - 2000 to
Where x =
Sets -2000mV
+2000 (any integer between)
PMS
Effect
Sets +2000mV
Sets the analytical pulse duration T1.
Command
Where x =
Effect
PMSx 100 to (Sets 100msec)+1000(any integer between)
Sets 1000msec
PACQ Sets the analytical pulse acquisition delay. The acquisition delay must be between 60and the
value of the T1 parameter -10. E.g. if T1 above = 200msec then PACQ may be between 60 and
190msec.
Command
Where x =
Effect
PACQx 60 to (Sets 60msec) T1-10(any integer between) Sets T1-10msec
CMV
Sets the cleaning pulse potential E2.
Command
CMVx - 2000 to
Where x =
Sets -2000mV
+2000 (any integer between)
CMS
CMSx 10 to
Where x =
EMVx - 2000 to
Where x =
Effect
Sets -2000mV
+2000 (any integer between)
Sets +2000mV
Sets the equilibration pulse duration T3.
Command
EMSx 10 to
Where x =
Effect
Sets 10msec
+1000(any integer between)
Sets 1000msec
Sets the channel offset in %.
Command
OFFx
Sets 1000msec
Sets the equilibration pulse potential E3
Command
OFF
Effect
Sets 10 msec
+1000(any integer between)
EMS
Sets +2000mV
Sets the cleaning pulse duration T2
Command
EMV
Effect
Where x =
Effect
-100 to Sets -100%
+100 (and any integer between) sets +100%
252
Data Ally Chromatography Manager Operators Manual
15.3.4.6 Guard Cell Commands - DC Mode
Guard Cell commands are programmed through the Guard column in the Events Table.
The DC mode of operation is set through the system configuration. The possible commands are:
MV
MVx
Sets the Guard Cell potential.
Command
Where x =
- 2000 to
Sets -2000mV
+2000 (any integer between)
Effect
Sets +2000mV
15.3.4.7 Guard Cell Commands - Pulse Mode
Guard Cell commands are programmed through the Guard column in the Events Table.
The Pulse mode of operation is set through the system configuration. The possible commands are:
PMV
Sets the Guard Cell potential.
Command
PMVx - 2000 to
Where x =
Effect
Sets -2000mV
+2000 (any integer between)
Sets +2000mV
15.4 Photo Diode Array Detectors
Photo Diode Array Detectors and Rapid Scanning Detectors that emulate a Photo Diode Array
detector are controlled by Data Ally in the following manner.
1. The entire spectra scan is captured in a master PDF file.
2. One to four individual wavelengths are captured and saved in real time and are also displayed
on the upper window of the PDA graph screen as shown in Figure 15.5
3. The spectra plot is displayed in real time in the lower window of the PDA graph screen
4. The A4Purty.XLS template is provided for Peak Purity Reporting.
5. Special RS232 Windows drivers are employed, along with a 16550 compatible RS232 port to
ensure reliable data capture in Microsoft Windows.
Figure 15.5 Typical Data Ally PDA Graph Screen
253
Data Ally Chromatography Manager Operators Manual
15.4.1 General PDA Formulas used for Spectra, Similarity, and Purity Plots
In order to plot or graph the spectra and Peak Purity and to report the Similarity Index (0 to 1) the
following formulas are employed.
15.4.1.1 Spectra Display
Spectra are displayed at any given time in the lower graph window using the following formulas:
Sn = SR-S0
Where: Sn= Spectrum at time n
SR= Raw spectrum
S0= Spectrum at time zero
15.4.1.2 Similarity Index
The similarity index (SI) compares two spectra across the entire wavelength range of the captured
file. The search is performed using the following formulas:
(a (λ1),a (λ2),...,(a (λn))
Where:
a (λ1) is the absorbance at λ1
The representative vector is one spectrum per vector as follows:
S → = (a (λ1),a (λ2),...,(a (λn))
Since there are two spectra involved, S
Spectrum 2..
→
1 corresponds to Spectrum 1, and S→ 2 corresponds to
r
S 1 = (a1( λ1)(
, a1(λ2),..., (a1( λn)
r
S 2 = (a 2( λ1)(
, a 2( λ2),..., (a 2( λn)
The Similarity between two spectra is calculated as follows:
SI=
S
→
|S
1 x S→ 2
→
1|x| S→ 1|
= cos ∅
Peak Purity is determined using the average of Similarity of the Apex vs. the
Upslope spectra and the Apex vs. Downslope spectra. The spectra used to
calculate the purity index are as shown below:
Purity =
SI[Sa-SB]+SI[SA-SB][SD-SB]
2
Where:
SA = Apex spectrum
SB = Background spectrum
SC = Upslope spectrum
SD = Downslope spectrum
254
Data Ally Chromatography Manager Operators Manual
The Purity index value will range from zero to 1, with values nearer to 1 being more
pure.
15.4.1.3 Setting the Number of Peak Spectra
To set the number of Peak Spectra go the Integration Peak Table and enter a value indicating the
desired number of Peak Spectra (choice of 3,5,7 or 9 ). See Figure 15.6 below.
Figure 15.6 Integration Peak Table with Peak Spectra Column
15.4.1.4 Setting the Number of Real-Time Single Wavelength Channels
The number of individual wavelength channels may be set between one and four channels by
enabling the desired channels in the top level method screen. See Figure 15.7.
Figure 15.7 Top Level Method Screen for PDA with four individual channels available
15.5 LabAlliance Model 506 or Linear 206 UV/Vis Control Installation
Instructions
Data Ally Software Installation
1. Install the 3-disk set as usual.
2. Verify that the wcsccdrv.386 file is in the Data Ally directory.
255
Data Ally Chromatography Manager Operators Manual
3. Add the following lines to the [386Enh] section of the Windows System.Ini file
device=c:\data ally\wcsccdrv.386
WCSCInBufLen=65535
WCSCOutBufLen=1024
WCSCMaxPorts=10
4. Check the RS232 port number in the following section of the Data Ally.CFG file:
[sys.com]
Base=(1016, 760, 1000, 744)
IRQ=(4,3,4,3)
Port=2
NOTE: port=2 means comm2, port=1 means comm1, etc.
NOTE: The computer should have a 16550A or compatible serial port. Use MSD
diagnostic to verify the computer’s RS232 ports if you are not sure.
256
Data Ally Chromatography Manager Operators Manual
16 Data Ally System Security & Log On Feature
16.1.0 System Log On
When you first install Data Ally and boot up for the first time, the “Administrator” is prompted to enter his
name and password. Please make a note of the name and password used as it is not visible after it is entered
into the system.
Figure 1 System Security Startup Greeting Dialog
16.2.0 Adding Users
Once the Administrator has entered his or her name and password, proceed to the Utilities screen and Logon as
the Administrator. Then choose Edit Users. The Set Users dialog box will appear as shown in Figure 3. Click
on the Add button to add a new user and set the new user’s access levels.
Figure 2 System Security menu items Edit Users & Logon.
257
Data Ally Chromatography Manager Operators Manual
Figure 3 Set Users Dialog
When the Edit Users Dialog appears (see Figure 4) , you may fill in the User Name, Password, and other
information as appropriate. Note that the default access right codes are shown in the lower text window of the
Edit Users Dialog box. If you wish to change the access rights for the user you are editing, you would do so by
clicking on the Access button with the left mouse button.
Figure 4 Edit Users Dialog
258
Data Ally Chromatography Manager Operators Manual
Figure 5 User Access Rights Dialog
16.2.2 Setting Users Role
Choose an Access Domain by clicking on the item in the Domain List on the left. Next choose an Access
category for that Domain by clicking on an item in the Roles List on the Right. (Figure 6)
Figure 6 Set Access Role Dialog
259
Data Ally Chromatography Manager Operators Manual
Access Roles
The User has an assigned access role for each domain. This list is shown in order of minimum access to
maximum access role. Access Roles are as follows:
•
•
•
No Access The user has no access in this domain. The Softbutton action for that domain will be
disallowed.
Reader The user can only view documents or files in this domain.
Executor The user can specify documents in this domain.
Specific Domains
• Chromatogram
• The user can reprocess an existing chromatogram subject to other
access roles.
• Method
• The user can execute (start) an existing method.
• Integration
• The user can integrate (if they have appropriate chromatogram access).
• Calibrate Template
• The user can calibrate.
• Calibrate Curve
• The user can analyze unknowns based on the curve.
• Sequence
• The user can execute (start) existing sequences.
• Reports
• The user can print/show reports through excel.
• Author
• The user can create new documents in this domain.
• Specific Domains:
• Chromatogram
• The user can acquire new data files.
• Calibration Templates
• The user can create new calibration files.
• Calibration Curve
• The user can create a new curve and/or add calibrators to an
existing curve.
• Reports
• The user can create .XLS files.
• Editor
• The user can edit documents, subject to future auditing.
• Specific Domains
• Calibration Curve
• The user can modify an existing curve, including
enabling/disabling points.
• Manager
• The user can delete existing documents in this domain.
• The user can control/circumvent (future) auditing of this domain.
• Specific Domains
• Configuration
• The user can manage the user list.
• Example Users
• Administrator
260
Data Ally Chromatography Manager Operators Manual
• All Domains: Manager Access Role
• Lab Manager
• Configuration: Editor Access Role
• All Other Domains: Manager Access Role
• Methods Developer
• Configuration: No Access Role
• Chromatogram: Editor Access Role
• All Other Domains: Manager Access Role
• Lab Tech
• Configuration: No Access Role
• Chromatogram: Author Access Role
• Calibration Curve: Editor Access Role
• All Other Domains: Executor
Two additional features have been added to the System Security and Logon Features. The new features are
listed below:
1.
2.
Option to enable and disable requiring password and logon.
Default Button to set a particular user as the default user. What ever access rights the default user has been
provided by the Administrator, those are the access rights allowed while the default user is logged on.
261
Data Ally Chromatography Manager Operators Manual
17 Installation and Routine Troubleshooting
If difficulties are encountered during the installation process, check the following section for
guidelines to resolving the most common types of problems. If none of the suggestions below
applies or helps you complete a successful installation, contact your distributor for assistance.
17.1.0 Serial Mismatch Errors
A "serial mismatch" error occurs when the error message box appears during the initial bootup period
for the Data Ally software.
Serial mismatch indicates that one of the following situations has occurred:
• The software verifies that the Data Ally Data Ally Card installed in the PC has a different encoded
serial number and is thus not compatible.
• The software cannot for some reason locate the Data Ally Card even though it is physically
installed in the PC, so that no serial number match verification is possible.
• The PC has not found or recognized the special command device=c:\Data Ally\vptd.386 which
must be present in the Windows SYSTEM.INI file before Data Ally can be loaded.
If a Serial Mismatch error occurs, you must first confirm that both the Data Ally Card and Windows
have been installed correctly.
The Data Ally Card installed must not be damaged in any way, must be completely and properly
inserted into a 16-bit slot in the PC bus, and must have a serial number which matches the serial
number printed on your Data Ally software diskettes. To ensure that the card is mounted correctly,
turn the PC power OFF, open the computer and remove the Host Card from its position in the bus,
recheck the serial number if you have not already done so, and replace the card in a different slot
position, if one is available, taking care to firmly and fully insert the connectors on the card's bottom
into the slot. If another slot is not available, re-insert the card into the same slot position used
previously.
Before attempting to restart Data Ally, check the Windows SYSTEM.INI file as described in Section
17.1.4 above, if you have not already done so. You should also check the Virtual Memory
specification for the Windows swap file, as described in Section 17.1.4, since this may also affect the
PC's ability to load Data Ally. Once the correct Windows setup is verified, restart the computer as
described above and reinitialize Windows and Data Ally.
If the Serial Mismatch repeats, it is possible there may be an incompatibility between the I/O interrupt
settings and DMA channel settings used by other, non-Data Ally cards or interfaces in the PC and
those required by the Data Ally Data Ally Card. Data Ally uses the following settings:
Interrupts IRQ 10 and 11 (defaults)
DMA Channels 1 and 3
Two lines in the System.INI file in the [386Enh] section set the IRQs for Data Ally. Their default
values are:
VPTDTimerIRQ=10
VPTDCommIRQ=11
Should you need to change the IRQs, you may reposition the IRQ jumpers on the Host Adapter card
or Personal card to the new IRQ setting and edit the System.Ini file as needed.
262
Data Ally Chromatography Manager Operators Manual
In case of a serial mismatch not resolved as above, it is recommended that all cards, interfaces, and
subsystems on the PC be checked to verify that the interrupt and DMA channel numbers above are
not being utilized elsewhere. Reviewing the documentation for the PC and for other installed cards
and interfaces may be necessary to confirm such settings, which can also usually be determined by
observing the positions of jumpers or switches physically located on the PC's mother board or other
cards. In some instances it will be possible to disable the interrupt or DMA settings used by other
cards or devices, if they conflict with those used by Data Ally, or to reset them differently. YOU
SHOULD NOT RESET THE DMA SETTINGS AND JUMPERS ON THE Data Ally DATA ALLY
CARD. If there appears to be a conflict here, contact your distributor for assistance.
Another possible cause of Serial Mismatch is a "speed incompatibility" between the PC and the Data
Ally Data Ally Card. In certain cases, it may be possible to change the computer’s AT-Buss wait
states to compensate for such an effect. Contact your distributor for instructions before attempting
to make any such adjustments.
17.1.2 Other Startup Error Messages
It is possible that certain error messages other than Serial Mismatch will appear when attempting to
initialize the Data Ally system.
• General Protection Faults at start up are usually caused by faulty Graphic drivers or SCSI hard
disk set up problems.
• For Graphic driver problems, always try using the default Microsoft VGA or SVGA driver to see if
that clears up the problem.
• For SCSI hard disk problems check with the SCSI interface manufacturer to be sure that their
installation instructions have been followed and that you have their latest SCSI Windows driver
file installed. Usually there will be MS-DOS related setups as well for SCSI drives.
Note: In the USA you can check Microsoft Download Service at (206) 936-6735, using a modem, to
search for any driver file updates. This service is free except for the cost of the phone call. You can
search for categories such as printer drivers, graphic card drivers, etc.
This same service is available on the Internet at www.microsoft.com.
NOTE:: Do not assume that your computer does not suffer from these setup problems just because
you have not seen a problem. You must be sure that everything is correct, or your computer will
exhibit strange behavior when larger applications such as Data Ally are run.
17.1.3 Errors During Data Ally Operation
There are three types of errors which can be encountered during routine Data Ally operation. Each
type of error will elicit the appearance of a message box of a certain type on screen, regardless of
whether Data Ally is running in full screen mode, in a window, or "iconized".
Run Errors: A run error occurs when an unexpected condition occurs during operation. After a run
error, a message box will appear stating the type of error. Figure 17.9 shows an example of a
"Communications Error" dialog box which occurs when an attempt is made to start a Data Ally
Method when the Communications Processor connected to that time base is not powered or its cable
is disconnected.
NOTE: To clear such messages, press the reset button located on the rear edge of the circuit
board. This will cause the software to re-synch with the hardware.
263
Data Ally Chromatography Manager Operators Manual
Generally, these errors are "non-fatal" and operation will resume immediately after the message is
cleared - instructions are given in the message box concerning the probable cause of the error.
However, in some cases, the same message box will be repeated indefinitely, signifying a "semifatal" error which will prevent further normal operation. To clear this condition, exit the Data Ally
software in the normal manner, or reboot the computer using the CTRL+ALT+DEL command.
Figure 17.9 Communications Error Information Message
Page Faults: A "page fault" error occurs during certain types of operations related to DOS or
Windows functions, such as file logging or printing. Page Fault errors are usually "fatal" in that they
cause a permanent halt to normal Data Ally operation which cannot be remedied by simply clearing
the displayed error message box. If Page Fault errors persist, the DOS and Windows setup
commands detailed in the above sections should be carefully reviewed to determine if all
recommendations are being followed.
Another potential cause of Page Faults or General Protection Faults occurs on certain computers not
compatible with driver commands, associated with Western Digital disk controllers, often embedded
in the Windows SYSTEM.INI file. These commands are related to the "Use 32 Bit Disk Access"
check box command in the Virtual Memory setup. If Page Fault errors recur while Data Ally is
running, check the SYSTEM.INI file using Windows Notepad to determine if the two lines
"device=*int13" and "device=*wdctrl" are present (Figure 17.10).
264
Data Ally Chromatography Manager Operators Manual
Figure 17.10 Removing Driver Lines in SYSTEM.INI File
If present, disable both lines as in Figure 17.10 by typing a semicolon (;) character at the beginning of
each line. When finished, resave the modified SYSTEM.INI file before exiting.
After disabling these driver lines, use the Windows Control Panel subprogram to "uncheck" the "Use
32 Bit Disk Access" check box.
Reboot the computer after making these changes and initialize Data Ally to determine if the Page
Fault errors still persist. Other possible causes of Page Faults are incorrect network software driver
setup and improper CONFIG.SYS files.
General Protection Faults: These faults appear in the form of a message box when a condition
occurs in Windows/DOS which prevents the system from proceeding. In the event of a General
Protection error, the Data Ally software will become nonfunctional, and the CTRL+ALT+DEL
command must be used to quit Data Ally. This command will usually not affect other Windows or
DOS applications which may be running concurrently with Data Ally.
General Protection faults may be caused by the same factors which elicit Page Fault errors, by timing
problems in Windows, or by excessive memory use by any application.
Printer Problems: These are almost always caused either by using the improper printer driver in
Windows or by faulty printer drivers. Emulating other printers by choosing the wrong driver file in
Windows can cause graphics to drop out. The proper driver for the brand and model of printer
should always be used. The latest version of the driver should be obtained either from the printer
manufacturer or Microsoft Download or the Internet. Using older drivers with bugs can cause many
problems, including General Protection faults.
265