1
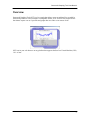
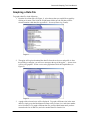
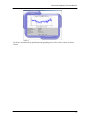
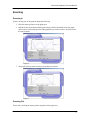
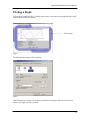
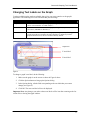
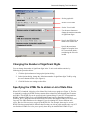
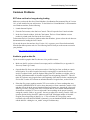
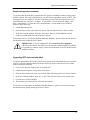
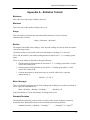
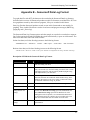
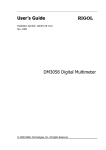
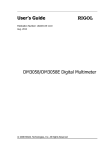
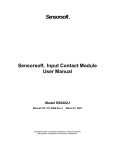
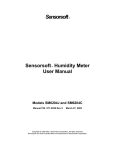
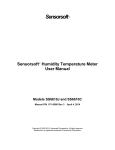
Sensorsoft Sensorsoft Graphing Tool User Manual Manual P/N 071-0073 Rev 3 July 26, 2005 Copyright © 2002-2005 Sensorsoft Corporation, All rights reserved. Sensorsoft, Remote Watchman, and Alert are trademarks of Sensorsoft Corporation. Table of Contents About This Manual ........................................................................................................................... 4 Glossary of Acronyms ...................................................................................................................... 4 Overview .......................................................................................................................................... 5 System Requirements for Running SGT.......................................................................................... 6 Specifications of SGT....................................................................................................................... 6 Graphing a Data File ........................................................................................................................ 7 Zooming ........................................................................................................................................... 9 Zooming In ............................................................................................................................... 9 Zooming Out............................................................................................................................. 9 Printing a Graph ............................................................................................................................. 10 Changing Text Labels on the Graph .............................................................................................. 11 Changing the Number of Significant Digits .................................................................................... 12 Specifying the HTML file to obtain a List of Data Files .................................................................. 12 Tolerable Irregular Lines at Beginning of Data Files...................................................................... 13 Common Problems ........................................................................................................................ 14 SGT does not load or hangs during loading........................................................................... 14 Unable to graph a data file ..................................................................................................... 14 Graph line appears scrambled ............................................................................................... 15 Upgrading SGT does not take effect...................................................................................... 15 Getting Help ................................................................................................................................... 16 Technical Support .................................................................................................................. 16 Appendix A – Statistics Tutorial ..................................................................................................... 17 Maximum ................................................................................................................................ 17 Minimum ................................................................................................................................. 17 Range ..................................................................................................................................... 17 Median.................................................................................................................................... 17 Mean (Average)...................................................................................................................... 17 Standard Deviation................................................................................................................. 17 Duty Cycle .............................................................................................................................. 18 Appendix B – Sensorsoft Data Log Format ................................................................................... 19 Scalar Readings ..................................................................................................................... 20 Boolean Readings .................................................................................................................. 20 Sensorsoft Graphing Tool User Manual About This Manual This documentation contains information about configuring, using and troubleshooting the Sensorsoft Graphing Tool (SGT). When other sections of this manual are referenced, Italics are used. Glossary of Acronyms RWME – Remote Watchman Enterprise software SGT – Sensorsoft Graphing Tool applet software HTML – Hypertext Markup Language URL – Universal Resource Locator TCP/IP – Transmission Control Protocol / Internet Protocol RAM – Random Access Memory SSA – Sensorsoft Alert OS – Operating System VM – Virtual Machine 4 Sensorsoft Graphing Tool User Manual Overview Sensorsoft Graphing Tool (SGT) is a Java applet that allows you to graph data files recorded by Sensorsoft products or files recorded in a compatible format. SGT is a first class analytical tool that almost anyone can use. It profiles and graphs data in as little as two mouse clicks. SGT runs in your web browser on any platform that supports the Sun Java Virtual Machine (VM) 1.4.1 or later. 5 Sensorsoft Graphing Tool User Manual System Requirements for Running SGT OS: Any operating system that supports the Sun Java Virtual Machine (VM) 1.4.1 or later RAM: 128 MB Minimum Graphics Screen Resolution: 1024 × 768 pixels TCP/IP LAN or Internet connection is required Web Browser: Microsoft Internet Explorer or Mozilla Firefox with Sun Java Virtual Machine, Plug-in Version 1.4.1 or later Specifications of SGT Graph type: Line graph Number of records that can be graphed: Tested with 10 million records Maximum data value that can be graphed: 9 × 10¹⁵ Minimum data value that can be graphed: -9 × 10¹⁵ Statistics for scalar series: maximum, minimum, range, median, mean (average) and standard deviation Statistics for Boolean series: duty cycle Statistical precision: User selectable; 3 to 10 significant digits Minimum time between readings to cause a break in line graph: 90 minutes 6 Sensorsoft Graphing Tool User Manual Graphing a Data File To graph a data file, do the following: 1. From the list of data files (see Figure 1), select the one that you would like to graph by clicking on its name. Then click the Graph button. Make sure the file that you have selected contains valid data (See Appendix B – Sensorsoft Data Log Format). Figure 1 2. The applet will begin to download the data file from the web server and profile it. Once the profiling is complete, you will see a message at the top of the applet: “…please select a series to be graphed”. Select a series to be graphed and click the Graph button (see Figure 2). Figure 2 3. A graph of the selected series will be displayed. To graph a different series in the same data file, simply press the Back button to return to the previous view, and select another series from the list. To graph a different data file, press the Back button until you have returned to the list of data files, and select another data file from the list. 7 Sensorsoft Graphing Tool User Manual Figure 3 If you have encountered any problems during graphing, please refer to the Common Problems section. 8 Sensorsoft Graphing Tool User Manual Zooming Zooming In Zoom in on any part of the graph by doing the following: 1. Place the mouse pointer over the graph area. 2. Hold down the mouse button and drag the mouse pointer horizontally across the graph until you have selected the portion of the graph that you want to zoom in on, then release the mouse button. Figure 4 3. The graph will now zoom in on the portion that you selected. Figure 5 Zooming Out Zoom out by clicking the mouse pointer anywhere on the graph area. 9 Sensorsoft Graphing Tool User Manual Printing a Graph You can print a graph in SGT by clicking on the printer icon located on the right hand side of the graph as shown in Figure 6 below. Click to print Figure 6 The Print Options window will now appear: Figure 7 In the Print Options window, set the paper orientation to Landscape, and then click the Print button. The graph will now be printed. 10 Sensorsoft Graphing Tool User Manual Changing Text Labels on the Graph Certain text labels on the graph are editable, thus giving you some control over the graph’s appearance. The following is a list of text labels that you can change. Name Description Graph title This text is located at the top of the graph (see Figure 8). By default, it is set to “Series <series number> of <URL or Port>”. X-Axis label This text is located at the bottom of the graph (see Figure 8). By default, it is set to “Date/Time (MM:DD:YY hh:mm:ss)”. Y-Axis label This text is located at the very left of the graph (see Figure 8). If you have graphed a scalar series this text would be the unit of measure, by default. If you have graphed a Boolean series, this text would be blank by default. Graph title Y-Axis label X-Axis label Figure 8 To change a graph’s text label, do the following: 1. Make sure the graph is on the screen as shown in Figure 8 above. 2. Click the Options button to bring up the Options dialog. 3. In the Options dialog, edit the field corresponding to the text label that you want to change (see Figure 9). 4. Click OK. The new text label will now be displayed. Important Note: Any changes you make to these text labels will be lost after returning to the list of data files or closing the applet window. 11 Sensorsoft Graphing Tool User Manual Set the graph title Set the X-Axis label Set the Y-Axis label Use the arrow buttons to change the maximum number of significant digits Specify the HTML file to obtain a list of data files Specify the maximum number of irregular lines SGT can tolerate before considering the file to be invalid Figure 9 Changing the Number of Significant Digits You can change the number of significant digits in the Y-Axis scale and the statistics by following the procedure below: 1. Click the Options button to bring up the Options dialog. 2. In the Options dialog, change the “Maximum number of significant digits” field by using the arrow buttons beside it (see Figure 9). 3. Click OK for the new setting to take effect. Specifying the HTML file to obtain a List of Data Files When SGT is launched, it displays a list of data files for the user to graph (see Figure 1). This list is obtained by reading an HTML file that contains links to data files and extracting the file names and URLs. This HTML file can be specified in the Options dialog. If your SGT is integrated into RWME, then the HTML file is set to RWME1000041.html, and you should never change it. Similarly, SGT is integrated into the Sensorsoft Alert (SSA) unit and the HTML file is set to read /logs.asp. This URL should never be changed. If you are running SGT from a different web server, then it will be necessary to specify the HTML file. For example, there may be several HTML files that contain links to different data files that you wish to graph, and the only way SGT can find these HTML files is for you to specify them. Keep in mind that the HTML file you 12 Sensorsoft Graphing Tool User Manual specify must exist on the same host as SGT in order for SGT to be able to access it. You can specify the HTML file by doing the following: 1. Click the Options button to bring up the Options dialog. 2. In the Options dialog, set the “HTML file to obtain list of data files” field to the URL of the HTML file (see Figure 9). 3. Click OK. If an error message appears on the screen, it means that the HTML file you have specified is on a different host name or does not exist at all. 4. Go to the list of data files. 5. Press the Refresh button. The new list of data files will now be shown on the screen. If the applet does not show any data files, it means the HTML file you have specified does not contain links to any data files. Tolerable Irregular Lines at Beginning of Data Files Data files that can be graphed by SGT must follow the Sensorsoft Data Log Format (see Appendix B – Sensorsoft Data Log Format). Any line in a data file that does not conform to this format is considered to be an irregular line. SGT will tolerate a certain number of irregular lines at the beginning of a data file before considering the file to be invalid. If you need to graph a data file that is valid but also contains many irregular lines at the beginning, you can increase the number of irregular lines that SGT will tolerate by doing the following: 1. Click the Options button to bring up the Options dialog. 2. In the Options dialog, set the “Maximum number of tolerable irregular lines at beginning of data file” field to a higher value (see Figure 9). You can make SGT tolerate an unlimited number of irregular lines by setting this field to -1. 3. Click OK for the new setting to take effect. 13 Sensorsoft Graphing Tool User Manual Common Problems SGT does not load or hangs during loading Make sure you have the Sun Java Virtual Machine (Java Runtime Environment) Plug-in Version 1.4.1 or later installed in your web browser. To check the Java Virtual Machine’s version number on a Windows machine, do the following: 1. Launch Internet Explorer. 2. From the Tools menu, select Sun Java Console. This will open the Java Console window. 3. In the Java Console window, click the Clear button. The Java Virtual Machine version number is printed on the first line in the Java Console. To determine the Java Version on platforms other than Windows, please refer to the web browser documentation for loading the Java Console. If your web browser does not have Java Version 1.4.1 or greater, you will need to download it from the Sun Microsystems web site. The following link will lead you to the current version for your platform: http://java.sun.com/getjava/download.html Unable to graph a data file If you are unable to graph a data file, there are a few possible reasons: • Make sure the file you have selected is not empty and is a valid data file (see Appendix B – Sensorsoft Data Log Format). • Open the data file from your web browser and see if the first few lines are blank or contain invalid entries. If so, these irregular lines may be causing SGT to consider the file to be invalid. To adjust for this, open the Options dialog from SGT and then set a higher value in the field “Maximum number of tolerable irregular lines at beginning of data file”. This will make SGT tolerate more irregular lines at the beginning of the data file before considering the file invalid. To make SGT tolerate an unlimited number of irregular lines, set the field to -1. • If the data file you are graphing contains TCP server socket or Camera readings that were recorded by RWME build 45 or earlier, these data entries will not contain the <model> field, and thus will not be in the proper Sensorsoft Data Log Format (see Appendix B – Sensorsoft Data Log Format). This may cause SGT to consider the file to be invalid. RWME Build 46 forward does record the TCP server socket and Camera readings in the proper format by setting the <model> field to “no_model”. One way to adjust for a missing <model> field is to open the Options dialog from SGT and then set the field “Maximum number of tolerable irregular lines at beginning of data file” to -1. This will make SGT skip all the entries recorded by the older build of RWME. Alternately, you can shutdown RWME and manually edit the data file - adding the “no_model” string to each data entry. 14 Sensorsoft Graphing Tool User Manual Graph line appears scrambled If you notice that any data that you graph with SGT appears scrambled or broken in many places and this behavior was not previously noticed, you will need to upgrade the version of SGT. This can happen if you are using SGT Version 1.0 Build 64 or earlier, and your web browser’s Java Virtual Machine has Version 1.5 or higher. To check SGT’s version and build number, click SGT’s About button. To check the Java Virtual Machine’s version number on a Windows machine, do the following: 1. Launch Internet Explorer. 2. From the Tools menu, select Sun Java Console. This will open the Java Console window. 3. In the Java Console window, click the Clear button. The Java Virtual Machine version number is printed on the first line in the Java Console. To determine the Java Version on platforms other than Windows, please refer to the web browser documentation for loading the Java Console. IMPORTANT - If you are loading SGT from a Sensorsoft Alert appliance (SSA7001, SSA7004 or SSA7008) you can solve the scrambled graph line problem by upgrading its software image. Consult your Sensorsoft Alert User Manual for the upgrade procedure. Upgrading SGT does not take effect If you have upgraded the SGT or the software that contains SGT and find that the previous build of SGT is still being launched instead of the new build, you need to clear the Java class loader cache by doing the following: 1. Close all web browser windows that are running SGT. 2. Launch Internet Explorer, and go to the Tools menu. 3. From the Tools menus select Sun Java Console. This will bring up the Java Console window. 4. In the Java Console window, press the <x> key. This will clear the Java class loader cache. 5. Close the Java Console Window. 6. The next time you launch SGT it will be the newer build. To clear the Java class loader on platforms other than Windows, please refer to the web browser documentation for opening and using the Java Console. 15 Sensorsoft Graphing Tool User Manual Getting Help Technical Support Should you have problems using the Sensorsoft Graphing Tool we offer technical support to help you overcome your difficulties. Sensorsoft Corporation does not provide free support to those wishing to write their own software; this is available on a charge-per-incident basis only. Please contact support for current rates. Before contacting Sensorsoft Technical Support: Go through the Common Problems section of this manual. Even if a direct answer to your question is not found there, it will be helpful for the support technician if you are able to provide information obtained from the diagnostic and troubleshooting process. Please ensure the problem is directly related to the Sensorsoft Graphing Tool software. World Wide Web: E-mail: http://www.sensorsoft.com [email protected] 16 Sensorsoft Graphing Tool User Manual Appendix A – Statistics Tutorial Maximum This is the value of the largest reading in the series. Minimum This is the value of the smallest reading in the series. Range This is the difference between the maximum and the minimum. It can be expressed mathematically as follows: Range = Maximum – Minimum Median The median is the middle most reading by value when the readings are lined up from the smallest value to the largest value. To find the median, you first need to know the total number of readings, N, in the series. If N is odd, the median is the smallest reading that has no more than (N – 1) / 2 readings greater than it. If N is even, the median is obtained by doing the following: 1. Find the smallest reading that has no more than N / 2 – 1 readings greater than it. Let the value of this reading be A. 2. Find the smallest reading that has no more than N / 2 readings greater than it. Let the value of this reading be B. 3. Calculate the median by taking the average of A and B, which can be expressed mathematically as: Median = (A + B) / 2 Mean (Average) This is calculated by taking the sum of all the readings and dividing by the number of readings. It can be expressed mathematically as: Mean = (Reading1 + Reading2 + Reading3 + ………… + ReadingN) / N In the formula above, N is the total number of readings in the series. Standard Deviation The standard deviation tells you how closely or widely all the various readings are clustered around the mean. Standard deviation can be calculated by the following formula: Standard Deviation = ((Reading12 + Reading22 + ………… + ReadingN2) / N – Mean2)1/2 17 Sensorsoft Graphing Tool User Manual In the formula above, N is the total number of readings in the series. Duty Cycle In a Boolean series, each reading can have one of two possible string values. Each string value represents a Boolean state. The duty cycle is always expressed in the form of a percentage followed by the Boolean state string, for example: 5.76% PWR_FAIL This means that 5.76 percent of all the readings in the series have the string value of “PWR_FAIL”. In general, the duty cycle is equal to the number of readings that have the indicated string value divided by the total number of readings in the series. 18 Sensorsoft Graphing Tool User Manual Appendix B – Sensorsoft Data Log Format To graph data files with SGT, the data must be recorded in the Sensorsoft Data Log format as described in this section. All Sensorsoft products use this file format to record data files. SGT can also graph data created by other software programs, if they are recorded in this format. Some log files that Sensorsoft products record, are not in this format and are not suitable for graphing. These include files that are used to record errors and progress messages (SMTP.log, paging.log and *_Errors.log). The Sensorsoft Data Log Format requires each data sample or record to be recorded on a separate line. It also requires that each field within the record be delimited by a space or tab character. The table below describes each of the fields in detail. Scalar class data (see Scalar Readings) must use the following format: <MM-DD-YYYY> <hh:mm:ss> <model> <URL or port> <scalar value> <unit of measure> Boolean class data (see Boolean Readings) must use the following format: <MM-DD-YYYY> <hh:mm:ss> <model> <URL or port> <Boolean zero string/Boolean one string> <Boolean value string> Description of Fields in the Sensorsoft Data Log Format: Field Class Description <MM-DD-YYYY> All This field contains the month (MM), day (DD), and year (YYYY) when the reading was taken. <hh:mm:ss> All This field contains the hour (hh) (in 24 hour format), minutes (mm), and seconds (ss) when the reading was taken. SGT is aware of daylight saving time, and can properly handle daylight saving clock adjustments in your data files. <model> All If the reading is taken from a Sensorsoft device or a Sensorsoft Alert unit, this field will contain the model number string. If the reading is taken from a TCP server socket or a Network camera this field will contain the string “no_model”. <scalar value> Scalar This field contains the numerical value of the reading. <unit of measure> Scalar This field contains the reading’s unit of measure. <Boolean zero string/Boolean one string> Boolean This field contains the two possible Boolean strings separated by a forward slash. Boolean zero string represents the Boolean zero value; Boolean one string represents the Boolean one value. Although this field is optional, it is recommended. Inclusion of this field allows the SGT to display the two possible states even when the recorded data does not contain one of the states. <Boolean value string> Boolean This field contains the value of the Boolean reading in string representation. 19 Sensorsoft Graphing Tool User Manual Scalar Readings Scalar readings have numerical values that are continuous in nature. Examples of such readings are temperature and humidity. Most scalar readings also require a Unit of Measure. Boolean Readings Boolean readings are represented by a string, which can have only two possible states. An example of such readings is the output of a Sensorsoft Flooding Sensor, which can be either “WET” or “DRY”. 20