1
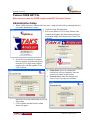
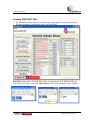
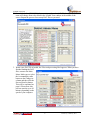
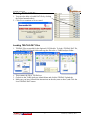
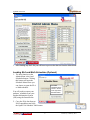
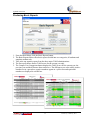
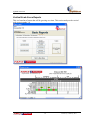
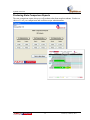
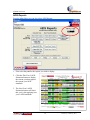
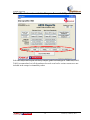
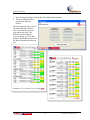
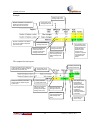
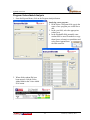
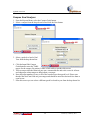
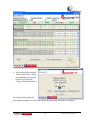
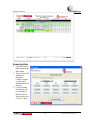
Setup and operations
instructions for TAKS
Analyzer.
Produced by:
TAKS Analyzer
Setup and User Manual
Table of Contents
Pearson TAKS DAT File ............................................................................................................. 2
Administrative Setup ................................................................................................................... 2
Loading TAKS DAT Files....................................................................................................... 3
Deleting TAKS DAT Files ...................................................................................................... 5
Loading TELPAS DAT Files................................................................................................... 5
Loading ELA and Math Schedules (Optional) ........................................................................ 6
Changing the Admin Password................................................................................................ 7
Entering or changing district information................................................................................ 7
Link Table Manager................................................................................................................. 8
Main Menu............................................................................................................................... 9
Administration ......................................................................................................................... 9
Producing Reports...................................................................................................................... 10
Producing Basic Reports........................................................................................................ 11
Vertical Scale Score Reports ................................................................................................. 12
Producing State Comparison Reports .................................................................................... 13
AEIS Reports ......................................................................................................................... 14
District or Campus Gate-up or Ratings Manual Override ..................................................... 15
Needed for Ratings (This Feature is currently disabled) ....................................................... 17
List of Students not counted in Campus Accountability ....................................................... 19
Value-Added Reports............................................................................................................. 20
Step 2 – Secondary Teachers Weighted Value-added by Course.......................................... 20
Step 3 – Standard Deviation .................................................................................................. 20
Program Value-Added Analysis ............................................................................................ 23
Campus Goal Analyzer .......................................................................................................... 24
Exporting Data ....................................................................................................................... 26
Updated 03/22/2011
Pearson TAKS DAT File
Make sure you order the FIXED Length format DAT file from Pearson.
Administrative Setup
1. When TAKS Analyzer is launched the first time, a setup wizard walks you through the first
part of the administrative setup.
2. Click the Setup Wizard button.
3. Fill in your district’s TEA County-District code
(without the hyphen), the district name and paste
in a bitmap image of the district logo. Then click
Continue.
4. If you have any alternative campuses
that you want to exclude from reports,
enter the TEA 9 digit county-districtcampus code with the hyphens. Then
click Continue.
5. Stand alone: If you are running this
software on only one computer, enter the
network user name of that person.
6. Network users: Enter the network user
name of up to 5 people who will have
district-level security and be able to view all
district data.
7. Click Continue and the District Admin
Menu will appear.
2
© 2008 Larry J. McHaney, Ph.D.
Updated 03/22/2011
Loading TAKS DAT Files
1. The Admin Menu allows the user to perform one-time setup or occasional data updates.
The most frequently used function is the Load TAKS DAT.
BEFORE clicking the Load TAKS DAT button, you must locate the TAKS DAT file you
want to load and copy it to the C:\TAKSAnalyzer folder. Then rename the file to TAKS.txt.
3
© 2008 Larry J. McHaney, Ph.D.
Updated 03/22/2011
2. Now click the Load TAKS Disk button to import the selected TAKS data. The DAT file
name will change from red to black in the Loaded Tests window in the middle of the
screen. Repeat the process for as many DAT files as you need.
3. When a new DAT file is loaded, the Files need processing label appears. When you have
finished loading the DAT
files, return to the Main
Menu. Make sure to select
the Accountability radio
button on the Change set
column and then click the
Process Data Set button.
This will be explained on
page 8. Please note: this
process can take up to 10
minutes depending on the
speed of your computer.
4
© 2008 Larry J. McHaney, Ph.D.
Updated 03/22/2011
Deleting TAKS DAT Files
1. You can also delete a loaded DAT file by clicking
the Delete button beside it.
2. Click Yes to continue or No to cancel.
Loading TELPAS DAT Files
1. TELPAS Files are needed for the Optional AYP Module. To load a TELPAS DAT file,
open the TELPAS Zipped folder and copy the file to the c:\TAKSAnalyzer folder.
2. Then rename the file to TELPAS.txt.
3. Go back to the TAKS Analyzer Admin Menu and click the TELPAS Upload tab.
4. Make sure you have followed the instructions on the tab (same as above) and Click the
Load TELPAS DAT button.
5
© 2008 Larry J. McHaney, Ph.D.
Updated 03/22/2011
5. After loading any DAT file you will have to process the data set from the Main Menu..
Loading ELA and Math Schedules (Optional)
1. The next function on the
Admin Menu is the Load
Schedules button. Clicking
this button will open the
Schedule Menu where you
can choose to open the ELA
or Math schedule.
All loaded
schedules will be
shown in the list
to the right of the
Schedule Menu.
You will need to extract your
students’ schedules from your
Student Information System
(SIS) using the format below.
2. Copy the ELA data from an
Excel spreadsheet and click
the Open ELA Schedule Table button.
6
© 2008 Larry J. McHaney, Ph.D.
Updated 03/22/2011
3. Click on the Edit Menu and select Paste Append to enter the data into the table.
4. Repeat this process for the math schedule data.
Teacher ID
number & name
Course number
Note: Be careful not to let leading 0’s get dropped from your data when you load it into your
spreadsheet.
Changing the Admin Password
1. Click the Change Admin
Password button to create
a new password.
Entering or changing district information
1. These are the same setting you already made in the startup wizard. To modify district
settings, click the District Information button to customize the TAKS Analyzer screens and
reports with the district name and logo.
7
© 2008 Larry J. McHaney, Ph.D.
Updated 03/22/2011
2. Fill in the six digit
county-district number in the District ID blank and the district name in its field. Copy and
paste a bitmap district logo in the logo field.
3. Enter the 9 digit county-district-campus code for each alternative campus that is not
included in the standard AEIS rating system.
4. Stand alone: In the District Level Security area, add the primary user’s network user
name.
5. Important for campus reports to work: In the lower right portion of the screen, you
should see your campuses listed. If no campuses are listed and you have already loaded at
least one April DAT file, click the load campuses button and campuses should then appear
in the form.
6. You can also edit the campus names since the DAT file truncates them.
7. Network users: Add the network user name for up to 5 people who can have district level
security to see all campus data.
8. Network Users: You can also add security for up to 2 campus user names per campus.
Link Table Manager
Refer to the network setup guide for information on this feature.
8
© 2008 Larry J. McHaney, Ph.D.
Updated 03/22/2011
Main Menu
1. After setup, click the Main Menu button return to the Main Menu.
Administration
2. Click the Administration button to perform setup, administration, and customization for
your school district.
3. The admin password screen will
appear. Enter the initial password
pass) and click the
(which is
Submit button.
9
© 2008 Larry J. McHaney, Ph.D.
Updated 03/22/2011
Producing Reports
Before producing reports, be sure you have accurately loaded all TAKS DAT files and be sure
the files have been processed. If the message “Files need processing” appears as below, your
reports may not be complete or accurate. Select the Test Type and Language or the
Accountability button (calculates the accountability subset for each year) or All Test Types
(Includes all test types for all years like the 2011 accountability set to do a 2011 Apple-toApples comparison), or TAKS and TAKS Acc. (Calculates all years like 2009 accountability to
do a 2009 Apple-to-Apples comparison) No Task-Acc. (Removes TAKS Acc to do a 2007
Apple-to-Apples comparison). After making the selection, click the Process Data button.
Note: If the area around the Process Data Set button is red, you must process the files because
either a new DAT file has been loaded and needs to be processed or you have selected a new
data set which is different from the currently loaded data set.
1. At the Main Menu, select a year from the list. The year selected will be used as the current
year in the reports.
The Loaded TAKS Data window gives a detailed list of which TAKS disks are loaded and how
many student records are in each disk.
10
© 2008 Larry J. McHaney, Ph.D.
Updated 03/22/2011
Producing Basic Reports
1. From the Main Menu, click the Basic Reports button.
2. The Basic Reports Menu offers basic reports divided into two categories, all students and
snapshot students only.
3. Tabs at the top separate reports from the three major TAKS administrations.
4. The first report shows district TAKS scores for the current year only.
5. The Campus Year Comparison button displays the TAKS scores for the current year, the
previous year and the difference between the two. The differences are color coded: positive
numbers are in a green box, negative numbers appear in a yellow box and equivalent
numbers are displayed in a white box.
11
© 2008 Larry J. McHaney, Ph.D.
Updated 03/22/2011
Vertical Scale Score Reports
This is a brand new feature that will be growing over time. This section analyzes the vertical
scale score in grade 3-8.
12
© 2008 Larry J. McHaney, Ph.D.
Updated 03/22/2011
Producing State Comparison Reports
The state comparison reports always use all students rather than snapshot students. You have a
choice of 1 or 4 year comparisons and at all three major administrations.
13
© 2008 Larry J. McHaney, Ph.D.
Updated 03/22/2011
AEIS Reports
From the Main Menu you can also select AEIS Reports.
1. First select the year for the reports you wish to display.
2. Click the This Year’s AEIS
Estimation button to display
the current year data against
the current year AEIS
standards.
3. The Next Year’s AEIS
Estimation button will show
this year’s data applying next
year’s AEIS standards.
14
© 2008 Larry J. McHaney, Ph.D.
Updated 03/22/2011
4. The 2 Year AEIS District or
Campus Comparison displays
two consecutive years of AEIS
scores and color codes the
change between the two years.
5. The List of students not
counted in the Accountability
subset buttons, create a report
showing every student on the
DAT file that was not used
when calculating campus
accountability.
District or Campus Gate-up or Ratings Manual Override
TEA allows districts and campuses to “Gate-up” their accountability rating through exceptions
and required improvement (See the TEA Accountability Manual). If your campuses or district
qualifies for this “gate-up,” you may override the calculation by following the procedure
below.
1. At the AEIS Reports Menu, click on either the District or Campus Manual Rating Override
button.
15
© 2008 Larry J. McHaney, Ph.D.
Updated 03/22/2011
2. First select the year.
3. When your campuses appear, you can select a rating for the specific campuses you believe
will “gate-up” based on exceptions or required improvement.
4. When you have made all of the appropriate modifications, close the AEIS Gate-Up screen
and click the Selected Year’s AEIS Estimation. Your overrides should appear on the report.
5. Now when you run the Campus or District AEIS Estimation report, your “gated-up” rating
will appear with an asterisk beside it. In the example below the African American subgroup
16
© 2008 Larry J. McHaney, Ph.D.
Updated 03/22/2011
in Math did not meet the Exemplary standard of 90%, but because the campus qualified for
an exception and the score was above the floor (minimum score needed to receive an
exception), the campus was able to “gate-up” to exemplary.
Needed for Ratings (This Feature is currently disabled)
These reports show how many more students you would need to have pass to achieve the
desired AEIS rating.
The purpose of these reports is to show how many more students on each test and by subgroup
need to pass to achieve each AEIS rating. There is an overall district report, a by grade level
report and a by campus report.
17
© 2008 Larry J. McHaney, Ph.D.
Updated 03/22/2011
The reports under the Selected Year heading, present the selected year data compared to the
selected year AEIS standards. The reports under the Next Year Standards, show the selected
year’s data compared to the selected year +1 standard (i.e. 2008 AEIS results to the 2009
standards). These reports show how many more students will need to pass at the district,
campus or grade level to meet the AEIS rating standards in the coming year.
The top section of this report shows the AEIS scores, the number of students tested who count
on AEIS and the number of students who passed for each subject and subgroup.
The lower section shows in yellow how many more students would need to pass to achieve the
associated rating on the left. Numbers in green show how many more students passed than was
required to reach that rating.
18
© 2008 Larry J. McHaney, Ph.D.
Updated 03/22/2011
List of Students not counted in Campus Accountability
Select the subject and a report will list by campus, grade level and type of TAKS test (TAKS,
TAKS Accommodated, etc) all the students who took a test but for various reasons were not
included in the campus accountability subset.
19
© 2008 Larry J. McHaney, Ph.D.
Updated 03/22/2011
Value-Added Reports
The TAKS Analyzer value-added analysis uses a 2 year cohort comparative analysis.
Cohort: This means that students must have two consecutive years of data on the same type of
test. Only students who took the TAKS in the district both last year and the current year are
used in this analysis. Only reading and math can be analyzed using this method because they
are tested every year (grades 3-11). This analysis uses the students’ scale score from the first
administration.
Comparative: The class or campus average scale score from the previous year is calculated
and compare to the current year scale score average. Example: If a class of 4th graders had an
average scale score of 2150 in grade three and in grade 4 they had an average scale score of
2200, their apparent growth would be 50 scale points. But the 4th grade test may be relatively
easier than the 3rd grade test. So the only way to determine real growth is to compare the
growth of these students to a larger population (either the district or state growth on the same
tests). Then the growth of the district or the state average scale score from both years are
compared the change of the class average for that subject and grade level. Example: If the state
change average scale score for the 4th grade was 2180 for the current year and the 3rd grade
average scale score last year was 2160 then the state gained 20 points while the class above
gained 50 points so the comparative value add for the class is a positive 30 points compared to
the state average.
Step 2 – Secondary Teachers Weighted Value-added by Course
When teachers teach more than one course in the same subject (i.e. Geometry and Algebra I) or
they have students in the same course from more than one grade level, they will get more than
one value-added score. So to create a single score for that teacher, we us a weighted value-add
calculation. We take the value-added score and multiply it by the number of students (i.e. 22 x
125 = 2750) and if that teacher also teaches a section of Pre-AP English I with 30 students and
the comparative value-add score for this class is 10 (10 x 30 = 300). We then sum the valueadd scores and divide by the total number of students ( [2750 + 300]/[125+30] = 3150/155 =
20.32 weighted value-add)
Step 3 – Standard Deviation
Lastly we take the weighted value-add scores of all teachers and calculate the distribution
characteristics (mean and standard deviation). This calculation creates a single standard teacher
score.
20
© 2008 Larry J. McHaney, Ph.D.
Updated 03/22/2011
1. From the Reports Menu, click on the Value-Added Menu button.
2. There are Math and ELA
reports from which to
choose.
The first report provides a list of
all cohort students with their
scale score from the previous
year and current year. The
difference between the two
scores is shown as well as that
student’s standard deviation from
the district mean on the selected
test.
21
© 2008 Larry J. McHaney, Ph.D.
Updated 03/22/2011
Example:
Previous year cohort
average scale score.
Current year cohort
average scale score.
Number of students in this teacher’s
classes who took the TAKS in
district last year and this year.
Number of students in this district
who took the TAKS in district last
year and this year.
Current year district
average scale score.
Difference between the
current year cohort
average and the district
average scale score.
Previous year district
average scale score.
Difference between the
cohort average and the
district average scale
score.
This teacher’s class
started 50 below the
district average and
ended 28 points
below the district
average which
equates to a positive
22 point value-add
compared to the
district.
The compared to state report:
Number of students in the grade level
at this campus who took the TAKS in
district last year and this year.
Number of students in Texas who
took the TAKS in district last year
and this year.
Previous year cohort
average scale score.
Current year cohort
average scale score.
Current year state
average scale score.
Difference between the
current year cohort
average and the state
average scale score.
Previous year state
average scale score.
Difference between the
cohort average and the
state average scale
score.
22
This campus grade
level started 15
above the state
average and ended
51 points below the
state average which
equates to a
negative 66 point
value-add compared
to the state.
Value-Add score
for this course.
© 2008 Larry J. McHaney, Ph.D.
Updated 03/22/2011
Program Value-Added Analysis
1. From the Reports Menu, click on the Program Analysis button.
Analyzing a new program:
2. In the Select a Program field, type in the
name of new program you would like to
add.
3. In the year field, select the appropriate
school-year.
4. In the StudentID field, manually enter
student SSN or state ID numbers or copy
them from a column in a spreadsheet and
select Paste Append from
the Edit menu bar.
5. When all the student IDs have
been entered, click the ValueAdded Math or the Value-Added
ELA button.
23
© 2008 Larry J. McHaney, Ph.D.
Updated 03/22/2011
Campus Goal Analyzer
1. From the Reports Menu, select the Campus Goals button.
2. Select a campus from the drop-down list and click the Next button.
3. Select a grade level and a Goal
Year from the drop-down lists.
4. Click the Input/Edit Campus
Goals button to enter the TAKS
targets for the campus. Be patient. It takes a little while to produce this screen.
5. This screen provides the historical pass rate, commended rate and scale scores for all tests
and subgroups at that campus to help inform your target
6. Enter the target numbers for any or all of the tested areas at that grade level. Please note
that the Met and Com fields are percentages and should be entered as decimals less than or
equal to one.
7. From this screen you can select a different grade level and/or year from the drop-down list.
24
© 2008 Larry J. McHaney, Ph.D.
Updated 03/22/2011
8. After tests have been loaded
from the .DAT files, campus
goal attainment can be easily
reported by clicking the
Campus Goals Report button.
For each goal/target input for
that campus and grade level, this report shows the goals attained and those not attained.
25
© 2008 Larry J. McHaney, Ph.D.
Updated 03/22/2011
Exporting Data
1. Click the Export
Data button on the
Main Menu.
2. You can select All
Students or
Snapshot;
Campus, District,
or State; and 3
administrations on
the tabs.
3. Click the button
and the data will
be exported to a
Microsoft Excel
format on the root
of your C:\ drive.
26
© 2008 Larry J. McHaney, Ph.D.