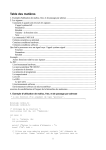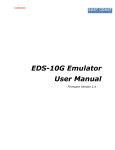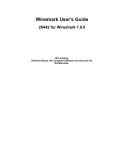
1
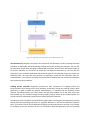
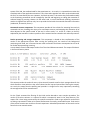
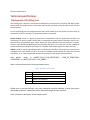
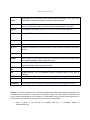
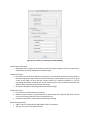
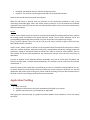
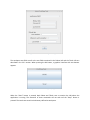
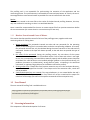
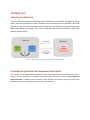
Profiling tool Prototype architecture In Figure 1 the communication of profiling tool in physical level is described. During the profiling phase, both the application on virtual machine and the profiling tool are hosted in the same physical environment and it should be ensured that does not interfere with monitoring results (taken form Pidstat and Tshark). This is why, traffic (through artificial workload) is sent from another Physical Host 2. Figure 1: The communication of profiling tool in physical level Prototype Architecture and components description In this section, all the implemented components of the tool are described (in a conceptual level). Also a diagram of the architecture of components that build up the prototype is shown in Error! Reference source not found.. In addition, every component’s class diagram is presented in order to provide a more detailed analysis over the specific decisions of the implementation. Figure 2: Implemented components of the Application Tool User Interface (UI) component provides a user interface for the developer in order to manage the whole procedure of application and benchmarking profiling. During the profiling tool execution, the user will be asked to fill specific fields providing the demanded parameters. Some of them will be the number of the process identifier for the VM to be tested (the VM with the benchmarks or the one with the application), user credentials (username and password), paths for the start/stop scripts that control the workload traffic, the total time and iterations of application testing and the workspace (path for produced data). User interface, facilitates the communication between the user and the tool and makes their interaction quick and direct. Profiling process controller component provides the basic mechanism for handling control and synchronization issues among all the tasks executing concurrently during the profiling process. More specifically, in order to obtain the desired measurements, it is essential that the executing virtual machine, the Pidstat process, the Tshark process and the result collector run at the same time in the best possible way. So, instead of having the user manually trying to control all the involved parties, the process controller automatically supervises the whole experiment execution. An important issue is that there are two different usage modes of profiling tool (the application profiling and the benchmark profiling) and there is a significant difference in the level of automation between them. The reason is that in case of application profiling, the information given to the tool is very limited. For example, prior to the execution, there is no information about the application type, the operating system of the VM, the workload used for the experiment etc. As a result, it is impossible to monitor the start/stop tasks of the application execution. Thus, these tasks together with their synchronization with the tool, are controlled by the user. However, the whole process is a lot easier than performed manually as the monitoring commands are still managed by the tool and beginning or ending their execution is achieved simply by pressing a button. On the other hand, in case of benchmark profiling, automation reaches its highest level and user only has to provide the tool with the essential execution information (credentials, Process IDs, IPs etc.). Commands executor component: This component provides all the utilities for executing linux and ssh commands via Java, handling their input, error and output streams, and stopping their execution all of them adjusted to the specific needs of the tool. In other words, it is serves as a library to be fully exploited by the controller in order to perform all the essential actions related to ssh and unix processes. Results processing and storage component: This component is related to the transformation of the results in the appropriate format. After running the profiling tool, the results of the background monitoring tools used, are in formats that are rather convenient for human consumption but not at all for further data processing or storing. In more detail, the tool reads output results from Tshark and Pidstat commands. The output of Pidstat is in the form shown in picture This output provides the results for every t (time interval) seconds as well as their average values for the whole execution time (which are the actual values that are kept and stored after filtering the output). As a result, the output that the profiling tool provides is a single line for every experiment, containing the average values of the measurements. For the Tshark command the filtering of the initial results demands a more complex procedure. The results of Tshark are written in a capture file which is temporarily saved in the /tmp directory. This capture file is then being processed via the capinfos command in order to get statistical results which are being re-processed in order to be filtered and become of an easily processable format. Final version of the results contains two result lines for each experiment. A detailed presentation of the results can be found in the user manual section. Technical specifications Technical specifications Deployment of Profiling tool The Profiling tool is written in Java and was developed in the Eclipse IDE. The Swing and AWT toolkits were used for the graphical user environment and the JSch (Java Secure channel) was used for the SSH implementation. For the monitoring task two background tools were used: Pidstat (from the Sysstat suit) and Tshark (a command line tool for wireshark). A general description is presented: Sysstat- Pidstat Sysstat is a group of simple Linux command-line tools for performance analysis and monitoring. The version is used is 10.0.5 and it is responsible to collect system information, store it for a period of time, and calculate mean values, letting you query individual system parameters at specific times for more flexible troubleshooting. The tools work well with cron so that you can take readings of system performance at predefined intervals for a flexible, customizable approach to data collection. Pidstat is used for monitoring individual tasks via PID (process identifier). These tasks are currently being managed by the Linux kernel. Its role is to write the standard output activities for every task selected with option –p. In order to profile the tasks we are interested in, we use the command below: sudo pidstat –urdw –p <INSERT_PID_OF_VM_PROCESSSES> <DURATION> >> <INSERT_OUUTPUT_FILE_NAME> <TIME_OF_ITERATIONS> Table 1 contains a description of the parameters used. Table 1: Parameters used in Pidstat Options -u -r -d -w Description Report CPU utilization Reports pages faults and memory utilization Report I/O statistics Total number of voluntary context switches Pidstat runs in root environment, thus user credentials must be available. As with every other demanded parameter, credentials will be obtained through the user interface. Table 2 presents a description of the output results. Table 2 Results from Pidstat Percentage of CPU utilization that occurred while executing at the user level (application). Includes time spent running virtual processors. %user %system %guest Percentage of CPU utilization that occurred while executing at the system level (kernel). Includes time spent servicing hardware and software interrupts Percentage of time spent by the CPU or CPUs to run a virtual processor. %CPU average CPU for the time defined by the interval parameter CPU Processor number to which the task is attached kB_rd/s kB_wr/s Number of kilobytes the task has caused to be read from disk per second Number of kilobytes the task has caused, or shall cause to be written to disk per second. kB_ccwr/s Number of kilobytes whose writing to disk has been cancelled by the task. minflt/s Total number of minor faults the task has made per second, those which have not required loading a memory page from disk majflt/s Total number of major faults the task has made per second, those which have required loading a memory page from disk VSZ Virtual The virtual memory usage of entire task in kilobytes Size RSS Resident Set Size: The non-swapped physical memory used by the task in kilobytes %MEM The tasks's currently used share of available physical memory cswch/s Total number of voluntary context switches per second nvcswch/s Total number of non-voluntary context switches the task made per second Tshark: is a terminal oriented version of Wireshark designed for capturing and displaying packets when an interactive user interface isn't necessary or available. It supports the same options as wireshark and lets you capture packet data from a live network, or read packets from a previously saved capture file. In order to profile the tasks we are interested in, we use the commands below: sudo -S tshark -f “ip and (dst net <INSERT THE IP>)” -i <ETHERNET CARD> -w /tmp/tsharkDst.cap sudo -S tshark -f “ip and (src net <INSERT THE IP>)” -i w /tmp/tsharkSrc.cap By sudo capinfos /tmp/<filename.cap> Tshark captures information with regard to the number of packets and the average packet size and rate. Different options of Tshark command in Table 3: Table 3 Tshark command options -S separator -f capture filter -i capture interface -w outfile dst destination src source Delivery and usage of Profiling Tool Package information The file structure of the delivery package is shown in Figure 3: <ETHERNET CARD> - Figure 3: File structure of the package Profiling Tool Prerequisites: The Profiling Tool is designed for linux operating systems (with graphical environment for supporting the GUI of the tool). Java and SSH should be pre-installed. The Sysstat Suit and the tshark and wireshark packages should be pre-installed. The .jar file containing all executable classes, as well as the essential libraries, is an executable jar file and as a result, no further steps for installing the tool are to be made. However, as far as the preparation for the execution is concerned, the user must implement the following steps: Ensure that the profiling tool, as well as the VM to be monitored running on the same physical host. Ensure that the OS user running the profiling tool is in the sudoers list, and as a result, has the privileges of running commands as sudoer. Ensure that the sudoers flag requiretty is not set for the OS of the physical host. If this flag is set, sudo commands will not be executed unless a real tty is used for logging in. Normally this flag is set by default and can be unset by modifying the corresponding line in the /etc/sudoers file. Create a directory in the file-system to be used as workspace. Inside this directory create a subdirectory called tmp which will be used to store temporarily the output of the tshark command. If the tool is going to be used for benchmark profiling some additional steps should be made as far as the preparation of the Virtual Machine is concerned: Install SSH and make sure that connection from the IP of the physical host will be allowed. Ensure that the OS user account which will be used during the ssh connection, is in the sudoers list of the OS of the VM. Ensure that the sudoers flag is not set for the OS of the VM. Benchmarks Profiling Prerequisites: Using the profiling tool for benchmarks profiling requires the existence of a file (located anywhere in the file-system of the physical host) containing the commands used for executing the workloads of a benchmark. This file will be referred to as input file. Each command must be stored in a different row inside this file. Execution: 1. Open a terminal 2. Navigate to the directory where the executable ProfilingTool.jar is located. 3. Type the command: java -jar ProfilingTool.jar benchmarks After typing the command (step 3) a graphical interface appears which introduces a form with empty text fields. Figure 4: User Interface of Profiling Tool for Benchmarking Specification of the fields: Workspace path: The path to the directory to be used as the workspace of the tool. Note that a subdirectory called tmp should exist inside workspace. Pidstat Info Group: Process ID: Process ID of the VM to be monitored. It is an identifier assigned to each process by the Operating System and can be retrieved by filtering the command ps aux (e.g ps aux | grep <name of the VM>). Be sure that the correct process ID is entered. Otherwise, in case of misreading the pidstat command will not be executed and in case of confusion between two different PIDs, the wrong process will be monitored. password: Password for executing pidstat with sudo privileges. TShark Info Group: IP to monitor: IP of the VM to be monitored. Ethernet card to monitor: The ethernet card on which tshark will capture traffic. Note that the name of the card provided will refer to the physical host. password: Password for executing tshark with sudo privileges. Benchmark Info Group: VM IP: The IP of the Benchmark VM (used for the ssh command) VM user: The user for the SSH command password: Password for the user used for the SSH command Input File: The input file containing the commands for the workload execution. Note: For files and directories full paths are accepted. When the OK button is pressed, both the execution of the benchmark workloads as well as the monitoring commands begin. When the whole process (execution of all the benchmark workloads contained in the input file) ends, the tool exits automatically and the results are stored in the directory defined as workspace. Results: Pidstat results: Pidstat results are stored in a tab separated values file named pidstat.txt which contains the average values calculated for the whole execution period. The 15 values displayed are for the corresponding pidstat output metrics which are (in the same order as provided in the results): %user, %system, %guest, %CPU, CPU, kB_rd/s, kB_wr/s, kB_ccwr/s, minflt/s, majflt/s, VSZ Virtual Size, RSS, %MEM, cswch/s, nvcswch/s TShark results: TShark results are stored in a tab separated values file named TShark.txt which contains values for: number of packets, data byte rate (bytes/s), average packet size (bytes), average packet rate (packets/s). Should be noted that TShark.txt contains two rows of results for each workload. The first one provides the TShark results captured for the monitored IP acting as source and the second one as destination. In order to separate results between different workloads, each row of results (both for pidstat and TShark) is written under a number (workload identifier). The number can have values from 0 to number of workloads - 1. Note: The names of the output files are specified by the tool, so it would be recommended for the user to remove output files from previous executions before the current execution. Otherwise, the tool will append the new results to the existing ones, which could be confusing if the user does not keep track of the order in which the profiling of each benchmark was executed. Application Profiling Execution: 1. Open a terminal 2. Navigate to the directory where the executable ProfilingTool.jar is located. 3. Type the command: java -jar ProfilingTool.jar application After typing the command (step 3) a graphical interface appears which introduces a form with empty text fields. Figure 5: User Interface of Profiling Tool for Application The workspace text field as well as the text fields contained in the Pidstat Info and the Tshark Info are described in the 3.3.2 section. When pressing the OK button, a graphical interface with two buttons appears. Figure 6: Buttons for controlling start/stop process When the “Start!” button is pressed, both Pidstat and TShark start to monitor the VM where the application is running. The execution of these commands will not end until the “Stop!” button is pressed. The results are stored in the directory defined as workspace. The profiling tool is not responsible for synchronizing the execution of the application and the monitoring process. The synchronization is achieved by the start and stop button. As a result, the user is encouraged to be as accurate and careful as possible so as not to interfere with the results. Results: The results are stored in the same files as the results of the benchmarks profiling. However, this time, only one workload is executing, so there is no workload identifier. Note: It would be recommended for the user to remove output files from previous executions before the current execution (Or rename them in a convenient way for later use). 1.1.1 Monitor Execution and Cases of Misuse This section describes possible reasons for failure of the profiling process, together with some monitoring advice for solving them. 1. Wrong password: The passwords inserted are sudo and user passwords for the operating system, so the Profiling Tool is not authorized to make the corresponding validation. As a result, the passwords inserted can only be validated during the actual execution of the sudo and ssh commands. Caution to the Caps Lock button pressed, as the tool does not provide this type of warning. 2. Exit value of the commands: During the profiling process, the exit values of the system commands executed are written in the standard output. If one of these exit values is not equal to zero, the corresponding command did not execute properly and the whole process should be reinitiated. This could be due to non-installed packages (pidstat or tshark and wireshark), ssh problems (connection or authorization), wrong directory paths, misspelling in the workload commands, or requiretty flag problems (see Installation Instructions section). 3. Existing output files: If output files from previous execution are still in the workspace directory, the new results will append to the older. If user keeps track of the execution order, results will still be parseable. 4. /path/to/workspace/tmp not created: If the tmp subdirectory is not created before the tool’s execution, the intermediate output files from TShark will not be created and the output file tshark.txt will be empty (Exit value of the capinfos commands will be not equal to zero). 1.2 User Manual The user manual of Profiling Tool is available online at: https://github.com/artist-project/ARTIST/tree/master/source/Tooling/migration/targetenvironment-specification/ProfilingTool 1.3 Licensing information This component is offered under Apache V2.0 license. 1.4 Download The ARTIST Profiling Tool first release is available in the GitHub in: https://github.com/artist-project/ARTIST-Tooling/tree/master/migration/target-environmentspecification. Download Profiling tool file which includes the executable jar and instructions. _