1
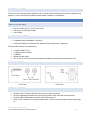
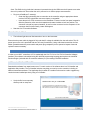
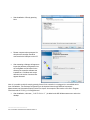
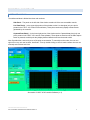
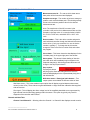
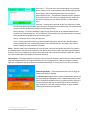
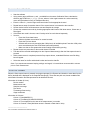
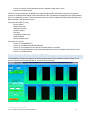
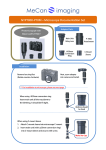
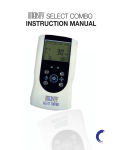
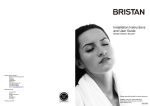
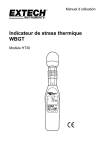
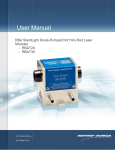
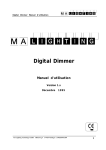
LOC--F OPTIICAL CON NTRO OLLER USER MA ANUAL AND D SOFTW ARE GUID DE Version 1.4 V CONTENTS 1. Safety ................................................................................................................................................................2 Laser Safety ..........................................................................................................................................................2 Electrical Safety ....................................................................................................................................................3 2. LOC-F Controller ...............................................................................................................................................3 What's in the Box ..................................................................................................................................................3 What Else is Needed.............................................................................................................................................3 Panel Diagrams.....................................................................................................................................................3 Getting Started ......................................................................................................................................................3 Troubleshooting ....................................................................................................................................................4 3. LOC-F Controller Software ................................................................................................................................4 Installing the Software ...........................................................................................................................................4 Description of Software .........................................................................................................................................7 Software Window...............................................................................................................................................7 Description of Controls ......................................................................................................................................8 Taking Measurements ........................................................................................................................................10 Data File Format .................................................................................................................................................10 Four channel version of the software ..................................................................................................................11 Troubleshooting ..................................................................................................................................................12 4. Analog and Digital Outputs (OPTIONAL) ........................................................................................................12 Panel Diagrams...................................................................................................................................................13 Software (v.1.2.3a) ..............................................................................................................................................13 1. SAFETY LASER SAFETY The LOC-F controller is an IEC 60825-1 Class 1 laser product meaning that it is intrinsically safe and does not pose a health hazard either to the skin or eyes. Wavelength Broadband LED output between 1500nm-1600nm Power < 5 mW _______________________ LOC-F Controller User Manual and Software Guide 1.4 2 ELECTRICAL SAFETY There are no user-serviceable parts inside the LOC-F controller and the instrument should not be opened by the operator. If you are experiencing problems, please contact Lenterra Inc. for assistance. 2. LOC-F CONTROLLER WHAT'S IN THE BOX LOC-F Controller (LOC-F-1CH or LOC-F-2CH) USB Type A to USB Type B Cable Power Cable WHAT ELSE IS NEEDED Compatible Lenterra RealShear™ sensor(s) A Microsoft Windows PC (Windows XP, Windows Vista, and Windows 7 supported) Recommended minimum PC Specifications: 1 available USB 2.0 Port 2.0 GHz processor or better 2 GB RAM 500 MB free disk space LOC-F-1CH or LOC-F-2CH Controller Software (available for download from www.lenterra.com) PANEL DIAGRAMS Front Panel Rear Panel GETTING STARTED Install the LOC-F Controller Software (see full step-by-step instructions). Plug the supplied power cable into the power entry module on the rear panel of the instrument. Plug the supplied USB cable into both the instrument and the PC. Power on the unit with the rear-mounted power switch. The blue front panel power indicator should light up. _______________________ LOC-F Controller User Manual and Software Guide 1.4 3 Note: The DAQ circuitry inside the instrument is powered through the USB bus and will operate even when the unit is powered off. Ensure that the unit is powered on to achieve proper measurements. Plug in the RealShear™ sensor(s): o Clean the fiber connectors prior to connection to the controller using an appropriate cleaner such as CLETOP optical fiber connector cleaner or compatible o Insert the pair of LC/PC connectors on the RealShear™ sensor into the front panel receptacle, slide the protective collar onto the receptacle and rotate clockwise to lock into position. The connector is keyed for proper orientation, do not force the connector into the receptacle. If the connector does not insert easily, rotate 180 degrees. Start the LOC-F Controller Software. TROUBLESHOOTING The indicator light does not illuminate when I turn on the instrument. Ensure that the power cable is plugged in fully and that AC voltage is available from the wall socket. The AC power input on the unit is protected with two 1A fuses (5mmx20mm). Using a flat-head screwdriver the fuse holder (located between the power switch and power plug receptacle) can be opened to inspect fuses and replace fuses as necessary. 3. LOC-F CONTROLLER SOFTWARE In order to use LOC-F controllers, a PC is needed with the LOC-F-1CH or LOC-F-2CH Controller Software installed. The software is developed using NI LabVIEW programming language and requires the LabVIEW Runtime Engine (included with the controller software) or a pre-existing LabVIEW installation. INSTALLING THE SOFTWARE Download the software from www.lenterra.com. For each version of the software there is a Full Installer and Application-Only Installer. The Full Installer includes everything you need to run the controller, including all National Instruments software. The Application-Only installer is a smaller file that can be used to upgrade any version that was installed previously using a Full Installer. Unzip the file into a temporary directory and run setup.exe. _______________________ LOC-F Controller User Manual and Software Guide 1.4 4 Choose destination directory for program files and press Next. Accept the National Instruments license agreement and press Next. Accept the Microsoft license agreement and press Next. _______________________ LOC-F Controller User Manual and Software Guide 1.4 5 Start installation of files by pressing Next. Restart computer when prompted. At this point the controller should be connected to the USB port on the PC. After restarting a dialogue will appear to import the hardware configuration from the configData.nce file located in the directory the controller software was installed into. Click Next and accept defaults in the series of screens that appear afterward. Note: It is possible to skip this step by pressing Cancel if the controller is not plugged in or unavailable at the time of installation. The hardware configuration can be imported later through National Instruments Measurement and Automation Explorer under File->Import. An example of the location of the file is 'Program Files\Lenterra\LOC-F-2CH_v1.3\configData.nce'. After installation, a shortcut (“LOC-F-1CH v1.3”) is added to the MS Windows start menu and on the desktop. _______________________ LOC-F Controller User Manual and Software Guide 1.4 6 DESCRIPTION OF SOFTWARE SOFTWARE WINDOW The software window is divided into three main sections: Side Panel – The panel on the left side of the window contains all of the user-accessible controls. Live Data Plot(s) – In the upper-right portion of the window are the Live data plots (only one plot is present in the LOC-F-1CH version of the software). These plots continuously display measurements generated by the controller. Captured Data Plot(s) – In the lower-right portion of the window are the Captured data plots (only one plot is present in the LOC-F-1CH version of the software). These plots are inactive until the Start capture button is pressed, at which point they display buffered data that can later be saved to disk. Note: By default the x-axes and y-axes of the plots are autoscaled. To manually set the scales, the user can right-click on any axis and uncheck “AutoScale.” Then by double-clicking on the tick mark numbers the user can manually enter desired axis limits. Screenshot of LOC-F-2CH Controller Software (v1.3) _______________________ LOC-F Controller User Manual and Software Guide 1.4 7 DESCRIPTION OF CONTROLS Measurement rate, Hz – The rate at which shear stress data points will be memorized and displayed. Samples to average – The number of points to average to produce each memorized data point. This should generally be set to the maximum possible value for the desired measurement rate. Note: The sample rate of the A/D converter in the controller is the product of the Measurement Rate and the Samples to Average value. It is currently limited to 24000 S/s in LOC-F-2CH units, and 48000 S/s in LOC-F-1CH units. Device number – This is the device number assigned to each individual controller through the National Instruments device driver. (If only one controller is in use, the device number is typically 1). To change the device number, change the value in the Device number field, and restart the program. Clear charts – This button clears the data displayed in the Live data plot(s) in the upper right part of the window. Start capture – This button initiates loading of data into the buffer which will immediately begin to appear in the Captured data plot(s). After being pressed the button will change to the Stop capture button. Stop capture – Pressing this button will bring up the Save data dialog which will save the buffered data displayed in the Captured data plot(s) into a tab-delimited file. Wall shear stress – Raw signal radio buttons – Two output options are available for different values of data: Wall shear stress – This is the standard output option that will display acquired data as shear stress values (in units of Pa). These values are generated based on Gage coefficient calibration data supplied with each sensor. Raw signal – This will display the direct voltage level of the amplified photodiode current generated by light returned from the fiber Bragg gratings within the sensor. This option is typically only used for diagnosis of the controller and/or sensor. Channel and Note Tabs Channel 1 and Channel 2 – Selecting either the Channel 1 or Channel 2 tabs displays several controls: _______________________ LOC-F Controller User Manual and Software Guide 1.4 8 Zero level, V – This is the zero level corresponding to a zero shear stress condition. It can be automatically generated by applying zero shear stress to the sensor and pressing the Find zero button. Gage coefficient, kPa – The calibration coefficient used to generate shear stress values. This number is supplied with each sensor and should be entered by the user before operation for each channel used. Find zero – Pressing this button will set the zero value at the current level of shear stress, typically done when the sensor is experiencing no shear stress. It is recommended to zero the sensor as often as is practical for maximum precision. Moving average – Check the checkbox to apply moving average filter to the captured data and show results on the Captured data plot. This checkbox will be active when the Stop capture button is pressed and captured data are displayed on the two bottom plots. Period – Parameter of the moving average filter. Save – Pressing this button will bring up the Save data dialog which will save the data with applied moving average filter from corresponding channel into a tab-delimited file. This button will be active when the Moving average checkbox is checked. Notes – Under this tab is a text field where the user can enter a text note during data acquisition. By pressing the Add Note button, the text will be entered into the data file in the column next to the data point generated at that time. This can be a handy way to document changes that may occur during experiment (flow rate, mixture, etc.) and correlate them with changes in the wall shear stress. Quit Program – Pressing this button will cause a clean exit from the software, and will write the various software parameters (Measurement rate, Gage coefficients, etc.) to a configuration file. When the program is started again this configuration data is accessed and entered automatically, so re-entry by the user is not necessary Measurement Delay – If the measurement rate is set too high, the software will display a warning: The Queue size displayed is the number of data points that have not been processed and displayed yet in the Capture data plot(s). If this queue exceeds the available memory, program execution will halt. If you are seeing this warning you should reduce the measurement rate. Installing on a PC with a faster processor or larger available RAM may also help with this problem. _______________________ LOC-F Controller User Manual and Software Guide 1.4 9 TAKING MEASUREMENTS Start the software Using sensor gage coefficients γ0 and γg available from the sensor Calibration Sheet, calculate the effective gage coefficient γ = γ0 +(γg -γ0)cosα, where α is the angle between the sensor sensitivity vector and gravitational vector (in downward direction) Enter the value for γ into the Gage coefficient window for the appropriate channel Repeat last two steps for another channel if the second sensor is connected to the controller Set the desired values for Measurement rate and Samples to average Choose the measurement mode by choosing appropriate radio button: Wall shear stress, Shear rate, or Raw signal If the Shear rate mode is chosen, enter Viscosity value for each channel separately Set zero: o Press the Clear charts button o Observe the data accumulation for several seconds o Press the Find zero button o Software will set zero by averaging last 1000 pints (or all available points if less than 1000 points were accumulated since the Cleat charts button was pressed) o Make sure that no flow passes the sensor floating element during zeroing Repeat the set zero procedure for the second channel if needed The data will be recorded and displayed on the Captured data screen(s) after the Start capture button is pressed When measurement is completed press the Stop capture button, a standard Windows save file dialog box will appear Select the name for the file and desired location and save the data file Note: if you repeat measurements keeping settings unchanged, it is nonetheless recommended to set zero prior to each measurement DATA FILE FORMAT When the Stop capture button is pressed, the program prompts for a filename and location to save data from the buffer (the data that is displayed on the Captured Data plot(s)). These files are plain text, human readable files with header information and data presented in tab delimited columns. Information in Header (8 Lines): Device number Measurement rate Samples to average Zero levels Timestamp of last zeroing Gage coefficients Information in Columns: Column 1: Date (MM/DD/YY) Column 2: Timestamp (HH:MM:SS.SSSSSS) Column 3: Time elapsed from the start of the measurement, in seconds Column 4: Channel 1 Data (Wall shear stress in Pascals or Raw data in Volts) _______________________ LOC-F Controller User Manual and Software Guide 1.4 10 Column 5: Channel 2 Data (Wall shear stress in Pascals or Raw data in Volts) Column 6: Inserted note text When the moving average filter is applied to the captured data and the Save button is pressed, the program prompts for a filename and location to save data from the buffer (the data that is displayed on the Captured Data plot for corresponding channel). These files are also plain text, human readable files with header information and data presented in tab delimited columns. Information in Header (7 Lines): Device number Measurement rate Samples to average Channel number Zero level Timestamp of last zeroing Gage coefficient Moving average period Information in Columns: Column 1: Date (MM/DD/YY) Column 2: Timestamp (HH:MM:SS.SSSSSS) Column 3: Time elapsed from the start of the measurement, in seconds Column 4: Data with applied moving average filter (Wall shear stress in Pascals or Raw data in Volts) Column 5: Inserted note text FOUR CHANNEL VERSION OF THE SOFTWARE The installation procedure and operation of the four channel version of the software is similar to those for one and two channel versions described above. The GUI may look like that . _______________________ LOC-F Controller User Manual and Software Guide 1.4 11 In addition to controls described above for the two channel version, the four channel software has a run time menu with the following options: Start capture – Selecting this menu item initiates loading the data into the buffer which and plotting it in the Captured data window(s). After being selected, Start capture caption changes to Stop capture. Selecting the Stop capture menu item brings up the Save data dialog which will save the buffered data displayed in the Captured data plot(s) into a tab-delimited file. Hide settings pane – Selecting this menu item will hide the left panel with the user-accessible controls and expand the plots to the full screen. The menu caption will change to Settings pane. To restore the panel with the controls select the “Setting pane” menu item. Channels – Selecting submenu items from the Channels menu will show plots only for the chosen channels. For example, selecting Channels -> Two channels -> Channels 2 & 4 will show two plots with data from channels 2 and 4. It is possible to select one, two, three or four channels at a time. View – Selecting submenu items from the View menu will show or hide the Live data and Captured data plots. For example, selecting View -> Captured data plots will hide the Live data plots and show only the Captured data plots. Stop – Selecting the Stop menu item will cause a clean exit from the software, and will write the various software parameters (Measurement rate, Gage coefficients, etc.) to a configuration file. When the program is started again this configuration data is accessed automatically, so re-entry by the user is not necessary TROUBLESHOOTING When I restart the program the settings are set to default values, not the values that were present before the program was last closed. The configuration file in which these settings are stored is saved in the software directory in Program Files. If the program is run by a user that does not have write privileges in this directory, the program will not be able to save these settings. Granting write privileges to the user for this directory, or running the program as Administrator can solve this problem. I have a sensor connected but the software is measuring a constant value even when varying shear stress is being applied. The DAQ circuitry inside the instrument is powered through the USB bus and will operate even when the unit is powered off. Ensure that the unit is powered on to achieve proper measurements. I have the program running but no data are shown on the Live data plots. If you have more than one controller (or installed another National Instruments DAQ cards) you should choose the Device number corresponding to the controller you use (by default it is 1). Enter new value in the Device number field, stop the program and start it again by pressing the button with an arrow located under the menu in the top left part of the program window. 4. ANALOG AND DIGITAL OUTPUTS (OPTIONAL) Optionally, LOC-F controller can include two digital and analog outputs for the measured signal. This option is indicated with an “a” in the controller type, such as a two channel controller with analog and digital outputs is identified as LOC-F-2CHa _______________________ LOC-F Controller User Manual and Software Guide 1.4 12 PANEL DIAGRAMS The outputs (labeled as AO 1, AO 2 and DO 1 and DO 2) are accommodated on the rear panel with four BNC connectors as shown in the figure. SOFTWARE (V.1.2.3A) Software version 1.2.3a enables the optional outputs. Installation is same, and GUI is similar to that described in Chapter 3 with a panel “Analog and digital outputs” added for each channel as shown in the figure below. Analog output generates a DC voltage level that is proportional to the measured wall shear stress. The output is controlled with two parameters: Conversion coefficient, V/Pa – The output voltage is equal to the product of the wall shear stress value and the conversion coefficient. The level ranges from 0 to +5 V. In practice, the value for the coefficient is chosen based on upper limit of the wall shear stress range of interest. For example, variation of stress between 0 and 100 Pa is expected, so a coefficient of 0.05 V/Pa will produce levels from 0 to +5 V. In this example, the wall shear stress exceeding 100 Pa will still generate 5 V, as well as negative shear stress will result in zero volt signal. Note that the analog outputs are disabled when “Shear rate” or “Raw signal” radio buttons are selected. Unipolar/bipolar output – In the unipolar output mode, the output is zero for zero or negative values of wall shear stress. In bipolar mode the analog output is offset by +2.5 V so that zero wall shear stress reads as +2.5 V and negative wall shear stress values generates voltage between +2.5 and zero volts. Digital output produces high TTL level when the measured wall shear stress exceeds the predetermined value entered into the control Threshold, Pa. The digital output will switch to the low TTL level when the measured wall shear stress falls below the threshold parameter multiplied by 0.95. The digital outputs are disabled when “Shear rate” or “Raw signal” radio buttons are selected. Make sure to select desired parameter values before starting the measurements. _______________________ LOC-F Controller User Manual and Software Guide 1.4 13 LOC-F OPTIC CAL CO ONTROLLER The LOC-F Optical T O Contrroller is desig gned for Lente erra's RealSh hear™ family of shear stresss sensors. Together T t they provide precision wall shear stresss and viscositty measureme ents for a wide range of ap pplications. A Applications s Scale e up of high-s shear mixer (H HSM) processses from the la aboratory to th he factory floo or Continuous monito oring of mixin ng operations to preve ent under/ove erprocessing Visco osity measure ement of flowiing or mixing fluids Charracterization of o multiphase// multicompon nent flowss (e.g. crude oil o extraction) Features nt rate to captture high frequ uency Fast measuremen odic effects an nd transients (up to 10 kHzz) perio USB interface with h remote PC LabV VIEW®-based remote softw ware to displayy real-time da ata and capture and save for f analysis (M Microsoft Wind dows® compattible) Sourcce code supp plied for user-customization n of software Simp ple turn-key op peration Available in 1 or 2 channel verssions (LOC-F-1CH and LO OC-F-2CH) S Specification ns Optical Channels (I/O Pairs): pe: Connector Typ Output Bandwiidth: 1, 2 or 4 (-1CH, -2CH or -4CH)) Se ealed Duplex LC L 15 500 nm - 1600 nm Data Electrical Voltage Requirements: R Power Rating: Analog Output O Range:** Digital Output:* Output update rate:* Physical Dimensio ons (WxDxH): Maximum Mea as. Rate: PC Interface: 10 0 kHz USB 2.0 Operating Temp.: T Storage Temp.: 100-120V, @ 47-63 Hz 12 W 0 to 5 V TTL 100 Hz 7.25 in. x 10.5 1 in. x 4 in. (18.4 cm x 26.7 cm x 10.2 cm) 7.25 in. x 14.5 1 in. x 4 in. ** (18.4 cm x 37 cm x 10.2 cm)** 50°F to 10 05°F (10°C to 40°C) 4 15°F to 10 05°F (-20°C to 40°C 4 ) * For controlle ers with optio onal digital and analog outp puts * For four ch ** hannel controlller Lente erra, Inc. 105 Lock St. Suite 301 0 USA Newark, NJ 07103 ©2012 Lenterra, Inc. © A rights rese All erved. 73.623.0755 97 www.lenterra.c w com Specification ns subject to change c withou ut notice. _ ___________ ___________ ___ LOC-F Controlle er User Manual and Software Guide 1.4 14 Notes: _______ _________ __________ __________ _________ __________ _________ __________ ____ _______ _________ __________ __________ _________ __________ _________ __________ ____ _______ _________ __________ __________ _________ __________ _________ __________ ____ _______ _________ __________ __________ _________ __________ _________ __________ ____ _______ _________ __________ __________ _________ __________ _________ __________ ____ _______ _________ __________ __________ _________ __________ _________ __________ ____