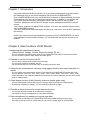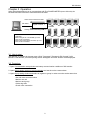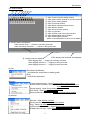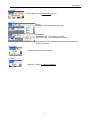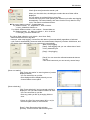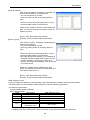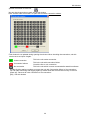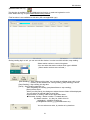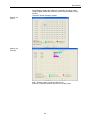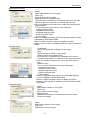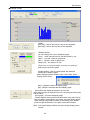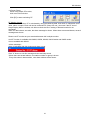
1
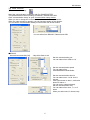
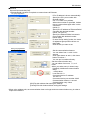
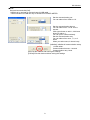
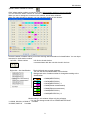
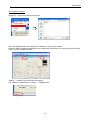
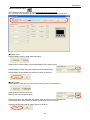
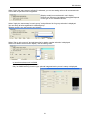
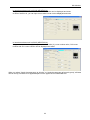
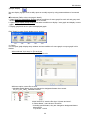
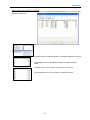
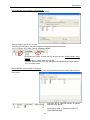
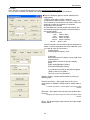
Eco-POWER METER
Data Collection Software KW Monitor
Operation Manual
Software version: KW Monitor V2.70
Issued on January 2014
Table of Contents
Chapter 1 Introduction .........................................................................................................1
Chapter 2 Main functions of KW Monitor .............................................................................1
Chapter 3 Operation ............................................................................................................2
3.1 How to start ............................................................................................................................. 2
3.2 Procedure ................................................................................................................................ 2
3.3 Main window............................................................................................................................ 3
3.4 Icons’ function.......................................................................................................................... 5
①Communication setup............................................................................................................. 5
②Select station number to connect ........................................................................................... 9
③Group setting .........................................................................................................................11
④Unit setup ............................................................................................................................. 13
⑤Reset measured value.......................................................................................................... 20
⑧Log........................................................................................................................................ 27
⑨Check connection to each unit ............................................................................................. 30
⑩KW8M Read Unit Log........................................................................................................... 31
⑪Graph Display....................................................................................................................... 32
<1>Setup .....................................................................................................................................32
<2>Graph ....................................................................................................................................35
<3>Demand .................................................................................................................................40
<4>Power Factor .........................................................................................................................41
<5> CSV Graph ...........................................................................................................................42
Chapter 4 Others ...............................................................................................................46
4.1 Operating Environment.......................................................................................................... 46
4.2 Execution requirement........................................................................................................... 46
4.3 Applicable model ................................................................................................................... 46
4.4 Display resolution .................................................................................................................. 46
4.5 Display color .......................................................................................................................... 46
4.6 Communication protocol........................................................................................................ 46
4.7 Cautions for use .................................................................................................................... 46
KW Monitor
Chapter 1 Introduction
Using this software KW Monitor allows you to set various settings and to log and monitor
the measured value of our simple wattmeter KW series Eco-POWER METER
(Eco-POWER METER from next) via RS485/232C converter or Ethernet/RS485 convertor.
Collected data (csv files) can be edited and saved by you. In addition, it can display and
save graph (daily and monthly) and simple monitor demand and PF with log data.
*However, please use demand and PF monitor as your standard because this is simple
monitor.
*KW monitor supports only MEWTOCOL protocol. You can’t use it with the other protocol
such as MODBUS protocol.
*We don’t recommend Web data logger unit (DLU) as a converter. We can NOT guarantee
the working.
Refer to the user's manual and installation instruction of Eco-POWER METER unit about
units' settings or communication settings. You can download the user's manual from our
website.
Chapter 2 Main functions of KW Monitor
1. Monitoring the measurement values
(Electric power, Voltage, Current, Electricity charge, PF etc.)
You can check each measurement value of Eco-POWER METER with PC screen at real time.
You can check the value of each station and each group.
2. Possible to set the unit setup with PC
You can set or change setting values for unit setup.
You can set the setup to measure with PC
It is convenient that you can do the setup to several units at one time.
3. Collecting the measurement values by using logging function and output data with csv
format.
You can collect the measurement values of connected Eco-POWER METER at selected cycle.
You can select a cycle from “1sec, 5sec, 10sec, 15sec, 30sec, 60sec, 1min, 5min, 10min, 15min,
30min and 60min” The collecting data can be saves as csv format, therefore you can use to make
graph or analysis data.
4. Graph display function (Daily, Monthly) makes to display graph easy.
You can make graph such as daily report or monthly report by using the collecting data.
By selecting conditions to display, you can make several kinds of graph.
5. Possible to demand control by simple demand function
You can get demand forecast at the same time of logging.
It is helpful to energy management by using alarm message.
6. Data management by reading unit log and save data
You can read out log data in Eco-POWER METER (only KW8M with log function type).
The data can be saves as csv format and you can use it to make graph or analysis data.
1
KW Monitor
Chapter 3 Operation
Using this software allows you to communicate with Eco-POWER METER (one to 99 units) via
RS-232C/RS-485 converter or Ethernet/Serial converter.
Collect each measurement data
RS-232C
Signal converter *
RS-485
Or Ethernet
Settings, Reset measuring value etc.
*We recommend SI-35 and SI35-USB by
LINE EYE.
When using SI-35 or SI-35USB, up to 99
units can be connected.
When using other signal convertor, up to 31
units can be connected.
3.1 How to start
"KW Monitor” is started via the start menu (Click "Programs">"Panasonic-EW Control">"KW
Monitor">"KW Monitor") and the opening screen will appear and main window will be displayed.
3.2 Procedure
1. Open Communication setup window and setup communication conditions of KW monitor.
2. Open Select station number to connect window and set the unit to communicate.
3. Open Group setting window and select to register to group in order to monitor at the same time.
・Set value
・Set and reset measured value
・Monitor one unit
・Monitor each group
・Collect log data
・Check units' connection
2
KW Monitor
3.3 Main window
(A)
(B)
(C) (D) (E) (F) (G)
① ② ③ ④ ⑤ ⑥ ⑦ ⑧ ⑨ ⑩ ⑪
①
②
③
④
⑤
⑥
⑦
⑧
⑨
⑩
⑪
Open Communication setting window.
Open Select station number to connect window.
Open Group setting window.
Open Unit setup window.
Open Reset measured value window.
Open Monitor window.
Open Group monitor window.
Open Log window.
Open Unit list under connection window.
Open KW8M Read unit log window.
Open Graph display window.
(Refer to the explanation of each icon for detail.)
⑫ Monitor status is displayed.
Under monitor stop・・・・・monitor is not being executed.
Under monitoring execution・・・・・monitor is being executed.
⑭The present date and time are displayed.
⑬ Logging status is displayed.
⑬ Logging
status
is displayed.
Under
logging
stop・・・・・logging is not being executed.
stop・・・・・logging is notisbeing
Under logging execution・・・・・logging
beingexecuted.
executed.
Under logging execution・・・・・logging is being executed.
(A) File
[Data base initialization]
- to initialize the saved data for display graph
[Exit]
- to finish the application.
(B)Setting
[Communication setup] - Open Communication setup window.
[Select station number to connect] - Open Select station number to
connect window.
[Group setting] - Open Group setting window.
[Unit setup] - Open Unit setup window.
[Reset measured value] - Open Reset measured value window.
(C) Monitor
[Monitor] - Open Monitor window.
[Group monitor] - Open Group monitor window.
[Log] - Open Log window.
[Unit list under connection] - Open Unit list under connection window.
[KW8M Read Unit log] – Open KW8M Read unit log window.
3
KW Monitor
(D)Graph
[Graph Menu] - Open Graph Menu window.
(E) Tool
[Option]
[Language] - Select displayed language.
[Residence]
[Residence On] - use residence function
[Residence Off] - not use residence function
*When selecting “On”, KW Monitor is started at the same time
when PC turns on.
(E) Window
Opening window names are listed.
(F) Help
[Version] - Display Version information.
4
KW Monitor
3.4 Icons’ function
①Communication setup
Setup the communication conditions with Eco-POWER METER.
This software allows communicating via RS232C, Ethernet and USB.
Click "communication setup" to open Communication setup window.
When you set or change the contents in this window, exit all other windows.
When any other window is opened, you can check the setting of this window.
You can set the communication setting in KW monitor side in this window.
You can select from RS232C, Ethernet and USB.
■RS232C
Set each item and click [OK].
*Stop bit is fixed to 1bit.
Set the communication port.
You can select from COM1 to 16.
Set the communication speed.
You can select from
2400/4800/9600/19200/38400.
Set the communication timeout.
You can select from 1 to 99. Unit is
second.
Click upper button to add 1, click lower
button to reduce 1.
You can put in numbers directly.
Set the communication retry.
You can select from none, 1, 2, or 3
times.
When you select none, it doesn't retry.
5
KW Monitor
[Initialize]- Initialize all communication setup.
< Initial value>
Communication port: COM1
Communication speed: 19200
Data length: 8 bit
Parity: Odd
Communication timeout: 1 second
Communication retry: None
[OK]-Exit this window after saving the settings.
[Cancel]-Exit this window without saving the settings.
*Please set the COM port, communication speed, data length, stop bit and parity same as Eco-POWER
METER.
*In case of using KS1 signal converter, if time out is set shorter than KS1 time out, it may not
communicate.
6
KW Monitor
■Ethernet
Set each item and click [OK].
*Ethernet/Serial converter is required to communicate via Ethernet.
No group registration
PC’s IP address is shown automatically.
Specify the PC's port number with
decimal number.
Use "0" if there is no problem.
When other number is specified, it takes
time to communicate again after cut the
connection.
(Initial: 0)
Specify the IP address of Ethernet/Serial
converter with decimal number.
(Initial: 192.168.1.5)
Specify the Ethernet/Serial converter's
port number with decimal number.
(Initial: 9095)
In case "Group setting" exists, the name
of registered groups will be shown on
these tabs.
Click the tab you want to set.
With group registration
Set the communication timeout.
You can select from 1 to 99. Unit is
second.
Click upper button to add 1, click lower
button to reduce 1.
You can put in numbers directly.
Set the communication retry.
You can select from none, 1, 2, or 3
times.
When you select none, it doesn't retry.
[Initialize]- Initialize all communication
setup.
< Initial value>
Local Port No.: 0
Connected device IP address:
192.168.1.5
Connected device port number: 9095
Communication timeout: 1 second
Communication retry: None
[OK]-Exit this window after saving the settings.
[Cancel]-Exit this window without saving the settings.
*When using wireless unit, set communication time out longer and use communication retry in order to
improve the reliance.
7
KW Monitor
■USB
Set each item and click [OK].
*USB driver is required to communicate via USB cable.
Communication via USB can only for KW2G Eco-POWER METER.
Set the communication port.
You can select from COM1 to 16.
Set the communication timeout.
You can select from 1 to 99. Unit is
second.
Click upper button to add 1, click lower
button to reduce 1.
You can put in numbers directly.
Set the communication retry.
You can select from none, 1, 2, or 3
times.
When you select none, it doesn't retry.
[Initialize]- Initialize all communication setup.
< Initial value>
Communication timeout: 1 second
Communication retry: None
[OK]-Exit this window after saving the settings.
[Cancel]-Exit this window without saving the settings.
8
KW Monitor
②Select station number to connect
Click "select station number to connect" to open Select station number to connect window.
You can select the station number to connect in this window.
When you set or change the contents in this window, exit all other windows.
When any other window is opened, you can check the setting of this window.
Check the station numbers which you monitor and log data and select unit classification. You can input
comment for each station number.
Left-click - Select number
Left click to check the box.
It communicates with the unit with check in the box.
Right-click - Set classification
Right click and pop-up menu appears.
You can set the unit classification in this window.
Background color of station number is changed according to the
classification.
-KW8M(MEWTOCOL)
-KW7M(MEWTOCOL)
-KW1M(MEWTOCOL) *1
-KW4M(Power measurement)
-KW4M(Pulse measurement)
-KW4S(MEWTOCOL)
-KW2G(MEWTOCOL) *2
*Mode setting in this window effects only the software.
You can not change mode of Eco-POWER METER itself.
*1:KW1M, KW1M-H, KW1M-R 3 models
*2:KW2G, KW2G-H
2 models
9
KW Monitor
Click [comment] to open comment input window.
(Max. 64 letters)
[OK] - Enter comment
[Cancel] - Delete comment
Station numbers entered comment will be displayed with bold letters.
Check the box 00~09, 10~19 and so on to add checks to all boxes in the line.
Undo the check and all checks in the line are deleted.
[OK]-Exit this window after saving the settings.
[Cancel]-Exit this window without saving the settings.
10
KW Monitor
③Group setting
Use this function when several units are required to monitor and log data at the same time.
You can make 16 kinds of groups. One group can register up to 10 units.
Click "Group setting" to open Group setting window.
You can set groups and register station numbers to make groups in this window.
When you set or change the contents in this window, exit all other windows.
When any other window is opened, you can check the setting of this window.
Point cell and Input group names. (Max. 64 letters)
[Register station number] – open the register station number window.
[OK] - Exit this window after saving the settings.
[Apply] – Save the settings.
[Cancel]-Exit this window without saving the settings.
11
KW Monitor
■Register station number
Click "Register station number" to open Register station number window.
You can select the station numbers to register the group in this window.
*Station numbers, that are not selected in 'Select station number to connect' window, are not active.
Left-click –
Left click to check the box.
Register station number
It communicates with the unit with check in the box.
Right-click –
Set classification
Right click and pop-up menu appears.
You can set the unit classification in this window.
*Mode setting in this window effects only the software.
You can not change mode of Eco-POWER METER itself.
<Refer> ② Select station number to connect
Check the box 00~09, 10~19 and so on to add checks to all boxes in the line.
Undo the check and all checks in the line are deleted.
[OK]-Exit this window after saving the settings.
[Cancel]-Exit this window without saving the settings.
12
KW Monitor
④Unit setup
Click "Unit setup" to open Unit setup window.
You can change each setting value of the unit in this window.
■Display mode
Select [Display mode] to read setting value from selected unit.
Buttons for each item change to [Display].
Click [Display] to display the setting value for the item.
Click [Display all] and it displays the setting values for all items.
■Setting mode
Select [Setting mode] to write setting value to selected unit.
Buttons for each item change to [Set].
Click [Set] for each item and it writes to selected unit.
Click [Set all] and it writes the setting values for all items.
When "Apply the same setup to all units" is selected, you can set setting value to all connected units.
In this case no pull-down list is appeared.
*However, you can’t set to KW1M-R.
[Display mode] is not active and it can’t display.
All items can be set up, but items to be applied depend
on the type of Eco-POWER METER.
13
KW Monitor
Select "Apply the same setup for each group" and pull-down list for group selection is displayed.
You can setup all units registered in selected group.
[Display mode] is not active and it can’t display.
Select "Set up only one unit" and pull-down list for station number selection is displayed.
Select one station number and it display / set the setting value.
In case that selected unit is KW8M
It can’t set / display Pre-scale value and Unit.
Only KW8M with log functions,
It can set / display Calendar, Unit log
cycle and Initialize unit memory,
Demand alarm (Targeted value),
Demand alarm (Hysteresis),
Demand alarm (Start time).
In case that selected unit is KW7M
It can’t set / display Voltage range, Current for time measurement, Pre-scale value, Max. counting
speed, Unit and Preset value.
14
KW Monitor
In case that selected unit is KW4M
It can’t set / display Voltage range.
In case that selected unit is KW4S (MEWTOCOL)
It can set / display CT ratio, Unit for Pulse for Voltage range, Current for time measurement,
Pre-scale value, Max. counting speed, Unit for pulse output and Electricity rate.
For AKW4111 and AKW4211, it can’t set CT ratio.
In case that selected unit is KW1M (MEWTOCOL)
It can’t set / display some of Rate and Unit.
You can input other items but writing items depend on the type of Eco-POWER METER.
(KW1M, KW1M-H, KW1M-R)
15
KW Monitor
In case that selected unit is KW2G (MEWTOCOL)
You can select expansion No.
Expansion No.
M: Main unit
1 to 7 : Expansion unit
*You can select all 1 to 7 regardless the connected unit.
However it can’t set to the number which is not
connected.
*There are 4 types for the expansion unit, change type with using tab.
*You can check the type of the expansion unit that is selected.
・Tab [Common]
Items that are common to main unit and expansion unit (Power measurement / Pulse output,
Pulse input, Analog input) can be set /display.
It can’t set/display Voltage range, Current for time measurement and Unit.
Only KW2G-H, it can set/display File type / Log / Calendar / Initialize Unit Memory.
・Tab [Power measurement / Pulse Output]
Items for power measurement unit can be set/display.
It can’t set/display the below.
Voltage range / Current for time measurement / Unit for pulse output / Alarm value /
Alarm value [Current] / Pre-scale / Max. counting speed / Unit / Preset value / Auto-off /
Calendar / Log / File type / Stand-by current / Stand-by time / Initialize Unit Memory
16
KW Monitor
・Tab [Analog input]
Items for analog input can be set/display.
・Tab [Pulse input]
Items for pulse input can be set/display.
[Caution]
When you click “Set all” or “Display all”, all items can be set/displayed, but items to be applied
depend on the type of connected unit.
For example, when you set items for pulse input type with connecting analog input type, it can’t
set for analog input unit.
17
KW Monitor
■Save & Set the settings
Settings of Eco-POWER METER can be displayed and saved as file.
And it can be set to Eco-POWER METER using the file.
*Eco-POWER METER that is saved the settings is KW2G and KW2G-H.
Only USB communication is supported this save and set the settings.
[Calendar] data is not saved.
Do not tun off the Eco-POWER METER nor remove USB cable during setting.
How to save the settings
Click [Dispay all] or [Display] with [Display mode] and the setting values are diplayed.
Click [File] -> [Save] or [Save As] and input file name. Enter a file name and save the file.
(The extension is “xxx.kwm”)
18
KW Monitor
How to set the settings
Click [File] -> [Open] and open the saved file.
Open the setting data file and it displays the settings on the unit stup window.
Select the station number and expansion unit number that is intended to set, and click [Set all] or [Set].
It set to the Eco-POWER METER.
“Setting…” is blinking on the below during setting.
The setting is completed when “Setting…” is disappeared.
19
KW Monitor
⑤Reset measured value
Click "Reset measured value" to open Reset measured value window.
You can reset the measured value such as integrated electric power in this window.
■Display mode
Select [Display mode] to read measured value.
[Clear] button will be unable to use and [Display] button will be active.
Click [Display] for each item and it displays the measured value.
Click [Display all] and display all measured values of all items.
■Setting mode
Select [Setting mode] and you can write the setting values of selected unit.
[Clear] button will be active to use.
Button's name is changed to [Set].
Click [Set] in each item and write the setting value of the item to the selected unit.
And click [Clear] in each item and reset the measured value of the item,
Click [Set all] and write the all setting values of all items.
20
KW Monitor
When "Apply the same setup to all units" is selected, you can set setting value to all connected units.
In this case no pull-down list is appeared.
[Display mode] is not active and it can’t display.
All items can be set up, but items to be applied depend
on the type of Eco-POWER METER.
Select "Apply the same setup for each group." and pull-down list for group selection is displayed.
You can setup all units registered in selected group.
[Display mode] is not active and it can’t display.
Select "Set up only one unit" and pull-down list for station number selection is displayed.
Select one station number and it display / set the setting value.
In case that selected unit is KW8M
All items can be displayed and reset.
Only for KW8M with log function type, optional integrated active power is setup or displayed.
21
KW Monitor
In case that selected unit is KW7M
Only integrated electrical power can be displayed and reset.
In case that selected unit is KW4M
Measured value, hour-meter and count value can be displayed and reset.
In case that selected unit is KW4S (MEWTOCOL)
Only integrated electrical power can be displayed and reset.
22
KW Monitor
In case that selected unit is KW1M (MEWTOCOL)
Integrated electrical value, hour-meter and count value can be displayed and reset.
In case of AKW1110, you can input count value but can not be displayed and reset.
In case that selected unit is KW2G (MEWTOCOL)
Integrated electrical value (1), integrated electrical value (2), count number value, CH0 count
number and CH1 count number can be displayed and reset.
When you select "Apply the same setup to all units" or "Apply the same set up for each group", all items
can be set up, but items to be applied depend on the type of Eco-POWER METER.
23
KW Monitor
⑥Monitor
Click "Monitor" to open Monitor window.
You can check each measured value of Eco-POWER METER main unit in real time in this window.
■Example of KW8M
For the display of KW8M, click [Large] or [Small] to change the size.
For the other model, it is impossible to change the size.
When selecting [Large],
scroll the window to see lower items.
On the monitor window, click the keys of Eco-POWER METER on PC, it works as same as the unit.
According to the type of the unit, you can shift an active power, reactive power, appearance power or
voltage display or hour meter, electricity charge.
(This function depends on the unit. There are some functions that are not supported.)
24
KW Monitor
Select station number to monitor.
[Update]
Click [Update] to update data forcibly.
Click [Update] and it displays real time data.
Select data updating interval.
The data will be updated by selected interval.
Stop monitoring
Under monitoring
Start or stop monitoring.
During stop, [start] is active.
During monitoring, [stop] is active.
[Start] – Update data at selected interval.
[Stop] – Stop monitoring.
[Exit] – Exit this window.
[Caution]
・Even if KW2G is changed the setting of phase/wire system by keys on KW2G during
monitoring, KW monitor is not changed the phase/wire.
・Updating interval may be delayed during under the monitoring and logging.
25
KW Monitor
⑦Group monitor
Click "Group monitor" to open Group monitor window.
You can check each measured data of Eco-POWER METER main unit registered in selected group in
real time in this window.
■Example of Group monitor
On the monitor window, click the keys of Eco-POWER METER on PC, it works as same as the unit.
According to the type of the unit, you can shift an active power, reactive power, appearance power or
voltage display or hour meter, electricity charge.
(This function depends on the unit. There are some functions that are not supported.)
*Click <SHIFT/▽> on KW1M-H, and it shifts the display from power monitoring mode to simple demand
mode.
Select group to monitor.
[Update]
Click [Update] to update data forcibly.
Click [Update] and it displays real time data.
Select data updating interval.
The data will be updated by selected interval.
Stop monitoring
Under monitoring
Start or stop monitoring.
During stop, [start] is active.
During monitoring, [stop] is active.
[Start] – Update data at selected interval.
[Stop] – Stop monitoring.
[Exit] – Exit this window.
[Caution]
・Even if KW2G is changed the setting of phase/wire system by keys on KW2G during
monitoring, KW monitor is not changed the phase/wire.
・Updating interval may be delayed during under the monitoring and logging.
26
KW Monitor
⑧Log
You can log the measured data of all units connected by selected cycle in this window and you can
save measured data as csv file.
*During logging, you can not exit this window. In order to exit this window, stop logging.
Click "Log" to open Log window.
Select station numbers to check log data.
Displayed items are changed according to the selected unit.
Select currency.
When selected unit is KW8M or KW7M or KW1M, it is not displayed.
Select numbers of line required to display.
Select cycle and unit.
You can select unit from minute and second.
27
KW Monitor
Check [Auto save] and select saved cycle.
When you check this box, the dialogue to select the save folder will be
displayed.
You can select an optional folder to save files.
It saves files every time when passing the selected cycle after start logging
automatically. The saved data by auto save function is only data for every
cycle. The data is not all data till then.
◆File name: Station number + Created date.csv
Ex) Station number 01, September 1, 2006 12:00:00
-> No01_20060901120000.csv
For KW2G: Station number + Unit number + Created date.csv
Ex) Station number 01, Main unit, March 1, 2011 12:00:00
-> No01(M)_20110301120000.csv
Ex.) When Data collection cycle: 60min., Auto Save: Daily
Saved file has 24 lines of log data.
However, when stop logging, it saves files with latest cycle automatically regardless of selected
cycle. Data is automatically preserved when the measurement frequency reaches 10000 times, and
the display data is deleted when not preserving it automatically.
Start or stop logging.
[Start] - Start logging and you can collect data of each
unit by selected cycle.
[Stop] – Stop logging
[Save] You can save the collected measured data as
csv file.
Click each button and you can save by several ways.
[Save one station]
Click "Save one station" to save log data of present
displayed station.
・You can name files as you like.
・Save dialogue will be displayed and you can
choose folders to save place.
[Save selectively]
Click "Save selectively" and connected units list is
displayed. You can select station numbers to save.
・You can name files as you like.
・Save any paths you like by changing folder to
save.
*If there is a file of the same name (NO*.csv) in
the saved path of data, it will overwrite.
[Save] - Save files and exit this window.
[Cancel] - Exit this window without saving files.
28
KW Monitor
[Save all stations]
Click "Save all stations", it displays connected unit
list and save all data of connected units.
・You can name files as you like.
・Save any paths you like by changing folder to
save.
*If there is a file of the same name (NO*.csv) in
the saved path of data, it will overwrite.
Check boxes of station number to save measured
data. You can not remove the checks in "Save all
stations" function.
[Save] - Save files and exit this window.
[Cancel] - Exit this window without saving files.
[Save by group]
Click "Save by group", it displays connected group
list and save as group.
・You can name files as you like.
・Save any paths you like by changing folder to
save.
*If there is a file of the same name (NO*.csv) in
the saved path of data, it will overwrite.
*File name should have asterisk (*), the asterisk is
changed to station number when output. Be sure
to enter asterisk (*) in file name. If there is no
asterisk, the data of all registered unit in the group
can not be saved.
Check box “Output files to subfolders for each
group” and make group folders in saved folder and
save data of each unit in it.
[Save] - Save files and exit this window.
[Cancel] - Exit this window without saving files.
[Data collection cycle]
It may not satisfy the selected cycle according to the communication condition and connected number.
The below table is for the standard of data collection cycle and it doesn’t guarantee it.
<Connection environment>
Communication speed: 19200bps
KS1 signal converter
Type
Unit number
Data collection cycle
KW8M
1
Min. 5 sec.
KW7M
1
Min. 1 sec.
KW4M
1
Min. 1 sec.
KW1M
1
Min. 5 sec.
Main unit: 1
Min. 5 sec.
KW2G
Main unit 1+
Min. 10 sec.
Expansion unit 1
*When you change menu during data collection, the cycle may shift.
*Logging cycle may be delayed if it starts monitoring and group monitoring at the same time.
29
KW Monitor
⑨Check connection to each unit
You can check connection to each unit in this window.
Click "Unit list under connection" to open Unit list under connection window.
*This window is not updated during opening the window. When checking the connection, exit this
window once and open it again.
: Under connection
This is the unit under connection.
: Connection failures
This is the unit with connection failure.
Check the line or unit connection.
: No connection
This is the unit which is never connected after start this software.
Double-click the station numbers to recover the unit with 'Connection failure' to 'No connection'.
You can start monitoring and logging again by double-click after confirm the recovery of the unit.
[Clear all] - Recover all units' connection to 'No connection'.
[OK] - Exit this window.
30
KW Monitor
⑩KW8M Read Unit Log
This function is available only for KW8M with log function. It reads out log data in a unit.
Click "Read Unit Log" to open KW8M Read unit log window.
*This functions is not available for KW1M-H (SD card applicable type)
*During reading log in a unit, you can not exit this window. In order to exit this window, stop reading.
Select station number to read unit log data.
*You can select the station number which type is KW8M.
(Other station numbers are not listed.)
[Start Reading] - Start reading unit log data. You can read out all data (max.2160) in the
memory of the selected unit. During reading, [Stop Reading] is active.
[Stop Reading] - Stop reading unit log data
[Save] – Save reading data with csv.
After completing the reading (complete all data or stop reading),
[Save] will be active.
When you click [Save], the dialogue to select the save folder will be displayed.
You can select an optional folder to save files.
Default folder is “Unitlog” folder under application folder.
◆File name: Unitlog + Station number + Created date.csv
Ex) Station number 01, May 1st, 2008 12:34:56
UnitlogNo01_20080501123456.csv
(UnitlogStation number_yyyymmddhhmmss.csv)
You can select sort order, by number or by date time.
31
KW Monitor
⑪Graph Display
You can display a graph such as daily report or monthly report by using measured data of connected
unit.
◆Procedures (Refer to the next page in detail.)
1. Open Setup for Graph Menu window and set conditions for save graph for each unit and group and
set items related to demand monitor and PF monitor.
2. Open Graph Display Setup window and select conditions to display / save graph and display or save
graph.
3. Display graph and save or print the displayed graph.
Click "Graph" to open Graph display menu window.
<1>
<2>
<3>
<4>
<5>
<1>Setup
You can open graph display setup window and set conditions for save graph or output graph in this
window.
When selected “Unit setup” in [To save] tab
You can set conditions for save graph for each unit.
With save option, name files to save.
* Including special letters, they are changed to designated letters when saved.
Ex) %T_%D _Daily_ 20060901120005
Check this box to save the file when "choose and save".
In “Sheet Name”, name sheet of Excel file.
* Including special letters, they are changed to designated letters
when saved.
Ex) No%N -> No01
32
KW Monitor
When selected “Unit setup” in [Unit] tab
You can set conditions for display graph for each unit and set demand set value, PF set value and
monitor for each unit.
Right-click the cell to select wire system.
Check the box of “Demand monitor” to monitor demand of the unit.
Input setting value in “Demand set value” to output Demand
alarm.
Check the box of “PF monitor” to monitor PF of the unit.
Input setting value in “PF set value” to output PF alarm.
33
KW Monitor
When selected “Group setup” in [To save] tab
You can set conditions for save graph for each group.
With save option, name files to save.
*Including special letters, they are changed to designated letters when saved.
Ex) %T_Group_%D _Daily_ Group_20060901120005
Check boxes of “Save” to save data for each group file in Graph Display Setup
window.
In “Sheet Name”, name sheet of Excel file.
*Including special letters, they are changed to designated letters when saved.
Ex) %G Group name
When selected “Group setup” in [Unit] tab
You can set conditions for display graph for each group and set demand set value and monitor for
each group.
Check the box of “Demand monitor” to monitor
demand of the group.
Input setting value in “Demand set value” to
output Demand alarm.
34
KW Monitor
<2>Graph
Click "SETUP" in Graph Display Menu to open Graph Display Setup window.
You can select conditions to display /save graph and display or save graph in this window.
◆Date for displaying graph is saved separate from
logging data.
Data for each graph of Daily, Historical
(Instantaneous electric power, Current, voltage), PF
can be saved by max 8760 for one station. When the
maximum number is exceeded, it overwrites
sequentially from old data.
The standard at the saved period is as follows. We
recommend the graph and data to be saved before
this period passes.
Data Collection cycle
1 min.: about 6 days
5 min.: about 30 days
15 min.: about 90 days
30 min.: about 6 months
60 min.: about 1 year
Data for Monthly, the standard at the saved period is
about 4 months regardless the Data Collection cycle.
(In case 99 units are connected.)
[Graph Name]
Select graph to display / save.
[Common]
Select add up unit for display / save graph from
unit and group.
Select station number or group to display
graph.
[Daily Option][Monthly Option]
[Historical Option][PF Option]
It is changed according to the selected graph.
(Refer to the next in detail.)
There is no item for [Demand].
[Display Graph] – Display select station No./Group to
display graph.
[Choose and save] – Save graph data of the unit or
group which is checked in setup window. (Select date to
save.)
*It will be error that no unit and group is checked in setup
window.
[Save all] – Save data of all connected unit (Select date
to save.)
*It will be error that no date nor month is checked in setup
window.
[Exit] – Exit graph display setup window and open graph
display menu.
35
KW Monitor
Click [Display Graph] after selecting conditions, and open select
Graph Display Station No window or Select Graph Display Group
window.
Check the boxes to display graphs.
Add up unit
◎Unit
Add up unit
◎Group
[OK] - Display graphs of selected No./Group.
[Cancel] - Close this window and return to Graph menu.
36
KW Monitor
Optional items to select
<Daily option>
[Date]
Select date to display or save graph.
[Time unit]
Select time to show the graph.
[Missing values are supplemented.]
Check this box to supplement an integrated value from the valid
data when there is no valid data in the selected time unit.
*It can not supplement when there are no data after missing value.
[Measure Item]
You can select a measure item from the followings.
- Integrated active power
- Integrated reactive power
- Integrated apparent power
- Digital conversion value
- Count number
*Graph for integrated reactive power and integrated apparent power
is available for KW2G and KW8M.
*Graph for digital conversion value is available for KW2G.
*Graph for count number is available for KW1M, KW2G, KW4M and
KW8M.
< Monthly option>
[Year/Month]
Select Year and Month to display or save graph.
[Day]
Select start day to display or save graph.
[Missing values are supplemented.]
Check this box to supplement an integrated value from the
valid data when there is no valid data in the selected time unit.
*It can not supplement when there are no data after missing
value.
[Measure Item]
You can select a measure item from the followings.
- Integrated active power
- Integrated reactive power
- Integrated apparent power
- Digital conversion value
- Count number
*Graph for integrated reactive power and integrated apparent
power is available for KW2G and KW8M.
*Graph for digital conversion value is available for KW2G.
*Graph for count number is available for KW1M, KW2G, KW4M
and KW8M.
< Historical option>
[Date]
Select date to display or save graph.
[Time unit]
Select time to show the graph.
[Measure Item]
Select items to display from instantaneous electric power,
current and voltage.
< PF option>
[Date]
Select date to display or save graph.
[Time unit]
Select time to show the graph.
37
KW Monitor
●Example of Daily
<Date>
[Prev day] - Shift to the previous day of the displayed.
[Next day] - Shift to the next day of the displayed
<Display Option>
You can change the color of displayed graph.
「Auto」 Undo check this box to set each items by you.
「Max.」 Set max. value for graph axis.
「Min.」 Set Min. value for graph axis.
「Major unit」 Set major of Y axis.
<Time unit> *It changes the display according to the graph type.
Select time to show the graph.
[Update Graph] - Click to update graph with selected
conditions by Display Option.
*When displayed date is different from current date, below
display will be shown.
[Yes] - Update the date and display graph.
[No] - Keep the selected date and display graph.
[Save] Save the displayed graph as an Excel file.
Save option window is displayed and you can designate saved path
and file name.
[Print graph] - Print the displayed graph.
*Please register the printer beforehand before using this function.
The print data is transmitted to the printer set to the default printer.
Other settings are printed according to the setting of the default
printer though the direction of the print is transverse fixation
[Exit] - Exit Graph Display window and open Graph Display Setup
window.
38
KW Monitor
●Example of Daily (several)
[Update All Graph] - Click to update graph to latest current value.
[Previous] - Shift to previous station number or group display.
[Next] - Shift to next station number or group display.
*When KW2G is selected, the graph of the main unit and the expansion units are displayed.
*Graph for digital conversion value and count number of KW2G expansion unit is displayed by each
channel.
39
KW Monitor
<3>Demand
When using simple demand monitor,
click icons in this window.
Click [Demand] to start monitoring demand.
Demand Monitor function
Demand means the average electric power of 30 minutes. Demand value is always predicted the value
at the end (**: 00 and ::*30) by current log data. When demand predicted value is exceeds a set
value, alarm is output. Each unit and each group can be monitored demand, but even if the demand
icon of Graph Display Menu is clicked neither unit nor group without check the box in setting of demand
monitor is not monitored.
When the predicted value exceeds the set value during monitoring, the alarm message is shown. When
there are several alarms, several messages are shown.
Please use demand monitor as your standard because this is simple monitor.
And demand function is available when the data collection cycle selected to 60 second, 1, 5 and 10
minutes. It is not available when it selects 1, 5, 10, 15, 30 seconds, 15, 30, or 60 minutes for the data
collection cycle.
<Alarm message>
Alarm is indicated with this window and alarm sound.
Click "X" button to exit this message window and stop sound.
*When there are several alarms, next station number or group is shown.
Every time when it detects alarm, new alarm window will be shown.
*This is separated function from the main unit of KW1M-H and KW8M with log function type.
Ex)
Current value
Damand set value
Time (min.)
0
30
15
For example, when 15 minutes pasts the hour, it predicts the using power on the half by using
power during 15 minutes.
When this predicts power exceed the set value, alarm will be blinking.
40
KW Monitor
<4>Power Factor
When using simple PF monitor,
click icons in this window.
Click [PF] to start monitoring PF.
PF Monitor function
With PF monitor function, PF is calculated by using the latest log date. And when PF falls below a set
value, alarm is output. Each unit can be monitored PF (Group can not.), but even if the PF icon of
Graph Display Menu is clicked, unit without check the box in setting of demand monitor is not
monitored.
When PF falls below a set value, the alarm message is shown. When there are several alarms, several
messages are shown.
Please use PF monitor as your standard because this is simple monitor.
And PF function is available with KW8M, KW7M, KW4M, KW1M series and KW2G series.
It is not available with KW4S.
<Alarm message>
Alarm is indicated with this window and alarm sound.
Click "X" button to exit this message window and stop sound.
*When there are several alarms, next station number or group is shown.
Every time when it detects alarm, new alarm window will be shown.
41
KW Monitor
<5> CSV Graph
You can display graph using a log file (.csv) by collecting KW Monitor, a log file (.csv) by reading from
KW8M, a log file (.csv) by logging with DLU or a log file(.csv) by collecting from KW1M-H,KW2G-H with
SD memory card.
*The file by logging with DLU has some restrictions for using.
Only csv file from Eco-POWER unit can be used.
<Restrictions of csv file>
■Example of CSV file
Row A
Line 1
Date
Row B
Row C
Row D
Time
Line 3
Instantaneous
active power
COM1 [Unit No.1]
2
Instantaneous reactive
power
COM1 [Unit No.1]
Line 4
DT176
DT178
Line 5
MOMENT
MOMENT
US32 -> FLT
US32 -> FLT
kW
kvar
Line 2
:
:
:
:
:
:
1
2008/4/4
6:19:28
0
0
2008/4/4
6:19:29
0
0
2008/4/4
6:19:30
0
0
2008/4/4
6:19:31
0
0
Graph display items (Measurement item) -> [Line 2] Letters in this cell are listed in the display item list.
DT address -> [Line 4]
Date, Time-> [Row A], [Row B] Should be separated. No restrictions for other rows.
<Restrictions for data in file>
・Data should be from one Eco-POWER METER. (There is one set of DT176, DT178 and DT180.)
・Data should be one specified data from several Eco-POWER METER.
(There are several data only DT176.)
42
KW Monitor
Select CSV file type that you want to display the graph.
KW Monitor log: Log file by collecting log function of KW
Monitor
KW8M Unit log data: Log file by read out function of KW
Monitor
Detailed log: Log file by collecting with SD memory card from
KW1M-H, KW2G-H.
*1
DLU log data: Log file by logging data in DLU or DLL.
After selecting CSV file type, input the station number that you
want to display the graph.
You can select file without station number by opening holders.
Filter is applied to window ‘Open’ according to csv type and
station number.
■KW Monitor log, station number: 1
■KW Monitor log, station number: none
■KW8M Unit log, station number: 2
*1 When you want to display graph by using KW1M-H, KW2G-H (SD card applicable type),
use file type 3.
43
KW Monitor
The time range of the data is displayed.
Input the time range of the graph that you want
to display.
[Graph setup]
Setup to diplay digital conversion value and count numer.
(Refer to the below in detail.)
「Display item」
Select the item that you want to display.
「Time unit」
Select time unit to show the graph.
Maximum 60 points are the limit for X axis to see.
[Display graph]- The graph is displayed according to the selected
condition.
[Print graph]- Print the displayed graph.
[Save]- Save the displayed graph as an Excel file.
Save option window is displayed and you can designate saved
path and file name.
[Exit]- Close CSV Graph window and return to Graph Display
Menu window.
<Graph setup>
In order to display graph of count number or digital converision value in KW Monitor log, KW8M Unit log
data and detailed log, set the parameter.
*It doesn’t support DLU log data.
44
KW Monitor
Setup for count number
Set to display graph of the count number from KW4M, KW8M, KW1M, KW2G and KW2G expansion
unit pulse input type
*Set to [CH0 Count number] for count number from KW4M, KW8M, KW1M and KW2G.
[Total integrated value display]
- Select if total integrated value graph is displayed or not.
[Graph type]- Select the graph type for time unit.
[Pre-scale]- Set the conversion value to display graph.
[Unit setup]- Input unit name to display for the graph
(max. 6 letters)
Setup for digital conversion value
Set to display graph of the digital conversion value from KW2G expansion unit analog input type.
[Point position]- Select point position
[Unit setup]- Input unit name to display for the graph
(max. 6 letters)
45
KW Monitor
Chapter 4 Others
4.1 Operating Environment
OS: WindowsXP Professional, Windows Vista Business, Windows7, Windows8
*Only PC installed Microsoft Excel 97 or better can be used Graph save function.
*PC should be set not to shift to stand-by mode during using KW Monitor.
*Even if a customer stores a file created by the customer in ¥Program files, the file will be automatically
stored in /userID/AppData/Local/VirtualStore.
When User Account Control (UAC) is on as the default setting of Windows Vista, Windows7 and
Windows8.
4.2 Execution requirement
CPU: Intel Celeron 700MHz or better
Memory:
Windows2000/XP: 256MByte or more
HDD: Program blank space 180MB or more
Data 100MB or more
Screen font: Normal size
*This capacity is required to connect 99 units and save log data with 10000 lines and to save data for
graph display.
4.3 Applicable model
・KW8M Eco-POWER METER
・KW7M Eco-POWER METER
・KW4M Eco-POWER METER (Only MEWTOCOL type)
・KW4S Eco-POWER METER
・KW1M Eco-POWER METER
・KW1M-H Eco-POWER METER
・KW1M-R Eco-POWER METER
・KW2G Eco-POWER METER
・KW2G-H Eco-POWER METER
4.4 Display resolution
1024X768 pixels
4.5 Display color
High Color (16 bit) or more
4.6 Communication protocol
MEWTOCOL (KW8M, KW7M, KW4M, KW4S, KW1M, KW1M-H, KW1M-R, KW2G, KW2G-H)
* KW8M, KW7M, and KW1M series and KW2G series support MODBUS protocol, but this software
doesn't support MODBUS protocol. This software supports only MEWTOCOL.
4.7 Cautions for use
Specifications of this software and manual are subject to change without notice.
Microsoft Windows, WindowsXP, Vista, 7, 8 and Microsoft Excel are the trademark or registered
trademark of Microsoft in USA and other countries.
Ethernet is the trademark or registered trademark of Xerox.Corp. in USA.
Modbus protocol is a communication protocol that the Modicon Inc. developed for PLC.
Other company names and the product names are the trademarks or registered trademarks of each
company.
46
KW Monitor
kwmonitormanualE_v8
47