1
Color Models & Color Tools in ImagesPlus
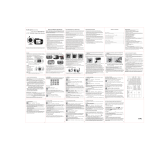
The RGB color model is an additive color model based in human color perception where primary colors
red, green, and blue are added together to create other colors. A Cartesian coordinate system is used to
represent different colors by assigning red to the x-axis, green to the y-axis, and blue to the z-axis as
shown in Figure 1.
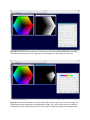
Figure 1 Red, green, and blue assigned to the x, y, and z-axis, respectively, to form the RGB color cube.
The secondary colors cyan, magenta, and yellow are formed by adding equal amounts of the primary
colors C = G + B, M = R + B, and Y = R + G. Black is at the origin where (R, G, B) = (0, 0, 0). White is the
sum of red, green, and blue all at full strength (R, G, B) = (1, 1, 1). The gray scale is represented by the
vector from black to white. Color is represented by the vector (R, G, B) from black at the origin to a point
in or on the RGB cube where R, G, and B can be any value from 0.0 to 1.0.
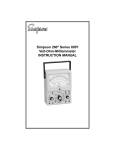
Digital cameras record color by capturing red, green, and blue values independent of each other at each
point or pixel of a scene and store the color data using the independent red, green, and blue color
planes of the RGB color model. Monochrome CCD cameras capture gray scale luminance by recording all
colors at each pixel or just red, green, and blue values at each pixel using different color filter. DSLRS and
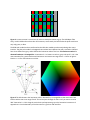
one shot color CCD cameras use a Bayer RGB filter array to capture color by placing red, green, or blue
filters over each pixel of the sensor as shown in Figure 2. Bayer conversion algorithms form a complete
(R, G, B) value at each pixel by filling in the missing red, green, and blue values using the measured red,
green, and blue values near the pixel. Computers use the RGB color model to display an image by
coloring each pixel of the monitor with the corresponding (R, G, B) pixel of the image recorded by a
digital camera.
The RGB color model is good at storing a color image from digital cameras and for display of the image
on a computer mointor but is not so good for manipulating the color image using a computer algorithm.
For example, it is difficult to select and adjust a hue like yellow or blue without shifting color or the
brightness of the image because of the independent red, green, and blue planes used to describe each
pixel. See Figure 5 below.
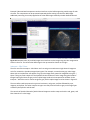
Figure 2 A camera sensor is sensitive to all colors at each pixel shown as gray. The RGB Bayer filter
array, used in DSLR and one shot color CCD cameras, covers each pixel and makes the pixel sensitive to
only red, green, or blue.
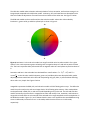
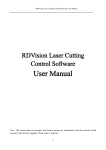
The RGB color model can be transformed to the HSV color model to make manipulating color more
intuitive. The HSV color model is a hexagonal cone where hue H defines the color, saturation S defines
how a hue differs from gray, and V defines the luminance value of the hue. The luminance value V is
denoted luminance L in ImagesPlus. A saturation S = 0.0 means no color or gray scale and S = 1.0 is the
most saturation for a particular hue and luminance. Luminance can range from L = 0.0 for no light or
black to L = 1.0 for full luminance or white.
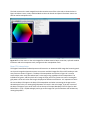
Figure 3 The HSV hexcone has luminance value V denoted by L in ImagesPlus as the vertial axis from
black to white. Hue H can range from 0° for red and pass through all colors until you return to red at
360°. Saturation S = 0.0 is along the vertical axis and represents gray scale, Saturation increases as S
approaches 1.0 at the boundary of the hex cone for a give hue and lumiance.
The HSV color model makes selection and manipulation of a hue, saturation, and luminance range in an
image simple compared to the RGB color model. Luminance, hue, and saturation are decoupled in the
HSV color model so adjustment of one will have minimal effect on the other two. See Figure 7 below.
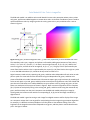
The RGB color model can be transformed into the Lab color model where color is described by
luminance L, green-red by a, and blue-yellow by b as shown in Figure 4.
+b
S
-a
+a
-b
Figure 4 Luminance L in the Lab color model can range from black at 0.0 to white at 100.0. For a given
value of L the a-axis represents green-red with green as negative values of a and reds as positive values
of a. The b-axis represents blue-yellow with blue as negative values of b and yellows as positive values of
b.
Saturation and hue in the Lab model are calculated from a and b where 𝑆 = √(𝑎2 + 𝑏²) and 𝐻 =
𝑏
𝑎
arctan( ). In the Lab color model luminance, green-red, and blue-yellow are decoupled whick makes
adjusting luminance with little color shift and manipulating red, gree, blue, or yellow without effecting
other colors very simple. See Figure 6 below.
ImagesPlus represents the RGB, HSV, and Lab color models as 32 bit floating point arrays. The RGB color
model is used to read, write, and store image data in 32 bit floating point memory. Color manipulation
can be performed in RGB, HSV, or Lab color model depending on the color tool. The HSV and Lab color
models are used by the color tools in ImagesPlus to select and modify a hue, saturation, and luminance
range with minimal effect to color outside of the selected color range compared to color manipulation in
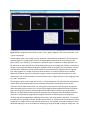
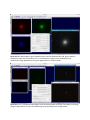
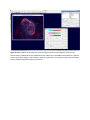
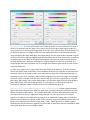
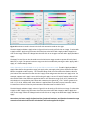
the RGB color model. Figures 5, 6, and 7 below show the same curve applied to the same RGB data using
curves in RGB mode, luminance curve L in Lab mode, and the luminance curve L in HSV mode,
respectively.
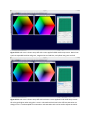
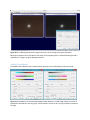
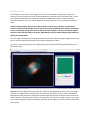
Figure 5 RGB color cone is shown at top left with curves applied in RGB mode at top center. Notice how
cyan has expanded into blue and green, magenta into red and blue, and yellow into green and red.
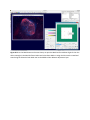
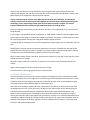
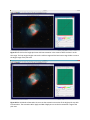
Figure 6 RGB color cone is shown at top left with luminance L curve applied in Lab mode at top center.
All colors get brighter when using the L curve in Lab mode with minimal color shift but saturation can
change since L is not decoupled from saturation. Lab saturation tools can be used to adjust saturation.
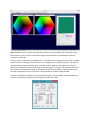
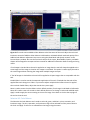
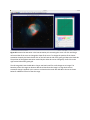
Figure 7 RGB color cone is shown at top left with luminance L curve applied in HSL mode at top center.
Note that there is no color shift or saturation change since luminance L is decoupled from hue and
saturation in HSV mode.
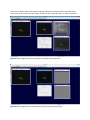
The mask tools in ImagesPlus use the RGB, HSV, or Lab models when creating gray scale masks. The RGB
model is used to create a grayscale mask of the R, G, and B planes or a mixture of the (R, G, B) values at
each point of an image as shown by Figure 8. The HSV model is used to create a gray scale mask of a
specific hue, saturation, and luminance range as shown by Figure 9. The gray scale mask that represent a
hue, saturation, and luminance range can be used to stretch, smooth, sharpen, and adjust color when
the mask is assigned to a layer in the Process History window or Combine Images window.
The Cross Hair Statistics window, on the top horizontal toolbar, is used to display 8 and 16 bit RGB, hue,
saturation, luminance, and Lab color at an image point under the mouse.
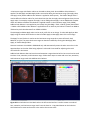
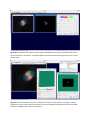
Figure 8 The Custom Luminance Mask tool creates a gray scale mask using the RGB model by mixing R,
G, and B values at each point of an image. Only red is used above to create the gray scale mask.
Figure 9 The Selective Color Mask tool uses the HSV model to create a gray scale mask of an image. The
Hue Range bar and triangles define the feathered hue range. The L and S sliders can be set to specify a
feathered luminance and saturation range. The HSL range is smoothed using the Smooth Radius slider.
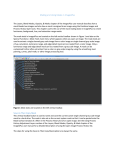
The Color menu on the main ImagesPlus window contains most of the color tools as shown below in
Figure 10. Micro Curves, Levels, and Pixel Math on the main Stretch and Special Functions menus can
also be used to manipulate color.
Figure 10 The Color menu on the main ImagesPlus window contains Bayer conversion, split and combine
luminance and color component tools, and general color manipulation tools.
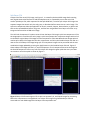
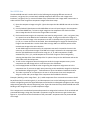
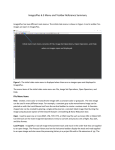
Bayer CFA Interpolation
The Digital Camera Raw File Development and Conversion or Automatic DSLR Image Set Processing tools
on the main Image Set Operations menu can convert raw DSLR images like CR2 or NEF into Bayer color
array format as shown in Figure 2. The Bayer CFA Interpolation tool shown in Figure 11 is used to
convert Bayer color array format data into a color image using a gradient driven interpolation. The
individual red, green, and blue pixels of an image in Bayer color array format can cause a rectangular
grid pattern to be seen when the image is displayed at different zoom factors. It is important to select
the correct Bayer CFA type on the Bayer CFA Interpolation tool when converting the image to color
otherwise poor color or a rectangular grid pattern will result in the color image. If you are not sure of
the Bayer CFA type of your sensor then start at the top of the Input Raw Bayer CFA File Type list with
RGB Generic + (0,0) – RG,GB and apply each type to the image until you find the best color without any
rectangular pattern.
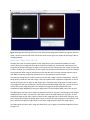
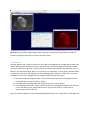
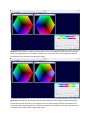
Figure 11 Single channel Bayer color filter array (CFA) format image with individual red, green, and blue
pixels is shown on the left with color conversion shown on the right. The red bias of the image is due to
red light pollution.
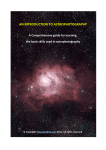
Split Colors - LRGB, LCMY, HSL, Lab
The Split Colors tool is used to separate a color image into its color components based on the color
model. Most tools in ImagesPlus allow direct access to the RGB, HSL, and Lab color components of an
image directly without splitting the image, but access to the color components of an image can be useful
at times. The RGB, R, G, and B buttons on the top horizontal toolbar enable direct access to the selected
color component when using an enhancement tool that does not have color selection options such as
Pixel Math, smoothing, sharpening, deconvolution, or the geometric transform tools.
The Link Color Components To options controls how the color image is split into components. If the No
Image option is used then the color image is split into separate color component images with no link to
rebuild the original color image from the components. If the New Color Image option is used to split a
color image then the color components are linked by the Combine LRGB, LCMY, HSL, Lab tool to a new
version of the color image being split. The component images can be processed and the new
combination image updated by pressing the Apply button on the Combine LRGB, LCMY, HSL, Lab tool.
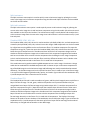
The LRGB option will spilt a color image into separate luminance, red, green, and blue gray scale images
and display them in color. The Interpret – Mix Colors tool can be used to display a red, green, or blue
component image as gray scale. Figure 12 shows a color image split into its luminance, red, green, and
blue components using the No Image option. Figure 13 shows the same image split into luminance, red,
green, and blue components and linked to a new color image using the New Color Image option.
The LCMY option will split a color image into luminance, cyan, magenta, and yellow components shown
by Figure 14.
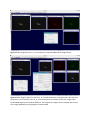
Figure 12 Color image split into L, R, G, B components using the LRGB with No Image options.
Figure 13 Color image at top left is split into L, R, G, and B components using Split Colors with the New
Image option. As a result the split L, R, G, and B components are linked to a new color image called
CombineRGBTarget by the Combine LRGB tool. The components images can be enhanced and the new
color image updated by pressing Apply on Combine LRGB.
Figure 14 Color image split into luminance, cyan = blue + green, magenta = red + blue, and yellow = red
+ green components.
The HSL option splits a color image into hue, saturation, and luminance components. The hue hexcone
shown by Figure 3 is mapped from red at 0° through magenta at 300° back to red to the gray scale
[black, white] = [0.0, 65535.0]. The saturation component maps 0.0 saturation to black at 0 and 1.0 or
full saturation to white at 65535.0 in a 32 bit floating point gray scale image [0.0, 65535.0]. Luminance is
the gray scale image calculated by finding the maximum value of red, green, blue at each pixel. The hue
and saturation components can be used to modify hue and saturation by applying a tool to a specific
gray scale range but it is simpler to use tools with HSL built in. For example, Micro Curves could be
applied to the darker areas of the saturation image to increase saturation but the operation is much
more direct if you use the saturation curve of HSL Micro Curves. Figure 15 shows a color image split into
H, S, and L components.
The Lab option splits a color image into its Lab L, a, and b components. The Lab luminance component is
usually darker and smoother than the HSL luminance component since Lab luminance is not the
maximum of R, G, and B at each pixel. The Lab a (green-red) component represent green by negative
values and red by positive values of a. The split a(G-R) image has green mapped from black to medium
gray in the range [0.0, 32765.5] and red mapped from medium gray to white in the range [32765.7,
65535.0]. The Lab b (blue-yellow) component represent blue as negative values and yellow as positive
values of b. The split b(B-Y) image has blue mapped from black to medium gray in the range [0.0,
32765.5] and yellow mapped from medium gray to white in the range [32765.7, 65535.0]. It is possible
to modify color by applying a smooth, sharpen, deconvolution, or stretch tool to the component a and b
images but it is simpler to use a tool with Lab mode built in. For example, you could use Micro Curves in
RGB mode and apply a curve to the black to medium gray range of the b(B-Y) image to modify blue. The
Micro Curves, Selective HSL Color Balance, and Hue-Saturation-Luminance tools in Lab mode allows
much easier access to Lab color data. Figure 16 shows a color image split into L, a, and b components.
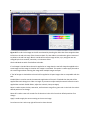
Figure 15 Color image split into hue, saturation, and luminance components.
Figure 16 Color image split into Lab luminance, a(G-R), and b(B-Y) components.
Split Bayer CFA
A Bayer color filter area (CFA) image, see Figure 2, is created by the Auto DSLR Image Set Processing
tool, Digital Camera Raw Conversion and Development tool, or captured by a one shot color CCD
camera. Split Bayer CFA, which operates like the Split LRGB tool, is used to split a Bayer CFA image into
separate images that contain only the red, green, or blue data before conversion to a color image. The
split color components allow the application of stretch, smooth, sharpen, deconvolution, or pixel math
tools to the separated data before red, green, and blue are merged back into a Bayer color filter array
image and converted to an RGB color image.
The Link Color Components To options controls how the Bayer CFA image is split into components. If the
No Image option is used then the color image is split into separate color component images with no link
to rebuild the original Bayer CFA image from the components. If the New Monochrome Image option is
used to split a Bayer CFA image then the color components are link by the Combine Bayer CFA tool to a
new version of the Bayer CFA image being split. The component images can be processed and the new
combination image updated by pressing the Apply button on the Combine Bayer CFA tool. Figure 17
shows a Bayer CFA image split into R, G, and B components. The G component has twice the height as
the R and B components since every row of the Bayer CFA image has green pixels but every row does
not contain a red or blue pixel as shown by Figure 2.
Figure 17 Bayer CFA format image on left is split into separate R, G, and B pixel images for processing
before the components are merged back into a Bayer CFA image using Combine Bayer CFA and
converted to a color RGB image with the Bayer CFA Interpolation tool.
Split Luminance
The Split Luminance menu option is used to quickly create a luminance image by splitting the current
active color image into its luminance component using the HSV model. Split Luminance is also available
on the left vertical toolbar.
Split Lab Luminance
The Split Lab Luminance menu option is used to quickly create a Lab luminance image by splitting the
current active color image into its Lab luminance component using the Lab model. Split Lab Luminance is
also available on the left vertical toolbar. The Lab luminance image is usually darker and smoother than
a HSL luminance image from the same color image since Lab luminance is not the maximum of R, G, and
B at each pixel.
Combine LRGB, LCMY, HSL, Lab
The Combine LRGB, LCMY, HSL, Lab tool is used to combine split LRGB, LCMY, HSL, and Lab components
created by the Split LRGB, LCMY, HSL, Lab tool into a color image. LRGB components can also be created
by a digital camera using different color and luminance filters. To combine components first open the
components using File | Open then open the Combine LRGB, LCMY, HSL, Lab tool from the Color menu.
Select the type of component on the Combine tool then left click on the component image inside its
window to add the component image to the Combine tool. Each component assigned to the Combine
tool has a scale slider that is used to scale the component when building the color image. Component
scale is used to balance the sensor and color filter sensitivity difference between colors. Modern color
filters are already balanced and a scale factor of 1.0 is used with all components.
This combination tool is good at combining RGB components into a color image. A luminance L image
could also be combined with the RGB components but it is better to layer a luminance component on
top of the RGB image since the luminance image and RGB image are usually stretched and processed
differently. The Combine Images tool on the Special Functions menu is used to layer a luminance image
L on top of an RGB image using blend modes, opacity, and masks. Figure 18 shows the combination of R,
G, and B components from a monochrome CCD camera.
Combine Bayer CFA
The Combine Bayer CFA tool is used to combine red, green, and blue pixel images that were split from a
Bayer CFA format image. The red, green, and blue components can be processed before they are
merged back into a Bayer CFA format image using Combine Bayer CFA. To combine components first
open the components using File | Open then open the Combine Bayer CFA tool from the Color menu.
Select the type of component on the Combine tool then left click on the component image inside its
window to add the component image to the Combine tool. Each component assigned to the Combine
Bayer CFA tool has a scale slider that is used to scale the component when building the Bayer CFA
format image. Normally a scale factor of 1.0 is used with all components. The Display Color Image
button can be used to convert the Bayer CFA combination into an RGB color image. Figure 19 shows the
combination of R, G, and B components that were split from a Bayer CFA format image and smoothed
before they are merged and converted to a color RGB image.
Figure 18 Color RGB image on right created using the Combine LRGB tool with red, green, and blue
components each with a scale factor of 1.0. The component images can be modified and the
combination image updated by pressing the Apply button on Combine LRGB.
Figure 19 The R, G, and B pixel data images can be processed before conversion into a Bayer CFA image
using the Apply button or into a color RGB image using the Display Color Image button.
Mix LRGB & Hue
The Mix LRGB & Hue tool is used to build a color RGB image by assigning different amounts of
luminance, red, green, blue, narrow band, and RGB component data from a color image to the
luminance, red, green, blue, or custom hue data of the combination color image under construction. In
order to build a color image from component images follow these steps.
1) Open the component images using File | Open then open the Mix LRGB & Hue tool on the Color
menu.
2) Use the Select All Open button on Mix LRGB &Hue to insert all open images in the component
tree of Mix LRGB & Hue. To insert a single image into the component tree check the Select
Source Image box the left click on the image inside its window.
3) Each monochrome image in the component tree must be assign to HSL L, Lab L, red, green, blue,
or a custom hue to be added to the combination image. To assign a monochrome image to a
color first select the image in the component tree then in the Map Color To group select L, Lab L,
R, G, B, or a custom hue from the hue table. Press the Add button to assign the monochrome
image to the selected color. Use the Scale slider to assign 100% or a different percent of the
monochrome image to the color selection.
A color RGB image can also be used in the component tree and is inserted in the tree in the
same way as a monochrome image. If the RGB color image is selected in the component tree
then the Split LRGB button can be used to assign its L, R, G, and B components at 100%
automatically. The L, R, G, and B components of the color image can also be assigned by
selecting the Map Color From and Map Color To options then press the Add button and set the
Scale slider to the desired percent.
4) To edit a color assignment select the assignment under the image component entry in the
component tree and change color or scale then press the Edit button.
5) Use the Apply button to build the color image using the component assignment set in the
component tree. If you want to apply some processing to the combination image then duplicate
the combination image using the … toolbar button or press the Release Combination button.
6) The order or position of a component in the tree is not important since each component is
assign to a color and a percentage of the component data is added to the color.
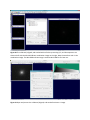
Example 1) Building a color image from L, R, G, and B components from a monochrome camera should
be performed by first combining the R, G, and B components into a color RGB image since the initial
stretch or brightening tools like Digital Development and ArcSinH are designed to brighten a color image
and preserve good color without compressing color. Figure 20 shows the setup of Mix LRGB & Hue when
building a color image from R, G, and B component images.
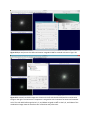
The L component is stretched and processed separate then assigned to luminance of the stretched and
processed RGB image. Assign the processed L component using Lab luminance to get the best color.
Figures 21, 22, and 23 show the combination of the processed L component with the processed RGB
color image.
Figure 20 The calibrated, aligned, and stacked with no further processing R, G, and B components are
shown at left with the Mix LRGB & Hue combination image on the right. Note the excellent color in the
combination image. The Mix LRGB and Hue image is saved as M13-RGB.fits for later use.
Figure 21 Open and process the calibrated, aligned, and stacked luminance L image.
Figure 22 Open and process the RGB combination image M13-RGB.fits created as shown in Figure 20.
Figure 23 Processed L and RGB images are shown on the left with the Mix LRGB and Hue combination
image on the right. The luminance L component is assigned to Lab L luminance for better and smoother
color. The color M13-RGB image has its R, G, and B data assigned at 100% to the R, G, and B data of the
combination image. Note the excellent color of the blue and yellow stars.
Example 2) Narrow band components can be mixed into a color RGB image using a wide range of color
schemes. The components can be processed separately before mixing into the color RGB image.
Additional processing is normally applied to the color RGB image created by the Mix LRGB & Hue tool.
Figure 24 Component Ha, NII, and OIII images are mixed into a color image using the color assignments
shown in the tree. The mixed color RGB image is then processed as shown on the right.
Interpret – Mix Colors
The main use of the Interpret – Mix Colors tool is to assign a monochrome single channel image to a
color for use with the Combine Images layering tool. For example, a monochrome gray scale image
taken with an H-alpha filter will appear as a gray scale image when opened in ImagesPlus using File |
Open. If the gray scale H-alpha is to be layered with the red data of a color image using the Combine
Images layering tool then the gray scale H-alpha image needs to be interpreted as red data. So the
Interpret – Mix Colors tool is used to assign the gray scale H-alpha image to red as shown in Figure 25.
The most often used interpret color types are luminance, red, green, and blue followed by cyan,
magenta, and yellow. The other interpret as types are rarely used and refer to gray scale image types
created by the Split HSL and Lab tool.
The controls of the Mix Channels of Multi-Channel Image are used to swap and mix the red, green, and
blue channels of a color image.
Figure 25 The gray scale H-alpha image shown at top right is interpreted as red data for use with the
Combine Images layering tool on the Special Functions menu.
Color Balance
The Color Balance tool is used to neutralize or set to gray the background of an image using a click of the
mouse. Mid-tone gray and white points can also be set. For a selected background, mid-tone, or white
point expressed as (R, G, B) the R, G, and B values are set equal to the Max{R, G, B}, Median{R, G, B}, or
Min{R, G, B} if the Balance High, Mid, or Low control is set, respectively. The red, green, and blue sliders
can be used to adjust the color balance at a selected background, mid-tone, or white point. In order to
neutralize the color of the background of an image to dark gray follow these steps.
1) Check the Neutralize Background box on Color Balance then left click on the background of an
image away from any stars, nebula, or galaxy.
2) If needed adjust the background color using the red, green, or blue sliders.
3) Use the Background Darker – Lighter slider to set the overall background brightness to dark gray
or near the value (20, 20, 20) on an 8 bit scale or (5120, 5120, 5120) on a 16 bit scale as
measured by the Cross-Hair tool.
Figure 26 shows the application of the Neutralize Background option to an image with a red background.
Figure 26 The red background of the image on the left is set to dark gray using the Neutralize
Background option of the Color Balance tool. After the background point is selected the background is
made darker or lighter using the Background slider.
Additive Color Balance
The Additive Color Balance tool is used to add or subtract color in RGB mode or Lab color mode.
Figure 27 If Lab Mode is not checked then Additive Color Balance is in RGB mode shown on the left. If
Lab Mode is checked then the red, green, and blue sliders are set to Lab L, a(G-R), and b(B-Y) shown on
the right.
A luminance range with feather radius can be used to select pixels where Additive Color Balance is
applied. The Min Apply and Max Apply sliders are used to define the luminance range [min apply value,
max apply value] where Additive color balance is applied at 100% opacity. The Feather Range slider is
used to define the feather radius for pixel values less than the min apply value and greater than the max
apply value. For example, suppose min apply is set to 7500 and max apply is set to 32000 with a feather
radius of 1500 then Additive Color Balance is applied at 100% in the luminance range [7500, 32000].
Additive Color Balance is not applied at pixel values less than 6000 = 7500 – 1500 or greater than 33500
= 32000 + 1500. Additive Color Balance is applied from 0% to 100% as pixel values increase from 6000 to
7500 and as pixel value decrease from 33500 to 32000.
The Min Apply and Max Apply values can be set by a left click on an image. To select Min Apply or Max
Apply using the mouse check the box to the left of Min Apply or Max Apply then click on the image.
The Apply To Level list box is used to set the luminance range controls to preset All Levels, Dark,
Midtone, or Light. The preset luminance range can then be modified by moving the Min Apply, Max
Apply, or Feather Range sliders.
Preserve Luminance is available in RGB Mode only and automatically moves the other two colors in the
opposite direct as the color slider being adjusted. Lab mode is best used for adjusting color with
minimal shift in luminance.
Additive Color Balance does not have hue and saturation range selection built in but a mask can be used
to select a hue, saturation, and luminance range. Follow these steps to create and use a hue, saturation,
and luminance range mask with Additive Color Balance.
Figure 28 Use the Selective Color Mask tool on the left vertical tool bar is used to create a smoothed
hue, saturation, and luminance range mask. Press the Save As – Copy Mask button on the Selective
Color Mask tool to name and save the color mask as the current mask.
Figure 29 Apply Additive Color Balance to a color image to create the new adjustment layer in the
Process History window that tracks adjustment layers. Without a mask Additive Color Balance is applied
to every pixel of the image in the luminance range as shown above. To assign the mask open the Process
History window using the top horizontal toolbar.
Figure 30 Press the Mask button on Process History to open the Mask Surface window. Right-click on the
white rectangle in the Mask Surface window and select Paste Mask to assign the blue mask created and
saved using the Selective Color Mask tool to the Additive Color Balance adjustment layer.
Figure 31 The mask restricts Additive Color Balance to the blue areas of the mask. Adjust the color and
luminance controls of Additive Color Balance in RGB mode or Lab Mode. Blend mode and opacity of the
Additive Color Balance adjustment layer are set using the Blend Mode and Opacity controls on the
Process History window. Also see the mask tools section of the Layers, Blend Modes, Opacity, and Mask
chapter of the ImagesPlus concepts and user manual for additional information about creating and using
masks.
If Lock Image is checked when the tool is applied to an image then the tool will always be applied to the
same image until the image is closed or Lock Image is unchecked. This option is used to apply the tool to
the same image without selecting the image when multiple images are open.
If Tool All Images is checked then the tool will be applied to all open images that are compatible with the
tool.
Enable Sliders is used to control the automatic application of the tool. If checked then the tool will be
applied after each change in a sliders. If you want to adjust multiple sliders before the tool is applied
then uncheck Enable Sliders, adjust the controls then press Apply.
Reset is used to return the color sliders to their default position of no change in Lab Mode or RGB mode.
Reset All is used to return all controls to their default position of no change in Lab mode and RGB mode.
Apply is used to apply the current setting to the current image. Press Done or the X at the top right of
the tool to close the tool.
Selective HSL Color Balance
The Selective HSL Color Balance tool is used to scale red, green, and blue in a hue, saturation, and
luminance range. The hue, saturation, and luminance range can be selected from the preset values in
the Color and Apply To Level list or selected from the image using the mouse.
Hue Range Selection The color spectrum bar in the middle of the tool is used to define the hue range. If
All Colors is selected as the hue range in the Color list then no hue range triangles appear under the
color spectrum bar as shown by the image above on the left. In this case Selective HSL Color Balance will
be applied to all pixels of an image the fall within the feathered luminance and feathered saturation
range specified by Min Apply, Max Apply, and Feather Range. If a hue range has been selected using the
Color list or the mouse then hue range triangles are displayed under the color spectrum bar as shown by
the above image on the right. The two inner black triangles define the hue range where the Selective
HSL Color Balance tool is applied at 100% opacity. The gray triangles on either side of the black hue
range triangles define the hue feather size. The triangles are moved using the mouse to refine the hue
range and feather size.
To select a hue range from an image choose Select Hue from the HSL Mode list. Three hue selection
options will appear under Image Select. Check Hue Range to select a hue range with no luminance and
saturation restriction, HL Range to select a hue and luminance range with no saturation restriction, or
HSL Range to select a hue, saturation, and luminance range then left click on the image. The hue range
will be set using the triangles under the color spectrum bar. The luminance range will be set using the
Min L Apply, Max L Apply, and L Feather Range sliders. The saturation range will be set using the Min S
Apply, Max S Apply, and S Feather Range sliders. The HSL Mode list is used to set the sliders to
Luminance or Saturation mode so that the values can be modified. See Figure 32.
Select Luminance in the HSL Mode list to set the sliders to luminance mode. The Min L Apply and Max L
Apply sliders define the luminance range [min apply value, max apply value] where Selective HSL Color
Balance is applied at 100% opacity. The L Feather Range slider is used to define the feather radius for
pixel values less than the min L apply value and greater than the max L apply value. For example,
suppose min L apply is set to 7500 and max L apply is set to 32000 with L feather radius of 1500 then
Selective HSL Color Balance is applied at 100% in the luminance range [7500, 32000]. Selective HSL Color
Balance is not applied at pixel values less than 6000 = 7500 – 1500 or greater than 33500 = 32000 +
1500. Selective HSL Color Balance is applied from 0% to 100% as pixel values increase from 6000 to 7500
and as pixel value decrease from 33500 to 32000.
Figure 32 Luminance mode is shown in the left with saturation mode on the right.
The Min L Apply and Max L Apply values in Figure 32 can be set by a left click on an image. To select Min
L Apply or Max L Apply using the mouse check the box to the left of Min L Apply or Max L Apply then
click on the image. Check the L Range bow then left click on an image to set both Min L Apply and Max L
Apply.
The Apply To Level list can also be used to set the luminance range controls to preset All Levels, Dark,
Mid-tone, or Light. The preset luminance range can then be modified by moving the Min L Apply, Max L
Apply, or L Feather Range sliders.
Select Saturation in the HSL Mode list to set the sliders to saturation mode. The Min S Apply and Max S
Apply sliders define the saturation range [min apply value, max apply value] where Selective HSL Color
Balance is applied at 100% opacity. The S Feather Range slider is used to define the feather radius for
pixel values with saturation less than the min S apply value and greater than the max S apply value. For
example, suppose min S apply is set to 0.25 and max S apply is set to 0.75 with S feather radius of 0.20
then Selective HSL Color Balance is applied at 100% in the saturation range [0.25, 0.75]. Selective HSL
Color Balance is not applied at pixel values with saturation less than 0.05 = 0.25 – 0.20 or greater than
0.95 = 0.75 + 0.20. Selective HSL Color Balance is applied from 0% to 100% as pixel saturation values
increase from 0.05 to 0.25 and as pixel saturation value decrease from 0.95 to 0.75.
The Min S Apply and Max S Apply values in Figure 32 can be set by a left click on an image. To select Min
S Apply or Max S Apply using the mouse check the box to the left of Min S Apply or Max S Apply then
click on the image. Check the S Range box then left click on an image to set both Min S Apply and Max S
Apply.
Note that a pixel must satisfy the feathered hue, feathered luminance, and feathered saturation range
constraints otherwise Selective HSL Color Balance will not be applied at the pixel.
Selective HSL Color Balance can be used with a mask using the same steps as shown above in the
Additive Color Balance tool and also in the mask tools section of the Layers, Blend Modes, Opacity, and
Mask chapter of the ImagesPlus concepts and user manual.
A mask created using the Selective Color Mask tool has all of the hue, saturation, and luminance
selection contained in the Selective HSL Color Balance tool and also allows additional processing like
smoothing, curves, and painting to help refine the area where the mask is applied. The Custom
Luminance Mask and other masks tool offer additional options for making masks.
Preserve Luminance automatically moves the other two colors in the opposite direct as the color slider
being adjusted.
If Lock Image is checked when the tool is applied to an image then the tool will always be applied to the
same image until the image is closed or Lock Image is unchecked. This option is used to apply the tool to
the same image without selecting the image when multiple images are open.
If Tool All Images is checked then the tool will be applied to all open images that are compatible with the
tool.
Enable Sliders is used to control the automatic application of the tool. If checked then the tool will be
applied after each change in a sliders or triangle. If you want to adjust multiple controls before the tool
is applied then uncheck Enable Sliders, adjust the controls then press Apply.
Reset is used to return the hue, saturation, and luminance range for a given color in the Color list to their
default position of no change.
Reset All is used to return all controls for all selections in the Color list to their default position of no
change.
Apply is used to apply the current setting to the current image.
Press Done or the X at the top right of the tool to close the tool.
Hue-Saturation-Luminance
The Hue-Saturation-Luminance tool is used to rotate hue and adjust luminance and saturation in RGB
mode or Lab mode. Only a hue range can be selected using the Hue-Saturation-Luminance tool. If a hue,
saturation, and luminance range is required then a selective HSL color mask can be assigned using the
same steps as shown above with the Additive Color Balance tool.
Hue selection and rotation requires two color spectrum bars. The Map From color spectrum bar does
not change and is used as a color reference. The Map To color spectrum bar can be rotated using the
Hue slider and also has black and gray triangles that define a hue range as described above in the
Selective HSL Color Balance tool. Saturation is increased or decreased in the selected hue range by
moving the saturation slider to the right or left, respectively. Luminance is increased or decreased in the
selected hue range by moving the luminance slider to the right or left, respectively. See Figure 33 for an
example of hue rotation of all colors and Figure 34 for an example of hue rotation in a hue range with
luminance and saturation adjustment.
Figure 33 The Hue slider is moved to rotate all hues. The hue in the Map From spectrum bar is mapped
to the hue straight above it in the Map To spectrum bar. In this case all hues are rotated and all pixels
are effected by the Luminance and Saturation sliders.
Figure 34 A hue range can be selected using the Color list box or from an image. Check the Select Hue
From Image box then left click on an image to set the hue range triangles. Move the Hue slider to the
color on the Map From spectrum bar to rotate the selected hue. Saturation is decreased and luminance
increased in the rotated red hue range at top center.
Figure 35 The reds in the image on the left are selected by checking the Select Hue From Image box then
left-click on the red at the top of the Crescent nebula. The Hue slider is moved to the right to rotate red
to yellow in the red hue range. Blue is outside of the red hue range so blue, cyan, and green are not
changed by the hue rotation, saturation, or luminance sliders.
Check Lab Mode to switch from RGB to Lab mode.
If Lock Image is checked when the tool is applied to an image then the tool will always be applied to the
same image until the image is closed or Lock Image is unchecked. This option is used to apply the tool to
the same image without selecting the image when multiple images are open.
If Tool All Images is checked then the tool will be applied to all open images that are compatible with the
tool.
Enable Sliders is used to control the automatic application of the tool. If checked then the tool will be
applied after each change in a slider or triangle. If you want to adjust multiple controls before the tool is
applied then uncheck Enable Sliders, adjust the controls, then press Apply.
Reset is used to return the hue, saturation, and luminance range for a given color in the Color list to their
default position of no change.
Reset All is used to return all controls for all selections in the Color list to their default position of no
change.
Apply is used to apply the current setting to the current image.
Press Done or the X at the top right of the tool to close the tool.
HSL Micro Curves
The HSL Micro Curves tool is used to apply a curve to a hue, saturation, and luminance range. The
selection of the HSL range is the same as described above for the Select HSL Color Balance tool. A pixel
must satisfy the feathered hue, feathered luminance, and feathered saturation range constraints
otherwise HSL Micro Curves will not be applied at the pixel. HSL Micro Curves can also be used with a
mask.
A mask created using the Selective Color Mask tool has all of the hue, saturation, and luminance
selection contained in the HSL Micro Curves tool and also allows additional processing like smoothing,
curves, and painting to help refine the area where the mask is applied. The Custom Luminance Mask
and other masks tool described in the Layers, Blend Modes, Opacity, & Masks chapter offer additional
options for making masks.
If no hue range is selected then the color spectrum bar will have no black and gray triangles under it and
the min max luminance and saturation controls will be applied to all colors.
In order to select a hue range from an image using the HSL selection tools built into HSL Micro Curves
follow these steps.
Figure 36 In the HSL Mode list choose Select Hue. Check the Hue Range box to select only a hue range at
a point in an image and leave the luminance and saturation constraints set to all values. Check the HL
Range box to select both a hue range and luminance range and leave the saturation constraint set to all
values. Check the HSL Range box to select a hue, saturation, and luminance range at a point in an image.
In the above image HSL is checked so that the saturation of the bright pink area in the center of M27 can
be increased.
Figure 37 Left click on the bright pink area with low saturation in the center of M27 to select it as the
HSL range. The hue range triangles now mark a red hue range and the luminance range sliders are set to
the bright range of the pink area.
Figure 38 Set HSL Mode to Saturation Curve to see the saturation constraint of the bright pink area with
low saturation. The saturation Min S Apply and Max S Apply are set to the low saturation range of the
pink area.
Figure 39 Increase the saturation in the low saturation pink area using the curve. Left click and drag a
red control dot of the curve to change the shape of the curve. To change the position of the lowest
saturation shown by the black dot left click on the left vertical side of the green grid above the black dot.
The position of the highest saturation marked by the white dot can be changed by a left-click on the
right vertical side of the green grid.
The HSL range built into the HSL Micro Curves tool works well for small changes to an image. The
boundary of the HSL range can become difficult to blend into the image is a large luminance or
saturation change is applied. In this case use a selective color mask with HSL Micro Curves as shown
below for additional control of the HSL range.
Figure 40 The Selective Color Mask is used create a smoothed mask of the low saturation pink area in
the center of M27. The Save As – Copy Mask button is used to name the mask and set it as the current
system mask.
Figure 41 The low saturation pink mask is used with HSL Micro Curves to perform a larger increase in
saturation since the mask has been smoothed. The mask is assigned to HSL Micro Curves as described
above in the Additive Color Balance tool section.
If Lock Image is checked when the tool is applied to an image then the tool will always be applied to the
same image until the image is closed or Lock Image is unchecked. This option is used to apply the tool to
the same image without selecting the image when multiple images are open.
If Tool All Images is checked then the tool will be applied to all open images that are compatible with the
tool.
Enable Drawing is used to control the automatic application of the tool. If checked then the tool will be
applied after each change in a curve or sliders. If you want to adjust multiple sliders or curves before the
tool is applied then uncheck Enable Sliders, adjust the controls and press Apply.
Reset is used to return the curves, hue, saturation, and luminance range for a given color in the Color list
to their default position of no change.
Reset All is used to return all controls for all selections in the Color list to their default position of no
change.
Apply is used to apply the current setting to the current image.
Press Done or the X at the top right of the tool to close the tool.
Image files used in this chapter are available at Color Models and Color Tools Image Files.
First edition 9/22/14
Last update 9/24/14
Copy Right © Mike Unsold
[email protected]
www.mlunsold.com