1
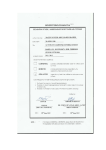
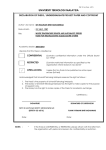
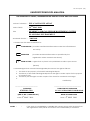
PSZ 19:16 (Pind. 1/07)
UNIVERSITI TEKNOLOGI MALAYSIA
DECLARATION OF THESIS / UNDERGRADUATE PROJECT PAPER AND COPYRIGHT
Author’s full name :
EZLA NAJWA BTE AHYAT
Date of birth
:
29TH MAY 2010
Title
:
HUMIDITY AND GAS SENSOR MONITORING SYSTEM
IN AN IDEAL ENVIRONMENT
Academic Session :
2009/2010
I declare that this thesis is classified as:
CONFIDENTIAL (Contains confidential information under the Official Secret
Act 1972)*
RESTRICTED
(Contains restricted information as specified by the
organisation where research was done)*
/
OPEN ACCESS I agree that my thesis to be published as online open access
(full text)
I acknowledged that Universiti Teknologi Malaysia reserves the right as follows :
1. The thesis is the property of Universiti Teknologi Malaysia.
2. The Library of Universiti Teknologi Malaysia has the right to make copies for the purpose
of research only.
3. The Library has the right to make copies of the thesis for academic exchange.
4.
Certified by:
___________________________
SIGNATURE
870529-01-5210
(NEW IC NO. /PASSPORT NO.)
th
Date: 4
NOTES :
*
MAY 2010
________________________________
SIGNATURE OF SUPERVISOR
PUAN FATIMAH BINTI MOHAMAD
NAME OF SUPERVISOR
th
Date : 4
MAY 2010
If the thesis is CONFIDENTIAL or RESTRICTED, please attach with the letter from
the organisation with period and reasons for confidentiality or restriction.
I declare that I have read this work and in my opinion this work is adequate in terms
of scope and quality for the purpose of awarding a Bachelor‘s Degree of
Engineering (Electrical -Telecommunication)
Signature : …………………………………..
Name : PUAN FATIMAN BINTI MOHAMAD
Date : 4TH MAY 2010
HUMIDITY AND GAS SENSOR MONITORING SYSTEM IN AN IDEAL
ENVIRONMENT
EZLA NAJWA BTE AHYAT
A report submitted in partial fulfillment of the
Requirements for the award of the degree of
Bachelor of Engineering (Electrical-Telecommunication)
Faculty of Electrical Engineering
Universiti Teknologi Malaysia
MAY 2010
ii
I declare that this thesis entitled ―Humidity and Gas Sensor Monitoring System in an
Ideal Environment‖ is the result of my own research except as cited in the references.
This thesis has not been accepted for any degree and is not currently submitted in
candidature for any other degree.
Signature : ………………………………….
Name : EZLA NAJWA BTE AHYAT
Date : 4TH MAY 2010
iii
To my beloved father, mother, sister and brothers….
iv
ACKNOWLEGDEMENT
In the Name of ALLAH, the Most Gracious and the Most Merciful
First and foremost, I would like to thank Allah because for His bless and guidance, I
finally finished my final year project successfully.
Furthermore, I would like to thank a lot to my dearest family especially my mom and
dad who give me a lot of love and spirit to finish this project till the end.
I would also like to thank all my friends who gives me idea to solve problem occurs
in this project. I also like to thank my bighearted supervisor, Puan Fatimah Binti
Mohamad that has guided me from the beginning until it finished. This project
cannot be completed without her supervision and support.
Lastly, a big thanks to my group members, Faiz Asraf Saparudin, Siti Hasunah
Mohamad and Abdul Azim Abdullah for giving me good cooperation and idea to
finish this project together. Once again thank to all that helps me in this project.
May Allah bless you all.
v
ABTRACT
The awareness of air quality control for ideal environment will lessen the
risks of increasing environmental threats to public health. The relative humidity and
level of contaminants gaseous in the air should be monitored in order to achieve the
ideal environment. This project discussed the monitoring control system for sensing
humidity and contaminants gaseous in the air. Humidity sensor is a device to detect
the percentage of water vapor at a specific temperature in the air which was
measured as relative humidity. While, gas sensor is high sensitivity sensor detects
low concentrations of gaseous air contaminants. Development in sensor design leads
sensor as the main component used to monitor the two factors and microcontroller
features as the preferred choice for embedded system which ease the end user to
control the system operation. Furthermore, the control system is designed for
monitoring and alerting purposes in order to preserve environmental security and
condition. Buzzer will produce sounds when relative humidity and level of gaseous
are out of the specified range.
vi
ABSTRAK
Kesedaran terhadap kawalan kualiti udara untuk persekitaran ideal dapat
membantu mengurangkan risiko dan ancaman persekitaran terhadap kesihatan orang
awam. Kelembapan bandingan dan tahap gas-gas beracun di udara perlu dikawal
bagi mencapai persekitaran ideal. Projek ini membincangkan tentang
sistem
pantauan dan kawalan untuk kelembapan dan gas-gas beracun di udara. Sensor
kelembapan ialah alat yang digunakan untuk mengesan kandungan wap air di udara
pada suhu tertentu. Ia diukur dalam peratus kelembapan bandingan. Sementara itu,
sensor gas ialah pengesan yang sensitif bagi mengesan kewujudan gas–gas beracun
yang berketumpatan rendah. Kemajuan dalam bidang alat pengesan menyebabkan ia
terpilih untuk menjadi komponen utama bagi mengesan kedua–kedua elemen. Ciriciri mikropengawal akan memudahkan lagi pengguna untuk mengawal operasi
sistem. Selain itu, projek ini dilengkapi oleh sistem kawalan. Penggera akan
mengeluarkan bunyi jika elemen di luar julat dalam spesifikasi bagi mengawal
keselamatan dan keadaan persekitaran.
vii
TABLE OF CONTENTS
CHAPTER
1
TITLE
PAGE
DECLARATION OF THESIS
ii
DEDICATION
iii
ACKNOWLEDGEMENT
iv
ABSTRACT
v
ABSTRAK
vi
CONTENTS
vii
LIST OF FIGURES
x
LIST OF TABLES
xii
INTRODUCTION
1.1 Background of Study
1
1.2 Problem Statement
3
1.3 Objective of Project
4
1.4 Scope of Project
4
1.5 Outline of Thesis
5
1.6 Methodology
6
1.7 Summary of Work
7
viii
2
LITERATURE REVIEW
2.1 Introduction
8
2.2 Humidity and Gas Sensor
Monitoring System
8
2.3 Definition of Parameters Humidity
10
2.4 Humidity
10
2.5 Contaminants Gaseous
12
2.6 Ideal Environment Standard
13
2.7 Sensor and Instrumentation
13
2.7.1 Humidity Sensor
14
2.7.2 Gas Sensor
16
2.7.3 40-pins PIC Start-up Kit
17
2.8 PIC Microcontroller
18
2.8.1 PIC18F452
18
2.9 Programming Tools
20
2.9.1 MikroC Software
20
2.9.2 PIC Kit Programmer
22
2.9.3 Inter-Integrated Circuit
22
Serial Communication
3
2.10 Indicator
23
2.11 Components
25
METHODOLOGY
3.1 Introduction
26
3.2 Research In Phases
27
3.3 Approches
28
3.4 Phase 2: Designing Sensor Node
29
3.4.1 Humidity Sensor (HSM-20G) 29
ix
3.4.2 Gas Sensor
30
3.4.3 Hardware of Humidity and
32
Gas Sensor
3.5 Phase 3: Software
3.5.1 Humidity Sensor
33
33
Programming
3.5.2 Gas Sensor Programming
35
3.5.3 Programming for I2C
38
3.6 Component List and Cost
4
5
39
RESULT AND DISCUSSION
4.1 Introduction
40
4.2 Project Description
41
4.3 Project Result
41
4.4 Project Discussion
45
CONCLUSION AND RECOMMENDATION
5.1 Introduction
46
5.2 Conclusion
46
5.3 Recommendation
47
REFERENCES
48
APPENDICES
Appendix A -HSM-20G User Manual
50
Appendix B – TGS 2600 User Manual
52
Appendix C – PIC18F452 User Manual
54
x
LIST OF FIGURES
FIGURE NO
1.1
TITLE
Block Diagram of Humidity and Gas Sensor
PAGE
5
Monitoring System in an Ideal Environment
1.2
Gantt Chart of the Project Schedule for Semester 1
6
1.3
Gantt Chart of the Project Schedule for
6
Semester 2
2.1
Relative Humidity in Percentage
11
2.2
Humidity Sensor Model HSM 20-G
14
2.3
HSM 20-G Connection
14
2.4
TGS 2600-Detection of Contaminants Gaseous
16
2.5
PIC18F452 pins
19
2.6
Programming Diagram Flow
21
2.7
Inter-Integrated Circuit Bus
23
2.8
Light Emitting Diode
23
2.9
16x2 Character LCD Display
24
2.10
Buzzer
24
3.1
The Methodology Approaches
28
3.2
Circuit for Humidity Sensor
29
3.3
Bottom View of Gas Sensor
31
3.4
Gas Sensor Connection
31
3.5
Strip Board Design
32
3.6
Source Code for Humidity Sensor
35
3.7
Gas Sensor Sensitivity Characteristic
37
3.8
Source Code of Gas Sensor
38
3.9
Source Code for I2C Unique Address
38
xi
4.1
Block Diagram of Whole Project
41
4.2
The Major Connection of Component
42
4.3
Complete Hardware of Humidity and Gas Sensor
43
Monitoring System
4.4
Humidity and Gas reading
43
4.5
Enabled/Disabled Buzzer
44
4.6
Status of Each Sensor
44
xii
LIST OF TABLES
TABLE NO
TITLE
PAGE
2.1
Parameters specification in Ideal Environment
13
2.2
Humidity Sensor Connection
15
2.3
Extra Features and Applications of HSM20-G
15
2.4
Features and Application for TGS 2600
17
3.1
Humidity Sensor Specification
33
3.2
Gas Sensor Specification
36
3.3
List of Components and Cost
39
CHAPTER 1
INTRODUCTION
1.1
Background of Study
Environment gives significant impact in human daily live. Across the globe,
environmental issues are critically discussed due to the increase of awareness and
responsibility regarding the threats of environment towards public health [2]. Quality
of the air has significant relation with the quality of environment and weather. Since
ages, people have blamed bad weather for all type of ailments.
In this project, the objective scope has been focused into two factors that will
affect public which are percentage of humidity in the air and level of air
contaminants.
2
Humidity is defined as the amount of water vapor in the air and usually
measured in term of Relative Humidity (%RH). Percentage of Relative Humidity is
best described as amount of moisture in the air and compared to amount the air can
hold at that temperature.
While, air contaminants can be categorized as compounds that may pollute
the air. With reasons, some contaminants are group into several specific categories
based on the level of contaminants affecting public health. It can be expressed in
term of sensor resistance ratio (RS/RO).
In accordance with this phenomenon where awareness of the importance of
air quality control is increasing, this project encourages public to be alert with the
environment they live in. It gives advantage to people who are concern about their
health and put efforts in monitoring the environment affected by humidity and
contaminants gaseous.
The proper controlled system with continuous and automatic monitoring are
the criteria needed to ease the end user. The advantage of this system when it is
completed with alarm system is the ability to communicate with multi
microcontroller and back-up control system in case of any failure. Besides, this
simple system can be applied in various implementations with some alteration
especially indoor. Thus, current technologies development and microcontroller may
reform the control and operation systems. Development in electronics, the increase
reliability of sensor and instrument help monitoring equipment which maintains the
parameter.
3
1.2
Problem Statement
.
The awareness of air quality control for ideal environment will lessen the
risks of increasing environmental threats to public health. The relative humidity and
level of contaminants gaseous in the air should be monitored in order to maintain an
ideal environment. The common problem results by humidity such as dampness,
dryness and condensation in surroundings cause discomfort and various problems to
public. While, for contaminants gaseous the effect of it existence is obviously gives
severe pollution and adverse consequences to public.
A recent development in automated control system has increase the demand
of various kinds of sensors. Humidity and contaminants gaseous are very common in
the environment. Control and measurement of these elements is important not only to
avoid discomfort but for broad range of industries.
Maintaining good environment quality is essential to closed space system as
poor air quality will rapidly reduce health, fitness, living quality and productivity.
Hence, monitoring on continuous basis is a must because it tends to significantly
give huge effect when readings are out of specified range.
In order to ensure energy efficient and optimized results, proper controlled
system need to be designed. The intelligence of current technologies is applied to
revolutionize the system.
Development in sensor design lead sensor as main
component used to monitor some of the parameters and microcontroller features
make it preferred choice for embedded control to ease the end user to control the
parameters, control devices and system operation.
4
1.3
Objectives of Project
The objectives of the project are to:
1.
Receive sensing data (physical condition) from analog sensor.
2.
Able the communication between microcontroller via inter- integrated
circuit (I2C).
3.
Activate alert system when result is out of specification.
1.4
Scope of Project
The scope of this project is to study, investigate and understand humidity and
gas sensor monitoring system in an ideal environment. The scope involved:
1.
Review on sensor node study for monitoring system and comparison
study.
2.
3.
Designing sensor node
a.
Component needed
b.
Arrangement of component on the strip board
Designing programming for microcontroller
a.
Controlling data acquisition in microcontroller
b.
Programming for interfacing the module and sensor
4.
Microcontroller communication set up.
5.
Alerting system when the parameter is out specification.
5
Figure 1.1: Block Diagram of Humidity and Gas Sensor Monitoring
System in an Ideal Environment
1.5
Outline of Thesis
CHAPTER 1.0: This chapter commences with an introduction of humidity
and gas sensor monitoring system and automated control system.
CHAPTER 2.0: This chapter focused on literature review presenting up to
data findings and useful theoretical definitions and conventions. Besides, research
related to project is reviewed.
CHAPTER 3.0: This chapter focuses on the exact steps to be undertaken to
complete the project. Hardware design and the development of operating system will
be examined.
CHAPTER 4.0: Full system and the results from the performed project will
be discussed in detail.
6
CHAPTER 5.0: Finally, review and summary of project‘s findings will be
concluded in the thesis. Recommendation for future development will be included.
1.6
Methodology
Figure 1.2: Gantt Chart of the Project Schedule for Semester 1
Figure 1.3: Gantt Chart of the Project Schedule for Semester 2
7
1.7
Summary of Work
This project flows from the sensing data of humidity and gas sensor. Analog
sensor is used and will indicate as voltage in output. Both sensors are interfaced to
microcontroller (PIC18f452) and sensing data is displayed in LCD (2x 16
characters). The sensors will work based on the programming in the microcontroller
and able to communicate with master controller as the backup monitoring system if
any failure happens. Alert system is designed and will produce alarm when sensing
data out of the specified range.
CHAPTER 2
LITERATURE REVIEW
2.1
Introduction
This chapter will focused on the definition of whole concept of monitoring
control system and further details regarding it. Explanation on microcontroller,
sensor and other instrumentation were discussed. Related software was determined.
2.2
Humidity and Gas Sensor Monitoring System
Nowadays, the environment is polluted with so many elements which are hazardous
to human. The most significant pollution is air pollution where the air that human
breathes will directly affect the health and living condition. Hence, drastic action
needs to be taken in order to resolve and prevent this problem.
9
Two most major elements which give significant effect towards environment
are air contaminants gaseous and humidity. There are many solutions created to keep
the right level of humidity and to detect the existence of contaminants gaseous.
However, alternative system can be design to solve or regulate the value as to
minimize the effect of these two elements. The automated monitoring control system
was designed to overcome this problem and this system will ease the end user.
Furthermore, the project was designed with alert system where alarm was
produced when sensing data are out of the required specification range.
Communication between microcontrollers was set up via inter-integrated circuit
(I2C). Slave mode was activated only if its internal address matches the value sent
by the master controller. The transferred sensing data is depending on the master
acknowledgement.
In conjunction with that, the main key for closed system aquaculture in this
thesis is the control system which monitors and regulates the entire main
environment discussed.
10
2.3
Definition of Parameters
Humidity: The concentration of water vapor in the air. It can be expressed
by relative humidity, absolute humidity and specific humidity. This element depends
on the temperature and it gives adverse effect not only towards human health in fact
all life aspect.
Contaminants Gaseous: Undesired compound that consist of acid gaseous
which may cause or contribute to an increase in deaths or in serious illness, or which
may pose a present or potential hazard to human health.
2.4
Humidity
Malaysia is an equatorial country which experience uniform temperature and
high humidity level. Since ages, weather has been blamed for most types of ailment
experienced by human. Unfortunately, most of the public has neglected humidity as
one factor contributed to the scenario and worst, humidity actually can influence
human physically and mentally.
Based on Argentina study, high humidity plays a key-role in human health
life. High humidity contributed to some serious disease as listed below [4]
1)
Osteoarthritis and Rheumatoid Arthritis
2)
Asthma
3)
Fatigue
11
Researchers concluded that it is difficult to draw definitive conclusions
between arthritis and humidity.
However, some clear up has been made and
declared as true which is arthritis patients might be more physically sensitive to
humidity changes. It affects arthritis symptoms rather than cause of arthritis.
Nevertheless, researches have strong agreement towards the reason why hot,
humid days cause fatigue. Likewise daily activities like washing, steaming, and
drying wet clothes can also contribute to high moisture levels in homes. Normally,
body perspires to cool down when temperatures are high. But if the humidity is also
high, body are trapped in a moist environment where sweat cannot evaporate and
escape from skin. These causes expend extra energy, which can leave the body
feeling sluggish or fatigued. Furthermore, alertness and mental capacity may also be
affected.
In this thesis, humidity will be expressed as relative humidity (RH) which is
determined as ratio of the current vapor pressure of water in air to the equilibrium
vapor pressure, where the gas are saturated at certain temperature. It is represented as
a percentage. Equivalently, it is the ratio of the current mass of water per volume of
gas and the mass per volume of a saturated gas.
Figure 2.1: Relative Humidity in Percentage
12
2.5
Contaminants Gaseous
Air contaminants give huge impact to the level of human health and directly
affected human through the mixture of gaseous that human breath in. air
contaminants including gaseous, liquid or solid state which emitted from many
sources in industry, mining, transportation, electricity generation and agriculture.
Examples of contaminant gaseous are Methane, Carbon Monoxide, Isobutane, Ethanol and Hydrogen. However, in daily routines human are always
exposed and poisoned by Methane and Carbon Monoxide resulting from cigarette
smoke and fuel combustion of vehicle. These results the suffering respiratory
system, hospitalization for heart and lung disease, asthma, and even premature death.
However, this thesis focused on indoor contaminant gaseous as these gaseous
are two to five times polluted than outdoor. This phenomenon happen when outdoor
air contaminants is allowed to bypass filters(indoor area), potentially disrupt the
balance and permit the introduction of excess moisture if access is not controlled. It
can be monitored by using monitoring control and solved by proper design of
Heating, Ventilation and Air-Conditioning (HVAC) Systems [10].
Air Contaminants will be determined as sensor resistance ratio (Rs/Ro) which
indicates as:
Rs: Sensor resistance in displayed gaseous at various concentrations
Ro: Sensor Resistance in fresh air
13
2.6
Ideal Environment Standard
Table 2.1 shows the specified range for these two elements. All the
parameters should follow this specification in order to maintain air quality in a
closed system.
Table 2.1: Parameters Specification in Ideal Environment
2.7
Parameters
Specification
Humidity
65-85 (%RH)
Gas
0.3-0.6 (Rs/Ro)
Sensors and Instrumentation
To design reliable control system for Humidity and Gas Senor
Monitoring System in an ideal environment suitable components, instrument, sensors
programming design are needed. Presently, there are many new developments in
electronics that have lead success in designing monitoring system [5].
14
2.7.1
Humidity Sensor
Humidity sensor is a devise consisting of a special plastic material whose
electrical characteristic change according to the amount of humidity in the air.
Basically, this sensor senses the amount of water vapor in air. For this project,
analog input sensor was used. HSM 20-G is essential for the objectives and
applications where the reading in terms of Relative Humidity was converted into
standard voltage output.
Figure 2.2: Humidity Sensor Model HSM 20-G
Figure 2.3: HSM 20-G Connection
Based on Figure 2.2 the connection of HSM 20-G is defined as:
15
Table 2.2: Humidity Sensor Connection
Label
Description
VCC
Power supply to the sensor
GND
The Ground of the sensor.
Humidity Output
The analog output for
sensor(humidity)
Sensor For Humidity
The sensor to sense humidity
4-pin Header
The connector to the cable which
connect to microcontroller circuit.
HSM20-G is complete with extra features and applications included
as
below:
Table 2.3: Extra Features and Applications of HSM20-G
Applications
1. Humidifiers and Dehumidifiers
Extra Features
1. Small size makes it easy to conceal
and suit current miniaturization
product.
2. Air-conditioner
2. Compatible with all types of
microcontroller makes it reduces the
complexity of interfacing
3. Humidity data loggers
3. Very high sensitivity to humidity
in the air and makes it reliable.
4. Automotive climate control
4. Voltage analog output
16
2.7.2
Gas Sensor
The sensing element compromised of a metal oxide semiconductor formed on
an alumina substrate of a sensing chip together with an integrated heater. In the
presence of detectable contaminant gas, the sensor‘s conductivity increases
depending on the gas concentration in the air. A simple electrical circuit can convert
the change in conductivity to an output signal which corresponds to the gas
concentration.
The TGS 2600 has high sensitivity to low concentrations of gaseous air
contaminants such as hydrogen and carbon monoxide which exist in cigarette smoke.
The sensor can detect hydrogen at a level of several parts per million (ppm). Due to
miniaturization of the sensing chip, TGS 2600 requires a heater current of only
42mA and the device is housed in a standard TO-5 package.
Figure 2.4: TGS 2600-Detection of Contaminants Gaseous
17
There are few extra features and application of TGS 2600 shown in Table
2.4.
Table 2.4: Features and Application for TGS 2600
Features
Applications
Low power consumption
Air cleaners
High sensitivity to gaseous air
Ventilation control
contaminants
Long life and low cost
Air quality monitors
Small size
Uses simple electrical circuit
2.7.3
40 pins PIC Start-Up Kit
A low cost and yet enhanced technology for save development and soldering
time. It is designed to offer an easy to start board for PIC MCU user.
This
board
comes with basic element for user to begin project development. It is compact,
powerful, flexible and robust start-up platform.
18
2.8
PIC Microcontroller
Many related computer systems especially in engineering field used
microcontroller. The design learning process for beginner can be discovered in many
reliable resources making a user friendly component. By using microcontroller,
different methods can be implemented in order to find a solution depending on user‘s
creativity [3].
Generally there are many reasons microcontroller is chosen as the brain of
the system. It is due to the low cost, small packaging, low power consumption,
reprogrammable, easy integration with custom circuits and compatible to software
development and debugging tools.
In this project, microcontroller will act as the main component in embedded
system because of it multi-tasking capabilities, processing data and the ability to
control the functionality of other device.
2.8.1
PIC18F452
PIC18F452 is chosen due to it characteristic that is suitable to this project
application. Based on the data sheet, this microcontroller has 32kb internal flash
program memory which is reprogrammable and suitable for prototyping. Besides
that, it compatibility to use the same source code with the PIC16 and PIC17
instruction sets makes the references broaden. This PIC included with internal 10 bit
Analog-Digital converter that allows the converting process of analog data from
sensors into digital signal.
19
Other brilliant features of PIC18F452 have 75 instruction sets need to be
learn and low power, high speed FLASH/EEPROM technology. This chosen PIC
consist of up to 33 general purpose I/O pins with port A,B,C,D,E that will reduce the
complexity of the system which is suitable for the beginner.
There are also peripheral features that enable the communication between
PIC and other devices including Synchronous Serial Port (SSP) with SPI(Master
mode) and I2C(Master/Slave) and Universal Synchronous Asynchronous Receiver
Transmitter (USART/SCI). Furthermore, PIC18F452 is compatible 10-bit Analogto-Digital Converter module (A/D) with fast sampling rate and conversion available
during SLEEP suits the demand of this project [14].
Figure 2.5: PIC18F452 Pins
20
2.9
Programming Tools
I.
PIC is programmed by using MikroC software.
II.
Program written and convert into machine code.
III.
PIC is placed in special program a unit which is attached to the host
computer.
IV.
Program downloaded via PIC kit.
V.
PIC is placed in the application circuit.
2.9.1
MikroC Software
MikroC is powerful and user friendly C compiler for PIC microcontroller
form Mikroelektonika. This software program runs on a PC to build up applications
for PIC microcontroller families. It is called an Integrated Development
Environment, or IDE, because it provides a single integrated ―environment‖ to
develop code for embedded microcontrollers [13].
Furthermore, highly sophisticated IDE provides the power you need with the
simplicity of a Windows based point-and-click environment. MikroC is a powerful,
feature rich development tool for PICmicros. It is designed to provide the users with
the easiest possible solution for developing applications for embedded systems,
without compromising performance or control.
PIC and C fit together well because PICs are used widely over the world with
wide variety of applications while C, credited for its efficiency, is a natural choice
for developing microcontroller applications. MikroC provides a successful match
featuring highly advanced IDE, ANSI compliant compiler, broad set of hardware
21
libraries, comprehensive documentation, and plenty of ready to run example
programs. MikroC allows you to quickly develop and deploy complex applications:
I.
II.
Write C source code using the built-in Code Editor.
Use the included MikroC libraries to dramatically speed up the
development: data acquisition, memory, displays, conversions, and
communication.
III.
Monitor your program structure, variables, and functions in Code
Explorer.
IV.
Generate commented, human-readable assembly, and standard HEX
compatible with all programmers.
V.
Inspect program flow and debug executable logic with integrated
Debugger.
VI.
Get detailed reports and graphs on code statistics, and assembly
listing.
VII.
Debugger.
Figure 2.6: Programming Diagram Flow
22
2.9.2
PIC Kit Programmer
In order to load the program in the microcontroller, this software was used.
This software will load all program made into internal memory of PIC18F452. Once
the HEX file was created in MikroC, this file will then be loaded into PIC18F452
using PIC Kit2.
2.9.3
Inter-Integrated Circuit (I2C) Serial Communication
I2C interface one or more microcontroller and peripherals in
embedded system for example exchanging data with master controllers via single
connection (10). It has two active wires which are serial data line (SDA) and serial
clock line (SCL). These two buses will synchronize mater/slave communication by
using software.
I2C is suitable for communication between separate microcontroller
boards and provide simple hardware design but more complex in the software. Every
devices have it own unique address and can act as a receiver or transmitter
depending on the function. I2C is a multi master bus which indicates that more than
one ICs can initiate data transfer and called as Bus Master while other ICs as Bus
Slaves.
23
Figure 2.7: Inter-Integrated Circuit Bus
2.10
Indicator
1.
Light Emitting Diode (LED) - Device that act as receiver that
indicates sensor node and overall system is working by emitting low intensity light.
This semiconductor diode has lower energy consumption, longer lifetime, improved
robustness, smaller size and faster switching.
Figure 2.8: Light Emitting Diode
2.
Liquid Crystal Display (LCD) – An electronic display device which
has a flat panel display type commonly used in digital devices. In this project, LCD
will display the readings and measurement of parameters. LCD 2x 16 characters was
used.
24
Figure 2.9: 16x2 Character LCD Display
3.
Buzzer – Electronic device which is defined as audio signaling
device. Buzzer functioned as alert system and automatically produced sound when
reading is out of the specified range.
Figure 2.10: Buzzer
25
2.11
Components
Several extra components were used to design this project. All the listed
component is a compliment to both sensors in order to make it regulates reading and
measurement.
I.
Resistor ( 100kΩ and 47kΩ)
II.
Capacitor( 47µF)
CHAPTER 3
METHODOLOGY
3.1
Introduction
The project will be conducted in phases and explained in this chapter. This
chapter will give the sufficient detail of the exact steps which act as a
guidance in order to complete this project. The discussion continues with
specific block diagram which include the component that will be used to
complete the hardware parts. Lastly, this chapter shows the flow chart that
explained the whole system.
27
3.2
Research in Phases
Phase 1: Literature Review (Done in chapter 2)
i) Study the concept of Humidity and Gas Contaminants Monitoring
System.
ii) Review on sensor node study and comparison study.
iii) Study the related components.
iv) Study the related software.
Phase 2: Designing Sensor Node
i) Study the component that will be used.
ii) Finding sources regarding arrangement of component on the strip
board.
iii) Including designing hardware for I2C and alert system.
Phase 3: Designing Programming for Microcontroller
i) Controlling data acquisition in microcontroller.
ii) Programming for interfacing the module and sensor.
Phase 4: Thesis Writing
28
3.3
Approaches
29
3.4
Phase2: Designing Sensor Node
The most complicated part of designing a monitoring system is to design a
sensor node. Working an analog sensor demands high understanding on how and the
range sensor will operates. It involved two components for both sensors which is
hardware and programming interface. Most of the hardware part is given in the
datasheet while for programming, some important specification need to be extracted
from datasheet and reliable sources.
3.4.1
Humidity Sensor (HSM 20-G)
To enable this sensor to read the moisture/ water vapor in air is by focusing
on the connection part. Few things need to be considered such as the external circuit.
To make sure the relationship between humidity and voltage is linear, some
components were needed to build the desired circuit as in Figure 3.2.
Figure 3.2: Circuit for Humidity Sensor
30
In order to use this sensor, a connector cable was build to connect the sensor
to strip board. 4-pin header was connected to the circuit required such that:
I.
(-) pin connects to GND
II.
(+) pin connects to Vcc
H (humidity sensor) pin which included 47µF capacitor and 100KΩ
III.
resistor and connects to microcontroller‘s I/O pin. (to be set as ADC
mode)
IV.
T pin not included in this project as the reliability is arguable
To ensure the sensor works in the specified range, detailed programming
must be considered, since the sensor is sensitive towards vapor produced by
exhalation or heater. Refer to Appendix A.
3.4.2
Gas Sensor
Operation of gas the sensor is the same as the humidity sensor, but some
consideration needs to be taken in order to interface sensor with programming and
hardware. In this subtopic, most of the discussion is focused on hardware interfacing
part.
Figure 3.3: Bottom View of Gas Sensor
31
Gas sensor needs a voltage of 5V to operate and it resistances changes with
gas concentration and act as a potential meter. The connection of each pin is
determined as Figure 3.4. Some of specification is essential to continue with next
step which is programming part and react significantly with methane in the cigarette
lighter. Refer to Appendix B.
Figure 3.4: Gas Sensor Connection
32
3.4.3
Hardware of Humidity and Gas Sensor Monitoring System
After considering all the important software criteria, the flow of project
continues with the construction of hardware. The connection of sensor nodes and the
related component was built using strip board. Before components were placed, the
strip board design was sketched by using Strip board Designer 1.0.
Figure 3.5: Strip Board Design
This design work as a connection reference needed for hardware including
sensor node interfacing with microcontroller, I2C connection and alert system. Most
of the component in the designer does not represent the actual components due to the
software limitations. However, the main concern is the exact holes connection. By
following the layout, the complete design was soldered.
33
3.5
Phase 3: Software (Programming for Microcontroller)
This section will specifically discuss the methodology to interface the sensor
and hardware module. The most important part is to enable the analog sensor to
sense analog data and represent it in digital. It can be done with various techniques.
One of the reliable techniques is to produce a relation between the sensor analog
range and microcontroller analog to digital converter (ADC) specification. This
relation is based on some calculation and will be clearly explained in the next
section.
3.5.1
Humidity Sensor Programming for Microcontroller
For humidity sensor, the relation will be extracted from the datasheet and
focused on some specifications. The following calculation will clarify the process to
construct an equation for this sensor. Based on the datasheet of HSM-20G the
essentials information is given in Table 3.1. Refer to Appendix A.
Table 3.1: Humidity Sensor Specification
Number
Specification
Gas Sensor
1.
Input voltage range
DC 5.0±0.2 V
2.
Output voltage range
DC 1.0—3.0 V
3.
Storage RH Range
0 to 99% RH
4.
Operating RH Range
20 to 95%
(100% RH intermittent)
34
As mentioned before, PIC18F452 is 10 bit analog- to digital converter
microcontroller and based on the hardware, the real input voltage of humidity sensor
is 4.75 V.
Step 1:
Since the binary is 10-bit, it is equal to 210-1= 1023 steps or levels of
resolution.
4.75V is then divided into 1023.
Step 2:
The output voltage range is 1-3 V. Thus, it will represent as the reference
voltage
and microcontroller only read digital values from
≤ adc_read ≤
The differences of this step will be 431 steps
Step 3
The operating range of humidity sensor is 20-95% RH with 75% differences.
It
shows that at 20%RH the analog value is 1V while binary is 215 and at 95%
RH
the analog will be 3V while binary is 646.
Step 4
The humidity relation was then obtained as:
Step 5
Based on Table 2.1, the %RH will be limited to 80%RH which represented a
dangerous limit of humidity in the air and automatically set the alarm
systems.
35
Figure 3.6: Source Code for Humidity Sensor
3.5.2
Gas Sensor Programming for Microcontroller
For gas sensor, the relation will be extracted from the datasheet and focused
on some specifications. The following calculation will clarify the process to
construct an equation for this sensor. The main considerations for TGS 2600 are
shown by Table 3.2. Refer to Appendix B.
36
Table 3.2: Gas Sensor Specification
Number
Specification
Humidity Sensor
1.
Circuit voltage range
DC 5.0±0.2 V
2.
Sensor Resistance, Rs
10 k- 90k Ω in air
3.
Sensitivity(change ratio of Rs)
0.3-0.6
4.
Typical Detection Range
1-10 ppm of H2
The concept is still the same as previous but extra requirement needed to be
considered. Gas sensor is measured in term of the ratio between sensor resistance in
displayed gas and sensor resistance in fresh air (Rs/Ro). For TGS 2600, Ro is at the
range of 32.8- 39.6 kΩ.
The calculation involved for converting analog to digital values of gas sensor
will be based on the following steps:
Step 1:
Rs/Ro can be verified by using the formula given in the datasheet
As mentioned before the value of Rs will vary from 10-90 kΩ. Vout need to be
determined in order to find Rs.
Step 2:
The value chosen for Ro is 32.8 kΩ. This value meets some condition stated
at
the datasheet where at the gas detection range of 1-10 ppm, gas sensor will be
more sensitive when sensor resistance ratio is about 0.3-0.6 Rs/Ro. It can be
seen
clearly from Figure 3.7 provided in the datasheet (red line area).
The value of Rs is then divided with the chosen value of Ro
When Ro=32.8 kΩ
37
and
When Ro=39.6 kΩ
and
So, it can be conclude that the sensor resistance ratio is 0.30 which in the
range of 0.3-0.6 if Ro = 32.8 kΩ.
Figure 3.7: Gas Sensor Sensitivity Characteristic.
Step 3:
The last step will be the determination of Vout. Due to the 10 bit of analog to
digital converter in PIC18F452, the resolution of 4.75V will be
This equation will complete the finding of Rs which is
The value of RL is 47kΩ (stated in datasheet)
Step 4
Based on Table 2.1, the Rs/Ro will be limited to 0.35 represents a dangerous
limit of contaminant gaseous in the air and automatically set the alarm system.
38
Figure 3.8: Source Code of Gas Sensor
3.5.3
Programming for Inter-Integrated Circuit (I2C)
To enable the communication between this project and mastercontroller some programming need to be done. A unique address is created for slave
in order to communicate with master-controller. This communication is based on the
control, START and STOP signal by master while slaves simply listen to the bus and
react on controls and data sent depending on the unique address.
Figure 3.9: Source Code for I2C Unique Address
39
3.6
Component List and Total Cost
All the components used in this project are listed in order to finalize the total
cost. Table 3.3 will show the complete components along with each price per item.
Table 3.3: List of Components and Cost
No
Component
Price Per Unit
(RM)
Quantity
Price (RM)
1
Starter Kit Set
39.00
1
39.00
2
PIC18F452
35.00
1
35.00
3
HSM-20G
50.00
1
50.00
4
TGS 2600
46.00
1
46.00
5
PICUSB
programmer
49.00
1
49.00
6
Adapter
15.00
1
15.00
7
LCD(2x16
character)
25.00
1
25.00
8
Resistor
0.25
4
1.00
9
Capacitor
0.50
1
0.50
10
Strip Board
4.00
1
4.00
11
Jumper
4.00
12
LED
0.25
2
0.50
13
Buzzer
3.00
1
3.00
14
Connector
0.50
2 set
1.00
Total
4.00
273.00
CHAPTER 4
RESULT AND DISCUSSION
4.1
Introduction
This chapter explains about the result achieved in this project and few
discussions regarding on problem solving during the process of completing this.
Final project overview such as block and flow diagram were included.
41
4.2
Project Description
This project was based on the objectives stated before which is designing a
monitoring system for humidity and gas sensor (analog sensor). This sensor node
will sense analog data, convert and displayed into digital. Furthermore, this system
will enable 2-wire communication between devices which is I2C and complete with
alarm system. After all the phases were completed, the whole project can be
summarized as shown by Figure 4.1.
Figure 4.1: Block Diagram of Whole Project
4.3
Project Results
This project includes hardware and software parts. These two parts were
highly dependent where the success of the whole project involves the interfacing
between sensor nodes and programming of microcontroller.
The most critical element in designing hardware is to built up the component
connection. For the first attempt, circuit is set up at proto board based on the theory
gathered by some literature reviews done. This temporary circuit was use to make
42
sure the connection is working and to avoid errors. Then, the real connection was
sketch using Strip board Designer 1.0 and directly soldered at strip board shown in
Figure 4.2.
Figure 4.2: The Major Connection of Component
To continue with software part, some pins of the microcontroller were
defined in order to permit programming installation. The program was then written
by using C language, MikroC. MikroC is simple and flexible software that provides
information, basic tutorial and details libraries which makes it easier to be used. This
program was then installed to PIC18F452 by using PIC kit programmer.
Through programming, the flow of this system was created. Basically, this
project will sense humidity and contaminants gaseous in the air. The monitoring
system will continue working either in or out of the specified range. Based on the
programmed, it will automatically monitor, show values and conditions whether it is
danger or normal readings and finally produced alarm when the values were out of
specified range.
43
Figure 4.3: Complete Hardware of Humidity and Gas Sensor Monitoring
system
‗
By pressing reset button, the whole system will be reset and display both
humidity and gas sensor value. If a buzzer sound was generated, the sensor which is
out of range will be indicated by LED as shown as Figure 4.4.
Figure 4.4: Humidity and Gas Reading
44
To enable or disable buzzer, user have to push switch 1 as shown in Figure
4.5.
Figure 4.5: Enabled/Disabled Buzzer
Figure 4.6 shows the status of each sensor‘s reading. The user will have to
push switch 2. It will display normal (in range) or danger (out range) and to choose
displayed sensor, user have to push switch 2(work in toggle mode).
Figure 4.6: Status of each sensor
Additionally, the connection of I2C is set up, sensors will communicate or
transfers data if requested by master while sensing the data at the same time.
45
4.4
Project Discussion
No project will work without any mistakes and errors. To achieve this,
certain action was taken. The completed hardware for sensor monitoring was
checked by using continuity test. This is to ensure the connection done was accurate
and the project is working with the specification. The programming need to be
totally reviewed to ensure no bugs distracts the whole system.
CHAPTER 5
CONCLUSION AND RECOMMENDATION
5.1
Introduction
This section will conclude the whole project and future recommendations for
students or individual who is interested in continuing this project as their research.
5.2
Conclusion
Sensor technologies are developing fast with time and innovative
technology. This field is one of the most interesting area to be discovered
continuously. So many new sensor designs will come out and develop in future
hence increasing the competitiveness between researchers.
47
This project is a minor contribution to instill the interest of people. It also
gives a very basic understanding which will be a good learning process to the
beginner. The hardware and software part of this project is working based on the
objectives mentioned before and based on the conduct test or experiments held
towards the end this project, the results are stable and working as it should be.
5.3
Recommendation
Further research is recommended to improve the reliability of this
project especially in communication. This project use wired communication as the
medium to communicate due to some limitations of budget and the function which
requires no spacious and heavy communication. To improve it, a wireless
communication can be set up to broaden the ability of monitoring system
communication in spacious place and wide spectrum.
For further improvement, the research can add some features that
enable the master controller to control the sensing element. This is to guarantee there
is a reliable back-up system for this project if any emergency occurs. In addition, this
system was able to monitor and control air condition for various implementations
with some system alterations.
48
REFERENCES
1
Haines, E. J. (1987), Auto Control of Heating and Air Conditioning.
(2th ed.) London: McGraw Hill
2
Andersen, Ib. and Korsgaard, J. (1985), Sensory and Hypereactivity
Reactions and Their Significance to Public Health, National Institute
of Occupational Health, Copenhagen, Denmark
3
Wobschall , D (1979), Circuit Design for Electronic Instrument
Analog and Digital Devices from Sensor to Display. New York:
McGraw Hill
4
Nachatelo. M (July, 2002), Weider Publication: Gale Group
5
Shahen, A. (1988), Introduction to Sensor Systems. Norwood: Artech
House.
6
Shinskey, F. (1979), Humidity and Dryer Control. Foxbor, Mass
7
Harriman, K. (1995), Humidity Control Design Guide for Commercial
and
Institutional
Buildings.
American
Society
of
Heating,
Refrigerating, and Air Conditioning Engineers
8
Sakata, S. (2002), Removal of Gaseous Contaminants with
Various Kinds of Filters, Gaseous Contaminants: Inorganic
Contaminants, JPN. VOL.76;NO.10;PAGE.941-
9
950
Huadong, W. and Mel, S. Odor-Based Incontinence Sensor.
Carnegie Mellon University, Pittsburgh: IEEE
10
Rafal, L. and Tiina, R. ( 2002), Fungal Fragments as Indoor Air
Biocontaminants. Morgantown, West Virginia
11
Desiree, G. and Lena, K. ( 2005), Perceived Problems and Discomfort
at Low Air Humidity Among Worker. Occupational Health Care
Center, Perstorp Support AB, Perstorp, Sweden: IEEE
12
B.Martin, ―PIC Microcontroller‖, Elsevier Ltd: 2004
49
13
MikroC, C Complier for Microchip PIC Microcontroler.
Mikroelektronika User Manual.
14
Microchip, PIC18FXXX Data Sheet, Microchip Technology Inc:
2001
15
HSM-20G User Manual, Cytron Technologies
16
TGS 2600 Product Informatio, Figaro
17
H. Han-way, PIC Microcontroller: An Introduction to Software an
Hardware interfacing, Delmar Learning: 2005
50
APPENDIX A
HSM-20G USER MANUAL
51
52
APPENDIX B
TGS 2600 USER MANUAL
53
54
APPENDIX C
PIC18F452 USER MANUAL
55
56