1
POWER METER USING AVR MICROCONTROLLER
KUHENDRAN S/O RAVANDRAN
UNIVERSITI TEKNOLOGI MALAYSIA
PSZ 19:16 (Pind. 1/07)
UNIVERSITI TEKNOLOGI MALAYSIA
DECLARATION OF THESIS / UNDERGRADUATE PROJECT PAPER AND COPYRIGHT
Author’s full name :
KUHENDRAN A/L RAVANDRAN
Date of birth
12 JULY 1988
:
: POWER METER USING AVR MICROCONTROLLER
Title
Academic Session:
2011/2012
I declare that this thesis is classified as :
CONFIDENTIAL
(Contains confidential information under the Official Secret
Act 1972)*
RESTRICTED
(Contains restricted information as specified by the
organization where research was done)*
OPEN ACCESS
I agree that my thesis to be published as online open access
I acknowledged that Universiti Teknologi Malaysia reserves the right as follows:
1. The thesis is the property of Universiti Teknologi Malaysia.
2. The Library of Universiti Teknologi Malaysia has the right to make copies for the purpose
of research only.
3. The Library has the right to make copies of the thesis for academic exchange.
Certified by :
SIGNATURE
880712-56-6095
(NEW IC NO. /PASSPORT NO.)
Date : 29 JUNE 2012
NOTES :
*
SIGNATURE OF SUPERVISOR
EN. ZULFAKAR ASPAR
NAME OF SUPERVISOR
Date : 29 JUNE 2012
If the thesis is CONFIDENTAL or RESTRICTED, please attach with the letter from
the organization with period and reasons for confidentiality or restriction.
“I hereby declare that I have read this report and in my opinion this report is
sufficient in terms of scope and quality for the award of the degree
of Bachelor of Electrical Engineering (Electronics)”
Signature
:
………………………………
Supervisor’s Name
:
En. Zulfakar bin Aspar
Date
:
29 June 2012
POWER METER USING AVR MICROCONTROLLER
KUHENDRAN A/L RAVANDRAN
A report submitted in partial fulfilment of the
requirements for the award of the degree of
Bachelor of Electrical Engineering (Electronics)
Faculty of Electrical Engineering
Universiti Teknologi Malaysia
JUNE 2012
ii
I declare that this thesis entitled “Power Meter Using AVR Microcontroller” is the
result of my own research except as cited in the references. The thesis has not been
accepted for any degree and is not concurrently submitted in candidature of any other
degree.
Signature
:
....................................................
Name
:
Kuhendran S/O Ravandran
Date
:
29 June 2012
iii
Dedicated to my supportive parents for their sacrifice and inspiration,
To my siblings for their constant support,
To my scintillating lecturers and friends.
iv
ACKNOWLEDGEMENT
First and foremost, all praise to the Divine for the blessings and guidance that
I received to embark on this research project of mine. The author wishes his greatest
acknowledgement for those who contributed to the completion of this project and not
to forget En. Zulfakar bin Aspar for his guidance, advises, comments, and
encouragement which had contributed a lot to the completion of this project.
I also wish my greatest acknowledgement to my friends for their valuable
assistance and support as they are my confidence booster and they are the solutions
for the problems that I faced while constructing this project.
Last but not least, I would like to thank my parents for their blessing and love
as well as my sisters and brother for their constant support and encouragement.
v
ABSTRACT
Power consumption has been and still a major concern for energy
consumers. Appliance at home and workplace are powered by electricity supplied by
the electric utility company. The energy used is measured in kilowatt-hour. After
measuring the time that the energy is used cost is than calculated. There should be
awareness among energy consumers to monitor and save energy. Saving energy is
one way of saving the environment. Therefore, a simple device of energy or power
monitoring would help consumers to manage energy effectively. The design of this
power meter would include measuring circuit, the microcontroller and a display.
vi
ABSTRAK
Penggunaan kuasa yang telah dan masih menjadi kebimbangan utama bagi
pengguna tenaga. Perkakas di rumah dan tempat kerja dibekalkan oleh syarikat utiliti
elektrik.Tenaga yang digunakan diukur dalam kilowatt-jam. Selepas pengukuran
masa . tenaga yang digunakan, serta kos daripada dikira.Oleh itu, perlu ada
kesedaran di kalangan pengguna tenaga untuk memantau dan menjimatkan tenaga.
Penjimatan tenaga merupakan salah satu cara menyelamatkan alam sekitar. Oleh itu,
peranti mudah untuk memantau tenaga atau kuasa akan membantu pengguna untuk
menguruskan tenaga secara berkesan. Reka bentuk meter kuasa ini termasuk litar
pengukur, mikropengawal dan paparan LCD.
vii
TABLE OF CONTENTS
CHAPTER
1
2
TITLE
PAGE
DECLARATION
ii
DEDICATION
iii
ACKNOWLEDEGEMENTS
iv
ABSTRACT
v
ABSTRAK
vi
TABLE OF CONTENTS
vii
LIST OF FIGURES
x
LIST OF TABLES
xiii
LIST OF ABBREVIATIONS
xiv
INTRODUCTION
1.1
Research Background
1
1.2
Problem Statement
2
1.3
Objectives of Study
2
1.4
Scope of Study
3
LITERATURE REVIEW
5
2.1
Existing Products
5
2.2
Types of Power
6
2.3
Instantaneous Power
6
2.4
Active Power
7
2.5
Reactive Power
7
2.6
Apparent Power
8
viii
3
4
5
6
2.7
Power Factor
9
2.8
Power Measurement
9
2.9
Microcontroller
10
METHODOLOGY
13
3.1
Functional Block Diagram
13
3.2
Progress Flow
14
3.3
Voltage Sensing Circuit
17
3.4
Current Sensing Circuit
18
3.5
Interfacing with LCD
20
DEVELOPMENT PROCESS
23
4.1
Simulation Process
23
4.2
AVR Studio 5
25
4.3
Software Program Flowchart
26
4.4
PCB Design
32
4.5
AVR DUDE GUI
35
4.6
Troubleshooting
36
RESULTS AND DISCUSSION
37
5.1
Results
37
5.2
Discussions
44
CONCLUSION AND RECOMMENDATIONS
47
6.1
Conclusion
47
6.2
Recommendations
48
REFERENCES
49
ix
APPENDIXES
50
Appendix A
50
Appendix B
54
Appendix C
58
Appendix D
76
x
LIST OF FIGURES
FIGURE NO.
TITLE
PAGE
2.1
Available Power meters in the market
6
2.2
Power Triangle
11
3.1
Functional Block Diagram for the overall system
16
3.2
Design Procedure
18
3.3
Design Process
19
3.4
The Voltage Transformer and connection diagram
21
3.5
Shunt Resistor
23
3.6
Overall Circuit
24
3.7
Liquid Crystal Display
26
3.8
HD44780-based LCD kit
27
4.1
Proteus Simulation
29
4.2
AVR Studio 5 Interface
30
4.3
Program Initializations
32
xi
4.4
Cycle Service
34
4.5
Save Measurement
35
4.6
Timer and ADC initialization
37
4.7
PCB Schematic
38
4.8
PCB Layout
39
4.9
AVR Dude GUI
42
5.7
Output voltages versus input voltage for actual and
51
displayed voltage
5.8
Output current versus input current for actual and
52
displayed current
5.9
Output power versus input power for actual and
displayed power
53
xiii
LIST OF TABLES
TABLE NO.
TITLE
PAGE
2.3
Comparison Between Microcontrollers
13
5.1
Test Results for the Voltage Sensing Circuit
45
without Load
5.2
Test Results for the Current Sensing Circuit
without Load
5.3
46
47
Simulation test results for the Power Meter with
Load
Resistor(R), Inductor (L) and Capacitor(C)
5.4
Calculated results for the Power Meter with Load
48
Resistor(R),Inductor(L) and Capacitor(C) and
Average Error (%) compared with Table 5.3
5.5
Hardware test results of the Power Meter with Load
Resistor(R), Inductor (L) and Capacitor(C)
49
xiiii
5.6
Calculated results for the Power Meter with Load
Resistor (R), Inductor (L) , Capacitor (C) and
Average Error (%) compared to Table 5.5
50
xiv
LIST OF ABBREVIATIONS
AC
-
Alternate Current
DC
-
Direct Current
ADC -
Analog-to-Digital converter
Vin
-
Input voltage
Vo
-
Output voltage
RMS -
Root Mean Square
DC
Direct Current
-
Vp-p -
Peak-to-peak voltage
CHAPTER 1
INTRODUCTION
1.1
Research Background
Energy is an important physical element in our daily lives. Every moment we
live we consume and release energy. Nowadays world, energy consumption is very high.
As for this matter efforts have to be taken in saving energy consumption. Hereby,
question arises on what does ‘Energy Saving’ means. Energy saving or vice-versa is an
effort to plan and reduce energy in domestic usage. Furthermore, we should be aware on
the importance of energy saving. Our main concern in saving energy is that to reduce
pollution caused due to generating energy, for example burning coal to generate
electricity and car fumes causes air pollution. Besides that we can save water by saving
energy. Power stations use 2 liters of water for every unit of electricity (kWh) generated.
Furthermore we can save more money if we use less energy. In Malaysia most of
the energy consumed is by natural gaseous and electricity. So the best possible way to
reduce energy is by monitoring energy consumption in daily usage.
2
1.2
Problem Statement
Today, awareness of saving energy has been quite high due to the efforts taken
by the government and the authorities in reaching the public. These phenomena had
created a new path of business opportunity for tools and devices related to monitoring
and saving energy.
The existing products in the market in monitoring the electricity consumption
and its efficiency commonly known as Energy Meter or Power Meter are complex and
high at cost. Due to this problem it is not popular and well received in the market.
Furthermore, it is necessary for a tool or device to be user friendly. There are
Power Meters in the market that provides many functions, but its operation is hard and
difficult to be understood by the user.
Besides that, a tool or device should be compact and weigh less. These features
are an important trend to gain the market attention as it is more compatible and require
less space.
1.3
Objectives of Study
The main objectives of this project are to design a Power Meter using AVRATMEL microcontroller. To develop a hardware (PCB ) for the designed Power Meter
and finally the designed power meter should be able to measure voltage (Vrms) , current
(Irms) and active power (P) and power factor in single phase distribution environment.
3
1.4
Scope of Study
The scope of the project is that the designed Power meter operates with
single phase voltage source used is 230v 50 Hz freq. Furthermore, this Power
Meter can only measure one Channel at a time
1.5
Outline of Thesis
This report consists of 6 main chapters which are Introduction, Theory and
Literature Review, Research Methodology, Development Process, Result and
Discussion, and Conclusion and Recommendation. Chapter 1 which is Introduction
consists of research background, problem statement, objectives of study, and summary
of works and complete work plan. Meanwhile, Chapter 2 which is Theory and Literature
Review consists of literature review of the project. Next, chapter 3 discussed about the
Research Methodology of the project. Chapter 4 is about the Development Process
which includes problems faced and its solutions .Chapter 5 is explained about Result and
Discussion of the project. Finally, chapter 6 discussed about Conclusion and
Recommendation for the project.
4
CHAPTER 2
THEORY AND LITERATURE REVIEW
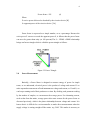
2.1
Existing Products
The most common Power Meter designs which are available in the market is the
Brands Electronic Digital Power Meter as shown in Figure 2.1 (a) .This meter is
comparatively large in size and not user friendly. Furthermore, the price range of this
product is USD$ 149- USD$349. This is expensive for domestic purpose use. The next
model as shown in Figure 2.1 (b) is the Kill-a-watt which costs USD $60.
5
(a)
(b)
Figure 2.1 Available Power Meters in the market
6
2.2
Types of Power
In the electrical power technology, the concept of active, reactive, and apparent
power creates a major impact. In electrical energy transmission it is often easier to
understand by working with power, rather than dealing with voltages and current.
The terms active, reactive, and apparent power apply to steady-state alternating
current circuits in which the voltages and currents are sinusoidal. They cannot be used to
describe transient-state behavior, nor can we apply them to do DC circuits.
Our study begins with an analysis of the instantaneous power in an AC circuit.
We then go on to define the meaning of active and reactive power. This is followed by a
definition of apparent power, power factor, and the power triangle.
2.3
Instantaneous Power
The instantaneous power supplied to a device is simply the product of
instantaneous voltage across its terminals times the instantaneous current that flows
through it. Instantaneous power is always expressed in watts, irrespective of the type of
circuit used. The instantaneous power may be positive or negative. A positive value
means that power flows into the device. On the other hand, a negative value indicates
that power is flowing out of device.
7
2.4
Active Power
Also sometimes known as real power, active power, P is the rate of energy
conversion or dissipation taken as an average of one or more complete cycles and it is
independent of time. Our main power distributor, Tenaga Nasional Berhad (TNB)
monitors this power in determining monthly electricity bills. This power may range from
a few microwatts, in applications such as satellite communications, to, megawatts; in
application such as supply the electrical needs of large cities. The implementation of the
active power measurement is relatively easy and is done accurately in most energy
meters in field.
2.5
Reactive Power
Reactive power, Q, involves real power that oscillates back and forth between
two devices over a transmission line. The active power mentioned before is
unidirectional. The reactive power is also given by
Q=V x I
(1)
However, to distinguish this power from active power, another unit is used- the
var. When V and I are out of phase, a reactive power reading is obtained. Thus
Q=V x I x sin θ
(2)
Where
θ= the phase angle between V and I
If V and I are exactly in phase, the reading is zero.
8
2.6
Apparent Power
Loads that absorb both active power P and reactive power Q may be considered
to be made up of a resistance and an inductive reactance. It also could be said as the rate
at which energy is absorbed by an element and the maximum real power that can be
delivered to a load. Apparent power is expressed neither in watts nor in vars, but in
voltamperes.
The apparent power is an important quantity in engineering applications because
its maximum value must be limited to all physical devices. For this reason, the
maximum apparent or peak power at the input exceed the limit power , the output signal
will be distorted. So, the exceeding input rating may even damage amplifier
permanently.
S = VRMS x IRMS
(3)
Where Vrms and Irms are the effective voltage and current delivered to the load,
the equation is as shown above.
2.7
Power Factor
The power factor of an alternating current device or circuit is the ratio of the
active power P to the apparent power S. It is given by the equation
9
Power factor = P/S
(4)
Where
P= active power delivered or absorbed by the circuit or device [W]
S= apparent power of the circuit or device [VA]
Power factor is expressed as a simple number, or as a percentage. Because the
active power P can never exceed the apparent power S, it follows that the power factor
can never be greater than unity (or 100 percent).The S = VRMS x IRMS relationship
brings can form a triangle which is called the power triangle as follows:
Figure 2.2 Power Triangle
2.8
Power Measurement
Basically, a Power Meter is designed to measure energy of power. In simple
terms, as we understand, electrical power is the product of voltage and current. If we
make repeated measurements of both instantaneous voltage and current, or Vi and Ii, we
can keep a running total of their products over time. By dividing each parameter reading
by the number of samples, we can measure the average power. For alternating current,
such as that from the mains, average power also must account for the power factor as
discussed previously, which is the phase relationship between voltage and current. It is
known that it is difficult for a microcontroller to make direct measurements when the
supply voltage is coming straight off the mains: say, 240V. This makes it necessary to
10
indirectly measure line voltage and current. The best way to reduce the voltage to a level
and dynamic range is that is compatible with digital circuitry. This applies for current as
well.
2.9
Microcontroller
A microcontroller is an essential element in designing the Power meter.
Microcontroller is designed for embedded applications. These applications are
automatically controlled products and device. As there are many type of
microcontrollers available in the market such as the AVR-ATMEL microcontroller, the
PIC microcontroller, the Intel 8051 microcontroller and many more.
8051
PIC
AVR
SPEED
Slow
Moderate
MEMORY
Small
Large
Large
ARCHITECTURE
CISC
RISC
RISC
ADC
Not Present
Inbuilt
Inbuilt
Inbuilt
Inbuilt
Inbuilt
Not Present
Inbuilt
Inbuilt
TIMERS
PWM
Fast
11
Table 2.3 Comparison between microcontrollers
From the above table it is known that the AVR-ATMEL microcontroller is the
best option although it is very similar to the PIC microcontroller and far better than the
8051 microcontroller but it is the fastest microcontroller among the microcontrollers
compared above. Furthermore, the AVR microcontroller executes the instructions in
single execution cycle. Besides that, this microcontroller has the ability to operate in
different power saving modes. Finally, the AVR microcontroller is very much cost
effective as it saves more power.
The advanced RISC architecture and 32 x 8- bit general purpose working
registers are the core elements in the AVR microcontroller. The AVR can fetch inputs
from two general purpose working registers and put them to ALU for carrying out the
requested operation, and transfer back the result to an arbitrary register within one clock
cycle. The ALU can perform arithmetic as well as logical operations over the inputs
from the register or between the register and a constant. Single register operations like
taking a complement can also be executed in ALU. We can see that AVR does not have
any register like accumulator as in 8051 family of microcontrollers; the operations can
be performed between any of the registers and can be stored in either of them. AVR
follows Harvard Architecture format in which the processor is equipped with separate
memories and buses for Program and the Data information. Here while an instruction is
being executed, the next instruction is pre-fetched from the program memory.
12
Since AVR can perform single cycle execution, it means that AVR can execute 1
million instructions per second if cycle frequency is 1MHz. The higher is the operating
frequency of the controller, the higher will be its processing speed. We need to optimize
the power consumption with processing speed and hence need to select the operating
frequency accordingly.
13
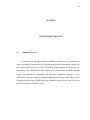
CHAPTER 3
METHODOLOGY
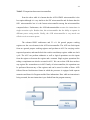
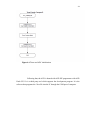
3.1
Functional Block Diagram
Below is a functional diagram of the overall system that is used to design the
power meter.
Figure 3.1 Functional Block Diagram of the Overall System
14
3.2
Progress Flow
Below is the flow chart of the methodology which is used for this project The
first stage is background study. During this stage, much research is done to understand
power and energy measurement. Also, studies on previous design are also done. The
microcontroller and its basic function is understood in this stage. Several researches
were done on voltage and current sensors, as well as analog to digital (A/D) converters.
Next , I obtained the core information of the project learning how to use the software
below:a) Proteus
c) AVR studio5
b) Eagles
d) AVR dude GUI compiler
The next stage in the second part of thesis (PSMII) is the design of the circuit
itself, programming the microcontroller, selecting hardware, constructing the power
meter, and result analysis.
15
Figure 3.2 Design Procedure
16
Figure 3.3 Design Process
17
3.3
Voltage Sensing Circuit
The circuit used in hardware design must be non-intrusive, which means the
circuit itself should not consume power because this factor can reduce accuracy of the
power meter. Therefore, the voltage-sensing circuit has to be both accurate and nonintrusive. Next, the voltage sensing circuit cannot handle input as high as 240Vrms,
which means the input voltage had to be stepped down to decrease the input read by the
voltage sensing circuit. Furthermore, in using microcontroller it had to ensure that the
microcontroller does not receive not more than 5V. These are the core factors which had
to be ensured before designing the voltage-sensing circuit.
A Encapsulated PCB mounted voltage transformer as shown in the figure below
is used to step down the primary input voltage of 240Vrms to 12Vrms secondary output
voltage. This was chosen because it is small in size, which is only 22.0 x 22.7mm
.
Figure 3.4 The Voltage Transformer and connection diagram
18
The voltage from input is stepped down from 240Vrms to 12Vrms, which is then
divided using a voltage divider R1 100kohm and R2 10kohm.
3.4
Current Sensing Circuit
For the current sensing circuit a shunt resistor of 0.05 ohm is used. Using shunt
resistor as the current sensing circuit saves cost and produces an accurate measurement.
Shunt resistors can provide either a high-side or low side measurement of the current
through the load. High–side current measurement has more complex circuitry than low
side method .In this design , the low side current shunt measurement was used because
low voltage op-amps can be used to sense voltage across the shunt resistor. This is
because the measurement is referenced to ground.
The International Standard IEC1036 (1996-09) Alternating Current Energy
Meters of Active Energy (Classes 1 and 2) calls for a maximum power dissipation of 2
Watts. For this design , a 0.005ohm shunt resistor was selected, with a maximum current
of 3A , the maximum power dissipated in the shunt is
3^2 x 0.05 = 0.45W
which is well below standards. A 0.05ohm shunt resistor shown in Figure 3.5
with a power rating of 1W, and small dimensions of 5.08 mm height and 11.43 mm
length proves to be suitable size and economical for this design.
19
Figure 3.5 The Shunt Resistor
With that, at Imax (3A), the voltage drop across the shunt would be,
3x 0.05=0.15V
this is rather small as the maximum range of current should be 0-5V for
maximum range across the ADC of the microcontroller.
Figure 3.6 The Overall Circuit
20
3.5 Interfacing to the Liquid Crystal Display
The usage of seven segment-displays is generally simple but due to its bulky size
and limited set of characters proves not suitable for this project. The seven- segment
becomes inadequate when more than few letters or digit displayed. Liquid Crystal
Display (LCDs) come in handy when the application requires the display of many
characters. An LCD has the following advantages:
o High contrast
o Low power consumption
o Small footprint
o Ability to display both letters and graphics
The basic construction of an LCD is showed in Figure 3. .The LCD allows light
to pass through when activated. A segment is activated when low-frequency bipolar
signal in a range of 30Hz to 1000Hz is applied to it. The polarity of the voltage must
alternate or else the LCD will not be able to change quickly.
21
Figure 3.7 Liquid Crystal Display
In the recent years, price of LCDs has become more affordable. LCDs are often
sold in modules that consists both LCD and its controller. The Hitachi 44780 is one of
the most popular LCD display controllers in use today.
Figure 3.8 The HD44780-based LCD kit
The DB0-DB7 pins can be used to exchange data with the microcontroller. In
this project, a 4-bit interface is used, so only pins DB4-DB7 are used. The E pin is an
enable signal to the kit. The R/W signal determines the direction of the data transfer. The
22
RS signal selects the register to be accessed . When the RS signal is high, the data
register is selected. Otherwise, the instruction register is selected. The VEE is used to
control brightness of the display and is connected to a potentiometer. The VEE input
should be set to maximum value (-VCC) for an extended period of time before burning
the LCD.
23
CHAPTER 4
DEVELOPMENT PROCESS
4.1
Simulation Process
In order to test the program, before building the hardware, a simulation tool
comes very handy as it helps to verify the program before the real hardware is built. This
part of the process saves cost in case of hardware changes during the design process.
Furthermore, the simulation tool also enables us to simulate and watch the intended
system performance by connecting the hardware simulation prototype to the
oscilloscope. Therefore, Proteus a simulation application which has a rich library is used
to design the power meter. Besides that, this application enables user to load .hex file to
the microcontroller to run the program.
24
LCD Display
Osiloscope
Waveform
Microcontroller
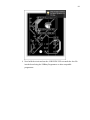
Figure 4.1 Proteus Simulation
Figure 4.1 above shows the features of the simulation tool and its operation, this
shows how this tool helps to improve the design performance and useful in analyzing
results.
25
4.2
AVR Studio 5
AVR studio 5 is a platform used to program and compile the ATMEGA 8 ,
microcontroller which is used in this design. This software have a similar Graphical
User Interface (GUI) as the Visual Basic(VB) software. Therefore it is easy to program
C/C++ language of programming which is used in this design. The C/C++ is the better
version of programming compared to assembly language because it is easy for
programmers to reference and user to understand the program as well.
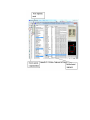
Figure 4.2 AVR Studio 5 Interface
Figure 4.2 above shows the program in the AVR Studio 5. By using this
software, we can save time in using other software or application to produce .hex file
which is later burned into the microcontroller.
26
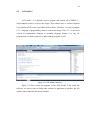
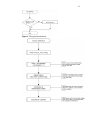
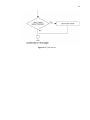
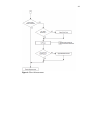
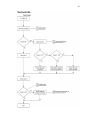
4.3
Software Program Flow Chart
To program the AVR-ATMEL microcontroller, the GCC compiler is used.
Below is the flow chart of the entire program. The GCC C compiler was designed to
exclusively for the AVR-ATMEL microcontroller. The compiler has a large library
built-in-functions, preprocessor commands and ready-to-run example programs to start
any project.
27
Figure 4.3 Program Initializations
28
Figure 4.4 Cycle Service
29
Figure 4.5 Save Measurement
30
31
Figure 4.6 Timer and ADC initialization
Following that, the AVR is burned with AVR ISP programmer with AVR
Dude GUI. It is a third party tool which supports the development program. It is the
software that programs the *.hex file into the IC through the COM port of computer.
32
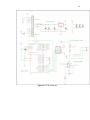
4.4
Printed Circuit Board (PCB) Design
PCB is used a platform to place all components in the board neatly and with less
soldering compare to normal bread board or donut board. Furthermore, it assists well in
troubleshooting the hardware. Eagles is the software used to design the PCB. This
software, in particular is user friendly and have a very rich library which can be updated
from time to time. There are a few steps had to followed in designing the PCB. Firstly,
the schematic is drawn using the software. Next it is converted to layout. From the
layout, the component is once again placed in various way until a optimized designed
with low space is acquired. Finally, routing is done by connecting each component
which was set initially the connection in the schematic. This process can be done
manually or by simply setting “autorouting”. This feature helps the user to route all the
components automatically.
Figure 4.7 and 4.8 Shows the PCB schematic and the PCB layout.
33
Figure 4.7 PCB Schematic
34
Figure 4.8 PCB Layout
35
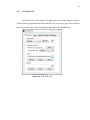
4.5
AVR Dude GUI
AVR Dude GUI is the simple GUI application as the name suggests which is
used to burn the program into the microcontroller. It is very easy to use as users need not
have to set any fuse bit values as required by many other AVR based burner.
Figure 4.9 AVR Dude GUI
36
4.6
Troubleshooting
There were few problems occurred in completing this project, firstly in the
simulation part the value obtained in the output which gives an error value more than
20%. Therefore, calibration has been done in order to overcome this problem. The
calibration was done by obtaining a series of data comparing the actual value and the
output value, a graph was plotted and a coefficient is found by obtaining the perfect
straight line since all equation involved in this calculation are linear. Next, the
coefficient value is added in the equation and another series of data is obtained. This
process is repeated until a satisfactory value is obtained.
Next, is troubleshooting the PCB board. After soldiering all components it is
found that some of the components which should be connected is not connected in the
PCB board. This was due to a very thin line in the PCB itself was not connected
properly. Therefore, jumper wires were used to connect all the missing connection in the
PCB board. Finally, a connection which supposedly connected to ground was
accidentally connected to VCC, this was due to improper soldiering, the problem was
detected by checking each connection in the circuit using a digital multimeter.
37
CHAPTER 5
RESULTS AND DISCUSSIONS
5.1
Results
Several tests were carried out to verify the readings and also obtain findings for
the voltage sensing and current sensing circuits, while still in simulation process before
the real hardware was designed. Tables below shows the obtained test results for voltage
sensing and current sensing circuit.
38
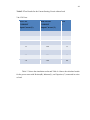
Table 5.1 Test Results for the Voltage Sensing Circuit without Load
ACTUAL
DISPLAYED
Error
VOLTAGE
VOLTAGE
%
Input Voltage (V)
Output Voltage (V)
0
000.0
0.0
40
038.8
3.1
80
077.7
2.9
120
120.0
0.0
160
159.9
0.1
200
202.2
1.1
240
240.0
0.0
39
Table 5.2 Test Results for the Current Sensing Circuit without Load
Vin=120 Vrms
ACTUAL
DISPLAYED
Error
CURRENT
CURRENT
%
Input Current (V)
Output Current (V)
0
0.00
0.0
0.5
0.48
4.0
1.0
0.98
2.0
1.5
1.48
1.3
2.0
2.01
0.5
2.5
2.50
0.0
3.0
3.00
0.0
Table 5.3 shows the simulation results and Table 4.4 shows the calculated results
for the power meter with Resistor(R), Inductor(L), and Capacitor (C) connected in series
as load.
40
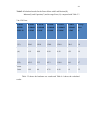
Table 5.3 Simulation test results for the Power Meter with Load
Resistor(R), Inductor (L) and Capacitor(C)
Vin=120 Vrms
POWER
R=100 Ω
R=100 Ω
R=100 Ω
R=120 Ω
R=200 Ω
METER
L=100mH
L=100mH
L=300mH
L=100mH
L=250mH
DISPLAY
C=100uF
C=10uF
C=100uF
C=100uf
C=50uF
V(V)
120.0
120.0
120.0
120.0
120.0
I(A)
1.20
0.49
0.88
0.98
0.60
138.8
29.9
83.3
115.5
65.5
0.9
0.4
0.7
0.9
0.9
Power (P)
Power Factor
41
Table 5.4 Calculated results for the Power Meter with Load Resistor(R),
Inductor(L) and Capacitor(C) and Average Error (%) compared with Table 5.3
Vin=120 Vrms
POWER
R=100 Ω
R=100 Ω
R=100 Ω
R=120 Ω
R=200 Ω
Average
METER
L=100mH
L=100mH
L=300mH
L=100mH
L=250mH
Error
DISPLAY
C=100uF
C=10uF
C=100uF
C=100uf
C=50uF
%
V(V)
120.0
120.0
120.0
120.0
120.0
0.0
I(A)
1.19
0.48
0.90
0.99
0.58
1.9
P(W)
142.2
23.3
82.3
118.8
69.0
6.7
0.99
0.4
0.76
0.99
0.9
5.2
Power
Factor
Table 5.5 shows the hardware test results and Table 4.6 shows the calculated
results .
42
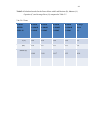
Table 5.5 Hardware test results of the Power Meter with Load Resistor(R), Inductor (L)
and Capacitor(C)
Vin=34.4 Vrms
POWER
R=100 Ω
R=200 Ω
R=100 Ω
R=100 Ω
METER
L=100mH
L=100mH
L100mH
L=200mH
DISPLAY
C=100uF
C=100uF
C=200uF
C=100uf
V(V)
34.0
34.0
34.0
34.0
I(A)
0.35
0.17
0.39
0.30
010.0
005.5
009.9
008.8
0.9
0.9
0.9
0.8
Power (P)
Power Factor
43
Table 5.6 Calculated results for the Power Meter with Load Resistor (R), Inductor (L)
Capacitor (C) and Average Error (%) compared to Table 5.5
Vin=34.4 Vrms
POWER
R=100 Ω
R=200 Ω
R=100 Ω
R=100 Ω
Average
METER
L=100mH
L=100mH
L=100mH
L=200mH
Error
DISPLAY
C=100uF
C=100uF
C=200uF
C=100uf
%
V(V)
34.4
34.4
34.4
34.4
1.2
I(A)
0.34
0.17
0.33
0.31
3.4
11.69
5 .89
11.17
9.55
10.0
0.9
0.9
0.9
0.8
9.1
Power (P)
Power Factor
44
5.2
Discussion
The voltage sensing hardware tests were conducted by varying a 0 – 240 Vrms
input and shows the output of the LCD display in Proteus simulation. The results was
shown in Table 5.1 as well as a graph in Figure 5.7 which shows that there is a linear
increase in the output voltage versus the input voltage. Therefore, the voltage sensing
circuit is accurate and it gives a 1.17% error.
Output Voltage (V)
Input Voltage (V)
Figure 5.7 Output voltages versus input voltage for actual and displayed voltage.
The current sensing hardware tests were conducted by setting 120 Vrms input
voltage as constant and by varying the load value and obtaining the output of the LCD
display in Proteus simulation. The results was shown in Table 5.2 as well as a graph in
Figure 5.7 which shows that there is a linear increase in the output current versus the
45
input current. Therefore, the voltage sensing circuit is accurate and it gives a 1.33%
error.
Output Current (A)
Input Current (A)
Figure 5.8 Output current versus input current for actual and displayed current
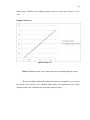
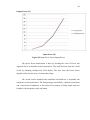
The power readings obtained from the power meter is acceptable as it is close to
the actual result and the error obtained while taking the measurement also solely
depends on the error of both the current and the voltage reading.
46
Output Power (W)
Input Power (W)
Figure 5.9 Input Power Versus Output Power
The power factor measurement is done by dividing the value of Power and
Apparent Power as obtained in the measurement. This could be tested with the overall
circuit by obtaining reading from LCD display. The error from the Power Factor
depends solely from the error of current and voltage.
The overall results obtained both simulation and hardware is acceptable and
satisfactory as discussed above. The final prototype was build by a printed circuit board
and a strip board. Furthermore it also achieved its purpose of being simple and user
friendly as the design have only one button
47
CHAPTER 6
CONCLUSION AND RECOMMENDATIONS
6.1
Conclusion
Finally a power meter was developed. Hereby, it can measure voltage, current,
power and power factor. Thereby, achieving all the objectives within the scope of the
project. This design also is cheap and user friendly as was initially intended. Hence, it
has potential to be commercialized after necessary modification and improvements.
48
6.2
Recommendations
There are a few measures have to be taken in order to improve this product.
Firstly, is by making some necessity amendments in the programming so that this device
can be able to measure non-sinusoidal current waveform.
Next, the microcontroller used can be upgraded than used in this project which is
ATMEGA 8 ,by doing so one can obtain more flash memory and more complex features
in programming can be added to improve this device.
Finally, extra features can be added to improve the commercial value of the
device such as enabling the device to measure cost as well as energy. In ordinance, this
would definitely increase the users awareness of the level of energy consumed
49
REFERENCES
[1] Lynn Powell, “Power System Load Flow Analysis”, McGraw-Hill Professional
Engineering, 2004.
[2] Isidoro Segura-Heras, Guillermo Escrivá-Escrivá*, Manuel Alcázar-Ortega, “
Electrical Power Production Model for Load Flow Analysis”, Institute for
Energy Engineering, Universidad Politécnica de Valencia, Camino de Vera,
Spain, Renewable Energy 36 (2011) 1008-1013
[3] Andrés E. Feijóo and José Cidrás, Member, IEEE, “Modelling of Load Flow
Analysis”, IEEE Transactions on Power Systems, 15 (2000) No 1.
[4] Dr. Mohammad Yusri Hassan, “Power System Control”, Third edition, Desktop
Publisher (2010)
[5] Wildi , Theodore (2002). "Microcontroller Technology".5th Edition. Pearson
Education, Upper Saddle River, New Jersey
[6] "Brand Electronics Digital Power
Meter".http://www.energytools.com/pwrmeter.htm
[7] Steven Barrett, Steven F Barrett (2010)”Embedded System Design with the
Atmel AVR Microcontroller”
[8] Mohd Ashphan bin Mohd Nor (2003) "Development of Digital Energy Meter for
Domestic Appliances". Universiti Teknologi Malaysia : Bachelor of Electrical
Engineering Thesis
50
APPENDIX A
AVR ATMEGA8 Program
#include <avr/io.h>
#include <avr/interrupt.h>
#include "display.h"
#include "measurement.h"
#include "adc.h"
#include "shutdown.h"
#include "eeprom.h"
#include "timer.h"
#include "buttons.h"
static unsigned char timer_cnt = 0;
/* int flags */
static unsigned char timer_irq = 0;
static unsigned char ext_irq = 0;
void toggle_display(void) {
static unsigned char current = DISPLAY_MODE_UIP;
if(current == DISPLAY_MODE_UIP)
current = DISPLAY_MODE_E_POWERON;
else if(current == DISPLAY_MODE_E_POWERON)
current = DISPLAY_MODE_E_OVERALL;
else if(current == DISPLAY_MODE_E_OVERALL)
current = DISPLAY_MODE_UIP;
51
display_set_mode(current);
}
int main(void) {
/* initialize the display */
display_init();
/* initialize the eeprom */
eeprom_init();
/* initialize the measurements */
measurement_init();
/* initialize the adc */
adc_init();
/* initialize the shutdown-controller */
shutdown_init();
/* initialize the timer */
timer_init();
/* initialize the buttons */
buttons_init();
/* show voltage, current, power */
display_set_mode(DISPLAY_MODE_UIP);
for(;;) {
52
if(timer_irq) {
timer_irq = 0;
if(shutdown_get_state() ==
SHUTDOWN_STATE_RUNNING) {
timer_cnt++;
/* ~ 5 updates/sec */
if(timer_cnt % 3 == 0) {
adc_sample();
display_refresh();
}
/* generate ~1 sec intervals */
if(timer_cnt == 15) {
/*
* To determine the exact interval in
seconds:
* perl -e 'print
(((256*PRESCALER)/F_CPU)*TIMER_CNT)'
* perl -e 'print (((256*256)/1E6)*15)'
*/
measurement_tick(983);
timer_cnt = 0;
}
}
}
if(ext_irq) {
53
ext_irq = 0;
if(shutdown_get_state() ==
SHUTDOWN_STATE_RUNNING)
toggle_display();
else {
shutdown_reenable();
display_set_mode(DISPLAY_MODE_UIP);
}
}
}
return 0;
}
/* external interrupt 0 */
ISR(INT0_vect) {
ext_irq = 1;
}
/* timer 0 interrupt */
// TODO: leave here or move somehow to timer.c?
ISR(TIMER0_OVF_vect) {
timer_irq = 1;
}
54
APPENDIX B
User Manual For Power Meter
1. Open the AVR Studio 5
2. Open the filename powermeter.sln
3. A Window will open as below
All the C++ files in
the program
4. Click on the “Build” tab and click “Build Solution”
5. The object file and .hex file will be generated in MY DOCUMENT
6. Open PROTEUS Application and build the circuit as below:-
55
7. Next load the .hex file in PROTEUS as shown in the User Manual for Proteus.
(APPENDIX D)
Hardware Design (PCB)
1. Open the file Schematic.brd in EAGLES as shown in Figure 4.7
2. Click FILE then click “Switch to Board”
3. The Layout File will open and SAVE as Image file or .pdf and the PCB
board is ready for fabrication as shown below.
56
4. Next build the circuit and use the AVR DUDE GUI to transfer the .hex file
into the board using the USBtiny Programmer or other compatible
programmer.
57
Select
Load
Microcontroller
.hex
file here
5. Select Microcontroller and load the .hex file as shown above.
6. Select the setup tab and choose COM PORT
7. Finally click the Program Button as above.
2
Appendix C
User Manual for AVR Studio 5
Appendix D
User Manual for Proteus
Proteus is software that is required to be bought. This trial version of this software may
be downloaded on www.download.cnet.com. This will be a version that has limitations on the
time that it can be used as well as the functions that can be done by the software. Once the trial
or full version has been obtained, the software can then be installed by just running the .exe file
and follow the installation process till the end. This software is easy to use. Once installed, there
will be two programs, ARES and ISIS. For the microcontroller design, ISIS is used. The first
step is to open the program. To begin the design, simply click on the pick component from
library button and choose the required component and place it in the workplace (figure Appendix
D1). Once the design is done, double click on the microcontroller to set the program file into the
microcontroller (figure Appendix D2). Logic analyzing can be done by attaching probes to the
wires, opening the logic analyzer and running the program. The data will be displayed as a
timing diagram. (Appendix D3).