1
I declare that I have read this final year project report and in my opinion, this final
year project is sufficient in terms of scope and quality for the purpose to be awarded
the Degree of Bachelor Engineering (Electrical-Mechatronics).
Signature
: ……………………………..
Name
: Dr Mohamad Shukri bin Zainal Abidin
Date
: 26th June 2015
DESIGN AND DEVELOPMENT OF CAPILLARY IRRIGATION SYSTEM
CONTROLLER
SALWA BINTI MOHSIN
A final year project report submitted in partial fulfillment
of the requirements for the award of the degree of
Bachelor of Engineering (Electrical-Mechatronics)
Faculty of Electrical Engineering
Universiti Teknologi Malaysia
JUNE 2015
ii
I declare that this final year project report entitled “Design and Development of
Capillary Irrigation System Controller” is the result of my own research except as
cited in the references. The final year project report has not been accepted for any
degree and is not concurrently submitted in candidature of any other degree.
Signature
: ……………………………..
Name
: Salwa binti Mohsin
Date
: 26th June 2015
To my beloved friends and family
iv
ACKNOWLEDGEMENT
Conducting the research of this project was truly a great experience. I was able
to implement my classroom theories learnt as well as learned even more about the
scope of my research. I also gained many life lessons that I could have never learn in
class.
Firstly, I would like to express my deepest gratitude to my supervisor, Dr
Mohamad Shukri Zainal Abidin, who has provided me with many advises on this
project and the experiment test site as well as the tools necessary in setting up the
project. Without his guidance and persistent help, this project would not have been
plausible.
I would also like to thank the Faculty of Electrical Engineering of UTM for
including this final year project as part of my degree requirement and also for
providing me the sufficient guidance in writing my final year project report. Without
it, I would not have the opportunity to implement my classroom theories learnt.
Last but not least, I would like to thank my friends and family who has been
there for me in giving me mental and physical support throughout this tough time.
v
ABSTRACT
Water crisis is becoming an issue in the 21st century where freshwater
consumption is increasing worldwide. 70 percent of freshwater is consumed by the
agriculture sector for irrigation purposes. With low efficiency systems implemented,
billions liters of water is wasted. This project is conducted to develop capillary
irrigation system controller for water saving to reduce the water consumption in
irrigation. The irrigation method implemented is an underground system to reduce the
water loss using capillary irrigation. This project consist of obtaining the actual crop
evapotranspiration value using selected sensors to identify the crops’ water needs.
With the data obtained, a controller will be implemented into the system. This system
will supply water to the crop only according to its needs to save water.
vi
ABSTRAK
Krisis air menjadi isu pada abad ke- 21 di mana penggunaan air semakin
meningkat di seluruh dunia. 70 peratus daripada air digunakan oleh sektor pertanian
untuk tujuan pengairan. Penggunaan sistem yang kurang efisyen menyebabkan
berbilion liter air dibazirkan. Projek ini bertujuan untuk membangunkan sistem
pengawalan kapilari untuk pengairan air yang dapat mengurangkan penggunaan air
untuk pengairan. Pengairan dilaksanakan menggunakan kaedah bawah tanah untuk
mengurangkan kehilangan air dengan mengaplikasikan pengairan kapilari. Projek ini
mendapatkan nilai penyejatpeluhan tanaman menggunakan sensor yang terpilih untuk
mengenal pasti keperluan air tanaman. Dengan data yang diperolehi, satu kawalan
akan diaplikasikan ke dalam sistem.
Sistem ini akan membekalkan air kepada
tanaman hanya mengikut keperluan untuk penjimatan air.
vii
TABLE OF CONTENTS
CHAPTER
1
2
TITLE
PAGE
DECLARATION
ii
DEDICATION
iii
ACKNOWLEDGEMENT
iv
ABSTRACT
v
ABSTRAK
vi
TABLE OF CONTENTS
vii
LIST OF TABLES
x
LIST OF FIGURES
xi
LIST OF SYMBOLS
xiii
LIST OF ABBREVIATIONS
xiv
LIST OF APPENDICES
xv
INTRODUCTION
1
1.1 Project Background
1
1.2 Problem Statement
4
1.3 Research Objectives
5
1.4 Scope of Project
5
LITERATURE REVIEW
7
2.1 Introduction
7
2.2 Conventional Irrigation Method
7
viii
2.2.1 Surface Irrigation
8
2.2.2 Subsurface Irrigation
9
2.2.3 Sprinkler Irrigation
10
2.2.4 Drip Irrigation
11
2.2.5 Capillary Irrigation
12
2.3 Efficiency Rate and Water Loss in Agriculture
3
4
12
2.3.1 Efficiency Rate and Distribution Uniformity
12
2.3.2 Water Loss
15
2.4 Evapotranspiration
15
2.5 Management of water Supply to Crop
16
2.6 Conclusion
17
RESEARCH METHODOLOGY
18
3.1 Introduction
18
3.2 System Overview
19
3.3 System Implementation
20
3.4 System Components
27
3.4.1 Sensors
27
3.4.2 Data Acquisition Controller
29
3.4.3 Water Irrigation System
33
3.5 Conclusion
35
RESULTS AND DISCUSSION
36
4.1 Introduction
36
4.2 Results
36
4.2.1 System components
36
4.2.2 Capillary Irrigation System Controller
40
4.2.3 Data logging
44
4.3 Discussion
46
4.3.1 System component
46
4.3.2 Capillary Irrigation System Controller
47
4.3.3 Data logging
49
ix
5
6
CONCLUSION AND RECOMMENDATION
50
5.1 Introduction
50
5.2 Conclusion
50
5.3 Recommendation
51
PROJECT MANAGEMENT
52
6.1 Introduction
52
6.2 Project Schedule
53
6.3 Cost Estimation
54
REFERENCES
55
Appendices A-D
58-73
x
LIST OF TABLES
TABLE NO.
TITLE
PAGE
3.1
List of components
23
4.1
Sampled analog value for temperature sensor
38
4.2
Sampled analog value for humidity sensor
38
4.3
Cucumber plant growth chart
48
6.1
Capillary Irrigation System Controller Gantt chart
53
(FYP1)
6.2
Capillary Irrigation System Controller Gantt chart
53
(FYP2)
6.3
Capillary Irrigation System Controller budget plan
54
xi
LIST OF FIGURES
FIGURE NO.
TITLE
PAGE
1.1
Global water use by sector in 2002
2
1.2
Malaysian water withdrawal by sector in 2005
3
1.3
Overnight changes in celery leaf immersed in dyed
4
water
2.1
Flood irrigation in paddy field
8
2.2
Furrow surface irrigation
9
2.3
Set up of the subsurface irrigation method
10
2.4
Sprinkler irrigation
11
2.5
Drip irrigation
12
2.6
Water use efficiency framework
13
2.7
Example of irrigation efficiency for surface irrigation
14
and sprinkler irrigation
3.1
Flow of irrigation system
19
3.2
Water string setup in a pot
20
3.3
Water flow in capillary irrigation
21
3.4
Project setup
23
3.5
Overall Arduino code flowchart
25
3.6
Flowchart of Arduino code in determining the actual
26
water level
3.7
Flowchart of Arduino code in determining the desired
water level
26
xii
3.8
HSM-20G Humidity Sensor Module
27
3.9
SEN0114 Moisture Sensor
28
3.10
Comparator LM324N
28
3.11
DS3231 RTC Module
29
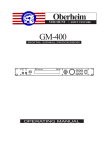
3.12
Arduino Uno
30
3.13
Arduino IDE c1.0.3 interface
30
3.14
Raspberry Pi B+
31
3.15
Flow of algorithm in controller
32
3.16
Raspberry Pi code flowchart
33
3.17
Container of sown seeds
34
4.1
Water level sensor
37
4.2
Stacked controller
37
4.3
Graph of analog value vs temperature
39
4.4
Graph of analog value vs humidity
39
4.5
Cucumber plant (right) on 16th April 2015
40
4.6
Greenhouse of the experiment test bed
41
4.7
Overview of the implemented system
41
4.8
Controller placed in a waterproof box on test site
42
4.9
Piping of the plants connected in parallel to the water
42
tank
4.10
Temperature and humidity sensor placed outside the
43
controller box
4.11
Soil moisture sensor lodged in soil in one of the pots
43
4.12
Water level sensor implemented on water supply tank
44
4.13
Example of data logged in a file
45
4.14
Graph of Temperature and Humidity against time based
45
on the data from Figure 4.13
4.15
Graph of evapotranspiration rate against time based on
the data from Figure 4.13
46
xiii
LIST OF SYMBOLS
G
-
G-force (Gravitational force)
V
-
Volts
̊C
-
Degree Celsius
%
-
Percent
xiv
LIST OF ABBREVIATIONS
ANN
-
Artificial Neural Network
ET
-
Evapotranspiration
PCB
-
Printed Circuit Board
UTM
-
Universiti Teknologi Malaysia
xv
LIST OF APPENDICES
APPENDIX
TITLE
PAGE
A
Arduino Uno Main Controller Code
58
B
Data Logger Code (Raspberry Pi)
68
C
Arduino Shield Circuit Design Connection
72
D
Water Level Sensor Circuit Design
73
CHAPTER 1
INTRODUCTION
1.1
Project Background
Agriculture is the cultivation of soil, plants, animals and other life forms in the
purpose of growing crops, providing food, wool and other products. The growing of
the global population has made the agriculture an important sector in international
trade [1]. In fact, the agriculture industry has played an important growth in the
Malaysian economy ever since it aided in the recovery of the 1998 financial crisis [2].
Strengthening the agriculture industry, Malaysia has revived this sector in the Ninth
Malaysian Plan (2006-2010) as the third engine of growth.
A New Agriculture concept implemented involved large-scale commercial
farming, the wider application of modern technology, production of high
quality and value-added products, unlocking the potential in biotechnology,
increased convergence with information and communications technology
(ICT), and the participation of entrepreneurial farmers and skilled workforce.
(Ninth Malaysia Plan (2006-2010), 2006:81)
2
Irrigation is widely associated with agriculture where water is applied to the
land for the purpose of crop productions. Paddy fields are common in Malaysia as it
supplies the country’s staple food. The development of irrigation was top priority in
the 1980s to increase the rice cultivation productivity. As a result, the land that has
been invested with irrigation and drainage infrastructures shows a tremendous growth
in the crop outcome. In 2010, these areas accounted for 71.3% of the total national
rice production [3].
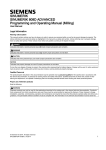
Statistics indicates that 70 percent to 80 percent of the global freshwater is used
in the agriculture sector for irrigation [4]. Figure 1.1 shows the global water use by
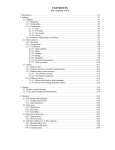
sector in 2002. In 2005, Malaysia has an estimated water withdrawal of 13.21 billion
liters. Figure 1.2 shows the Malaysian percentage of water use according to sector.
Observing Figure 1.3, the agriculture (irrigation + livestock) sector takes 34% of the
total water consumption, 4.52 billion liters. In 1999, the irrigation efficiency was
identified between 35 to 45 percent. Assuming the efficiency rate is the same in 2005,
1.582 to 2.034 billion liters of freshwater has been wasted [5].
Figure 1.1 Global water use by sector in 2002
3
Source: AQUASTAT, 2010
Figure 1.2 Malaysia water withdrawal by sector in 2005
In the recent years, Malaysia is facing water crisis and its effects are becoming
significant. The water crisis issue is predicted to take a toll on the national economic
activities. If this issue is unresolved, it will lead to the depletion of the agriculture
outcome. Subsequently, this will lead to food shortage and rising commodity prices.
As agriculture is one of the main international trade for Malaysia, the reduction in the
production will cause economic losses to the country. Furthermore, the risk of water
shortage will force Malaysia to increase the amount of food imported. This situation
has been observed in the late 2010 where the worldwide wheat prices has increased
early 2011 following the drought that damaged the wheat production [6].
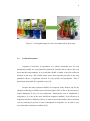
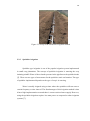
In general, plants absorb their nutrients and water from the ground. Water is
transported to the rest of the plant via capillary action. Capillary action is an important
process in plants where the liquid cohesion (a force binding the liquid together) and
adhesion (a force binding the liquid and another surface together) is greater than the
gravitational force, enabling liquid to flow with no assistance and against the gravity
pull to rise in narrow tubes. This process in plants is able to be observed by cutting the
end of a celery stalk and immerse it in a glass of dyed water. Leaving it overnight, the
leaves of the celery has changed according to the colour of the water dye. This short
experiment shows that the dyed water had undergo capillary action where it has been
transported in the thin tubes in plants to the leaves. Figure 1.3 shows the how the celery
immersed in dyed water has changed overnight.
4
Figure 1.3 Overnight changes in celery leaf immersed in dyed water
1.2
Problem Statement
Irrigation is necessary in agriculture as it allows unsuitable area for crop
production possible for crop plantation production. Besides that, it reduces the crop
stress that the plant undergo in an event that rainfall is unable to provide sufficient
moisture to the crop. The reliable water source that irrigation provides to the crop
plantation shows a significant increase in crop quality and production. This is
particularly noticeable for vegetable crops [18].
Despite the many options available for irrigation, many farmers opt for the
cheapest technology available such as flood irrigation. This is due to the necessity to
irrigate hundreds of acres of crop production. Although the cost of installation is
inexpensive, it is one of the most inefficient irrigation methods. Low efficiency in
irrigation can lead to billions of litres of water wasted. Researchers discovered that
even by reducing 10 percent of water consumption in irrigation, we are able to save
more than other consumers combined [19].
5
The current capillary system implemented uses capillary matting or water well
pots. Both methods requires the farmers to ensure the water needs to be applied at the
potting mix. There is no fixed amount on the number of times to check the water
supply as it depends on the plants needs to be replenished. The purpose of the capillary
system is to ensure continuous water supply to the crop. Though, the inconsistent
watering time is not practical for farmers as they need to monitor more than just
several pots. The system will be more practical if it is able to ensure the water supply
in the potting mix is constantly available without the need for farmers to regularly
check them and if it is able to provide the water supply according to the plants needs
[20].
1.3
Research Objectives
The objectives of the research project are:
I.
II.
III.
To develop a capillary irrigation system using water string.
To identify the evapotranspiration rate of the plant.
To develop an irrigation system controller based on plant water
demand.
1.4
Scope of Project
There are five main scopes in conducting this research project which are:
I.
Studying the cultivation of plants in horticulture, mainly short term
vegetable crops within greenhouse application.
II.
Identifying the temperature and humidity demand in plants (climate
change), its physiology and the optimum time for plant watering.
III.
Choosing suitable type of sensors to be used in data acquisition and
calibrate them.
6
IV.
Designing a control system for optimum water absorption by plants and
reduce water usage in irrigation agriculture.
V.
Testing of system on plant and analyze its outcome.
CHAPTER 2
LITERATURE REVIEW
2.1
Introduction
This chapter discusses the research conducted and available technologies
related to irrigation in agriculture for the development of this project. The current
technologies used in the field are studied to identify the needs in the systems, the
efficiency rate and aspects that need to be improved. Apart from that, in the literature
review explains the method used to estimate the crop water requirement as described
by researches that had been conducted previously.
2.2
Conventional Irrigation Method
There are two general categories of irrigation which are surface irrigation and
subsurface irrigation. There are three main widely popular irrigation methods in
8
agriculture which are sprinkler irrigation, drip irrigation capillary. The type of water
irrigation implemented to the crop varies according the water availability, soil
characteristics, crop requirements, crop and cultural practices [4].
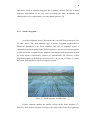
2.2.1 Surface irrigation
In surface irrigation, water is flowed into the crop field from a stream of river
or water source. The most common type of surface irrigation implemented in
Malaysian agriculture is the flood irrigation. This type of irrigation system is
commonly found in the paddy fields. Flood irrigation or also known as basin irrigation
is when the water is supplied to the irrigated with minimal field preparation [4] and
the water depth is controlled by farmers [5]. Unfortunately, the efficiency of this
irrigation method was identified to be between 35 to 45 percent [5]. Figure 2.1 shows
the paddy field which uses the flood irrigation system.
Figure 2.1 Flood irrigation in paddy field
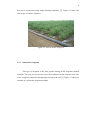
Furrow irrigation applied the similar concept as the flood irrigation [7].
However, in the furrow irrigation technique water is directed to lower level pathways
9
that can be constructed using simple farming machinery [5]. Figure 2.2 shows the
furrow type of surface irrigation.
Figure 2.2 Furrow surface irrigation
2.2.2 Subsurface irrigation
This type of irrigation is the least popular among all the irrigation method
available. The crop area receives the water flowed directly to the crop root-zone. The
water is typically channeled through pipes buried in the soil [5]. Figure 2.3 shows an
example of a subsurface irrigation method.
10
Figure 2.3 Set up of the subsurface irrigation method
2.2.3 Sprinkler irrigation
Sprinkler type irrigation is one of the popular irrigation system implemented
in small crop plantations. The concept of sprinkler irrigation is watering the crop
imitating rainfall. Water is flowed under pressure in the pipelines to the sprinkler heads
[5]. There are two types of movements for the sprinkler: static and rotation. The type
of sprinkler implemented depends on the type of crop it is watering.
Water is usually irrigated using a timer where the sprinklers will turn on at a
certain frequency or time interval. The disadvantages of this irrigation method is that
it has a high implementation cost and there is a non-restricted water supply. However,
using the sprinkler irrigation requires less man power as compared to other irrigation
systems [7].
11
Figure 2.4 Sprinkler irrigation
2.2.4 Drip irrigation
Drip irrigation provides water to the crop by installing microsprayers located
directly a few centimeters above the crop root. Although the cost of fixing this
irrigation system is rather costly, the water is supplied directly to the crop root area.
Hence, the water loss is minimal due to evaporation [7]. The cost of fertilizers and the
labour is reduced with fertigation (irrigation of liquid dissolved with nutrients). A drip
irrigation system mainly consist of the emitters (microsprayers); lateral line, sub main
and main line (water flow from source to the crop area); water valve, filter and water
supply control [8].
12
Figure 2.5 Drip irrigation
2.2.5 Capillary irrigation
Capillary irrigation or known as capillary watering system takes advantage of
the natural capillary action. It applies an underground irrigation method where the
water supplied to the crop is not exposed to the air. This technique supplies water
continuously to the crop, thus causing the crop to be highly productive. Furthermore,
it uses 50 percent less water with an increase in the food production. This irrigation
method is similar with wicking where it is mostly found in dry regions [15].
2.3
Efficiency Rate and Water Loss in Agriculture
2.3.1 Efficiency rate and Distribution Uniformity
13
The efficiency of water use in agriculture is to express the relationship between
the input and output of the system where in this situation, the input is the water
irrigated and output is crop production, economic return or amount of water retained
in the root-zone. Figure 2.6 shows the framework for water use efficiency in
agriculture. Nevertheless, calculating the efficiency theoretically is different in the real
application. In the actual crop application, there is a need for other water source that
may supply water to the crop such as rainfall [9].
Source: Barrett Purcell & Associates, 1999
Figure 2.6 Water use efficiency framework
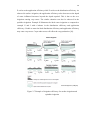
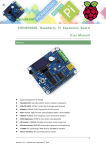
Distribution uniformity refers to the even water distribution in irrigation [9].
The even water distribution in irrigation is important as it determines the condition of
the crop. Figure 2.7 shows the irrigation efficiency for surface and sprinkler irrigation.
14
Ea refers to the application efficiency while Ed refers to the distribution efficiency. As
observed in surface irrigation, the application efficiency value decreases as the depth
of water infiltrated increases beyond the depth required. This is due to the over
irrigation causing crop stress. The similar situation can also be observed in the
sprinkler irrigation. Example H illustrates the ideal water irrigation as compared to
example G and I with a balance in the distribution efficiency and application
efficiency. Unable to meet the ideal distribution efficiency and application efficiency
may cause crop stress. Crops under stress will affect the crop production [10].
Source: D. Rogers et al, 1997 [10]
Figure 2.7 Example of irrigation efficiency for surface irrigation and
sprinkler irrigation
15
2.3.2 Water Loss
There are several categories for water losses in irrigation which are air losses,
surface/ atmospheric losses and canopy losses. Air losses are more common in
sprinkler overhead irrigation system from air drift and droplet evaporation.
Evapotranspiration of unintended crops such as weeds, evaporation from open water,
surface runoff and soil evaporation are examples of surface loss in the field [10].
2.4
Evapotranspiration (ET)
Evapotranspiration is a term derived from evaporation and transpiration, which
both process occurs in agriculture. This term is a phenomena of water loss.
Evaporation is the action of water vapourization from the ground or vegetation to the
air while transpiration is fundamentally water evaporation taking place from the
leaves.
The evapotranspiration rate in a plant is influenced by several factors which
are meteorological factors, soil moisture and the physiology of the plants.
Meteorological factors includes temperature, humidity, solar radiation and wind speed
[11]. Research conducted showed that FAO56 Penmann-Monteith formula (1)
produces the output with the highest accuracy to the actual evapotranspiration and
suitable for both dry and humid regions [12]. However, taking the crop physiology
and soil moisture into consideration, the actual crop evapotranspiration value is given
as (2) [13].
900
𝐸𝑇0 =
0.408Δ(𝑅𝑛 −𝐺)+ 𝛾(𝑇+273)𝑈2 (𝑒𝑎 𝑒𝑑 )
Δ+𝛾(1+0.34𝑈2 )
… (1)
16
where 𝐸𝑇0
= potential ET
T
= air temperature
G
= heat soil flux density
𝑈2
= average wind speed
𝑒𝑎
= water pressure
𝑒𝑑
= vapour pressure
𝑅𝑛
= radiation net value
𝛾
= thermometer constant
Actual crop ET = Potential ET x Crop Physiology x Soil Moisture
2.5
… (2)
Management of water supply to crop
According to research, there is an optimum time of the day to water the plants.
This time is during the early mornings, before the temperature begins to rise as well
as in the late afternoons. However, when watering the plants in the late afternoons, is
best to be allow the excess water to dry before sundown. This is to prevent fungal
development in the crop [16].
When watering potted plants, it is important for the water to reach the rootzone area. Consequently, the volume of water needed to be supplied is enough when
some of the water drains out in the bottom of the pot. The amount needed may vary
according to the size of the pots. To ensure that the water reaches the root-zone, allow
the water to be soaked into the soil before repeating the process until some water is
drained out of the bottom of the container [17].
In every system, a certain management system is implemented to irrigate the
water supply to the crop. Sprinkler irrigation and drop irrigation usually practices a
timer clock where the crop is irrigated several times a day according to the settings set
17
in prior. In a more sophisticated system, fuzzy logic controller or artificial neural
network (ANN) is implemented. Although many researches has been conducted
implementing fuzzy logic and ANN in irrigation system, it is not widely implemented
in real field application.
2.6
Conclusion
In conclusion, there are different types of technology developed in agriculture.
Each varies according to the application in the field. In agriculture, it is important to
know how the water is supplied to the crop, when is the optimum time for watering as
well as how much water is needed by the crop. These main characteristics are able to
be identified by understanding the evapotranspiration rate of the plant and the water
loss it encounters in the process.
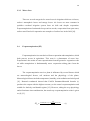
CHAPTER 3
RESEARCH METHODOLOGY
3.1
Introduction
The focus of this project is to develop an irrigation system controller to achieve
the objectives successfully. This chapter explains in detail about the hardware and
software requirements of the research conducted. The concept of the whole system is
explained in detail and is broken down to three main components which are the
sensors, data acquisition controller and the water irrigation system. These three
components will be integrated with one another to create an end capillary irrigation
system controller. The challenge of the project is to develop a system that manages
the irrigation system with the environment changes in real time. The irrigation system
controller developed will only supply water to the plant according to the water
demand.
19
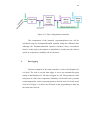
3.2
System Overview
This system develops a capillary irrigation system using a suitable material as
the medium for water transport and implements several sensors to obtain the crop
surrounding changes such as humidity, temperature and soil moisture as part of the
management system. Taking the crop characteristics into consideration, the sensor
input will used to measure the potential and actual evapotranspiration rate and identify
the crops’ water needs. This will be processed in the data acquisition controller and an
output will be produced to signal the water irrigation system to yield the water level
of the capillary irrigation according to the real-time crop environment condition. The
water level of the capillary irrigation reflects to the volume of water supplied to the
plant. More water is supplied in a high water level as compared to a low water level.
Figure 3.1 shows the flow of the capillary irrigation system controller.
Figure 3.1 Flow of irrigation system
20
3.3
System Implementation
Capillary irrigation is implemented in this system as a method to water the
plants. There are many types that can be used as a medium for the capillary irrigation
such as water string, soil and etc. The main reason as to why capillary irrigation
method is chosen to be implemented in this system is because it has a low water loss
compared to other irrigation methods.
The most common medium for the water transportation applied in capillary
irrigation are water wick (water string) and soil wick. Using soil as a medium in
capillary irrigation requires a tube to allow the soil to partially soak in the water source.
In doing so, the plant is not totally immersed in the water source and receive excessive
water. A water string connects the soil to the water source. The setup of the water
string is shown in Figure 3.2.
Figure 3.2 Water string setup in a pot
21
The same concept of how the water supply is absorbed by the plants via roots
and released into the atmosphere is applied for both soil and water string in capillary
irrigation. Every plant will have a root-zone area surrounding the roots where capillary
attraction will pull the water content in the soil towards the roots. This attraction will
move against the gravitational force. The water supply will be absorbed by the
capillary and move through the soil towards the root-zone. Water absorbed by the
roots will undergo the transpiration process while the water molecules in the surface
of the soil will experience evaporation. Both processes is known as evapotranspiration.
The process flow of how water travels in the capillary system is viewed in Figure 3.3.
Figure 3.3 Water flow in capillary irrigation
22
Implementing the capillary irrigation method in this project requires the
control of the height of the water supply. To control the water level in several pots of
plants at the same time in a capillary irrigation requires a parallel piping setup.
Ensuring that the water level in every pot is the same by installing a water level sensor
in each pot is not practical as this is costly. Therefore, to guarantee that the height of
water level is the same, Bernoulli’s principle is applied. Bernoulli’s principle states
that in a steady flow, the sum of energy flow along a streamline is the same. For the
water level height to be the same in each pot, it must be positioned levelled with the
water supply and the pots that are connected in parallel.
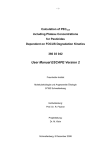
The approach in conducting this project is by installing the capillary irrigation
system using the water string. The setup of the experiment is shown in Figure 3.4. The
water management in this irrigation system is done by controlling the height of the
water level, h as circled in red in Figure 3.4. The setup requires two water tanks, one
to control the water level height and another as the main water supply. The water level
sensor is placed in the water supply tank connected in parallel with the pots while the
water pump is placed in the main water supply tank. The soil moisture sensor is placed
in one of the pots, lodged in the soil. Temperature and humidity is measured by placing
the sensor near the experiment area. Considering that the type of plants used, area of
experiment and age of the plant is the same, there is an assumption that the rate of
evapotranspiration for the plants involved is equal. Furthermore, the experiment is
placed in a controlled greenhouse environment. Thus, if it rains, the rain water will
not enter the pots.
23
Pots and water supply tank is placed on a levelled platform
Water level sensor
Main water
supply tank
Water supply tank
Piping connected in parallel
Figure 3.4 Project setup
The list of components required to execute this experiment is as shown in
Table 3.1.
Table 3.1 List of components
No Item
Quantity
1
Arduino Uno
1
2
Raspberry Pi B+
1
3
DS3231 RTC Module
1
4
HSM-20G Humidity Sensor Module
1
5
SEN0114 Moisture Sensor
1
6
Water level sensor
1
7
Power cable
1
8
Adapter 12V 1A
1
9
Wiring
10
Water tubing and connectors
11
Water pump
1
12
Water tank
2
13
Waterproof box (for circuit placement)
1
14
Seeds
15
Planting pots
24
The temperature and humidity sensor requires calibration before being able
to be applied in the system. The calibration of each sensor is calibrated according to
the general algorithm in equation (3).
𝐶𝑎𝑙𝑖𝑏𝑟𝑎𝑡𝑒𝑑 𝑑𝑎𝑡𝑎 =
𝐴𝑛𝑎𝑙𝑜𝑔 𝑖𝑛𝑝𝑢𝑡+𝑆𝑒𝑛𝑠𝑜𝑟 𝐶𝑜𝑛𝑠𝑡𝑎𝑛𝑡
1024
× 𝑆𝑒𝑛𝑠𝑜𝑟 𝑟𝑒𝑓
… (3)
Using the serial monitor, the analog values of the temperature and humidity
sensors are sampled at selected temperature and humidity using a thermometer and a
humidity gauge as the reference values. The sampled data is plotted into a graph to
identify the sensor constant.
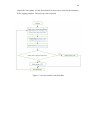
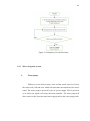
Figure 3.5 shows the flowchart of the main controller, Arduino. Upon
powering on, the system is initialized where the settings of the input and output pin is
declared and the initial conditions are set. Once it is initialized, the program will
sample the analog value reading from the sensors. Using equation (3) as reference, the
sensors are calibrated where the temperature, humidity and soil moisture is
determined. The water level value is determined as shown in flowchart in Figure 3.6.
With the environment data obtained, the potential and actual evapotranspiration rate
is measured.
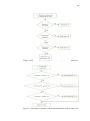
The controlling of the water level, h indicates the amount of water supplied to
the crop. As the water level increases, more water is supplied to the crop. In this
project, the desired water level value is identified by the difference in the potential
evapotranspiration and actual evapotranspiration value as shown in Figure 3.7. When
the need for water supply is greater than the amount of water supplied, the desired
water level increases to ensure that the crop is receiving the same amount as its’
demand. Meanwhile, when the actual evapotranspiration value is greater than the
potential evapotranspiration value, the water level should be low as it is receiving more
water than it needs.
When both water level value and the desired water level value is known, the
values are compared. If the values are the same, the water pump is not turned on.
However, if the water level is less than the desired water level, a signal will be sent to
25
actuate the water pump. All the data obtained is then sent to serial for the Raspberry
Pi for logging purposes. This process is then repeated.
Figure 3.5 Overall Arduino code flowchart
26
Figure 3.6 Flowchart of Arduino code in determining the actual water level
Figure 3.7 Flowchart of Arduino code in determining the desired water level
27
3.4
System Components
3.4.1 Sensors
I.
HSM-20G Humidity Sensor Module
The humidity sensor module is used to measure the relative humidity
level and is converted to a standard voltage output. The output voltage for this
unit ranges from 1V to 3V enable to measure the relative humidity from 20 to
95 percent and temperature value from 0⁰C to 50⁰C. The sensor input is wired
to the analog input pin to collect the data. Figure 3.8 shows the HSN-20G
Humidity Sensor Module.
Figure 3.8 HSM-20G Humidity Sensor Module
II.
SEN0114 Moisture Sensor
Moisture sensor measures the level of moisture of the soil surrounding
it. The two probes is used to pass current through the soil and it evaluates the
moisture level based on the resistance reading. The higher water content in the
28
soil, the less resistance. Therefore, it will give a higher analog value. The value
of the soil moisture ranges from 0 to 950 where 0 to 300 is considered dry soil,
300 to 700 is humid soil and 700 to 900 is in water.
Figure 3.9 SEN0114 Moisture Sensor
III.
Water Level Sensor
The water level sensor is designed to detect the presence of water. The
circuit is designed using a comparator LM324N. The input of the circuit is
placed in the water tank to determine the water level. The circuit will give four
output of high (5V) or low (0V). Figure 3.10 shows the LM324N used as the
main component in the sensor circuit.
Figure 3.10 Comparator LM324N
29
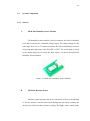
IV.
DS3231 RTC Module
DS3231 RTC Module were implemented in the system as a real time
clock. The module has an internal crystal clock and a switched bank of tuning
capacitors. This module sends the data to the main controller using the I 2C
interface. A coil cell battery is required to power on the module board.
Figure 3.11 DS3231 RTC Module
3.4.2 Data acquisition Controller
The purpose of the data acquisition controller is to collect the sensor input and
convert them to its actual data. The sensor input is calibrated before the data is applied.
The controller will then compute the output that will be used to control the valve
opening in the irrigation system.
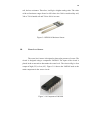
I.
Arduino Uno
The Arduino Uno acts as the main processing unit in the data
acquisition controller. The data collected from the sensor input uses the analog
input pins. Each of the data input is calibrated in comparison with a calibrated
30
sensor to ensure accuracy when the data is implemented in the system. Figure
3.12 shows the Arduino Uno board.
Figure 3.12 Arduino Uno
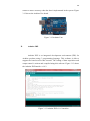
II.
Arduino IDE
Arduino IDE is an integrated development environment (IDE) for
Arduino products using C programming language. This software is able to
support the board used in this research. The coding of data acquisition and
output control is written and compiled using this software. Figure 3.13 shows
the Arduino IDE interface v1.0.3.
Figure 3.13 Arduino IDE v1.0.3 interface
31
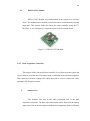
III.
Raspberry Pi B+
Raspberry Pi is a credit-card sized computer used in the system as a
data logger. The Arduino Uno board will send a string of processed data to the
Raspberry Pi via serial port every five minutes. The Raspberry Pi will log the
data received in a file for monitoring purposes. Figure 3.14 shows the
Raspberry Pi B+ board used.
Figure 3.14 Raspberry Pi B+
IV.
Algorithm
Figure 3.15 shows the flow of algorithm for the controller. All sensor
inputs will be sampled every 15s interval. Once the input is sampled, the data
will be calibrated and the evapotranspiration rate will be computed. From the
potential and actual evapotranspiration rate calculated, the desired water level
is determined from the difference value between the potential and actual
evapotranspiration rate. The higher the difference value shows that the crop
requires more water supplied.
32
Figure 3.15 Flow of algorithm in controller
The computation of the potential evapotranspiration rate will be
calculated using the Penmann-Monteith equation using the calibrated data.
Although the Penmann-Monteith equation considers many environment
factors, in this project, the equation is simplified to consider the three factors
which are temperature, humidity and soil moisture.
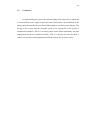
V.
Data logging
The data computed in the main controller is sent to the Raspberry Pi
via serial. The code to run the data logger is set to run automatically upon
startup of the Raspberry Pi. The data is logged in a file. The parameters of the
string sent are: date, time, temperature, humidity, soil moisture ratio, potential
evapotranspiration, actual evapotranspiration, desired water level and actual
water level. Figure 3.16 shows the flowchart of the programming to data log
the serial data received.
33
Figure 3.16 Raspberry Pi code flowchart
3.4.3 Water irrigation system
I.
Water pump
Difference in the desired water level and the actual water level from
the sensor will yield and error which will determine the actuation of the water
pump. The water pump is powered by an AC power supply. This is powered
on or off by the signal received by the main controller. The water pump will
allow water to flow from the main water supply tank to the water supply tank.
34
II.
Capillary irrigation
A small narrow tube is connected from the water supply tank and each
pot in parallel. The water level of the water supply is monitored in real-time
using a water level sensor. The sensor will send the current water level data to
the controller. If the water level is lower than the desired water level, the water
valve will remain opened until the water level has reached the desired value.
The water will flow evenly to each pot until the height of each water level is
the same.
III.
Test plants
The seeds of the plant is sown prior to the implementation of the
system. It is conducted in parallel with the development of the system.
Cucumber seeds were sown in small containers placed indoor on the 23 rd
march 2015. Each container was placed with three seeds.
Figure 3.17 Container of sown seeds
35
3.5
Conclusion
In implementing the system, the understanding of the water flow is important
to ensure that the water supply reaches the plant. Furthermore, the installation of the
piping and water tank needs to be checked thoroughly to avoid any water leakage. The
wiring of the sensors and the controller needs to be waterproof as the system is
implemented outdoors. This is to avoid any short circuit. Most importantly, the time
management needs to be planned carefully. This is so that by the time the plant is
ready to be transferred and implemented with the system, the system is ready.
CHAPTER 4
RESULTS AND DISCUSSION
4.1
Introduction
In this chapter, results of the project is presented in pictures and charts. It is
then analyzed and discussed. During the execution of the project, the challenges and
issues faced are also discussed in detail.
4.2
Results
4.2.1 System components
4.2.1.1 Water level sensor
37
The water level sensor is designed compact and small for easy
implementation on the water tank. This sensor is designed and built instead of
purchased to reduce the cost. Figure 4.1 shows the complete water level sensor
circuit.
Figure 4.1 Water level sensor
4.2.1.2 Data acquisition controller
Figure 4.2 shows the data acquisition controller stacked onto one
another to reduce space. The controller is placed in a waterproof box as a
precaution to avoid from getting wet. A shield is developed for the Arduino
Uno to enable secure wiring. Furthermore, the shield is designed with valve
drivers, LEDs, push buttons and a power jack. The valve driver is directly
connected to certain Arduino pins to actuate the water pump. The power jack
is connected to the valve drivers to power the water pump. Apart from that,
LEDs are installed as indicators.
Raspberry Pi
Arduino Uno
shield
Arduino Uno
Figure 4.2 Stacked controller
38
The temperature and humidity sensors implemented was calibrated to
identify the sensor constant. Table 4.1 and 4.2 shows the sampled analog
values of the temperature and humidity sensors respectively.
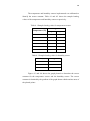
Table 4.1 Sampled analog value for temperature sensor
Temperature (⁰C)
Analog value
Sample 1 Sample 2
29
211
213
30
227
228
31
236
239
33
283
284
35
330
333
40
421
423
Table 4.2 Sampled analog value for humidity sensor
Humidity (%)
Analog value
48
267
68
463
75
479
Figure 4.3 and 4.4 shows the graph plotted to determine the sensor
constant for the temperature sensor and the humidity sensor. The sensor
constant is obtained by the gradient of the graph drawn which touches most of
the plotted points.
39
Graph of Analog value vs Temperature
Analog value
Sample 1
Sample 2
Linear (Sample 1)
Linear (Sample 2)
450
400
350
300
250
200
150
25
27
29
31
33
35
37
39
41
Temperature (⁰C)
Figure 4.3 Graph of analog value vs temperature
Graph of Analog value vs Humidity
Sample 1
Linear (Sample 1)
Analog value
500
450
400
350
300
250
200
40
45
50
55
60
65
70
75
80
Humidity (%)
Figure 4.4 Graph of analog value vs humidity
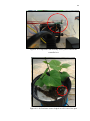
4.2.1.3 Test plants
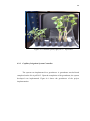
The plants grew up to 10 centimeters tall as of 16th April 2015 (24 days
old). The average leaf count on each stalk was 4 leaves and it is ready to be
transferred into a larger pot. Figure 4.5 shows the cucumber plant (right) on
16th April 2015.
40
Figure 4.5 Cucumber plant (right) on 16th April 2015
4.2.2 Capillary Irrigation System Controller
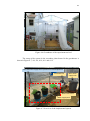
The system was implemented in a greenhouse. A greenhouse was built and
completed on the 26th April 2015. Upon the completion of the greenhouse, the system
developed was implemented. Figure 4.6 shows the greenhouse of the project
implementation.
41
Figure 4.6 Greenhouse of the experiment test bed
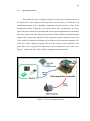
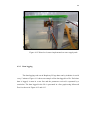
The setup of the system in the cucumber plant located in the greenhouse is
shown in Figure 4.7, 4.8, 4.9, 4.10, 4.11 and 4.12.
Pots and water supply tank is placed on a levelled platform
Controller box
Main water
supply tank
Water level sensor
Water supply tank
Figure 4.7 Overview of the implemented system
42
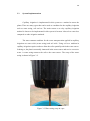
Figure 4.8 Controller placed in a waterproof box on test site
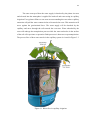
Figure 4.9 Piping of the plants connected in parallel to the water tank
43
Figure 4.10 Temperature and humidity sensor placed outside the
controller box
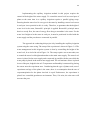
Figure 4.11 Soil moisture sensor lodged in soil in one of the pots
44
Figure 4.12 Water level sensor implemented on water supply tank
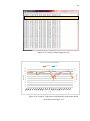
4.2.3 Data logging
The data logging code run in Raspberry Pi logs data sent by Arduino via serial
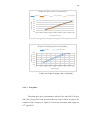
every 5 minutes. Figure 4.11 shows an example of the data logged in a file. Each time
data is logged, it starts in a new line and the parameter received is separated by a
semicolon. The data logged in the file is presented in a line graph using Microsoft
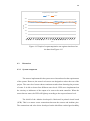
Excel as shown in Figure 4.12 and 4.13.
45
DD/MM/YY; HH.MM; temp; humidity; soil moisture ratio; desired ET; actual ET; desired water level; actual water level;
Figure 4.13 Example of data logged in a file
Temperature and Humidity%
humidity
temp
84
35
82
Humidity%
78
25
76
20
74
72
15
70
10
68
Temperature
30
80
5
66
64
0
Time
Figure 4.14 Graph of Temperature and Humidity against time based
on the data from Figure 4.13
46
Evapotranspiration Rate
ET pot
ET act
300
250
ET value
200
150
100
50
0
Time
Figure 4.15 Graph of evapotranspiration rate against time based on
the data from Figure 4.13
4.3
Discussion
4.3.1 System component
The sensors implemented in the system were chosen based on the requirements
of the system. However, the water level sensor was designed to reduce the cost of the
project. The water level sensor shows consistent results when detecting the presence
of water. It is able to detect four different water levels. LEDs were implemented on
the circuitry as indicators of the output to be sent to the main controller. When the
sensor detects water, the LED will light up according to the respected water level.
The shield of the Arduino developed is fabricated in printed circuit board
(PCB). This is to ensure secure connections between the sensors and Arduino pins.
The connections and valve driver developed on the shield has reached good stability
47
and reliability. LEDs implemented were used as indicators for the valve driver. When
a signal is given, the LED is turned on, indicating that the valve driver is turned on.
All of the test plants sown grew according to the time limit as planned. The
plants were transferred to a larger pot placing two seedlings in one pot.
4.3.2 Capillary Irrigation System Controller
4.3.2.1 Operation manual
To operate the developed system requires several step. The steps are as
the following:
i. Connect all power sources to the socket.
ii. Power on the Arduino
iii. Power on the Raspberry Pi
It is important to power on the Arduino prior to Raspberry Pi. This is
to allow the Arduino board to initialize. The data logging system will
automatically start logging the data upon start up.
4.3.2.2 Results
The system design is to be implemented in a closed area. Due to the
delay in building of the greenhouse, the system implemented on the plants was
also delayed. Although the seedlings were transferred to a larger pot on the
16th April 2015 and the greenhouse was completed on the 26th April 2015, the
48
system was unable to be implemented immediately. There were several
glitches in the programming of the system. This caused the system to be
applied on the crop later on the 8th May 2015. In the duration of the absence of
the system to be implemented, the crop was irrigated using the drip irrigation
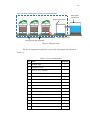
method. Table 4.3 shows the plants growth throughout the experiment.
Table 4.3 Cucumber plant growth chart
Due to the lack of time frame, the results of the research was collected
for a duration of 10 days. This also resulted to the unavailability to measure
the crop outcome as it requires several months to grow the crop and compile
the data.
Despite the issues faced, the capillary irrigation system controller
developed successfully in terms of that it is able to water the crop on its own
varying the water level height according to the environment change. However,
occasionally the system is not able to control water level. Controlling the water
level refers to the actuation of the water pump. For example, although the water
level sensor yields a signal to indicate that it has reached the same level as the
desired water level, the water pump does not receive any signal to switch off.
This is suspected to be due to the unstable wiring connection between the water
level sensor developed and the Arduino shield. In any case that the connection
is faulty, it will cause the failure for the controller to receive the current water
level signal, and thus causing the value in the system not updated and not signal
is set off to turn off the water pump.
49
4.3.3 Data Logging
The Raspberry Pi data logger is written in python language. The program
automatically runs at the startup. To do so, there were several settings that needed to
be modified such as the serial port. Configuring the serial port, the serial port that is
connected to the Arduino needs to be identified so that the data logger is reading from
the correct port.
To log the data received, the data logger opens a file and writes the data. Once
it is written, the data will be saved. The next occurring data will append the initial file.
Therefore, all the data received will be saved into one file.
CHAPTER 5
CONCLUSION AND RECOMMENDATION
5.1
Introduction
Chapter 5 will draw the conclusion of the research conducted. Besides that,
recommendations on how the project could be improved will be shared and discussed
in this chapter. Recommendations made are either from the problems faced in
conducting this project and how to overcome it or suggestions from a third party who
is familiar with this project.
5.2
Conclusion
In this project, the Capillary Irrigation System Controller has been successfully
built. With this system installed, plants is irrigated automatically and is watered
51
according to the plant water demand. Users can monitor the evapotranspiration rate of
the plants as well as the environment change.
To conclude, the objectives of the project is achieved. With only irrigating the
plants according to the environment change, we hope that the water consumption in
the agriculture sector is reduced.
5.3
Recommendation
There are several improvements that can be made in this project for future
research. Firstly, the water level sensor used should be designed using the printed
circuit board once it reaches a stable performance. For a more advance performance,
design the water level sensor that yields an analog output for a more accurate data.
Besides that, the Raspberry Pi can be more utilized by implementing an online
monitoring system. In doing so, users are able to monitor the data logged anywhere
by simply accessing a webpage. Lastly, a sensor can be implemented in the main water
supply tank. The purpose of the sensor is to measure the water consumption of the
system. With this, we are able to measure the volume of water consumed by the plant
as well as measure the efficiency of the system in comparison with the crop outcome.
CHAPTER 6
PROJECT MANAGEMENT
6.1
Introduction
This chapter is will present the project planning in conducting this research as
well as cost of implementing this system. Project planning includes project scheduling
to ensure that the activities are carried out according to the time frame provided. This
project was given eight months for research, designing, implementation and testing.
The cost estimation in every project management is inevitable. This is to ensure that
the project is carried out spending a minimal cost.
53
6.2
Project Schedule
Project scheduling involves the Gantt chart in two parts: FYP1 and FYP2. This
scheduling is planned throughout semester 1 2014/2015 and semester 2 2014/2015.
The Gantt chart shows the progress of the project conducted.
Table 6.1 Capillary Irrigation System Controller Gantt chart (FYP1)
Table 6.2 Capillary Irrigation System Controller Gantt chart (FYP2)
54
6.3
Cost Implementation
Table 6.3 shows the budget plan for the Capillary Irrigation System Controller.
The table displays the hardware requirement and its price list.
Table 6.3 Capillary Irrigation System Controller budget plan
No Item
Price per unit Unit
Total price
1
Arduino Uno
RM58.00
1
RM 58.00
2
Raspberry Pi B+
RM127.40
1
RM127.40
3
DS3231 RTC Module
RM37.10
1
RM 37.10
4
HSM-20G
Sensor RM28.00
1
RM 28.00
Humidity
Module
5
SEN0114 Moisture Sensor
RM23.30
1
RM 23.30
6
LM3234N
RM1.75
1
RM
7
Electronic component set
RM30.00
1
RM 30.00
8
Power cable
RM3 / meter
2 meters RM
9
Rainbow cable 20ways
RM8 / meter
3 meters RM 24.00
10
Adapter 12V 1A
RM18.00
1
Total
1.75
6.00
RM 18.00
RM353.55
REFERENCES
[1]
A. F. Mohd Samsudin (2009), “Agriculture Extension and Its Roles in
Ensuring Food Safety, Quality and Productivity in Malaysia.” University Putra
Malaysia.
[2]
F. H. Ismail, (2007) “Structural change of the agricultural sector: Analysis
based on input-output tables.” Department of Statistics, Malaysia, 1-13.
[3]
C. W. Chan, M. C. Cho (2012), “Asia Pacific Economic Cooperation (APEC)
Workshop on Food Security.” Asia Pacific Economic Cooperation (APEC).
[4]
Newsletter and Technical Publications, “Sourcebook of Alternative
Technologies for Freshwater Augmentation in Small Island Developing
States.”
United
Nations
Environment
Programme
(UNEP),
http://www.unep.or.jp/ietc/Publications/TechPublications/TechPub8d/index.asp#1
[5]
FAO's Information System on Water and Agriculture - Malaysia (2010),
http://www.fao.org/nr/water/aquastat/countries_regions/malaysia/index.stm
[6]
MIDF research article, “Water restructuring exercise must proceed despite
leadership change, as economic losses due to water crisis may be significant.”
MIDF Economic Beat, 28 August 2014
56
[7]
Environment and Natural Resources Series – Volume 1, “Frost Protection:
Fundamentals, Practice and Economics.” Food and Agriculture Organization
of the United Nations ISSN 1684-8241
[8]
B. Tangwongkit, R. Tangwongkit and P. Chontanaswat (2014). “Drip
Irrigation Powered by Solar Cell for Dry Rainfed and No Electricity Area.”
International Conference and Utility Exhibition 2014 on Green Energy for
Sustainable Development, March 2014
[9]
H. Fairweather, N. Austin, M. Hope. “Water Use Efficiency – An Information
Package”, Irrigation Insights Number 5, Land & Water Australia
[10]
D. Rogers et al (1997). “Efficiencies and Water Losses of Irrigation Systems.”
Irrigation Management Series, Kansas State University, May 1997
[11]
H. Dong, W. Wang and D. Cheng. “Analysis on the Change Laws of
Evapotranspiration and Its Influencing Factors in Arid Areas.” Chang’an
University.
[12]
Z. Wei et al. (2011). “The Fuzzy Decision-Making Method of Irrigation
Amount Based on ET and Soil Water Potential.” ICECC, 2011 International
Conference
[13]
Mekonnen, M.M. and Hoekstra, A.Y. (2010) “The green, blue and grey water
footprint of crops and derived crop products.” Value of Water Research Report
Series No. 47, UNESCO-IHE, Delft, the Netherlands
[14]
Cytron Technologies Sdn Bhd, Product User’s Manual – DS3231 RTC
Module, October 2013.
[15]
Houbein, L. (2012) “Outside the Magic Square: A handbook for Food
Security.” Kent Town, S. Australia: Wakefield Press
57
[16]
Yiesla, S. A. (2001) “Watering Correctly Saves Time, Money and Plants.”
Issue August - September 2001, Home Hort Hints, Yard and Garden News for
Northern Illinois
[17]
Marken, B., DeJohn, S., and the Editors of the National Gardening Association
(2012) “Container Gardening For Dummies, 2nd Edition” John Wiley & Sons.
[18]
Irrigation
–
US
Environmental
Protection
Agency.
June
2012,
http://www.epa.gov/agriculture/ag101/cropirrigation.html
[19]
Top 10 Water Waster: From Washing Dishes to Watering the Desert. July
2008, http://www.scientificamerican.com/article/top-10-water-wasters/
[20]
Irrigation Alternatives: How should you irrigate yournplants? 2015,
http://www.acs.edu.au/info/agriculture/farm-management/irrigationoptions.aspx
APPENDIX A
Arduino Uno Main Controller Code
/*******************************************************************
************
* Title : Capillary Irrigation Management System (CIMS)
* Author : Salwa Mohsin
* Version : 1.00
* Date : December 2014
********************************************************************
***********
* Description:
* Arduino code for CIMS
* Used to compute the environment data and determine the evapotranspiration rate
* Output of the system is the controlling of the water valve for water supply
* Sends the data acquired to Raspberry Pi via serial port
* Arduino board used is Arduino Uno
* Final Year project (FKE) 2014/2015
59
*
********************************************************************
**********/
#include <DS1307RTC.h> //Include DS1307 library (which is compatible with
DS3231)
#include <Time.h> //Include Time library
#include <Wire.h> //Include Wire library
//#include "Maxbotix.h"
tmElements_t tm; //Declare tmElements object to store time & date from DS3231
int led1 = 11;
int button1 = 13;
/* sensor input */
const int rawTemp = A0;
const int rawHumid = A1;
const int rawSonar = A2;
const int rawSoil = A3;
const int waterLevel_LOW = 5;
const int waterLevel_MEDIUM = 3;
const int waterLevel_HIGH = 10;
//int waterLevel_MAX = 2;
60
/* actuator output */
int valve_IN = 9;
int valve_OUT;
/* sensor tuned data */
float temp;
//temperature
float humid;
//humidity
float soil;
int waterlevel;
//soil moisture
//height of water level in cm
int tem = 0;
/* algo parameters */
float etpot = 0;
float etact = 0;
float kc = 0.75;
float ks;
float d = 11; //hours of sun exposure
int des_water;
float humid_percent;
int counter = 0;
61
void setup()
{
analogReference(DEFAULT);
pinMode(rawTemp, INPUT);
pinMode(rawHumid, INPUT);
pinMode(rawSoil, INPUT);
pinMode(waterLevel_LOW, INPUT);
pinMode(waterLevel_MEDIUM, INPUT);
pinMode(waterLevel_HIGH, INPUT);
pinMode(valve_IN, OUTPUT);
pinMode(4, OUTPUT);
Serial.begin(115200);
}
void loop()
{
digitalWrite(4, HIGH);
while(1){
readSensor();
compute_data();
/* determine desired water level */
62
if (etpot-etact > 50){
des_water = 10;
}
else if (etpot-etact <= 50 || etpot-etact >= -50){
des_water = 12;
}
else if (etpot-etact < -50){
des_water = 14;
}
/* assign output */
if (waterlevel < des_water){
digitalWrite(valve_IN, HIGH);
}
else {
digitalWrite(valve_IN, LOW);
}
if(counter++ >= 20){
if(RTC.read(tm)){
//data received from RTC module
printTime();
}
else {
//data not received from RTC module
if(RTC.chipPresent()){
//RTC module is connected
63
Serial.println("DS3231 Stop. Load Set Time");
}
else {
//RTC module is not detected
Serial.println("Error. Check connections");
}
}
printSerial();
counter = 0;
}
}
}
void readSensor()
{
/* Compute the sensor values */
temp = (analogRead(rawTemp) - 2887)/-84.33;
humid = (analogRead(rawHumid) - 1162)/-12;
soil = (analogRead(rawSoil));
/* determine water level */
if(digitalRead(waterLevel_LOW)){
if (digitalRead(waterLevel_MEDIUM)){
64
if(digitalRead(waterLevel_HIGH)){
digitalWrite(valve_IN, LOW);
waterlevel = 14; //water level >= 14cm
}
else {
waterlevel = 12;
//12cm <= water level < 14cm
}
}
else {
waterlevel = 10;
//10cm <= water level < 12cm
}
}
else {
waterlevel = 9;
}
}
void compute_data()
{
float etref = 500;
//water level < 10cm
65
humid_percent = humid/100;
ks = soil/920; //in data/in range
etact = ks*kc*etref*humid_percent;
etpot = d*temp*humid_percent;
}
void getTime(unsigned char num)
{
unsigned char byte_temp;
byte_temp = num/10;
Serial.print(byte_temp);
byte_temp = num%10;
Serial.print(byte_temp);
}
void printTime()
{
/* Print time in serial */
getTime(tm.Day);
Serial.print("/");
getTime(tm.Month);
Serial.print("/");
66
getTime(tmYearToY2k(tm.Year));
Serial.print("; ");
getTime(tm.Hour);
Serial.print(".");
getTime(tm.Minute);
Serial.print("; ");
}
void printSerial()
{
/* Serial data send to Raspberry Pi */
Serial.print(temp);
Serial.print("; ");
Serial.print(humid);
Serial.print("; ");
Serial.print(ks);
Serial.print("; ");
Serial.print(etpot);
Serial.print("; ");
Serial.print(etact);
Serial.print("; ");
Serial.print(des_water);
Serial.print("; ");
Serial.print(waterlevel);
67
Serial.println();
}
APPENDIX B
Data Logger Code (Raspberry Pi)
import sys, serial,time
from matplotlib import pyplot as plt
# set the serial port the Arduino is connected to
#! /usr/bin/env python
import sys, serial,time
from matplotlib import pyplot as plt
# set the serial port the Arduino is connected to
serPort = '/dev/ttyACM0'
# open the file for writing
69
dataFile = open("./loggedData.txt","a");
print "\n********************************************************"
print "\nLog Data"
print "\nAttempting to open Serial Port : ",serPort,"for logging\n"
# opens usb serial port for logging
ser = serial.Serial(serPort,115200)
# checks the port is open
if (ser.isOpen() == False):
print "ERROR : Unable to open serial port ",serPort,"\n"
exit(0);
else:
print "Port ",serPort," opened\n"
# force print to console
sys.stdout.flush()
# waits for signal from user to start logging
##print "Hit return to start logging ..."
##key = sys.stdin.readline()
# sends signal to start logging
70
##ser.write('1');
print "Logging Started. CTRL-C to stop\n"
while True:
try:
# read data from serial writes to stdio and dataFile
line = ser.readline()
print line;
dataFile.write(line)
except KeyboardInterrupt: #CTRL-C triggered here
# sends signal to stop logging
ser.write('0')
print "Logging Stopped\n"
break;
# close the serial port
ser.flush()
ser.close()
71
# close the datafile
dataFile.close()
print "Port ",serPort," closed\n"
print "\n********************************************************\n"
# rest for 3 seconds
time.sleep(3)
APPENDIX C
Arduino Shield Circuit Design Connection
APPENDIX D
Water Level Sensor Circuit Design