1
Loughborough University
Institutional Repository
A multi-mode sonar
transmitter
This item was submitted to Loughborough University's Institutional Repository
by the/an author.
Additional Information:
• A Masters Thesis. Submitted in partial fullment of the requirements for
the award of Master of Philosophy of Loughborough University.
Metadata Record:
Publisher:
https://dspace.lboro.ac.uk/2134/18581
c Anthony David Goodson
This work is made available according to the conditions of the Creative
Commons Attribution-NonCommercial-NoDerivatives 4.0 International (CC BYNC-ND 4.0) licence. Full details of this licence are available at: https://creativecommons.org/licenses/bync-nd/4.0/
Rights:
Please cite the published version.
...••
LOUGHBOROUGH
. UNIVERSITY OF TECHNOLOGY
LIBRARY
! AUTHOR/FILING TITLE·
--- -______ __G-_~_~~.9_~+ __ l\_~______ _________ _
-------------------------------- --- ----- -
, ACCESSION/COPY NO.
- -----
----
j----------------- 033"1').;
---- --- ----e'2...
-- ------------ - --- - - --
,.....
t.·
,
',.'
I VOL. NO.
I
CLASS MARK
t.·,
"1
~------+-------~-------
,;
.....
3
2""AR 1999
2 6APR 1999
.'
•. ,0,
;."
LB f2lf2l33727f2l23
111111111 11 I11 I1IIIIIIIIm 11111111111111111111111
"
A MULTI-MODE SONAR
TRANSMITTER
by
Anthony David Goodson
A Masters Thesis submitted in partial fulfilment of the
requirements for the award of Master of Philosophy of the
University of Technology, Loughborough, England.
August 1989
Department of Electronic and Electrical Engineering.
Loughborough University of Technology.
©
by Anthony David Goodson, 1989.
Acknowledgements.
[would like to express my thanks to the following:
First to Professor Roy Griffiths who, in guiding the Sonar Research
Group activity, has provided an unfailing source of ideas.
Funding for this work was provided by the Ministry of Defence
(Procurement Executive) through the Admiralty Research Establishment Teddington. Contract NoD/ERI/9/4/2170/0I04.
To Dr.J.Cook of ARE for arranging access to the trials facilities on
the Admiralty Acoustic Ranges and for his support during the discussion of
ideas and the evaluation of the results. Derek White and Tony Dicker of ARE
for arranging the logistic support and instrumentation recordings of the sea
trials. The practical assistance from the ARE Technical Support Group at
Lochgoil while conducting these was particularly appreciated.
The Severn Trent Water Authority for permission to use the South Derbyshire reservoirs at Melbourne and Foremark.
Mike Lorge and the Area District Controllers:
Dai Davies, Allan Bird and Douglas Ball.
The Water Bailiffs at Foremark:
Peter Harrison and Colin Lawrenson.
To my colleagues at Loughborough University who have been involved in various aspects of this work at different times and particularly to
those who shared in the winter measurement trials including:
Dorothy Anne Lees and Keith Lowe.
Avtar Gida, Bill Wood, Phil Hill and David Payne.
Technicians, Gary Wagg et al. who helped deploy and recover the
equipment at Foremark.
[an Sinclair and Dr.Bryan Woodward for diving support during investigation and redeployment of targets in Foremark.
Roger Mayo and colleagues in the Civil Engineering Department for
survey work at Foremark and for the subsequent sub-surface computer terrain modelling.
Anthony David Goodson
i
August 1989.
A MULTI-MODE SONAR TRANSMITTER.
Abstract
This project was initiated to evaluate appropriate microprocessor and
digital logic techniques that could increase the flexibility and effectiveness of
a sonar transmitter. The study led to a multi-channel signal synthesis concept
designed to exploit 'phased array' steering techniques. Two versions of the
equipment have now been built and evaluated. Mk.I is a relatively low power
15 channel system with 2 kilowatts total electrical power using a 40 kHz
15 A. x 1 line array. This system proved the practicability of the basic concept and its success led to the 16 kilowatt Mk2 high power version which
drives a 16 A. x 16 A. wideband transducer array.
The study included:
The design and construction of a multi-channel signal generator.
The writing of control and signal synthesis software.
The design, evaluation and commissioning of suitable linear power
amplifiers .
Investigations into suitable transducers and phased array design, leading to the manufacture of suitable matched wide band multi-channel 'staved'
transducer arrays.
Finally, a series of trials were made in a variety of open water conditions to evaluate the systems performance and investigate the multiple modes
of operation that have been developed.
The system has successfully demonstrated that transmitter beam steering is both practical and flexible. The techniques implemented permit sector
interrogation by 'within-pulse' type sweeps, by 'Ripple-fire' and by transmitting steered 'Pings' sequentially on prededermined bearings. Each mode allows considerable flexibility in the generated waveform shape and frequency.
The 'Multi-Mode' capability of this approach was conceived primarily as a research tool but many of the modes can be isolated and exploited in
dedicated applications.
ii
A MULTI-MODE SONAR TRANSMITTER
by A.D.Goodson
CONTENTS.
Acknowledgements.
Abstract.
Contents
GLOSSARY
Lists of Symbols
List of Figures.
Chapter 1
1.0
1.1
1.2
1.3
i.
ii.
iii
vi.
viii.
INTRODUCTION.
Sonar Transmitter Evolution.
Transmitter Driver Technologies.
Signal Waveform Synthesis.
Design Objectives.
MODES OF OPERATION.
Chapter 2
2.0
Introducing the Multi·Mode Concept.
2.1
Steered beams.
2.2
Ripple fIre.
2.3
Swept 'within-pulse' transmissions..
2.4
Focussing.
2.5
Sidelobe Shading.
2.6
High Power Non-Linear Operation..
2.7
Bearing Coded Transmissions.
2.8
Test Signals.
Chapter 3
HARDWARE.
3.0
Hardware Introduction.
3.1
Micro-Computer.
1.
2.
3.
4.
6.
9.
13.
13.
16.
18.
19.
20.
22.
25.
25.
iii
3.3
3.4
3.5
3.6
3.7
MOSFET Power Amplifiers.
High Power Linear Amplifiers.
Power Amplifier Performance Summary.
Transducers and Arrays.
Wide Band Transducer Elements.
High Power 256 Element Array.
3.8
3.9
Mk.2. Array Tests.
Mk.2.Array Parameter Summary
3.2
29.
30.
35.
38.
39.
41.
45.
47.
Chapter 4
SOFTWARE.
Software Introduction.
4.0
Languages. Z80 Assembler / Basic / Pascal.
4.1
System Software.
4.2
Program Example - Data Synthesis.
4.3
Program Example - Data Handling and Control.
4.4
Summary of Software used for Lochgoil Trials.
4.5
48.
48.
50.
51.
54.
57.
DATA ACQUISITION.
Chapter 5
Acoustic Measurement and Trials Range Facilities.
5.0
Loughborough University's Acoustic Test Tanle
5.1
King George VI Reservoir, Staines.
5.2
Foremark Reservoir, Derbyshire.
5.3
Maytime, Lochgoil, Argyle.
5.4
Sonar Receivers.
5.5
Hydrophones and Preamplifiers.
5.6
Data Logging and Signal Analysis Equipment.
5.7
60.
61.
62.
62.
66.
68.
68.
69.
TRIALS RESULTS.
Chapter 6
Initial System Tests - Beam forming and Focussing.
6.0
Beam Forming and Shading.
6.1
Beam Steering.
6.2
Sector Scanning - Ripplefire and Sweep Modes.
6.3
Source Levels and Non-Linear Acoustics.
6.4
Source Level Results.
6.5
Reference target detection - Foremark.
6.6
71.
74.
76.
78.
80.
82.
83.
iv
Chapter 7
7.0
7.1
7.2
CONCLUSIONS & DISCUSSION.
Objectives and Conclusions..
The Advantages of a Multi-Mode System..
General Discussion.
7.3
7.4
7.5
System Reliability.
Improving Hydrophone Data Acquisition.
Future developments.
.
REFERENCES.
List of References.
I
IT
III
85.
86.
87 .
88.
89.
90.
93.
APPENDICES.
Drawings and Circuit diagrams.
The LUTEE Beam Plotter.
Program Software Listings.
v
GLOSSARY
0.1
LIST of SYMBOLS and ABBREVIATIONS
AID
ALS
ARE
ARE(T)
ARE(P)
ARE(LG)
Bt
k
kbt
CMOS
CPM
dB
D/A
DSP
EPROM
FFT
LS
HCT
LUT
LUTEE
MOSFET
NLA
OEM
P
~
Analogue to Digital conversion.
Advanced Low power Schottky Logic. e.g.74ALSOO.
Admiralty Research Establishment.
ARE(Teddington),
ARE(Portland),
ARE(Lochgoil).
Byte. - 8 bit word.
kilo = 103
kilobyte. - 1024 bytes. or $400 (Hexadecimal) bytes
Complementary Metal Oxide Silicon
(Field effect transistors and logic elements.)
8080 and Z80 micro-computer disk operating system.
Digital Research Trademark. CP/M.
deciBel
Digital to Analogue conversion.
Digital Signal Processor. - A specialised microprocessor with
an architecture optimised for very fast multiplication, data
manipulation and transfer. e.g.TMS320c25 or MC56000.
Electrically Programmable Read Only Memory.
Fast Fourier Transform.
Low power Schottky Logic. - e.g. 74LSOO
High Speed CMOS logic. - e.g. 74HCT244 .
Loughborough University of Technology,
Electronic & Electrical Engineering Department at LUT.
Metal Oxide Silicon Field Effect Transistor.
Non Linear Acoustics - Parametric Sonar.
Original Equipment Manufacturer.
Pascal. ISO unit of pressure.
micro-Pascal.
vi
PlO
Parallel In/Out - Microprocessor peripheral.
communication port - Dual 8 bit parallel data.
Q
Quality factor of a resonant network. Usually expressed as
the ratio of Centre Frequency to Bandwidth.
ROV
Remotely Operated Vehicle. Small submersible vehicle
carrying instrumentation, TV cameras etc., used for
inspection work especially where divers would be at risk.
Usually controlled from the surface by an umbilical cable.
RISC
Reduced Instruction Set Computer.
RAM
Random Access Memory.
ROM
TTL
Read Only Memory.
Transistor Transistor Logic Family.
UART
Universal Asynchronous Receiver Transmitter.
Serial data communication port device.
Greek symbol useage.
= one wavelength.
A.
lambda
~
mu
1t
Pi
e
Theta = Angle of propagating wavefront to array face.
ro
21tf = Angular frequency.
. = 10-6.
= micro
= 3.141592654' or computed from 4 * Atn(I).
Psi = Inter-element phase shift in array.
vii
LIST OF FIGURES
2.0/1
2.0/2
2.0/3
2.0/4
2.0/5
2.1/1
2.1/2
2.1/3
2.2/1
2.3/1
2.3/2
2.3/3
2.3/4
2.4/1
2.4/2
2.4/3
2.7/1
2.7/2
2.7/3
2.8/1
2.8/2
2.8/3
Beam Steering Diagram
15 element point source array 1 lambda pitch.
Predicted response of array based on actual dimensions.
Predicted response of array in phase steered increments.
Block diagram of RAM buffers and Host computer memory map.
RAM Buffer contents unsteered 0°.
RAM Buffer contents steered 2°.
RAM Buffer contents steered 4°.
Ripple fIre timing skew across the sector.
Swept pulse across sector.
Buffer contents - 1 millisecond sweep - 1st part.
Buffer contents - 1 millisecond sweep - 2nd part.
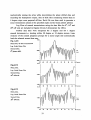
Hydrophone response to a sweep signal.
Buffer contents 9 metre focus.
Buffer contents 2 metre focus.
Buffer contents 1 metre focus.
Three contiguous sweep transmissions, (1+5+1 milisecs)
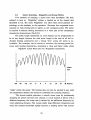
Hydrophone response on 0° axis
Hydrophone response on +24° axis.
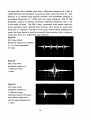
Test signal - channel alignment - misaligned.
Test signal - channel alignment - adjusted.
Test signal - 36-50 kHz multiburst.
3.2/1
3.3/1
3.3/2
3.3/3
3.3/4
3.4/1
Mk.1 transmitter assembly.
The laboratory prototype 2 x 1 kilowatt AmplifIer
Prototype amplifIer full power output, +/- 70 volt supply rails.
Prototype amplifIer output with raised supply rails, +/- 80 volts.
Production Design AmplifIer at full power.
Frequency response of the complete Mk.2 high power system
including the power amplifIers and transducer.
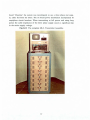
The Mk.2 transmitter assembly.
Transducer Array - construction detail.
3.4/2
3.5/1
viii
3.5/2
3.6/1
3.6/2
3.7/1
3.8/1
3.8/2
3.8/3
3.8/4
3.8/5
3.8/6
3.8n
3.8/8
15 element Mid Array.
1.0.S Transducer element construction.
Universal Sonar Ltd. - Mk.2. Wideband transducer.
Mk.2. Dual array being deployed at Foremark reservoir.
Multiburst test signal - Full 256 element array.
Multiburst test signal - First 128 element half array.
Multiburst test signal - Second 128 element half array.
Beam plot of the full array at 42 kHz.
Beam plot of the fIrst half array.
Beam plot of the second half array.
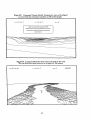
Foremark Reservoir Lakebed - Mechanical scan -6 degrees tilt.
Foremark Reservoir Lakebed - 800 metre sector.
5.1/1
5.2/1
5.3/1
5.3/2
5.3/3
5.4/1
LUTEE Acoustic test tank.
Trials Facility at Staines Reservoir. - Hydrophone support deployed.
Foremark Reservoir and Draw Tower.
Foremark - Outer working platform with array support etc.
Foremark - Underwater Computed Terrain Model.
Maytime Acoustic Range Facility in Lochgoil.
5.4/2
5.4/3
Lochgoil - Computed Terrain Model viewed from transducer position.
Lochgoil Modelled with 50 metres of water removed.
6.0/1
6.0/2
6.0/3
6.0/4
6.0/5
6.1/1
6.1/2
6.1/3
6.1/4
6.1/5
6.1/6
6.2/1
6.2/2
6.2/3
Beamplotting arrangements at Staines.
Mk.1.Array Beam Plot, 200 degree scan.
Mk.1.Array Beam Plot, 40 degree scan.
Beam Plot at 2 metres range. Inside the near field.
Beam Plot at 2 metres range. Focussed data.
Theoretical Beam Pattern of a 15 element 1 lambda pitch array.
Theoretical pattern with Dolph-Chebychev shading (20:1).
Mk.1 Array plot - Unshaded 38 kHz.
Mk.1 Array plot - Dolph-Chebychev shaded.
Theoretical pattern with array phase errors added.
Theoretical pattern with phase errors and Dolph-Chebychev shading.
Beam Plot - Mk.2 Array - 8° steered data - log plot.
Beam Plot - Mk.2 Array - 15° steered data.
Beam Plot - Mk.2 Array - 28° steered data.
ix
6.3/1
6.3/2
6.3/3
6.3/4
6.4/1
6.4/2
6.611
6.6/2
6.6/3
6.6/4
Beam Plot - Ripplefrre Transmission.
Hydrophone response to a 4 x 1 ms Sweep Pattern.
Hydrophone response to a 7 ms Sweep pattern.
7 ms Sweep - Hydrophone placed 30° off-axis.
NLA transmission spectrum.
Foremark NLA beamwidth.
Mid-water -18 dB reference target.
Reference Target echo - 0 degrees tilt.
Reference Target multiple echoes.
Reference Target - Bottom reverberation 2 degrees tilt.
x
A MULTI·MODE SONAR TRANSMITTER
Chapter 1
INTRODUCTION.
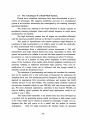
1.0
Sonar Transmitter Evolution.
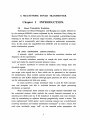
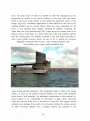
Techniques for Sound Navigation and Ranging are usually referred to
by the acronym SONAR a name originated by the American Navy during the
Second World War. In recent years the term has acquired a generalised usage
referring to all forms of acoustic target location, including passive detection
systems and is occasionally used when referring to underwater communications. In this study the unqualified term SONAR will be restricted to mean
active echolocation systems.
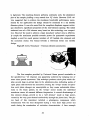
All sonar echolocation systems comprise:
A transmit signal synthesiser to defme the waveform, duration and
frequency of the transmission.
A transmit transducer assembly to couple the drive signal into the
water and create the required acoustic pressure waves.
A receive transducer to convert the incident echo energy back into
electrical signals.
A receiver amplifier and signal processing system to detect and convert target echo signals into a form which can be presented to the operator
for interpretation. Most modem systems present the echo information using
cathode ray tube (CRT) displays although paper printouts are still in common
use for echosounders and side-scan sonars.
In many systems a single transducer array is used for both transmission and reception and this is switched between the signal processing
electronics as required.
Most commercial sonar systems use a single channel transmitter and
the associated receiver either exploits the vessels forward movement as a
scanning axis (Side-scan) or, if the transducer is rotatable, may scan mechanically by transmitting on adjacent bearings progressively across a sector. The
more sophisticated 'within pulse' sector scanning systems use a multichannel
receiving transducer and employ modulation techniques! to scan a sector. For
each time resolvable range 'cell', as the transmit pulse propagates, the
1
receiver direction of maximum sensitivity is scanned across the sector to
determine the bearing of target echoes within the cell. This process is
repeated continuously and generates a range / bearing 'raster' display of the
full sector for each transmit inter-pulse period. Military and commercial systems utilising 'within pulse' scanning include Plessey's Type 193 mine hunting sonar and the Marconi Hydrosearch equipment. The circuit complexity of
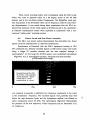
such receivers is very high and it is only in recent years that the use of digital synthesis has successfully simplified this technique? To date the concept
of phase steering the transmitted beam pattern does not seem to have attracted much suppon, probably a direct economic consequence of increased
circuit and array complexity. The advantages of such techniques in the
electromagnetic spectrum, 3, are well established and are exploited in the
elevation scanning mode of a number of modem 'phased array' radars. e.g.
Marconi 'Manello', Plessey AR-320 and lTT's 'Gilfillian' etc., 4. Theoretically it is feasible to exploit similar phase steering techniques in a sonar transmitter system. In water the low propagation velocity of the acoustic wave
provides a significant time 'window' between transmissions, a parameter not
easily exploited in radar. The steady increases in computational speeds of
digital signal processors seems likely to encourage the development of adaptive techniques in which echo responses can be used to define the subsequent
transmission. The design of a sonar transmitter with controlled inertia free
beam steering and flexible waveform synthesis is a step towards this objective.
This project implements an azimuth steered phased array sonar transmitter, based on micro-computer techniques, and evaluates the system performance in a variety of operational modes.
Transmitter Driver Technologies.
Many technologies have been employed to generate high acoustic
source levels in the water to insonify potential targets ranging from explosive
charges, electro-magnetic 'boomer's, capacitive discharge 'sparkers' to the
use of compressed air driven mechanisms. However, for the majority of
sonar applications, systems which drive a piezo-electric or magneto-strictive
transducers have remained the most adaptable. Electrical signal synthesis
techniques for these transducers have evolved from the long lived 'tone
wheel' interrupters used in the World War IT type 144 ASDIC to the
1.1
2
electronic oscillator and power amplifier which displaced them by the mid
1950's
Thermionic valve power amplifier designs must now be regarded as
obsolete. The bi-polar transistor, which finally replaced the valve for power
amplification applications, now competes with a range of power MOSFET
devices which already threaten to supercede them for many applications.
Most modern sonar transmitters are built using transistor switching techniques which offer excellent power efficiency but frequently generate coarsely
'quantised' waveforms which necessitate narrow band filtering in the final
coupling stage if unwanted modes of vibration are not to be excited within
the transducer.
Linear power amplification was selected for this project, primarily to
maintain the system bandwidth, as the possible use of the system with widely
different frequency transducer arrays was considered likely. Advantages were
also forseen for a system which could exploit wideband transmissions with
defined amplitude characteristics. These ideas required initial investigations
into power amplification techniques using MOSFETs and led to the commissioning of some useful, Kilowatt rated, sonar amplifier modules,S.
1.2
Signal Waveform Synthesis.
During the late 1970's investigations into suitable bi-polar designs for
high power sonar transducer drivers explored and exploited digital logic techniques to simplify the control, frequency generation and synthesis of the
drive waveform. This research at Loughborough, 6 - 7, led to the development of a family of efficient 'switched mode' power transmitters operating at
frequencies up to 300 kHz and at peak power levels approaching 20
kilowatts. The gated pulse train of these transmitters were typically adjustable
between 50-200 microsecond pulses with repetition rates between 0.25 and 1
second. The waveforms were very coarsely synthesised 2 bit resolution 'sine'
waves (three amplitude levels) which necessitated sharply tuned coupling
transformers. These transmitters were designed primarily for use with scanning sonar receivers and were successfully applied at frequencies down to 40
kHz. and many of the units constructed are still in use, 8. Dedicated transmitter designs where the frequency is crystal derived to match a specific
transducer and which utilise highly tuned output transformers to filter the
coarsely stepped drive waveforms are inflexible devices when an operational
3
choice of arrays is needed or when broad band signals for correlation applications are required. These design limitations resulted in suggestions that a
modem microprocessor controlled frequency synthesis approach should offer
a more flexible alternative.
This project was initiated with an investigation of available frequency
synthesiser techniques which might simplify the generation of precise signal
frequencies to suit alternative transducer arrays. The results of this investigation indicated that synthesis using a simple 8 bit microcomputer could be
both cost effective and flexible. If a relatively large number of digital
samples are computed for each waveform cycle, then the need for high 'Q'
band limiting filtering to smooth the resulting analogue signal is removed
and the phase and amplitude of the signal can be defined accurately and
repeatably. The use of a dedicated microprocessor, running a control program
reading waveform codes stored in memory, is a cost effective alternative to
the hard wired logic of earlier transmitters.
To exploit the possibilities of this approach fully, more operator interaction is required, which necessitates a keyboard and visual display unit. The
consequent increased equipment cost has fortunately been matched by the
rapid reduction in costs of the small mass produced 'single board' micro-computer.
1.3
Design Objectives
Traditional sonar transmitter designs are dedicated pieces of hardware
with relatively rigid parameters. A simple transducer replacement often requiring internal modifications, i.e. a change of output filter and the crystal
reference. In modern. sonar equipment the generation of the transmit
waveform has already moved away from gated analogue techniques towards
the digital synthesis domain. Computer logic elements have simplified the
pulse timing and analogue output signals derived from D/A conversion are
now common place, often deriving the signal parameters from a PROM 'lookup' table. The direct computation of the waveform using a microprocessor is
a logical development and the synthesis of multiple phased related signals
has been examined. Exploiting microprocessor techniques to replace hard
wired logic permits a signal synthesiser design to add considerable flexibility
through software, offering both standardisation and simplification of the
electronic hardware. This project was initiated, after an investigation into
4
microcomputer signal synthesis demonstrated that computation of the signal
wavefonn could be a very flexible tool. Establishing the feasibility of extending such micro-computer signal generation to control and exploit a multichannel transducer array as a steerable 'phased' array sonar is therefore the main
objective. It was recognised at the start that a single 8 bit micro-processor's
computational speed would limit the direct synthesis concept to very low frequency multi -channel applications. While a multiple processor approach is
considered feasible, the technique exploited separates the wavefonn synthesis
computation from the transmission in order to achieve realistic operating frequencies with a minimum of complexity. The synthesised multichannel
wavefonns, pre-calculated 'off-line' are stored for fast simultaneous access in
parallel digital RAM buffers, 9.
This technique has now evolved into a self contained microcomputer
controlled 'multi-mode' sonar transmitter driving a multichannel transducer
array, the combination of which permits a large number of operational modes
to be evaluated. Two practical systems have been developed; Mk.1. a relatively low power 2 kilowatt 15 channel configuration and Mk.2. a much
higher power 16 kilowatt system intended to extend the techniques into nonlinear sonar research. The further development of this high power transmitter
into the non-linear operational modes is on-going research and some initial
encouraging results have been published in recent conference papers, 10 -11.
5
A MULTI-MODE SONAR TRANSMITTER
Chapter 2 MODES of OPERATION.
2.0
Introducing the multi-mode concept
A sonar transmitter capable of producing several simultaneous phase
related signals can be used to drive a multi-element transducer array to inject
phase related acoustic signals into the water from different positions distributed along the array. The interaction of the resultant individual wave
fronts can be exploited to generate a coherent response which can be steered
in a desired direction. If all the transducer channels are driven with identical
signal data then the array will form its main directivity 'lobe' along the axis
perpendicular to the array face. This 'broadside' response typifies most
transducer array applications where a single signal source drives all the array
elements in parallel. If the array is subdivided into individual elements or
'staves', then the application of a uniform progressive phase shift to each elements' driving signal will cause the principal lobe to be formed and
propagated off-axis. The amount of angular shift obtained being a function of
the array element spacing and the relative phasing of the drive signals.
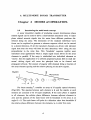
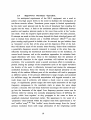
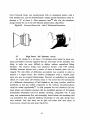
Fig.2.0!l
For beam steering l, consider an array of N equally spaced elements,
(Fig.2.0/1). The spacing between each element is d and the signals at each
element are assumed to be of equal amplitude. If the same phase is applied
to all elements, the relative phase difference between adjacent elements is
zero and the position of the main beam will be broadside to the array at an
angle e = O. The main beam will point in a direction other than broadside if
the relative phase difference between the elements, \jf, is other than zero.
6
The direction of the main beam is at an angle
is
eO when the phase difference
'V = 2 * 7t ( d / A. ) sin eO
The phase at each element is therefore
'Vc + ~'V, where ~ = 0,1,2, ... ,(N - 1),
and 'Vc is any constant phase applied to all elements.
The normalised radiation pattern of the array when the phase difference
between adjacent elements is 'V is given by
Go = sin2 [ N * 7t ( d / A.) (sin e - sin eO ) ]
NZ * sin2 [ Tt ( d / A. ) ( sin e - sin eo ) ]
The maximum of the radiation pattern occurs when sin
e = sin eO
The Mk.1.'multi-mode' system was constmcted with the exploration
of phased array techniques as one of the prime objectives. This equipment initially used a single line array comprising 15 sandwich transducers equally
pitched at 40 mm spacing with a centre frequency of 39 KHz. The use of a
one lambda pitch array can be shown to produce not only the required 'broadside' response but an additional significant 'endfrre' mode. Utilising these
array dimensions, computer modelling techniques were employed to establish
the theoretical directivity pattern and to predict the modified response
produced by the circular transducer piston heads, (fig.s 2.0/2 & 3). The computed patterns demonstrate that the unwanted 'endfire' component is reduced
significantly in practice by a shading factor defmed by the transducer elements finite dimensions, (0.95 A. diameter), In freshwater, assuming c=1460
rn/s, the model predicts that the 'endfrre' grating lobe will be shifted from 90
degrees towards 75 degrees off axis when all the elements are fed with the
same phase, (1.04 A. inter-element pitch). The effect was observed to occur
during the reservoir trials. Computer modelling also demonstrates that a
lambda pitch array can be phase steered through an angle of one radian. At
deflected angles of plus or minus a half radian from the centre axis the diffraction secondary lobe will be equal in amplitude to the steered main lobe
and this defines the useable scanned sector. This grating lobe can be shown
to be generated from the phase shifted 'endfire' response. At this maximum
steered angle the symmetrical dual lobes will generate ambiguous echo
responses from targets at either edge of the sector. Since the array response
7
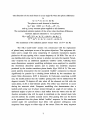
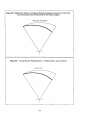
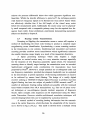
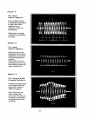
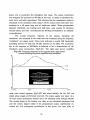
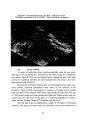
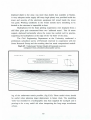
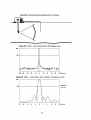
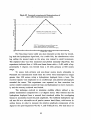
Fig.2.0 / 4.
Computed plot of a
15 element 1 A. pitch
array. Phase Steered
0.5 radians off axis
to demonstrate the
equal amplitude
diffraction lobes.
1111%
15 ELEHENT RRRAT - RJPPlEFIREO ACROSS SECTOR
The plot also includes
an overlay of the
peak responses
produced by a set of
steered data files.
demonstrating the
Ripple fIre response.
"
8
using real elements with directivity can be shown to be the point source diffraction pattern multiplied by that of the individual element, the peak
amplitude response as the array steers off axis will be progressively reduced,
(fig.2.0/4). This theoretical plot includes an overlay of 16 phase steered
beams whose peak amplitudes reflect the effect of the individual elements'
directivity. The pattern generated by these peak responses simulates the effect
of a sector scanning 'ripplefrre' transmission.
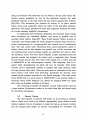
To implement these theoretical predictions the necessary phase related
drive waveforms are calculated digitally and stored in parallel sets of
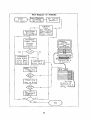
auxiliary RAM buffers, (fig.2.0/5). These RAM memory buffers co-exist as
'read only' data banks outside the micro-computer's memory map, and are accessed simultaneously by a programmable read control card at transmission
time. The read control card, functioning from control parameters stored in
latches, clocks out the data samples into parallel sets of D/A converters and
the resulting phase locked analogue signals are amplified and used to drive
the transducer staves. The host micro-computer accepts parameters from the
operator console and programs the control card to implement them. During
the file transfer process data from disk is first loaded into a scratch pad area
at $SOOO-SFFF in the microcomputer memory. This temporary area is required while demultiplexing the block file into 16 channels. Each buffer
memory card is sequentially enabled, in parallel with main memory, while
the copy process takes place. There are some areas of contention in the computer memory map which need protecting, specifically the dynamic stack
created during program execution by the Pascal language. This stack exists
below $DOOO and as a result access to $COOO-CFFF in the auxilary buffers is
restricted. These buffer addresses are utilised by mapping ROM test signal
data which are therefore available at all times.
The remaining accessible 20 kilobytes of each buffer permits data for
a large number of alternative modes to be called from disk and stored ready
for immediate transmission.
2.1
Steered Beams.
The data required to generate CW pulses on any bearing is minimal.
Only a single cycle needs to be defined, appropriately phase shifted in each
channel, together with an arrangment to repeat this data as necessary to establish the required pulse length. In practice oversampling the waveform will
9
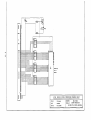
Fig.2.0/S Block Diagram of the Auxiliary Memory Buffers and the
Host Microcomputer Memory Map.
S Auxiliary Ram Buffers, 32 Kilobytes Each Page.
Addressed $SOOO ·FFFF
$ FFFF - TOP OF RAM
S Kilobyte T.P.A. RAM
$ COOO - T.P.A. RAM
Overwritten During Auxiliary
Buffer Loading.
SOOO 1 Kbyte DISK FILE
PAD RAM FOR
16 ANALOGUE OU1PUTS TO
DRIVE POWER AMPLIFIERS
FOR THE STAVED ARRAY.
10
reduce the filtering requirements and at 40 KHz it has proved convenient to
sample at 500 KHz. A block of data containing 256 samples (100
Hexadecimal) has proved easy to manipulate and can contain several complete cycles of the carrier data. To establish a transmit pulse of given duration this block of data needs to be recirculated, which implies that the data
pulse length will be incremented block length steps, (0.512 millisecs increments). The sample block must contain an integer number of carrier cycles if
a repeating phase shift 'glitch' in the transmission is not to occur at the
block boundary. As the length of the data block in circulation can be adjusted to any number of samples (1-255) the block technique does not restrict
precise frequency generation, provided that the frequency of the waveform
data is the same for each channel. Beam steering becomes possible by 'rotating' the waveform data within the block, by an appropriate number of clock
cycles, to generate the progressive phase shifts required to beam steer in a
specific direction. Long pulses are constructed from up to 256 repeated block
lengths (131 millisecs). The system was originally intended to synthesise a
maximum pulse length of 100 milliseconds.
This economical use of buffer memory permits the stacking of 16 sets
of bearing data in a 1000 Hex 'stack'. The discrete bearings stored in individual 'blocks' within this stack can then be re-addressed instantly, enabling very flexible beam switching to 'interrogate' selected parts of a 60 degree sector. For pulses longer than 131 milliseconds the contents of the stacked memory can be transmitted contiguously, i.e. as each block of data completes its programmed recirculation the transmission continues using the next
block in the stack until all the blocks have been utilised.
This technique provides for either a very long pulse of 2 seconds
maximum duration (16 x 131 rnillisecs) or, for unique data that cannot be
recirculated, a maximum pulse length of 8 milliseconds.
Specific data for regular usage, e.g. the steered channel data, can optionally be stored in EPROMs for dedicated applications and, as these fixed
buffers can be located at different memory addresses from the RAM 'scratch
pad' versions, they can be utilised without the mode change delays involved
in disk data transfer. Currently this ROM technique is employed to hold the
channel comparison test signals which are required for alignment and fault
diagnostics.
11
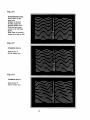
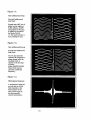
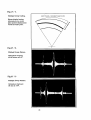
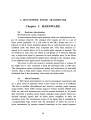
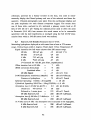
Fig.2.l/l
UNSTEERED DATA
Beam forms on the
array axis.
Display of channel
phasing created by
program DISPLAYf..
First and last stored
cycles in the 256 byte
buffer.
Note. Data is normally
output from right to left.
Fig.2.1I2
STEERED DATA
Beam forms 2°
off the centre axis.
Fig.2.1I3
STEERED DATA
Beam forms 4°
off the centre axis.
12
The test program, DISPLAYf, accesses the precomputed stored data
to enable a visual display of the 16 relative phases using the first and last
few cycles in each block of the output memory buffer, (figs.2.1/1,2,3 - Note.
the program displays the data transmission starting on the right $FF and
proceeding to the left $00 ). These three examples demonstrate the progressive phase shifts needed to phase steer the sonar beam off axis in 2 degree increments, i.e. these are from a data set restricted to steer across a 30 degree
sector. The beam width, formed by the array, is 4 degrees so this data set
will over-illuminate the sector. Examples of actual beam patterns plotted
from these phase steered transmissions are included in chapter 6.
2.2
Ripple fire.
This application uses the full set of steered bearing data blocks, with
each bearing selected sequentially and transmitted as part of a contiguous
bearing pulse. The sonar beam forms at one end of the sector and 'ripples'
across the sector in discrete steps. The technique is efficient in insonifying
the sector as the full intensity of the narrow formed beam falls on each part
in turn. The bearing steps within the transmission must be a compromise between overlapping patterns, to avoid missing targets, and the total pulse duration. An unavoidable timing 'skew' across the sector occurs as a result of the
contiguous transmission (fig.2.2fl). An example of the composite beampattern that results from a ripple fire transmission is plotted in chapter 6. The
technique offers some operational advantages in reverberant conditions, as
once a target is localised, the insonified sector can be narrowed by switching
to alternative sector data held in adjacent parts of the buffer. Ripple sector
data for 60, 30 and 15 degree sectors have been generated and used.
2.3
Swept 'Within-Pulse' Transmissions.
The swept beam is a simple extension of the ripple fire mode. The
beam forms at one edge of the sector and steers smoothly across the sector
during the pulse, (fig.2.3/l). The full energy from the defmed narrow beam
isonifies every part of the sector in turn. This mode mirrors the function of a
sector scanning receiver although there are some important differences to be
recognised.
A scanning receiver array receives target echoes generated from a
pulsed single frequency narrow fractional bandwidth transmission and can
13
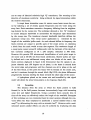
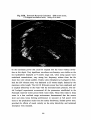
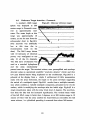
Fig.2.2fl Ripple Fire Mode, Contiguous Pulses propagate across the sector with
an incremental delay determined by the pulse lengths.
RIPPLE ARE TRANSMISSION
Fig.2.3fl Sweep Sector Transmission, a 'within pulse' scan of sector.
SWEPT PULSE
14
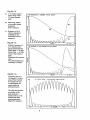
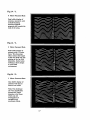
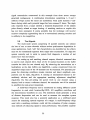
Fig.2.3/2.
One millisecond sweep
First half millisecond
data block
Signals start 1800 out of
phase (on the right) at
buffer address, $AIFF,
and progress to become
in phase by the end of
the block, $AlOO.
i.e. The steered beam is
now pointing on axis.
Fig.2.3/3.
One millisecond Sweep
Second half millisecond
data block.
The 16 data channels
continue the progressive
phase change until the
resulting beam is
steered to the far edge
of sector.
Buffer $AOOFF·$AOOO.
Note. Each channel
transmits a different
frequency.
Fig.2.3/4.
Hydrophone Response
A hydrophone deployed
on axis and in the far
field responds to the
beam pattern of the
array when swept by
the electronically
steered transmission.
15
use an array of identical relatively high 'Q' transducers. The scanning of the
direction of maximum sensitivity being achieved by signal processing within
the receiver electronics.
A swept beam transmitter scans its narrow sonar beam across the sector by injecting a set of closely spaced frequencies into the water along the
array face. Each transducer transmits a frequency differing from its neighboring element by the sweep rate. The technique demands a low 'Q' transducer
to ensure adequate bandwidth to accomodate the frequency span determined
by the sweep rate. The transducer element bandwidth therefore defines the
maximum sweep rate. This swept sector application is restricted by the
length of the available .buffer stack. As each channel differs in frequency the
"- to specific parts of the swept sector, i.e. repeating
block contents are unique
a block from the stack would re-scan that segment The maximum length of
a swept pulse cannot exceed 8 milliseconds with the hardware of the data buffers currently configured as 16 x 256 samples. (Clocked at 500 kHz).
However this permits 500 microsecond insonification of each point target in
the sector and at 40 kHz has been found satisfactory. Shorter pulses are easily defined and a one millisecond sweep takes two blocks of the stack. The
block contents displayed in figure 2.3/2 demonstrate that the signals in adjacent channels start 180 degrees out of phase, i.e the beam is steered from
the sector edge and progresses until the channels are all in phase at the end
of the first block, at this point the beam will be formed on the centre axis,
and as it continues through the second block (fig.2.3/3), the phase differences
progressively increase steering the beam towards the other edge of the sector.
A hydrophone placed on the centre axis and insonified by this signal
mode will detect the array beam pattern as its response, (fig.2.3/4).
2.4
Focussing.
The distance from the array at which the beam pattern is fully
formed, ie. its far field pattem, becomes inconveniently large with increasing
array size and higher frequencies. Using a positive focus acoustic lens in
front of the array can effectively reduce the length of the nearfield. Examples
of this technique are not commonly found in sonar systems although the converse effect has been employed to synthesise a curved radiator from a flat
array2. by defocussing the array with an acoustic lens3. However with a multichannel system similar effects can also be achieved by re-phasing the data
16
Fig.2.4 / 1.
9 Metre Focussed Data
Data buffer display of
contents, unsteered, with
a small focus sing
correction applied
progressively towards the
ends of the array.
Fig.2.4 /2.
2 Metre Focussed Data
Data buffer display of
contents with a 2 metre
focus. This focussing
effect reduces the length
of the near field and aids
plotting of the far field
directivity. Useful when
working at short ranges
in a test tank
environment.
Fig.2.4 /3.
1 Metre Focussed Data
Data buffer display of
contents with data to
focus at one metre
Note. This technique
can very significantly
increase the signal
intensity at the focus
which can aid
investigation of
cavitation and
non-linear effects.
17
signals to form a focus at any required range in the near field. The reduction
of the near field allows accurate plotting of farfield beam patterns within the
confinement of a test tank and, as the intensity at the focus is increased,
cavitation and non linear effects can be investigated without overstressing the
array transducers. Comparative beam patterns plotted at 2 metres range, i.e.
well inside the conventional nearfield, are shown in chapter 6. The phase advances required to focus the array are illustrated by the display of the buffer
contents, (fig.2.4/1,2,3).
2.5
Sidelobe Shading.
Techniques for array shading, primarily to achieve reductions in
sidelobe amplitude at the expense of the primary beam width, are well established theoretically e.g. Dolph-Chebychev4, and have been applied commercially in some radio communication antenna. Acoustic applications of this
method, published in the open literature, appear to have been limited to a
few specialised examples of fixed beam forming applied in fishery research.
Sidelobe suppression even at the expense of beam width ought to prove advantageous in reverberant conditions but the advantages gained may not compensate for the loss of source level incurred. The application of sidelobe
reduction techniques to swept beams may prove to be important if bearing
coded transmissions are employed for a transmitter scanned sector sonar. In
practice the success of Dolph Chebychev shading has proved to be very dependent upon the mechanical phasing of the transducer piston heads i.e. on
the manufacturing tolerances maintained during the array assembly.
A channel matching facility has been included in the multimode transmitter which permits fine amplitude adjustment of the synthesised drive signals to compensate for gain variations and transducer efficiency variations in
each channel. The amplitude adjustments are made using a plug in passive attenuator card and the matching technique is simplified by the use of
EPROM based test signals, (see 2.8). Signals received by a hydrophone in
the far field for each channel are adjusted until equal in amplitude. Alternative attenuator cards can be preset for specific power levels or used to apply
fixed weightings to the channel signals and these cards can be interchanged
as required. The experimental investigation of Dolph-Chebychev shading
described in chapter 6 used channel amplitude weightings introduced by this
attenuator card.
18
2.6
High Power Non-linear Operation.
An anticipated requirement of the Mk.2. equipment was a need to
achieve very high source levels in the water to facilitate the investigation of
non-linear acoustic effects. Transducer power output is limited operationally
by the static water pressure and by the area of transducer face coupling the
signals into the water. A limit to the maximum pressure differential between
positive and negative pressure peaks in the wave form exists at the 'cavitation limit', when the negative signal pressure drops below the static pressure.
If attempts are made to drive the array beyond this limit, dissolved gases will
start to emerge from solution and a 'rectified diffusion' effectS, 6 can take
place causing rapid growth in bubble size. In extremis the gas bubbles form
as 'streamers' on the face of the array and the dispersive effect of the bubbles will destroy much of the acoustic beam forming. Under these conditions
a potentially dangerous acoustic mismatch is created at the array face, significantly increasing the mechanical and thermal stress on the transducer. As
source levels increase, and as the transducer approaches its cavitation limit,
signal distortions will occur. Close to the transducer face the presence of
asymmetrical distortion in the signal waveform will indicate the onset of
cavitation. For a parametric sonar a second non-linear effect is normally exploited. During the passage of the compression cycle of the signal waveform
the density of the water is effectively increased and during the subsequent
rarefaction decreases. Since the velocity of sound depends primarily on the
density of the medium different parts of the waveform will tend to propagate
at different speeds. If the pressure differential is large enough, and sustained
for sufficient range, the sinusoidal transmission will degrade towards a sawtooth shape and, if achieved, will initiate a shock wave at some specific
range. At significantly greater ranges the more rapid attenuation of the high
frequency components in the waveform starts to return the wave shape
towards a sinusoid. This non-linear behaviour encourages the transfer of energy into the harmonics of the signal. Low frequency pressure waves can be
derived, either by mixing two coaxially propagating beams of differing frequency which 'beat together' as they propagate in the water or from an
amplitude modulated transmitted carrier. The appearance in the water of a
'parametric' beam formed within the original main lobe approximates a virtual 'endfire' array7, 8. This 'endfrre' array absorbs energy from the 'pump'
primary excitation beam until range attenuation of the originating carrier
19
reduces the pressure differential below that which generates significant nonlinearities. Whilst the transfer efficiency is quite low9, the technique permits
wide band low frequency signals to be formed into very narrow beams which
are effectively sidelobe free if the full length of the virtual array exists
before the measurement point. Additionally the source array can be physically small compared with a comparable primary array for the required low frequency beam width. Some preliminary experiments demonstrating parametric
effects are detailed in chapter.6.
2.7
Bearing Coded Transmissions.
Sweeping or Rippling the transmission across a sector still requires a
method of establishing the return echo bearing to produce a complete target
rangelbearing sector identification. Synchronising a sector scanning receiver
to the transmission is one solution. Combining both transmitter and receiver
scanning provides excellent sector insonification which significantly enhances
the useable detection range, largely as a result of the transmitter directivity.
A signal processing technique which only requires a single
hydrophone or vertical receive array is a very attractive concept, especially
for the reception of low frequency parametric signal echoes. For transmitter
scanning alone to identify target bearings the transmission must be encoded.
Sophisticated orthogonal codes combinations for transmission have been
proposed by RosslO. However a simple practical set of orthogonal codes can
use frequency modulation, provided that adequate bandwidth can be exploited
in the transmission to permit separation of the bearing information on receive
to be achieved by narrow band filtering. The design of a totally digital
receiver utilising a 1MS320-1O Digital Signal Processor to perform real time
digital filtering has been the subject of parallel LUTEE research workll. A
number of alternative bearing coding methods are possible with the increased
band widths available from NLA transmissions. e.g. The use of phase reversal techniques or non-ambiguous (pseudo random) sequences of frequency
blocks. Quite complex code sequences can be implemented using the Multimode Transmitter. However suitable multichannel correlation techniques will
need developing before they can be exploited by a practical receiver.
A unusual method of encoding bearing information into the transmission at the carrier frequency, which illustrates the adaptability of the transmitter is shown in fig.s 2.7/1,2,3. This mode is derived from a mUltiple sweep
20
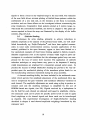
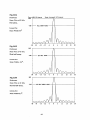
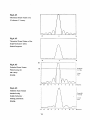
Fig.2.7 / 1.
Multiple Sweep Coding.
SWEPT PULSES oC DIFFERENT SWEEP RATES
Echoes display bearing
information as a centre
pulse position displacement
within the triple pulse.
Fig.2.7 /2.
Multiple Sweep Pattern.
Hydrophone response
on the centre axis, 0°.
Fig.2.7 /3
Multiple Sweep Pattern.
Hydrophone deployed
off axis at +24°.
21
signal transmission constructed in this example from three sector sweeps
generated contiguously. A combination transmission comprising I, 5 and I
millisec sweeps across the sector are transmitted. Total pulse duration 7 millisecs during which each potential target has been scanned 3 times. The triple
echo response from a target exhibits a temporal displacement of the middle
pulse directly related to target bearing. A matching receiver to exploit this
has not been attempted. It seems probable that the technique will involve
receiver complexity approaching that of a conventional scanning receiver and
is unlikely to be competitive.
2.8
Test Signals.
The multi-mode system comprising 16 parallel channels can tolerate
the loss of one or more channels without serious performance degradation in
some applications. Such 'soft' fail characteristics are desirable but the effects
may not be immediately apparent from target echo examination. To align the
system correctly and to assist in system fault diagnosis a number of test
modes have been developed.
For setting up and matching channel outputs, identical unsteered data
is used in each channel drive. Each of the 16 stacked locations in the buffer
contains the drive for one channel only. By observing the transmission on a
hydrophone as the data buffers are ripplefrred, a pulse constructed from the
sequential output each of the 16 channels can be examined. For practical purposes the observing conditions remain constant and direct amplitude comparisons can be made, (fig.2.8fl). A missing or mismatched channel is immediately obvious and the appropriate matching adjustment simplified,
(fig.2.8f2). By first pre-setting the power level in one channel using a
dummy load to create a reference channel, the remainder can all be matched
to establish the total power transmitted.
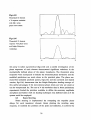
A multi-burst frequency test is constructed by storing different carrier
frequencies in each stack location.(fig.2.8f3). All amplifiers contribute and
the transmissions beamform on axis. The multiburst mode generates a chirp
of discrete frequencies and can be used to measure the complete system
response. This mode also has a potential application as a wideband pulse
source for examining spectral response of a target. A multi-frequency chirp,
used with a matching correlator, could aid the evaluation of pulse compression methods of enhancing signal to noise performance. The possible exploita-
22
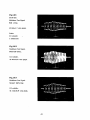
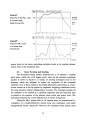
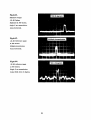
Fig.2.8/1
Test Signal
Channel Alignment.
Each amplifier channel
is transmitted sequentially
to permit the relative
amplitudes to be
compared, within one
transmission.
Mismatched or missing
channels are immediately
detectable.
Fig.2.8 I 2.
Test Signal
Channel Alignment.
Signal received on the
hydrophone after channel
adjustments to match the
received amplitudes are
complete.
The Levels are set to a
calibrated power level by
frrst adjusting channel 16
using a dummy load.
Fig.2.8/3.
Test Signal 36·50 kHz
Frequency Multi.Burst.
Generated by ripple firing
the complete data stack.
Each block contains a
different frequency.
Note. This photo was
taken during a high
power test. The onset of
cavitation is detectable in
the negative part of the
waveform.
23
tion of a sector scanning transmission, bearing coded by frequency, is a concept still to be fully investigated. A possible approach to a receiver design
based on the concept of transmitter scanning is discussed in chapter 7.
24
A MULTI-MODE SONAR TRANSMITTER
Chapter 3 HARDWARE.
3.0
Hardware introduction.
The Multi-mode system comprises:
A microcomputer based signal generator which can simultaneously output 16 analogue channels. The analogue drive signals are fed to a set of
linear power amplifiers, 15 x 130 watts in the Mid design and 16 x 1
Kilowatt in Mk.II. These amplified signals drive a multi-channel array via an
umbilical cable. The Mk.II array comprises 256, wide band, elements arranged in 16 vertical staves of 16 to permit phase steering in azimuth. The
16 elements in each stave are cabled in sub-groups of 4 elements although
only a single drive signal is generated for each complete stave. In the future
this array design should permit limited phase steering in the elevation plane,
if the additional drive signal circuit complexity can be accepted.
The power to drive the system is normally derived from a 3 phase 50
Hz supply but is 'star' connected to feed the individual units at 240 volts.
This arrangement permits development, testing and maintenance of individual
sections using a single phase supply, however when driven at full power, the
distributed load is less demanding of the trials site feeder cables.
3.1
Micro-Computer.
A Z80 based microcomputer is used to precompute transmission data
for a given mode of operation which is first stored on disk or in EPROM.
This data is recalled, demultiplexed and stored in, auxiliary paged memory
output buffers. These buffer memory pages of 'battery backed' CMOS static
RAM are then read simultaneously and the contents translated by 16 simple
D/A converters to produce, phase related, analogue output signals. These synthesised analogue signals feed 16 linear power amplifiers to drive the
transducer array. The simultaneous output of the signal data is controlled by
a programmable logic control card, the parameters of which are set for a
given transmission by operator entered instructions to the control program.
25
Flexible control exists over frequency, pulse length, pause period, pulse sequencing mode, modulation etc.
The transmitter logic was developed around a relatively cheap Z80
based microcomputerl which was available for commercial OEM applications
from Lucas Logic Ltd. This particular microcomputer, whilst a relatively old
design, offers a number of features that are not usually available together in
more modern alternatives. The standard facilities on the main board include:
Parallel (PlO) and serial (UART) communications, a video display drive and
fuIl access to the Control, Address and Data buses. The microprocessor
utilises a 4 Megahertz clock. Expansion of the system is simplified by a
standard '80 bus,2 backplane which is supported by a number of manufacturers. From a construction point of view the '80 Bus' is compatible with
the common '5U' 203 mm square development cards which can to carry
large amounts of circuitry. The standard operating system is weIl supported
with software languages which include a graphics extended BASIC, Z80 Assemblers and a compact implementation of Pascal. The Pascal language had
already been exploited in previous projects and found to compile efficient
and fast Z80 code which when linked with a 'runtime' package produces
'stand alone' executeable 'EXE' or '.COM' type files. CPM 2.2 and
CPMplus3 are also available as alternative disk operating systems. The
original Lucas/Nascom monitor 'Nas-Sys3' and the associated 'Nas-Dos2.1'
disk operating system has been used as the speed of the disk access routines
was consistently quicker than when operating under CPM.
An initial study of digital frequency synthesis using a micro-computer
demonstrated that in 'realtime' the computation of sinewave samples to
generate an analogue carrier would restrict the system to the very low audio
frequencies. The enforced Iow sampling rate definition of the waveform
necessitates high 'Q' filtering and this bandwidth restriction reduces the
flexibility still further. Speed comparisons were made between sine wave synthesis routines written in the available high level languages. These gave
benchmark timings of 0.035, 0.044 and 0.030 seconds per calculated sine
sample when using interpreted 8K-BASIC (Microsoft), Extended (Crystal)
BASIC and the compiled (BLS) Pascal respectivell. The un-impressive improvement when using compiled Pascal is misleading as in this case the computation used double precision arithmetic. A second test utilised precomputed
sine values reduced to single byte precision and stored in memory as a
26
'lookup' table. Using a procedure written in Pascal to simply transfer data
from memory to the parallel ouput port increased the data sample rate to approximately 6 kilosamples/second. Replacing the Pascal procedure with a Z80
assembler routine using the block move commands OTIR or OTDR was
more realistic and the output data rate improved to 190 kilosamples/second.
A micro-computer based on a Z80A microprocessor running at 4 MHz, with
no wait states, can synthesis wavefonns at a sampling rate not exceeding 190
kHz using a stored data 'look-up' table. If the synthesised signal is to be
used in a tuned narrow band application then the number of samples per
wavefonn cycle can be reduced towards the Nyquist limit and the maximum
signal frequency could approach 60 kHz (using 3 samples/cycle). If more
than 256 samples are required to be output then additional timing factors
enter the output loop and the maximum speed of transfer will be impaired.
However, the output data rate achievable from the parallel port is acceptably
fast for single channel operation and some early tests of D/A converters, filters and power amplifiers were made at 40 kHz in this way with signals synthesised from approximately 5 samples per cycle. As a machine code module
can be incorporated as an 'in-line' or 'code' procedure within a Pascal
program or called as an 'external' routine the full speed advantage of the assembled code can be achieved while retaining the flexibility of this high
level language.
The single channel 'in-direct' synthesis technique described offers
some advantages over earlier hardwired transmitter designs and one hardware
circuit design can be easily adjusted to operate over a very wide frequency
range by simple software modification. However the economic advantages
may not be obvious if the system requires a computer terminal to communicate to the operator. This synthesis approach is less practical when required
to 'generate signals for a multi-channel operation as the necessary multiplexing divides the data transfer rate by the number of channels. MuItichannel
synthesis using this approach is therefore limited to very low frequencies unless the pre-computed data samples can be accessed in parallel. Dedicating a
microprocessor to control the signal generation for each channel under the
control of a host processor is one possible solution to this. An alternative approach has been used in this equipment which overcomes the speed problem
successfully by extracting the lookup tables from the computer memory and
creating an auxiliary RAM memory buffer for each channel. Simultaneous
27
parallel access to these buffers is made under the control of a hardwired controller which is programable. The synthesis and transfer of the computed
waveform data can now be removed from the transmission loop timing and
as a result the speed restriction is imposed entirely by memory speed of access and the associated DJA settling times. With this approach data rates of
several Megahertz become possible without requiring exotic components.
High data rates may require larger memory buffers as the size is dictated by
the length of the transmission and the signal sampling rate required to
achieve wide band performance with good phase resolution. If the required
multichannel signals differ only in phase then significant savings in memory
size can result by recirculating small fixed blocks of memory containing integer numbers of carrier waveform cycles. This compromise using a block
length of 256 samples clocked at 500 kHz has been found a very effective
technique.
For normal sonar operations the required types of emission are always
predetermined and can be calculated in advance. To alter the type of transmission requires the contents the output memory buffers to be replaced by alternative pre-computed datafiles called from disk. As data transfer operations require serial access to each buffer in turn there is time penalty enforced when
changing the transmission mode of about 50 seconds when using modem
5.25" 80 track floppy disk drives. The use of a RAM 'disk' has been investigated as this offers the fastest method of changing mode however although
this is a practical solution most of the available boards are volatile and require re-loading at power on. Winchester technology would seem to be a
preferrable solution for faster data access. This has not been implemented as
the availability, and cost of the Lucas 'hard disk' options has been a deterrent so far. Double Density 5.25" 80 track floppy disk drives have been used
for data storage in this equipment and the inconvenient mode changing
delays minimised by creating enlarged data buffers to contain a number of
different function data files 'stacked' ready for immediate use. Access to the
different functions stored in the stack can be made instantaneously by simply
altering the read start address. A further advantage gained from stacking sets
of data files is created if the data access is continued throughout the length
of the extended stack. In this way a sequence of functions can be transmitted
contiguously Le generating a Ripple fire mode. The final arrangement utilised
28
8 buffer memory cards based on 32 Kb of static CMOS memory. Two data
channels, 4 bit resolution, are multiplexed into each card.
To recover the data a control card, with latched pre-prograrnmed
parameters, clocks out the digital buffer contents into individual D/A converters which are mounted as small piggyback pcb's on each buffer memory
card. An alternative and larger 64 Kb x 8 bit resolution buffer has been
designed and tested in anticipation of modes requiring higher resolution and
longer unique pulse structures. For most of the trials work so far, 4 bit data
signals have been employed successfully to define waveforms using a sampling rate of 500 kHz.
Note. Circuit diagrams are included in Appendix I.
/
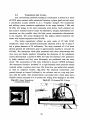
3.2
MOSFET Power Amplifiers.
Bi-polar power amplifier designs for a multi-channel system were
rejected in favour of a power MOSFET approach, primarily as a doubts were
felt about achieving closely matched linearity at high power with simple circuits. From past experience it was also realised that sophisticated protection
circuitry was required to withstand all the forms of reactive mismatch that
can occur under trials conditions.
An examination of the characteristics of the newer complementary
power MOSFET devices demonstrated that comparatively simple amplifier
designs can offer high power and a wide band frequency response from a
low component count circuit. The basic specification for the anticipated sonar
applications suggested that the linear power amplifier would be required to
perform well at frequencies from a few hundred Hz up to 80 kHz. Several
promising (cheap) amplifier 'Hi-Fi' modules based on complementary MOSFET devices were available commercially and the investigation started using
a 60 watt module purchased from a local Leicestershire manUfacturer,S. Configuring a pair of these amplifier circuits in a directly coupled 'pushpull'
bridge mode, generated satisfactory power levels in excess of 130 watts at
40kHz,6. The high impedance and reactive load presented by the transducer
was matched using a toroidal wound output transformer the output impedance
of which was designed to appear resistive at the operating frequency. The
compact nature of this solution encouraged some modifications to improve
the slew rate of these devices and a batch of upgraded 'Hi Slew' units were
obtained which were expected to achieve 150 watts at 50kHz without stress.
29
The units were manufactured as a low cost domestic product and required
some re-engineering for this sonar application. Initially the amplifier pairs
were found to run excessively hot with a full power but low duty cycle pulse
mark-space ratio of 1:10. The thennal stress induced several MOSFET
failures despite the presence of a thennal trip installed to sense heat sink
temperatures. Investigation of this effect revealed a design limitation in the internal phase splitter. This circuit was found to be slew limiting at higher frequencies, and at 40 kHz the phase split shifted significantly from the essential 180 degrees. A DC component was produced by this tracking failure
during high power operation and the phase splitter circuit was modified to
eliminate the effect. The units were used successfully for the early trials in
this fonn but other, less serious but significant, thennally related effects
remained until a thorough investigation of the complementary power FET
devices demonstrated asymmetrical thermal tracking characteristics. A conventionally connected configuration, AC coupled, was immune from the problem
and ran quite cool at the desired mark/space power level. However, when the
amplifier pairs were configured in a 'bridge' mode, the primary winding of
the output transfonner permitted significant dc currents to flow as the mismatched FET devices increased in temperature. A modification, using
suitable electrolytic capacitors, placed in series with the transfonner primary
produced an effective cure and full power can now be obtained for long
periods without thennal distress. These amplifiers were racked together with
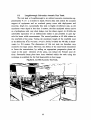
the drive computer and this transportable assembly is usually referred to as
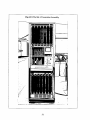
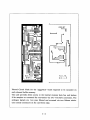
the Mk.l. Transmitter (fig.3.2/l). The equipment was transported to various
reservoir trials sites, and used in this configuration for all the initial low
power experiments. The maximum power available from this system, some 2
kilowatts, was able to generate significant non-linearity in the water using the
15 element prototype array and when the transmissions were modulated some
parametric products were detectable. The success of this prototype lead to
the Mk.2 specification requiring 1 kilowatt channels to produce an engineered 16 kilowatt system to assist in parametric perfonnance investigations.
3.3 High Power Linear Amplifiers.
Alternative MOSFET power amplifier modules with a claimed 1
kilowatt RMS rating were purchased from small North London company?
30
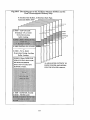
Fig.3.2f! The Mk.1.Transmitter Assembly
.-'>,,'
I
-
,
I,
'
-l,' ,
f" ..
I,;
,
l
','
"
__
>
'-=--_. . . . ._--_.... _--31
-~,~,
le ... u.F'
,fUll V
0
0
~
~·m
SONAR RESEARCH GROUP -
®
0
PROTOTYPE
3U RACK
0
Version 1 - SMALL PSU
DUAL LINEAR AMPLIFIERS
(1.2 KW Modules)
LOUGHBOROUGH UNIVERSITY - 0509-263171
X
5071
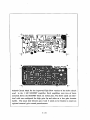
A prototype 2 x 1 kilowatt amplifier with integral power supply was constructed in the laboratory to assess the performance of these modules at sonar
frequencies between 10 kHz and 100 kHz, (fig.3.3f1). This unit was a very
useful testbed and revealed some deficiencies in the circuitry. Some thermal
drift in the quiescent operating point was detected and some high amplitude,
very low frequency, instability appeared when the amplifiers were configured to drive an impedance matching transformer as recommended by the
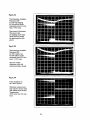
manufacturer. When tested with a dummy load the circuit modules were unable to achieve their rated maximum power at 40 kHz. The 1 kilowatt output, available at 20 kHz, fell to less than 800 watts at 40 kHz. Alternative
driver circuitry was supplied which just achieved the 1 kilowatt rating for the
100 millisec maximum pulse length specification, (fig.3.3/2). The low frequency instability noted was eliminated in this experimental amplifier by ac
coupling the bridge output connection with a, physically large, 22 microfarad
high voltage paper capacitor. Experiments demonstrated that the sustainable
one kilowatt output was limited in duration primarily by the reactance of the
mains input transformer when required to generate pulses longer than 100
millisecs. Using a variac to increase the supply rail voltages from +/-70 volts
to +f-80 gave a significant power increase,(fig.3.3/3) and an undistorted 1100
watts could be obtained in a matched load for a full 100 millisecond transmission. Alternatively short drive pulses of less than 10 milliseconds increased
the available output power to 2 kilowatts or if driven by the maximum pulse
length synthesisable (2 seconds) a CW transmission of better than 900 watts
could be sustained. The detailed specification was then discussed with the
manufacturer who was requested to quote for batch manufacture followed by
an order for one unit. A pre-production unit, supplied for evaluation, was
returned as problems affecting performance and long term reliability were
identified with the driver stage of the circuit. To solve these problems speedily this circuit assembly was removed and redesigned at Loughborough. An
improved drive circuit card was then made in the laboratory and when this
was installed in the amplifier the unit performed very satisfactorily. The new
circuit (Appendix I) and PCB photo-mask was then issued to the manufacturer for incorporation in the construction of the production amplifiers. The
performance advantages gained from this re-designed drive circuit included
the elimination of a dc feedback loop and the upper frequency response was
increased to over 100 kHz. The low frequency coupling capacitors were al-
33
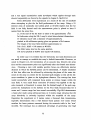
Fig.3.3/2
The Prototype Amplifier
MaximumO/P
a) +70v rail sagging
b) 100 millisec pulse
measured across 41 ohm
load. - 955 watts.
Note onset of distortion.
The power rails
are sagging under load
which severely limits
the pulselength at full
power.
Fig.3.3/3
The Prototype Amplifier
MaximumO/P
a) +80v supply rail.
b) 100 millisec pulse
measured across 35 ohm
load. - 1125 watts.
Note No visible
distortion at the full
rated power/pulse length
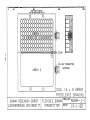
Fig.3.3/4
Final Amplifier for
the Mk.2 System.
Maximum output power
into reactive dummy load
lOO milliseconds 40 kHz
Transmission.
1250 watts into 125 ohm
load.
34
tered to roll off the low frequency response below 1000 Hz. The new PCB
layout reorganised the copper track thickness and pad sizes and incorporated
a ground plane. This design permitted a directly coupled transformer output
and eliminated the bulky capacitor introduced in the original experimental
unit. Eight production versions of these dual amplifier units, 16 kilowatts
total, were eventually delivered complete with internal toroidal output matching transformers. These amplifiers were all thoroughly tested on arrival to ensure that they met the design specification. The units were accepted after
completing all the specification checks which included a sustained 'soak' test
at full power for several hours using a dummy load. The dummy load used
simulated the combined loading reactance of the transducer and its cabling.
A further problem arose when the transducer manufacturer was unfortunately
unable to duplicate the reactive parameters measured in the prototype elements due to variations in his supply of piezo-ceramic. The transducer units
finally supplied differed significantly, with much increased capacitance, from
the approved samples. Accepting these transducers created a new loading
specification for the power amplifiers and the delivered amplifier units all
showed evidence of distress when run for long periods with the new reactive
load. This design of amplifier prefers to see excess inductance rather than
capacitance in a reactive load. The output transformers were redesigned for
these new parameters and unfortunately the original cores now proved inadequate. Larger toroidal cores were purchased and the amplifier manufacturer
employed to wind a replacement set of transformers. Once these replacements were fitted the amplifier system again exceeded the full power
specification of 1 kilowatt 1 channel for 100 millisecs when tested using a
redesigned dummy load, fig.3.3/4. As the transducer array was supplied as
two identical matched half arrays, each amplifier was also required to drive
either a half or full transducer stave (8 or 16 elements). This power splitting
was achieved using a matched 'bi-filar' dual secondary winding on the transformer. The calculated transformer match for full load proved quite successful when driving the half transducer. Approximately 3/4 power can be
coupled into the half transducer load.
3.4
Power Amplifier Performance Summary.
The frequency response of the basic 1 KW amplifier module, tested
without an output transformer, extends from 1kHz to 100kHz at the 3dB
35
points and is essentially flat throughout this range. The output transformer
was designed for resonance at 40 kHz at full load to match a transducer element stave and cable capacitance. This assumes that the transformer output is
connected to the transducer array using 4 of the coaxial cores (sub-stave connections) in a 40 metre long pair of multi-core cables. These polyurethane
jacketed umbilicals, one feeding each half array, each contain 45 miniature
coaxial cables, and were manufactured by De-Regt of Holland to an Admiralty specification.
The overall frequency response of the system, including the
transducer, was measured in the water and was evaluated using the frequency
'multiburst' test signal mode. These tests indicated a useful 3dB bandwidth
extending between 37 kHz and 50 kHz (centred on 42 kHz). The anomalous
dip in the response at 39/40kHz is believed to be a characteristic of the
transducer array construction, (fig.3.4!l). The eight dual power amplifier
Fig.3.4/1 Frequency response of the complete Mk.2 high power
system including the power amplifiers and transducer.
m
u
o
·3dS
u_
m
~ ~----------------------------------------------~
.~_
~_
~_
units were racked together, (fig.3.4/2) and wired initially for the 240 volt
single phase supply at Foremark reservoir. The mains supply was taken via a
32 amp circuit distribution breaker and a 30 milliamp earth leakage RCCB.
The current rating of the breaker was close to the calculated maximum load
and the system tripped safely if the programmed output significantly exceeded the 1: 10 mark/space specification at full power. For later trials on
36
board 'May time' the system was reconfigured to use a three phase star supply, cable fed from the shore. The on board power di stribution incorporated 10
amp/phase circuit breakers. When transmitting at full power and using long
pulses the cable impedance of the three phase supply causes a significant dip
in the mains supply voltage.
Fig.3.4/2 The complete Mk.2. Transmitter Assembly .
•
...
.
• •
:0 :
...
• •
..' 0'.•.
· .
. . ...
··' 0'...
~
-
·
.
~o~
..
••••
..'·C'...
••
-. ••
:C:
.
37
3.5
Transducers and Arrays.
The conventional sandwich transducer construction is based on a stack
of PZT4 piezo-ceramic disks prestressed between a piston head and tail mass,
a construction usually referred to as a 'TonpiItz' design,8. For commercial
and military power transducer applications in the range between 1 kHz and
50 kHz, this design is the most commonly used device. Such elements are
also used in matched receiver arrays but alternative, cheaper, hydrophone constructions are also possible when the high power transmission characteristic
is not required. The arrays designed for this project utilised sandwich elements with centre frequencies near 40 kHz.
The initial experiments utilised an array made of 39 kHz Hi'Q'
transducers. These were standard echosounder elements with a 'Q' of about 7
and a piston diameter of 38 millimeters. The array consisted of 15 of these
devices pitched 40 miIIimeters apart ie approximately lambda in seawater for
40 kHz. The admittance circle plots measured from these demonstrated that
they were not ideally matched. Comparing the diameters of the admittance
circles demonstrated a spread of 30%, but only two elements were particularly badly matched and they were fortunately not positioned near the array
centre. The construction of this array followed a proven LUTEE technique.
The transducer elements 'pocketed' in a rigid Urethane foam pressure release
material within a nylatron outer case. The front face was sealed after assembly with an Adiprene window. (fig.3.5/l) The electrical connections were
passed through an internal bulkhead in the nylotron case to a tag strip junction with the cables. This terminal block was sealed with a back plate and a
flexible conduit moulded to it to protect the wiring from damage in the field.
Fig.3.5fl Array Transducer
Fig.3.5f2 15 element Mk.1.Array.
construction detail.
~-
!
38
The nylatron case in addition had two 'T' slots milled on one side to assist
in mounting the array to an underwater training gear, (fig.3.5/2).
Early trials with this array were encouraging. The 'test' mode signals
enable the direct comparison of the individual transmitted channel amplitudes
received on a test hydrophone. If the receiving hydrophone is deployed on
axis and in the far field of the array then, after trimming the transmitted
gains for equal received amplitudes, the resulting combined signal beam pattern forms a good match to the computed simulation. This amplitude matching cannot compensate for the significant phasing errors that were inherent in
this array's manufacture. But the beam patterns, especially in view of the
known poor transducer matching,9, are quite acceptable. These high 'Q' elements were found to have an inadequate bandwidth for the very rapid
'swept' signal modes. The element performance was not found to be a limiting factor for the phase (delay) steered transmissions and 'steered' and 'rippled' modes were successfully demonstrated, as were slower rate (5 millisecond) 'sweeps'. During the first trials at Staines reservoir this array was
used to demonstrate that basic phased array concepts were practical and that
steering and sweeping of the directivity lobe through the 60 degree sector
was possible. During later trials with the array driven with the maximum
available power, it was established that significant waveform non-linearities
could be produced in signal propagating in the water. Cable lengths and
mounting limitations precluded deep deployment of this array but at 7 metres
depth at Foremark and at full power (2 kilowatts) low frequency echoes
could be clearly heard, reflected from the shoreline at 600 metres range,
using a square wave modulated carrier transmission.
3.6
Wide Band Transducer Elements.
The Mk.2 system was required to generated much higher powers for
parametric signal experiments. An investigation into suitable Low'Q' elements was undertaken with samples provided by the Institute for
Oceanographic Sciences and by Universal Sonar Ltd. The sample element
from LO.S. was constructed from titanium with the piston head precisely
trepanned from the solid mounting block, leaving it supported by a thin
diaphram (fig.3.6!1). The PZT4 ceramic rings and the tail mass are assembled to the piston using a rolled thread, titanium tie bar. The element is
carefully preloaded by measuring the extension of the tiebar as the assembly
39
is tightened. The resulting element performs extremely well, the admittance
plot of the sample yielding a very smooth low 'Q' circle. However I.O.S. advice suggested that to achieve the maximum bandwidth performance necessitated by our application the design should be restricted to a 1/2 lambda
diameter piston. It was also noted that the compliant diaphram support technique absorbed a significant proportion of the inter-element spacing. The initial
estimated cost of a 256 element array based on this technology was competitive. However the need to achieve a large transducer surface area to efficiently couple the maximum possible acoustic power for parametric experiments
implied a need for much greater numbers of 1/2 lambda size elements and
the economic choice was forced towards a Universal Sonar one lambda
design.
Fig.3.6!t LO.S. Transducer - Titanium element construction.
The first samples provided by Universal Sonar proved unsuitable as
the specified low 'Q' response was apparently achieved by merging two or
more close spaced resonances. This technique produces circle plots which display several deep re-entrant dips in the admittance plot, indicating points of
rapid phase shift between the resonances. During the 'sweep' modes of operation such phase changes are unacceptable as they create undesirable distortions in the beam pattern. In the 'sweep' sector modes the individual
transducer staves all transmit different frequencies. A second disadvantage of
this element design, proved to be a 'self destruct' mode at high power,
caused by the very poor thermal conductivity through the piston face. The piston head of this transducer included a glass/epoxy component which
delaminated with the heat dissapated during a very short high power test
made during the examination of cavitation characteristics. A later example
40
from Universal Sonar was manufactured with an aluminium piston, with a
0.95 lambda face, and this demonstrated a single smooth admittance circle indicating a 'Q' of about 4. After extensive tests lO, this was the transducer
design chosen for use in the 256 element phased array, (fig.3.612).
Fig.3.6/2 Universal Sonar Ltd. - Mk.2. Wideband Transducer.
)
3.7
High Power 256 Element Array.
As the design of a 16 stave x 16 element array based on these elements proceeded it became apparent that the total mass of the assembly was
likely to make the array difficult to deploy without specialised lifting
facilities. The element design had produced devices with 0.95 lambda
(40kHz) diameter pistons and a matrix of these at lambda pitch was envisaged. The side effect of diffraction secondaries was accepted in order to
achieve a 4 degree beam. The 'endfire' propagation from a lambda pitch
array was also an accepted disadvantage. However in modelling the possible
effects of a split (dual 128 element) array it was noted that the introduction
of a deliberate discontinuity of half lambda at the array junction could be
beneficial, in that the endfrre component in the vertical, unscanned plane,
could be nulled significantlyll. A final proposal for two identical 128 element arrays was therefore pursued with an assembled apenure of 16 lambda
horizontally (Steerable) and 16.5 lambda venically. (Appendix VI). A half
array was commissioned first and thoroughly tested before the remaining half
was assembled. The expected handling advantages of this split design have
been realised. This dual array can be split and either half used alone, at
lower power, should the need arise. (fig.3.7/1).
41
Fig.3.7fl The Mk.2. Dual Array being deployed at Foremark Reservoir.
Each half compri ses 16 staves of 8 elements, i.e 16 x 16 in total .
----....,
42
Fig.3.8!!
36·50 kHz
MuItiburst Test Signal.
Full array.
42 kHz=1.7 volts pk/pk.
Scales
0.5 volts/div
1 mi1lisec/div.
Fig.3.8!2
Multiburst Test Signal.
First half array.
0.2 volts/div.
42 kHz=0.94 volts pk/pk.
Fig.3.8!3
Multiburst Test Signal.
Second half array.
0.2 volts/div.
42 kHz=O.78 volts pk/pk.
43
Fig.3.8/4
Freshwater
Sc~n
width 68 degrees
US
Sweep increAent 8.2 degrees
;
Beam Plot at 42 kHz.
1
FuU array.
i
-3dS .t---- FULL RRRRY 42KHZ --+-+----------4
Linear Plot
J
Beam Width=3.4°
1
-38
Fig.3.8/S
Freshwater
-18
-12
-6
8
6
12
---_.
8dB
Beam Plot at 42 kHz.
First half array.
-24
18
__.
24
38
1
-3dS
1;
< - OLD HRLF 42KHZ
j
Linear Plot
]
Beam Width= 3.4°.
I
-38
Fig.3.8/6
'-;C\ ~
-24
-18
-12
-6
8
6
12
lS
24
38
8dB
Freshwater
Beam Plot at 42 kHz.
Second half array.
Linear plot
Beam Width=3.5°.
-3dB
+-- HEW HRLF RRRRY 42KHZ - i - + - - · - - - - - - 4
I
;
-38
-24
-18
44
-12
-6
8
12
lS
24
38
Fig.3.8/7 Foremark Reservoir Lake Bed. - 400 metre sector,
120 degree mechanical scan at 43 kHz, Array tilted down 6 degrees.
3.8 .
Array Testing.
A variety of modes have been tested successfully using the new array.
The array stave matching was measured in the water using the 'multiburst'
test signals (fig.3.8/1,2,3) and the plotted beams fonned by each half array
and by the combined full array are well matched and very close to the simulated patterns, (fig.3.8/4,5,6).
Moving the underwater training gear in small angular steps under computer control, permitted mechanical sonar scans of the reservoir to be
produced. Using 43 kHz transmissions a sequence of images which include
lake bed detail of the original valley floor, (fig.3.8n ,8) and the shore line out
to 700 metres range have been plotted and displayed. These results were obtained using the 16th stave of the array as a matching hydrophone to feed a
single channel 'Hybrid' receiver,u.(Compare with fig.5.3/3)
The full size array was deployed at a depth of 13 metres in Foremark
reservoir. The array was driven with 10.5 kilowatts, which was detennined to
45
Fig. 3.8/8. Foremark Reservoir Lake Bed. - 800 metre sector,
120 degree mechanical scan, Array tilt is zero.
be the maximum power that could be coupled into the water without cavitation at this depth. Very significant waveform non-linearity was visible on the
test hydrophone deployed at 9 metres range and, when using square wave
modulated transmissions, very strong low frequency echoes from the far
shore line were clearly audible. Finally when redeployed at Lochgoil in Scotland the 256 element array was deployed at 33 metres depth, limited by the
maximum cable length. The full 16 Kilowatts power has been employed and
is coupled effectively to the water with the increased static pressure. The initial Lochgoil experiments re-measured all the parameters established in the
Foremark reservoir lower power fresh water trials. These first trials in deep
water in a less confined range environment demonstrated that the source
level and array beam forming performance in seawater at full power were
close to the predictions made from the earlier freshwater, limited power tests,
provided the effects of sound velocity on the array directivity, and increased
absorption were included.
46
3.9
Mk.ll. Array Parameters - Summary
Sea Water Measurements made at Lochgoi1.:
The array centre frequency was 42 kHz.
-3 dB points were measured at 36.5 kHz and 48 kHz,
i.e. the array bandwidth was 11.5 kHz, a 'Q' of 3.6.
-The array-beamwidth, at 42kHZ; unsteered azimuiil,-was 4.1 degrees.
The array beam pattern could be accurately phase steered
through +/- 30 degrees. (The equal amplitude ambiguity point.)
The Directivity Index is 34 dB.
The RMS source level at 41 kHz was at 245 dB
(reference 1 microPascal at 1 metre)
measured with 16 Kilowatts power input to the array.
47
A MULTI-MODE SONAR TRANSMITTER
Chapter 4
SOFTWARE
4.0
Software Introduction.
The microcomputer chosen has a large library of commercial and
public domain software packages, most of which are targeted on the CPM
disk operating system environment. The deliberate choice of the rather basic
Lucas 'NasDos2.I' environment was made primarily for its fast floppy disk
file handling capability. This speed advantage is gained as direct result of
simple disk file handling primitives which do not try to emulate a virtual
machine for transportability, as occurs under CPM. However, although the
support software available is more restricted in this environment, several
good language implementations and Z80 assemblers are available. The
majority of the software for this project has been written in Pascal.
4.1
Languages - Z80 Assembler / BASIC / Pascal
A number of small machine code routines were written in Z80 assembler during the early development phase of the projects. Some of these
programs were test routines used to obtain timing comparisons and most of
these have been superceded. A few small Z80 code segments have been
retained and are caJled as 'external' routines from the Pascal control
programs. These pre-assembled code segments can be conveniently trapped in
the program text file as 'code modules' ready for insertion during compilation using the Pascal 'External' and 'Code' function calls.
A graphics extended version of Interpreted BASIC was used to compute some of the some of the array simulations. The BBC microcomputer
proving a useful tool where a graphic display of output was required. BBC
BASIC, and routines written in the BBC inline 6502 Assembler, were
employed to control the pan and tilt beam plotting hardware. As the plotter
program evolved its size outgrew the limited memory of the machine and
necessitated breaking it into several smaller programs which are 'chained' as
required from a menu. The Extended Crystal BASIC available on the Nascorn II offers similar graphics advantages but as with aJl interpreted languages the program size in memory becomes a problem with very large
48
programs. Speed of computation became a secondary consideration after the
design approach changed from on line synthesis to pre-computed data.
Achieving the maximum speed of data transfer from the floppy disk was
regarded as important as the data file transfer time creates a significant delay
when changing between modes. Both Interpreted BASIC and the Z-80 Assembler language were seen to be restrictive in this application. The available
Pascal language subset was preferred for the system control and data preparation programs.
The version of Pascal selected as the high level language for this
project is a derivative of Standard Pascal written by ApS of Copenhagen
specifically for the Lucas Nascom microcomputer. This compact version of
Pascal, whilst omitting some features of the ISO standard 1, is well suited to
programs designed to run on the compiling machine.
BLS Pascal v 2, consists of a 12 k development package comprising
Compiler/Editor/Runtime routines extended by a further 4 k set of disk
operating routines, Pascldos 2. The advantages of this version includes one
pass compilation direct to Z80 object code which, when linked to a small
runtime package, produces fast stand alone code that is quite compact. The
stmctured modular nature of the language suits the development of large
programs, especially where continuous program development and updating is
required. The self documenting nature of the language is also seen as an advantage.
Turbo Pascal 3 is a more recent version of the Pascal language with
similar advantages to the BLS Pascal. This is available to run on Z80 based
microprocessors under the CPM operating system. However the use of the
CPM operating system imposed some speed disadvantages when compared
with the BLS/Nascom implementation and, whilst Turbo Pascal remains a
more transportable version of the language with useful additional extensions
to Standard Pascal, the original BLS version was retained for this project. It
was established that text file transfer was possible between the BLS and
Turbo versions and that only minor modifications to the syntax was necessary for successful recompilation. As Turbo Pascal is now available running
under MS-DOS it becomes a better choice if the system is to be transported
in the future to run for example on an mM PC.
49
System Software.
The system software evolved into two basic suites of programs. The
fIrst group is a dedicated set of data fIle preparation programs. This generates
sets of data fIles onto disk as required for each specifIc signal mode. The
second group consists of operational programs which fIrst call and load appropriate data fIles and then offer the operator a choice of parameter options
to generate specifIc sonar emissions.
A large number of programs were written as the project evolved,
many of which are quite similar, varying only in the accessibility to particular functions. One diffIculty experienced, which requires further refInement, is the level of 'user friendliness' that is required by an unskilled
operator of the system. The early software retained a greater level of
flexibility but required care to be exercised by the operator as error trapping
to avoid illegal transmission parameters was incomplete. The program example 'STEERd', examined in 4.3, does not eliminate all the conceivable
entry errors when setting parameters. However as installed the Mk.2 transmitter hardware is tolerant of this form of abuse, and the system as a whole is
designed to be robust to the point of surviving a programmed gross overload,
even one which can trip the supply breakers.
In pursuit of simple operator interaction some sacrifIce in flexibility
has resulted in the issued versions of the software. The concept pursued in
the later versions of the control software resulted in a set of dedicated disks
each designed to carry out specifIc sonar operations. Separate control disks
are now used to select operations under the headings:
'Test Signals',
'Frequency Chirps',
'Within Pulse Sweep Signals',
'Focus Steer',
'Steer/Ripple/Ping Sector'. The program STEERd incorporates most
of the features typifying a control program. This software is analysed in
more detail in this chapter and its listing is included in Appendix III.
The data preparation programs have evolved as a family of similar
structures and the program RIPPLE60 is included as an example of these.
Several supporting programs, also written in Pascal, relate to the
modifIcation of the prepared sets of fIle data, e.g. to add amplitude modulation for NLA experiments. A utility program DISPLAYf was also written to
4.2
50
extract the first and last few samples from each of the 16 parallel data channels in each file and display them graphically for comparison, as exampled in
chapter 2. A variety of such software tools were written as required while
developing and debugging the data files as were programs to model and
graph plot the predicted array beam patterns.
Program Example • Data Synthesis.
4.3
RIPPLE60
This program generates the data required to synthesise sonar signals
at a specified carrier frequency and prepares a set of 16 data blocks each
defining a phase steered increment across the sector. The program source text
can be modified easily before compilation if a narrower sector is required to
be scanned.
The stacked set of data for all 16 bearings are stored with constructed
filenames onto a floppy disk. Each file contains the data for one 256 byte
block in all 8 RAM card buffers. i.e. the data required to steer a transmission
onto a single bearing. The third character in the filename encodes the posi·
tion of the block within the stack. In the transmitter the set of files are called
for, in turn, by a matching control program (STEERd), and the filename ensures that the data is automatically loaded at the correct stack address on
each output buffer memory card.
The data is computed as 4 bit resolution 500 kHz sampled data to fill
a 256 byte sample buffer. Channel paired 4 bit signals are multiplexed as an
8 bit buffer block for efficient file storage and speed of data transfer. This
program prepares data off-line quite slowly, and although its operation could
be speeded by the use of a 'look up' sine table this was not found to be
necessary. The program requires no operator intervention once started and
will generate a complete data set on the floppy disk automatically.
51
Flow Diagram RIPPLE60 - Source Text listed in Appendix Ill.
Notes on the operation of RIPPLE60
Enter the number of cycles of carrier to be stored in a 256 sample
'block'.
Note. A non-integer number required to produce a specific frequency
implies that the block length must be abreviated from the basic 256 samples
to ensure that an integer number of cycles fit precisely to permit the data to
be re- circulated.
The program outputs the resulting carrier frequency in kHz to the
screen before continuing with data calculation.
The data is generated as odd/even channel pairs, and the program multiplexes these two 4 bit data streams into a single 8 bit file which it saves to
disc as a 'block'. The 8 muItiplexed blocks stored on the disk are file named
automatically. The loading address for transmission is encoded within the file
name by the 3rd character. i.e. mc8str9 is a data file focussed at 9 metres to
be loaded into the 8th position in the transmission stack. (This middle position would normally be loaded with the zero phase shifted data to transmit
on the centre axis.)
52
Flow diagram RIPPLE60
START
lE:RIPPLE60
MENU:
Enter No.
Of Carrier
Cycles/SI k.
FN=16
Display
Frequency
Calculate
next beari
16 channe Is
mul;iplex
Odd/Even
Micro-Computer
Construct
F i I ename
Save
Data on Dis
FN=FN-l
No
STOP
53
4.4
Program Example - Data Handling and Control.
STEERd.
This is a transmitter control program for the Ripple/Steer/ping steered
modes with the option of amplitude modulation at 0,2,3,4,5 or 6 kHz for
steered NLA experiments. The program selects and automatically transfers
datafiles from disk into buffer memories for a 30 or 60 degree sector and
with modulation as required. (0 = Unmodulated transmission.) The program
defaults to an EPROM buffer set of test signals for system checks on initialisation. A menu option is presented when the default settings are to be
changed to enable the mode and timings to be selected, i.e. Single bearing
Steered transmissions or a Ripplefrre of all these bearings across the sector in
one contiguous pulse or Ping on each bearing sequentially, stepping across
the sector. The menu then sets the transmitted pulse length, the pause period
(between transmissions) And then prompts to start transmitting. A single
keypress initiates the transmission sequence which continues until a second
key is pressed. The option of continuing transmitting, modifying parameters
or of loading a new data set from disk is displayed at this time.
Flow Diagram STEERd - Source text listed in Appendix ill.
Initial Command:
'lU' - Calls boot sector on disk.
Loads and runs the Object code file mcSTEERd.
Operation:
Links to Pascal machine code disk routines.
Display 1st menu.
Choice:
Load data files - Y/N
Defaults to system test signals stored in EROM for system checks.
Mode set to RIPPLE
Block address set to $CFFF (EPROM Test routines).
Yes - Display 2nd Menu.
Select steered sector to be scanned 30/60 degrees.
54
Flow Diagram of STEERd
Set S!:Jstem
Defaul ts
START
JU Boo't
:DATAIN:
Menu
Set Sector
Auto-Laad
16 F 11 es
inta Buffers
An~le
60/30
Moa. IUnMod.
Fre . Txn.s
RES RT2:
Preset Menu
Change
Preset
Parameters?
Yes
mcSTEERf
RIPPLE STEER
PING
6~/3~ SECTOR
No
: NEWPARAM:
Mode RIS/P
Start Addr.
No.of Blks.
Pause Time
Micra-Computer
Contra I I er &
16 Buffers
: DEFAUL T:
tup Card B
TX.
Press an!:)
16 AIDs
Outputs to
Amp I I f i ers &
Arra!:J
New [FJlle
[RJestart
[Q]u It
END
55
Select modulation frequency - 0 to 6 kHz.
(0 - Unmodu1ated 41 kHz data steered across selected sector.)
(2 - 6 kHz square wave modulated data for steered NLA.)
Operation:
Compute file name and load sequentially from disk.
(8 files to each set loaded in 33 seconds.)
Display preset parameters.
Choice:
Change parameters. YIN
N - Ready to transmit (Pause for key press)
Y - Display Parameter menu:
Change Mode: Ripp1e/Steer/Ping sector
Block Address: Hexadecimal Start of Block address.
Pulse length : Number of block repeats.
Pause period : Select from menu 1 rnillisec to 10 seconds.
Preset parameters programmed into contro11atches
Accept displayed parameters.
YIN
Ready to transmit
(Press any key to transmit)
TRANSMISSION SEQUENCE STARTED
(Press any key to stop)
keypress terminates transmission.
Options:
Change sector / Restart / Quit (to operating system.
56
4.5
Summary of Software used for the Lochgoil trials.
Disc AREOl.
This disc contains the STEERd example of the control program which
offers the basic modes of operation: STEER / RIPPLE / PING SECfOR. The
program selects data files from disk which can steer within a sector either +/28 degrees or +/-14 degrees producing unmodulated or modulated signals at
2,3,4,5 or 6 kHz using a 43 kHz carrier. ie. Any of the modulation frequencies in 15 discrete bearing steps of either 4 degrees or 2 degrees.
The control program and all supporting data files are held on one
double sided double density disk and a BOOT sector permits the program to
be initiated by a simple keyboard entry by the operator.
lU is an in built operating system command to load and execute a
'Bootstrap' program stored on sector 1 track 0 of a diskette in drive O.
Disc ARE02.
This contains a very similar host program to AREOl, reorganised to
offer a selection of 'within pulse' SWEEP modes at rates from 1 miIlisec to
7 milliseconds period. In addition the program can also load and run the
steered unmodulated data files with the modes of operation: RIPPLE /
STEER.
This program utilises 43 kHz data files but does not offer the NLA
modulation files.
Disc ARE03.
This disc duplicates all the operations described for AREOl but uses
datafiles computed for 15 degrees and 30 degree sectors.
Disc ARE04.
This disc contains a more dedicated version of the control program
STEERf with restricted parameters. The program uses data files computed to
produce a centre frequency of 39.75 kHz. The non-linear second harmonic of
this signal generated in the water matches the operating frequency of an available 'within pulse' sector scanning receiver and the multi-mode transmitter
has been demonstrated to insonify the sector very effectively at long range.
The program was modified, and the new frequency data computed, in order
57
to experiment with a synchronised scanning transmit/receive combination.
The control program slightly shortens the transmitted block length, by fixing
the MSB address, to ensure the transmission. of an integer number of carrier
cycles at this frequency.
Disc AREOS.
This disc contains the 'Multi-burst' frequency chirps. Each block contains a different carrier frequency and when ripple fired mode the result is a
frequency chirp. Two sets of data are stored on this disc offering a frequency
range between 36 and 50 kHz or 10 to 80 kHz. The first band has been used
to demonstrate the frequency response of the system.
Disc DataPrep
This disc collates the Pascal source texts of several data preparation programs, including:
RIPPLE60 - Prepares Ripple/Steer data as described above.
SWEEPg3 - This is a similar program which requests a sweep time
and computes a set of data files which contain continuously changing bearing
data. These files when rippled together transmit a smooth 'within pulse'
sweep signal at a pre-determined scanning rate. The maximum pulse length
(sweep time) is limited to less than 8 milliseconds by the current configuration of the hardware.
CREATEcp - Generates unsteered data files for a set of carrier frequencies for a chirp or multiburst test signal.
MODIFILE. - This is a general utility program which interacts directly with the steered data files created on the disk by the data preparation
programs e.g. STEERg3. The program processes each file in turn to produce
square wave modulated signals for NLA signal generation. The modified data
is then re-filed back onto the disk with a new constructed filename ie
mc8S4mod where the 5th character refers to the modulation frequency. The
modulated data files can be constructed for 2,3,4,5 or 6 kHz and as these are
super-sets of the original steered unmodulated data they also generate steered
transmissions across the sector. Data required for NLA experimental transmissions.
DISPLAYf - This program accesses a named data file stored on a
floppy disc and displays for comparison the first and last 20 samples in each
58
data 'block'. The display exploits an alternative character set created for this
purpose to create a graphic display on the internal VDU without the necessity for a graphic display processor card.
The program prompts for the number of the disk drive storing the
data and a filename. The data is read into a buffer and demultiplexed for display as 16 horizontal waveforms. The LSB's of the block are displayed on
the left and the MSB's on the right of the screen. As the data is normally output by decrementing the buffer address the transmission starts at the right of
this display. DISPLAYf has been very useful aid to check the computed data
as the phase relationships at the start and end of each block are very easy to
compare on the screen. (See examples in chapter 2).
59
A MULTI·MODE SONAR TRANSMITTER
Chapter 5 DATA ACQUISITION
5.0 Acoustic Measurement and Trials Range Facilities.
Practical sonar equipment calibration ideally requires anechoic conditions for reverberation free measurements. Acoustic interference from external noise sources within the spectrum of interest should also be zero.
However such conditions are quite difficult to achieve in practice. At the
higher sonar frequencies small enclosed water tanks, preferably with sound
absorbent treatment, are commonly used for measurement work. In such
tanks the reverberations from the water surface, tank bottom and sides severely restrict the transmitted pulse lengths that can be used. For lower frequency
sonar testing there is little alternative to the use of relatively deep open water
conditions. Still water of reasonable depth can be found in lakes and reservoirs, weather permitting. To utilise such places as laboratories for acoustic
measurement work also requires a sheltered work room equipped with an adequate electricity supply and a stable transducer support designed to assist in
the safe deployment of equipment in the water. Most of these demanding requirements were met for the initial low power trials by the ARE(T) facility
on the King George VI reservoir near Staines. The need to establish a test
facility close to the University has led to very successful cooperation with
the Severn Trent Water Authority who permit us access to the 'draw-off'
tower on their reservoir at Foremark in South Derbyshire.
The full power testing of the Mk.2 system required much greater ranges and deeper water than possible at Foremark, and as a result the equipment was redeployed in a Scottish sea loch on board an ARE(LG) floating
test facility known as 'May time' . This facility is well equipped for acoustic
measurement work and staffed by a technical support group. All of these
acoustic range facilities have required some specialised array support and handling equipment. The basic parameters of beam width, steered angles,
sidelobe amplitude etc. have been measured with the aid of a computerised
beam plotting system developed for this project,l.
60
5.1
Loughborough University Acoustic Test Tank.
The test tank at Loughborough is an unlined concrete construction approximately 9 x 6 x 2 metres in depth. Heavy duty rails assists the accurate
support of equipment and an overhead gantry crane aids deployment and
recovery, (fig.5.1:l). Acoustically this tank is highly reverberant and, as the
maximum water depth is less than 2 metres, the first multipath echoes arrive
at a hydrophone with very short delays over the direct signal. At 40 kHz the
achievable separation of 1.2 milliseconds makes it just possible to gate signals for beam width measurement. The second problem at 40 kHz relates to
the nearfield of the array. Taking the maximum length of the nearfield zone
to be defined by A2f).. we have: A=(15 x 0.04); 1..=.0365 for 40 kHz in freshwater, i.e. 9.8 metres. The dimensions of this test tank are therefore very
restrictive for large arrays. However, the ability of the multi-mode transmitter
to focus the transmission, by adding an appropriate progressive phase advance to the outer elements of the array, can reduce the Fresnel zone effects. Successful beam plots have been obtained within the tank using this
technique to establish the far field bearnwidth at short range.
Fig.S.lIl. LUTEE Acoustic Test Tank.
61
5.2
King George VI Reservoir Trials.
The fIrst open water tests of the multi-mode transmitter equipment
took place on the King George VI reservoir at Staines. The facilities available at this site included a raft with mains electricity which is permanently
moored some 200 metres from the side. Heavy equipment requires the use of
a crane to facilitate transfer from the delivery vehicle to the boat moored
against the steep sloping reservoir wall. The raft is fItted with a small jib
with block and tackle to assist unloading. The water depth is normally maintained at 14 metres and the available range, depending on the chosen direction, can extend to over 1000 metres. Array testing is facilitated by a centrally mounted electric hoist from which the transducer and training gear can be
lowered into the water. The raft's middle floor boards are lifted during
deployment and recovery and refItted around the support while working.
During deployment the hoist wire is fitted with aluminium slotted tubes
which interlock. When the hoist is tensioned these sections tighten into a
rigid torsion tube between the array and the rotating head gear, (fIg.5.2/l).
In the initial experiments hydrophones were deployed some 30 metres
from the raft from a convenient buoyed mooring. However, it proved diffIcult to maintain a sonar beam pointing accurately at the hydrophone as any
wind caused the raft to execute slow angular oscillations about its position.
For later trials this problem was largely overcome by the use of a 10 metre
carbon fibre pole as a horizontal hydrophone support. This technique ensured
that any angular shift in the raft position was tracked by the hydrophone.
The use of Staines reservoir has the drawback of distance from the
University which is slightly compensated by the proximity of ARE(T). A
more serious disadvantage relates to shared useage. The reservoir also supports three separate trials facilities and signifIcant time can be lost while
avoiding acoustic interference to or from other operators.
5.3
Foremark Reservoir· South Derbyshire.
This large capacity reservoir (11 x 109 Litres), completed in 1977, functions as a pumped storage reservoir for Leicestershire's water supply. The
original valley contours were widened during the construction of the dam and
the fInal water depth exceeds 30 metres when full. Working from the drawoff tower a deep water path extends for over 1 kilometer with a depth exceeding 20 metres. The very wide valley has required a long curved dam wall
62
Fig.5.2/1 Trials facility at Staines Reservoir. - Hydrophone support pole deployed.
63
and a very large sector of water is available to work into. Equipment can be
transported by vehicle to the narrow roadway on the dam wall , and tran sferred to the tower using trolleys to man handle the equipment across a foot
bridge, (fig.S.3/l ). Transducer deployment is more difficult at this site as the
working platfoml can be severa l metres above the water depending on the
level. A free standing array support, designed by ARE(T) overhangs the
water from the work platforrn,(fi g.S.3/2). Large arrays for tes ting have to be
ferried , usi ng a small boat, to a point below thi s hoist and attached together
with the training gear. For stability at depth it was al so found necessary to
add a large paddle structure above the pan & tilt to absorb the torsional
Fig.5.3/2 Foremark Draw Tower, outer working platform with
free standing array support and hydrophone pole.
stress during plotting operations. The supporting cable is fitted with tubing
collars, as used on the Staines reservoir facility, and when back tensioned
these create a stiff assembly. An additional complication of this external exposed support is its vulnerability to movement in high winds, especially
when the reservoir water level is lowered as in fi gS.3/2. The support system
suffered some damage from surface ice movement durin g the extreme winter
of 1985. Torsional stabili ty was a problem without the stabiliser as the
64
deployed depth to the array was more than double that available at Staines.
A very adequate mains supply (60 amp single phase) was provided inside the
tower and security of the electronic equipment left stored inside the tower
was good. Working conditions in the winter month s leave something to be
desired as the structure is impossible to heat.
Hydrophones for the beam plotting experiments were deployed from a
stiff fibre glass pole constructed from two 'sailboard masts'. This IO metre
support, deployed horizontally above the water, has worked well in practice,
supporting the hydrophones at the edge of the 'far field' of the array.
The Civil Engineering Department at the University conducted a
preliminary subsurface survey of Foremark reservoir in cooperation with the
Sonar Research Group and the resulting data has made computerised modellFig.5.3/3 Underwater Terrain Model of Foremark reservoir,
computed from a limited echosounder survey.
to .700 900 J(l
pc",o 60
FOAEM ARKRESERVOIR
7'""tD>,~- - --
Ud-WattorV!ew ","IN ~"".IcIoI.Ono_I05I/'1eSj)lll
1987
I.OUQhbofougIIU~1
HydfOgf.p.;St.n.y
---
,- -
ing of the underwater terrain possible, (fig.5.3/3). These model views should
be useful when planning target deployment in future trials. The modelling
work was extended to a hydrographic data base supplied for Lochgoil and is
proving to be a very usefu l aid when interpreting the long range reverberant
echoes.
65
S.4
May time, Lochgoil.
This is an Admiralty Research Establi shment facility constructed from
an enclosed barge which is semi-permanently moored in relatively sheltered
water 60 metres deep, (fig.S.4/I). The site is equipped with hydraulic cranes
to assist in array deployment and although several hundred metres from the
shore it is connected to the mains with both single and three-phase feeders.
A professional boat crew is normally available to assist in the deployment of
hydrophones and targets as required and technicians of the Technical Support
Group are available on board to organise the facilities.
Acoustically, the maximum range visible from 'May time' is limited
by the geography of the glaciated valley to approximately 4 kilometers of
deep water. The Royal Navy Hydrographer at Taunton made avai lable a
recent detailed echosounder survey and this data has been digitised on the
University's mainframe computer and used as a data base for some interesting 3-D perspective modelling of the Lochgoil subsurface terrain,2. These
models have assisted
in the interpretation of echo returns from the
geographic features which characterise the reverberation on this range.
(fig.S.4/2,3).
Currently the Mk.2 multi-mode tran smitter equipment is
Fig.S.4/l 'May time' Acoustic trials facility in Lochgoil.
66
Fig.5.4/2. Computed Terrain Model. Perspective view of Lochgoil
as seen froll1 the transducer position at 30 metres depth.
''-0'"
1070 6350 77
[0 170S 4550 77
pero 60
VIEW from MAYTIME towards RAFTS
Mark•• Indica!es WII" surl_ and"cen\l8 olCan B~oy& between lahs.
A.zimulh Cent.. LIne.
Fig.5.4/3. Lochgoil Modelled from above the end of the loch.
The sea level has been removed to a depth of -50 metres.
Fro_ 787 7125 300
pero 60
[0 1705 4550 77
T
67
I ~oCer oc 56)
deployed in Lochgoil to assist continuing research into the parametric nonlinear modes of sonar emission.
5.5 Sonar Receivers.
The multi-mode transmitter was conceived as a stand alone research
tool with which to experiment with phased array techniques. The acoustic
measurements of performance have in the main been made using standard
commercial hydrophones. For certain measurements wideband low noise preamplifers were constructed as were several passive bandpass filters. The
mechanically scanned images, made at Foremark reservoir, utilised the display equipment developed for synthetic aperture experiments 3. This equipment required some modification and the addition of a preamplifier, bandpass
filter and detector stage. No TVO or RCO signal processing was used in the
reservoir measurements and although these facilities have now been
developed for the scanning receiver they are not detailed here. The high
power trials in Lochgoil benefitted from access to the wide range of commercial receiver and signal processing equipment installed on board. To fully exploit the multimode transmitter's capability as a scanning sonar system will
require a matching 'Transcan' receiver to decode and display the bearing information from a single input channel. Equipment for such a receiver is
being developed and the basic idea for this concept is outlined in chapter 7.
Hydrophones and Preamplifiers.
A variety of hydrophones have been used during this research,
however a 20 mm diameter ball hydrophone (Universal Sonar Ltd.) was used
as the reference hydrophone for most of the reservoir trials. This hydrophone
was calibrated at R.D.V.Crystal, (ARE Portland) and has an acceptably flat
response to well above 80 kHz. Other devices included lower frequency ball
hydrophones Dl/40, DlnO, Dl/80 (Universal Sonar), a precision PVdF
plate hydrophone from EM! 4 and an experimental PVdF Vibetec device
(Raychem Ltd). Use of a single stave of the Mk.2 array as a directional
receive hydrophone also gave very good results in the reservoir trials. The
hydrophones used in the Lochgoil experiments included B & K hydrophones
(BK8100), several experimental (F.E.A.) active hydrophones, a vertically
deployed line array and a vertical 10 x 2 array of ORE 3 kHz low frequency
elements. The later is now being used in the parametric scanned sonar experi5.6
---
68
----
elements. The later is now being used in the parametric scanned sonar experiments as it provides some useable receive directivity in the vertical plane for
the low frequencies of interest.
For most of the initial trials the signals recovered from the
hydrophones were at very high amplitudes and no buffering or amplification
was required for oscilloscope display or for beam plotting.
Low noise battery powered preamplifiers were required in the reservoir trials when examining echoes from target spheres at 300 metres and
also when plotting the far shoreline at I kilometer. Several unsophisticated
preamplifiers were constructed for these trials with the design emphasis
placed on low noise and low distortion performance. As the performance of
most of these designs are detailed in the LUTEE internal reports they are not
re-examined here, S.
5.7
Data Logging and Signal Analysis Equipment.
A variety of wide band oscilloscopes have been used to display the
hydrophone signals for amplitude measurement. The close range measurement technique employed permits a rapid transmission rate and waveform examination is eased as a result. Echo signals from longer ranges can only be
examined at slower rates and a Gould digital storage oscilloscope was acquired capture the transient data. The storage parameters of this equipment,
2048 samples at a 200 kHz maximum sampling rate, are unfortunately rather
close to the 40 kHz transmissions and problems of alias sing frequently occurred with some time base setting. To avoid problems of this nature
Polaroid photographs of the wideband oscilloscope displays have been used
for much of the transient data capture.
Digitisation of the received signals for computer processing and
storage has been employed in the beam plotting equipment, Appendix H. The
gated hydrophone responses are converted to 10 bit digital samples in a BBC
microcomputer. The data being available as an on screen graphical display of
the beamplot or as a data fIle for hardcopy and subsequent analysis.
The mechanical scanned sonar images of Foremark reservoir were obtained by a modified Synthetic Aperture Receiver and, although digitised to 8
bit accuracy, were stored for display in a 6 bit framestore. The data was written to disk and displayed simultaneously on the TV monitor as it was
69
received. The disk images could be processed off-line to generate colour
amplitude coded hardcopy.
At the Lochgoil facility, on board Maytime, a Hewlett Packard
Dynamic Analyser was available. This equipment facilitates waveform capture and the analysis of spectral components for short data samples. The 8
bit resolution system, when set for a 0-100 kHz analysis band can capture
and display a 4 millisecond window of data. The images generated are displayed on the built in monitor and can be hardcopied directly to a plotter.
The last few trials depended on this machine for much of the data analysis
made at the time and it will be even more important in the future NLA experiments.
Portable recording equipment of adequate bandwith for 40 kHz has
not been available although this is a desirable facility. A Nagra IV recorder
offering a maximum frequency response of 32 kHz at 38 cm/s has been used
to obtain examples of the non-linear acoustic effects.
Recordings of the Multi-mode sonar transmissions, made by ARE(T)
staff using an Ampex PR2200 at Lochgoil, have been duplicated for replay
on a older FR1300 machine at Loughborough. These instrumentation recorders are both capable of recording the 40 kHz carrier and 80 kHz harmonic responses generated by the multimode transmissions as the necessary
wide band response is possible using the direct record modes. However, most
of the data recordings concentrated on the Iow frequency NLA transmissions
using the FM record mode to obtain the best signal to noise ratio for later
analysis.
The acquisition of a very high resolution speech spectrograph 6 has
proved an invaluable tool for the analysis of the recorded NLA signals. The
equipment is extremely flexible and produces colour coded hard copy. The
spectrograph can analyse signals into 25 Hz bands if required, however the internal anti-aliassing filters are set for an upper limit of 8 kHz. Much higher
frequency data than this can only be examined by using tape speed transposition techniques but the spectrograph is of most use at the lower frequencies.
70
A MULTI·MODE TRANSMITTER
Chapter 6 TRIALS RESULTS
6.0
Initial System Tests • Beamforming and Focussing
The MIc.!. low power system, comprising a 15 element line array,
130 watt channel amplifiers and the multi-mode signal synthesiser, was taken
to Staines reservoir for the initial open water tests.
The first beam plots, made with the LUT computer controlled pan and
tilt, demonstrated that the system functioned acceptably close to theory. The
un steered main lobe approximated 4 degrees in beamwidth, the sidelobes
were a little irregular but the beam pattern with endfrre lobe positions appeared as predicted by the inter-element spacing and operating frequency, Le.
at 75° off axis rather than 900 ,(Chap.2). These frrst beam plots suffer from
some underwater acoustic interference, believed to be. sonar transmissions
originating from an adjoining raft.
The hydrophone used for these plots was hung from the end of a 10
metre long supporting pole, deployed from the side of the raft moored on
Staines reservoir. The 15 element array was supported from the centre of the
raft and the distance between the array and the hydrophone was 15 metres.
Both the transducer and the hydrophone were deployed midwater at 7 metres
depth, (fig.6.01l). The hydrophone response, plotted while the array was
mechanically scanned through an angle of 200 degrees, is shown in fig. 6.0/2.
The transmitted data in this example is the same in all channels and therefore
un steered. The endfire response is acceptably low and can be compared with
the computer model of this array. shown in chapter 2, (fig.2.0/2). Individual
channel power adjustment was achieved by preselecting resistors values to
generate equal amplitude responses from each stave at the hydrophone. This
method of adjustment proved to be an unwieldy time consuming operation.
Optimum channel matching was not achieved for the frrst trials as is
evidenced by the asymmetry visible in the frrst order sidelobe responses,
(fig.6.0/3). The beam width of the main lobe was measured several times and
averaged close to the expected 4 degrees. Subsequently the channel matching adjustments were simplified by the addition of a 'plug in' attenuator card
71
Fig.6.0ft Beam plotting arrangements at Staines.
..
Fig.6.0f2. Mk.1. Array Beam Plot, 200 degree scan.
IdB
1
-3"~:----------------~~----------------4
{
-1" -SI
-6'
-~.
-28
I
28
~.
"
81
1" Degrees
Fig.6.0f3 Mk.1. Array Beam plot, 39 kHz, 40 degree sector.
8dB
-3dB
.f---------------+--t---------------1
-28
-16
-12
-8
-4
8
4
72
8
12
16
BeaMllidth
=3.6 Oeg
28 Degrees
-
and a test signal transmission mode developed which ripples through each
channel sequentially as shown by the signals in chapter 2, fig.2.8:1,2.
Some difficulties were experienced as a result of the size of nearfield
when attempting to plot the far' field performance of the array. Using a 15
element array of nominally one lambda pitch at 40 kHz implies that the far
field is not fully formed until the measurement point is placed at least 9
metres from the array face.
i.e. if the start of the far field is taken to be approximately d2(),.
In freshwater using the MId array's actual inter-element dimensions:
15 elements (each with a diameter of approximately A)
pitched at 40 millimetre spacing gives an aperture of 0.6 metres.
The length of the near field therefore approximates to:
0.6 x 0.6 / .0365 = 9.9 metres at 40 kHz
The Mk.2 array also has the same aperture.
(16 staves pitched at 0.0375 also equals 0.6 metres):.
In either case it is evident that the University test tank dimensions are
too small to attempt to establish the array's farfield beamwidth. However, as
noted in Chapter 2.4, the introduction of an acoustic lens between the array
face and the measurement point can significantly alter the fresnel zone dimension. Choosing a lens with suitable positive focus can effectively shorten
distance at which the farfield pattern can be determined. A simple emulation
of this lens effect can be achieved by advancing the phase of the outer elements in the array to correct for the increased path lengths so that all the element contribute in phase at the hydrophone distance. The concept has been
tested successfully with computed focus points at various ranges within the
near field. A very small focus correction (9 metres) was applied to the signals measured at Foremark to ensure that the limited length of the pole supported the hydrophone in the farfield. In the Test Tank focus sed data for 2
metre and 1 metres range has been tested successfully. Fig.6.0/4 demonstrates
a beam plot made using unfocussed data at 2 metres range showing that the
array directivity is seriously impaired within the nearfield of the array.
Repeating the experiment at 2 metres using a focus sed data transmission,
fig.6.0/5, demonstrates that a well formed beam pattern now exists which
matches the beam patterns measured during the reservoir trials in the 'true'
far-field. The technique has an additional advantage of generating very high
73
r
r
Scan width 21 d~rees
IdI
SwHp inere..ent '.1 delJrees
Fig.6.0/4
Beam Plot of the Mk.1 Array
, -3dB
;-1--.l-----------''r------+
i
i
at 2 metres range.
BUlWidth
1:13.' DelJ
lineal'
Inside the near· field.
'lot
SelIn width 28 degrees
Sweep increMent 9.1 de9rees
ad8 -'-------------(-""\--------- -------r
Fig.6.0/S
Beam Plot Mk.1 Array
at 2 metres using
-3'8
I \
+-------1-1----'['-\---__----'
=3.'5 De,
linear
Plot
focussed data.
,
BUlWidth
\
\
\
----'
-8
-6
-I@
:
V'''J-:[
;
--------.----.----~-'
-~
-2
a
2
source levels at the focus, pennitting cavitation levels to be reached without
excess stress at the transducer face.
6.1
Beam Forming and Shading.
The theoretical beam pattern, predicted for a 15 element 1 lambda
pitch array, within the +/-30 degree sector when all the elements contribute
equally is shown in fig.6.l/1. A variety of shading techniques exist in the
literature which are designed to reduce the amplitude of the unwanted
sidelobes. One of these, based on the Dolph-Chebychev polynomial, is of particular interest as it can be applied by amplitude weightings distributed across
the array aperture without needing phase reversals. The technique pennits all
the sidelobes to be reduced to a specified amplitude and this reduction ratio
is gained at the expense of the primary beam width and source level. The
theoretical response for a 20: 1 sidelobe ratio is shown in fig.6.1/2.
Using the MIc.! system with its 15 element array, an experimental investigation of a Dolph-Chebychev shaded array was undertaken with rather
disappointing results, (fig.6.1/4). However the unshaded beam pattern from
74
Fig.6.1l1
Theoretical Beam Pattern of a
15 element 1 A. array.
-2'
•
2'
-2'
•
2.
Fig.6.1l2
Theoretical Beam Pattern of the
Dolph-Chebychev (20: 1)
Shaded Response.
Fig.6.1l3
Unshaded Beam Pattern
SeaMlidth
Plotted using the
=3.7 Oe9
Mk.l.array.
linear
38 kHz
Plot
-21
~16
-12
-8
-4
Fig.6.1l4
8
"
8
12
16
r\
Modified Beam Pattern
I \
obtained using
;
I \\
Dolph-Chebychev
shading parameters.
28 Degrees
'
.
38 kHz
.
.
y\
/
BeilltUidth
=4.8
O~9
line.1ll'
Plot
:
\
\r-.l
~~--:'---r-.-~-.-~
·28
75
-16
-12
-8
-4
12
16
28 Degrees
Fig.6.1I5
Theoretical 15 element
1
A. response
modelled
with Mk.l array
phase errors added.
-"
•
-,e
•
Fig.6.1I6
Theoretical 15 element
response with phase errors
and Dolph-Chebychev
weightings.
this array is rather asymmetrical (fig.6.l/3) and a careful investigation of the
phase responses of each element demonstrated significant variations in the
mechanically defined phase of the piston transducers. The theoretical array
responses were recomputed to include the measured phase deviations and the
modified predictions are much closer to the practical plots. The phase corrected but unshaded predicted pattern, fig.6.l/5, and the corrected and shaded
version, fig.6.l/6, demonstrate that the Dolph-Chebychev shading concept offers useful advantages if the inter-element phase errors are very are small or
can be compensated for. The use of 4 bit resolution data in these preliminary
experiments limited the precision available to define the necessary amplitude
and phase and further work on shading techniques was deferred until an 8 bit
system could be employed.
6.2
Beam Steering.
Beam steering is implemented by computing the requisite phase
delays for each transducer channel. Beam plotting the resulting array
response, to establish the positions of the peak and sidelobes, is achieved by
76
"
mechanically turning the array while transmitting the phase shifted data and
recording the hydrophone output. Sets of disk files containing steered data in
4 degree steps were prepared off-line. Each file was then used to generate a
sonar transmission aimed at the specified angle and its beam pattern plotted.
Log Plots of steered transmissions using the data flIes for So, 16' and
o
2S off axis are included in figures 6.2/1,2,3 demonstrate the effect.
Further data files were computed for 2 degree and for 1 degree
steered increments i.e. steering within 30 degree or 15 degree sectors. Later
versions of the control programs prompt for a sector angle and automatically
load the selected steered data sets.
Fig. 6.2/1
•
"'1
Mk.2.array 43 kHz Transmission
_l"l
Log. Scale Beam Plot
1
Steered Data.
o
8 phase shift.
-3848 i
Lo,
,
Plot
i.
,
i,
,
Fig.6.2/2
-31
-2'
-11
•
1.
2.
le
••
5' De,rtts
i
i
1i
Log. Scale Beam Plot
Iff off-axis.
-
{
Mk.2.array.
Sleered Data.
.
"'dB !
-5.
dB_
•
1
--;
J,
Lo.
'lot
i
;
~
,
~
-68dB
I
-51
Fig.6.2/3
Mk.2.array.
Log. Scale Beam Plot
Steered Data.
28° off·axis.
• dB _
!
i
-e.
-le
-2'
-18
•
1.
2.
le
,.
51 Dt!9reu
]
!
;
;
i
4
I
j
-38d8 i
L..
'lot
".d....:_~_~~_~_~~_~_~~_...;
-58
-<18
77
-38
-21
-11
"
11
2t
38
41
58 Oe'1ree5
6.3
Sector Scanning•• Ripplefire and Sweep Modes
Two methods of scanning a sector have been developed. The first,
referred to here as ,Ripplefrre' utilises a stacked set of the steered data
described in 6.2. The name 'Ripplefrre' was taken from naval gunnery terminology as the similarity to that operation illustrates how sequential transmissions on each bearing join to appear as one contiguous pulse. The sector
is scanned in discrete bearing increments as a beam plot of the combination
transmission demonstrates, (fig.6.3f1).
The pulse length transmitted on each bearing can be programmed to
be of any length, however the total pulse length is the sum of all the individual bearing components and a timing 'slew' across the sector is unavoidable. The technique can be altered to introduce the listening period between each bearing transmission, simulating a 'ping and listen' mode which
Fig.6.3f1 Linear Beam plot of a Ripplefire transmission.
,,
,i,
i
i
liHar
Plot
r
,!
t
~
-38
-24
-18
-12
-6
8
,
,i
12
'walks' across the sector. The bearing data can also be stacked in any order
for transmission should it be desired to randomise the scanning sequence.
The second method generates a smooth sector scan by continuously
changing the phases between each channel. Le each channel is driven with a
different frequency, the sweep rate is defmed by the difference frequency between adjoining elements. Fast sweeps imply large difference frequencies and
hence the element bandwidth rapidly becomes a limiting factor with increas-
78
ing array size. For a lambda pitch array a difference frequency of 1 kHz is
needed between each transducer to sweep the beam across the sector in 1 millisecond. A 15 element array requires elements with bandwidths adequate to
accomodate frequencies +/- 7 kHz about the centre frequency. This 15 kHz
bandwidth, centred on 40 kHz, necesitates wideband transducers with a 'Q'
in the order of three! The MIc.! array, constructed from narrow band elements, generates rather distorted beam patterns when driven at sweep rates
faster than 2.5 millisecs. The Mk.2 staved array, which utilised wideband elements, has been shown to produce acceptable beam patterns with a variety of
sweep rates down to 1 millisecond, (fig.6.3/2,3,4).
Fig.6.3/2.
Mk.2 Sweep Pattern
Hydrophone response to a (multiple)
4 x I ms Sweep transmission.
0.5 mS/diy
Fig.6.3/3
Mk.2 Array Sweep
Hydrophone response to a
7 millisecond sweep.
I ms/diy.
Fig.6.3/4
Mk.2 Array Sweep
Hydrophone response to a
7 millisecond sweep.
Hydrophone placed at 30 degrees
away from the centre axis to
show the equal ambiguity lobes.
I ms/diy.
79
These sector scanning modes were investigated using the Mk.2 array
which was used to generate scans of a 60 degree sector at the 40 kHz
primary and at the non-linear product frequencies. The Ripplefrre mode permits long pulses to be developed which can be frequency coded to assist bearing discrimination. It was noted during these experiments that the NLA enhanced 2nd harmonic of the swept signal at 80 kHz proved to be a particularly effective insonification source when exploited in conjunction with a conventional 'within pulse' scanning receiver.
Source Levels and Non-Linear Acoustics.
6.4
The Mk.!. low power system demonstrated that detectable non- linear
signals could be obtained from a 2 kilowatt transmission.
Experiments at Foremark with the Mk.2. equipment running at 10.5
kW confirmed this. Directly recorded signals at 800 metres range were made
using a Nagra IV portable recorder and the data replayed through a
spectrograph? At this range the 40 kHz square wave modulated transmission
Fig.6.4fl. N.L.A. transmission spectrum. Analysed from data recorded
at 800 metres down range.
Foremark Reservoir NLA Trial
50 ms Pulse - 4 kHz modulation.
Analysis Bandwidth = 300 Hz
Vertical Scale 0 - 32 !cHz
Horizontal Scale 0 - 750 ms
o
250
500
750
was expected to generate a significant low frequency component in the water
at the modulation frequency. The recorded signals were carefully kept well
below the tape distortion levels and the hydrophone refnse was filtered to
reject components above 30 kHz. The spectrogram (fig.6.4f1) demonstrates
the presence of the low frequency 4 kHz component and its harmonics at 8,
12, 16kHz etc.
80
(}.
Fig.6.4/2 Foremark experimental detennination of
the 4 kHz Non-linear beam width.
HEASUI<EO 14 kHl) NLA EEAM WIDTH. 2.8 degr.n
I Excit .. hon
~U",wldtl'l.t
43 KHI. 3,5 degru$. )
Nigr, IV TIp, rrcorded dlt •• III,.surrd.t 800 "'tires "1"9"
eIUM,ll, R'cOt'd,d Ampliludu, I" ~'ll hydrephont,
Ch,mel:: R.dio TdlQllCk Volu log, TrlllSrnlt Azimuth Angles.
___!----+--+-+----I--i
-'~-+---+--+-+--+---+-±~t
-'1
STEERfD ANIOL£ _
DE~REES
The Non-linear beam width was also measured at this time by recording both the hydrophone signal and, via a radio link, the simultaneous voice
log calling the steered angle as the array was rotated in small increments.
The replayed data was then measured and plotted manually (fig.6.4!2). this
experiment indicated that a 4 kHz non-linear beam with a -3 dB width of approximately 3 degrees was formed from a 43 kHz primary at 800 metres
range.
To assess both primary and non-linear source levels obtainable in
Foremark the transmissions made from the tower were intercepted at ranges
greater than 350 metres using a hydrophone deployed from a boat. The
received signals were displayed on an oscilloscope and polaroid photographs
recorded the traces. This experiment was repeated on four occasions but
severe weather conditions caused the boat and hydrophone to move excessively and the accuracy achieved was limited.
The technique evolved to minimise stability effects utilised a ripplefrre transmission computed for a 15 degree sector. This ensured that the
hydrophone deployed from a moored boat remained within the overlapping
beams to accurately record the peak amplitude. The buffered hydrophone signal was fed to a selectable set of passive narrow band filters, with known insertion losses, in order to measure the relative amplitude components of the
signal at the spot frequencies 40, 80,4, and 8 kHz.(6.4:1). The dual trace os-
81
cilloscope, powered by a battery inverter in the boat, was used to simultaneously display the filtered primary and one of the selected non-linear frequencies. Polaroid photographs were taken from the oscilloscope display and
the peak amplitudes for each filtered component logged. The results from
one of these trials, analysed in 6.3, indicated a primary source level at 40
kHz of 243 dB ref I )lP. Taking the reduced power used to drive the array
in Foremark (10.5 kW) into account this result seems to be in reasonable
agreement with the later experiments at Lochgoil using the full 16 kW transmission from which a 245 dB source level was realised.
6.5
Source Level Results (Foremark trial 13-5-87).
Measuring hydrophone deployed at mid-water from a boat at 375 metres
range. Vertical beam width 4 degrees; Water depth 17.5m; Temperature 6°.
Signal insonifies the full water column after 250 metres range.
40 kHz
180 mV pIp
-15
dB (ref 1 V)
80 kHz
35 mV pIp
-29
4 kHz
*3.2 mV pIp
-50
dB
dB
-67
dB
8 kHz
*0.45 mY pIp
[* Corrected for +55 dB, post filter, amplification.]
dB)
dB)
(Filter insertion loss at 40 kHz
=
7
(RMS conversion from pk/pk
=
-9
=
-2
=
-17
dB
dB ref 1 Volt
-90
dB ref IV/Pascal.
Combined effect
40 kHz Signal
D140 Hydrophone sensitivity (ARE(P)}
Pressure at hydrophone
Spherical Spreading
73
=
= 48 dB
0-250m: 20 log(250)
Cylindrical Spreading 250-375m : 1OIog(375/250)
Absorption loss (1.25 dBI km @ 6°)
=
dB ref 1 Pascal
0.5
= 1.8
dB
48+ 1.8+0.5
=
50
Referred to 1 metre gives
=
123
dB @ 40 kHz.
dB)
dB ref 1 Pascal.
40 kHz Source Level
=
243
dB ref 1 )lPascal.
(Total loss
Absorption loss @ 80 kHz (3.7 dBlkm).=
=
80 kHz Source Level
1.5
230
dB
dB ref 1 )lPascal
At 4 kHz and at 8 kHz the absorption loss is assumed to be negligable.
=
=
4 kHz Source level
8 kHz Source Level
82
208
dB ref 1 )lPascal.
191
dB ref 1 )lPascaI.
6.6 Reference Target detection • Foremark.
A standard -18dB target
Fig.6.6fl Midwater reference target
sphere was deployed at 300
metres range in Foremark reservoir at approximately midwater. The water depth at this
range was approximately 18
metres, as can be seen from the
~----~~--~·O--~~---
echosounder chart in fig.6.6ft.
(The reservoir was artificially :"-.~---.---~---...--~-..--..-.~-.-~-.:
low at this time due to ----.----\2------reconstruction work on the
__...
._._.. -... ........-.........-.-... ......
dam.) The Mk.2 array, driven
with 10 kilowatts of electrical ;.....-_--'--'_~
power, was configured to use
only 15 of the 16 channels.
---ERlilEThe 16th stave of elements was
used as a matched hydrophone
and the array mechanically
panned onto the target. The received echoes were preamplified and envelope
detected using an operational amplifier 'precision detector' circuit and then
low pass filtered before being displayed on the oscilloscope. Fig.6.6!2 is a
polaroid of the display from a single 5 millisecond 43 kHz transmission
made with the array horizontal, the ripple in the pulse envelope suggesting
the arrival of a multipath signal. Fig.6.6f4 results from a multiple transmission which confmns a variable multipath component, presumed to be via the
surface, which is modifying the envelope after the initial edge. Fig.6.6f5 is a
single transmission taken with the array tilted down 2 degrees. The reverberation from the lake bed has increased significantly. The vertical beam width
of the full Mk.2. array is better than 4 degrees, so at 300 metres range in 18
metres of water with the array untilted the beamwidth just ensonifies the full
water column, i.e. cylindrical spreading is assumed from about 260 metres.
_._.
83
_._-_.__
-.~
--
Fig.6.6/2.
Reference Target
-18 dB Sphere
Deployed at 300 metres.
single 5 ms transmission.
Array horizontal.
Fig.6.6/3.
·18 dB Reference target
at 300 metres.
Multiple transmission.
Array horizontal.
Fig.6.6/4.
-18 dB reference target
at 300 metres.
Single 5 ms transmission.
Array tilted down 2 degrees.
84
A MULTI·MODE TRANSMITTER
Chapter 7 CONCLUSIONS & DISCUSSION.
7.0 Objectives and Conclusions.
The study was initiated with the aim of demonstrating that
microprocessor and digital logic techniques could increase the flexibility and
effectiveness of a sonar transmitter. In the simplest practical sonar transmitter, i.e. the dedicated single frequency echosounder, the economic advantages
of introducing digital synthesis are marginal. However for applications where
greater waveform precision or frequency changes are envisaged the use of a
microprocessor permits a single hardware circuit design to be tailored by
software to suit changing applications.
The investigation of the phased array concept applied to a sonar transmitter has lead to the successful development of reliable hardware and appropriate software for signal synthesis and control.
The associated development of high power MOSFET transistor linear
amplifiers suitable for sonar applications has resulted in a commercially available 1 kW linear amplifier which meets most of the forseeable requirements
in the frequency band from a few hundred hertz to 100 kHz.
The transducer requirements for wide band high power operation in a
staved phased array entailed investigation of suitable elements and resulted in
a customised Tonpiltz 40kHz design. The manufacturer regards this element
as a commercially important development and now offers it for a variety of
demanding high power/wide band applications.
The microprocessor controlled multi-channel synthesis of signal data
has been demonstrated to be a powerful tool generating a very wide range of
signal types for projection into the water by the phased array. A variety of
transmission modes have been tested and all of the original concepts have
been successfully demonstrated, i.e. 'within pulse' sweeps, 'ripplefire' and
electronically steered 'pings'. Additional concepts of focussing and sidelobe
shading, Dolph-Chebychev, have also been tested and the measured signal
parameters in the water have matched the theoretical predictions in almost all
of the experiments. The beam forming and steering characteristics established
using the Mk.2 array have been remarkable close to theory.
85
7.1 The Advantages of a Multi-Mode System.
Phased array transmitter techniques have been demonstrated to give a
variety of advantages. The apparent complexity and cost of a multichannel
system is an economic disincentive but outweighed by the resulting increased
operational facilities:
The inertia free steering of the beam direction is clearly superior to
mechanical steering techniques where rapid steered response or swept sector
characteristics are required.
The high directivity ensures that all targets are insonified efficiently
with the maximum possible intensity as the beam is steered across the sector.
This mode of insonification also ensures optimum target detection in
conditions of high reverberation i.e. in shallow water or under ice, particularly when synchronised with a matched scanning receiver.
Transmissions from a multichannel system incorporate a 'fail soft'
characteristic and single channel failures are rarely catastrophic in effect. The
system has proved to be reliable in use and has been operated in environmental extremes i.e. with air temperatures below freezing and above 33 Celcius.
The use of a number of small power amplifiers to drive individual
staves of the transducer array enables ideal channel amplitude matching to be
achieved, resulting in optimised transmitted beam patterns. Very even insonification of a swept sector can be achieved with less energy wasted in
sidelobes outside the designated sector.
The technique of precomputing and storing the waveform for transmission can be applied over a very wide range of frequencies by optimising the
sampling clock rate. The maximum practical frequency that can be generated
depends on appropriate D/A conversion techniques and requires fast RAM
memory devices in the data buffers. The existing signal synthesis hardware
can generate sinusoidal signals to over 200 kHz with very minor circuit changes. For more dedicated applications, especially if fast bi-polar PROMs are
used as buffers, signal synthesis for phased array applications could be extended to over 1 MHz.
The multi-mode transmitter in its present form has been developed as
a research tool for generating precise signal waveforms at high source levels
in the water which can be steered as required to interrogate a target. It is anticipated that this will prove to be a useful tool for studies of acoustic
propagation.
Used for target evaluation the flexible modes of operation
86
should assist classification studies. The equipment has not been configured
for mobile operation and clearly to operate at full power without cavitation
implies that the array will be deployed at some reasonable depth. If the system is required to be hull mounted on a surface vessel the maximum power
will be restricted as approximately 20 metres of static water pressure is
needed to avoid cavitation effects at full power.
7.2 General Discussion.
The multi-mode transmitter project has demonstrated the feasibility of
applying micro-processor controlled signal synthesis to a phased array sonar.
The component parts of the system are reproduceable and two complete systems, the 2kW MId and the 16kW Mk.2, were constructed. The system
design has been influenced by the investigative requirement and the result is
primarily the intended flexible research tool. However, many of the individual modes could now be exploited in isolation using simpler control circuitry and with signal synthesis data fixed in PROM memory.
The multi-mode transmitter is a complete self contained transmission
system and the suppon software permits signal synthesis modifications to be
made in a trials environment if necessary, without requiring separate computer facilities. Software can also be developed conveniently off-line using a
similar microcomputer without access to the transmitter hardware and data
and control files transferred by floppy disk. The Mk.l low power system is
retained as a test facility for use both in the University's tank at Loughborough and at Foremark reservoir for testing newly developed software. The
Mk.2. 16 kilowatt version is now based at the ARE(LG) acoustic range,
where the long deep water paths available permit the investigation of Iow frequency non-linear parametric signals. The next phase of this work is planned
to exploit non-linear acoustic effects and to develop suitable matching
receiver techniques. The original expectations of flexible operation have been
implemented successfully and new applications continue to evolve. To expand the system beyond its present capability, specifically if long complex
waveforms are to be synthesised, will require some significant hardware
modifications. The use of the compact 256 sample data blocks, when linked
to the 16 adjoining blocks, limits the maximum pulse length for unique data
to approximately 8 milliseconds at the 500 kHz clock rate. Using a slower
clock rate can increase this pulse length but at the expense of the waveform
87
resolution. However as the waveform amplitude is defined by only 4 bits this
resolution is already marginal for some applications. Direct synthesis in real
time of each channel's data could eliminate this problem and given the
steady improvement in speed and computing power of each new generation
of microprocessors it is anticipated that practical systems using DSP devices
and RISe architectures will make this possible. An interim solution which improves the existing multi-mode transmitter has been designed which increases
the size of the memory buffers. This uses 8 bit resolution to define the
waveform amplitude and can exploit much longer buffer lengths. This solution has the side effect of dramatically slowing the data loading time and the
data files will need to be held on a hard disk to minimise the loading time
penalties. A single 8 bit version of an enlarged buffer memory has already
been built which increases the channel data capacity from 32 x 4 bits to 64
kbytes and the initial tests with this prototype card driving all the amplifiers
in parallel was successfully used to generate a sequence of amplitude modulated 'raised cosine' pulses.
7.3
System Reliability.
The final version of the high power system has proved to be quite reliable, the only significant 'down time' was caused by a failure in the
polyurethane sheathing of both transducer umbilical cables. This resulted in
the cables flooding with seawater and the immediate loss of one channel
which shorted out. The cable capacitance of the remaining wires increased
dramatically which in turn caused some overload to the power amplifiers but
fortunately no failures. This unexpected problem was apparently caused by
fatigue failures in the outer polyurethane jacket of the cables after the array
had been deployed in the sea for several months at 30 metres depth. A consultants report on the cable failure indicated a manufacturing defect possibly
aggravated by the high static pressures involved1. The heavy duty pan and
tilt training gear suffered a similar sheath failure, fortunately the low voltages
involved have enabled this unit to continue to function but the cable and
penetrator need replacing. The training gear tilt axis flange/shaft mounting
was found to work loose causing some undesirable backlash after a few days
operational use. The design of the flange fixing was apparently at fault and
simple retightening together with the application of screw locking compounds
did not provide a long term cure. A position indicating potentiometer also
88
failed within this unit and to cure both problems quickly required the pan
and tilt head to be returned for a short period to the manufacturer. Apart
from some early computer interface problems, which required modifications
to the stepper motor control circuits, the pan and tilt assembly has proved to
be reliable. The integration of the precision training gear with a microcomputer has produced a beam plotting facility that has been most valuable in assessing the performance of the multi-mode transmitter. A second version of
this computer controlled beam plotter has now replaced an earlier analogue
system for most transducer beam plotting applications at Loughborough.
7.4 Improving Hydrophone Data Acquisition.
The recovery of hydrophone signals for analysis purposes has, for
most trials, been achieved with direct cabling. The source level experiments
in Foremark reservoir pointed out the problems of attempting direct measurement using equipment in a small boat. Recording signals for later analysis requires a wide band instrumentation recorder and although the Nagra IV -S recorder has been useful in acquiring low frequency signals a much wider band
instrument is needed to satisfactorily record the carrier second harmonic at
80 kHz. The available Ampex FR1300 recorder is unsuitable for such mobile
experiments and it is now recognised that feedback to the transmitting point
is essential if the transmitted signals are to be optimised on the hydrophone
position. The anticipated work in Lochgoil will require measurements made
at significantly increased ranges and whilst the May time research facility has
demonstrated the capability of hydrophone cable runs deployed along the surface to ranges greater than 500 metres this technique has clear limitations.
An investigation of broadband data radio telemetry has led to the construction of an experimental microwave system operating in the 1.3 GHz amateur
band. This battery powered equipment offers the capability of a broadband 6
MHz FM 'video' link plus an optional auxiliary FM voice channel, both with
excellent signal/noise ratio. Operating at low power (4 watts RP) this has
been tested over water to 4 kilometers and should function over much greater
'line of sight' ranges without problems. For the initial tests the received signals were fed directly into a 100 kHz spectrum analyser with very satisfactory results. Encoding the hydrophone signals digitally prior to transmission
is envisaged as the best technique for the future as the telemetry bandwidth
could accomodate 16 bit encoding at data rates suitable for signals containing
89
significant components up to 100 kHz. The study of the non-linear signal distortion, and the propagation characteristics of the parametric products resulting from high power modulated transmissions will require a series of
measurements at increasing ranges. The near-field of such virtual end-fire arrays may extend for several hundred metres and the radio telemetry approach
should provide consistent measuring characteristics, regardless of range.
7.5 Future Developments.
The flexibility of the multi-mode concept should ensure that it will
remain a useful research tool for testing custom designed signals which can
be synthesised quickly and projected for evaluation.
In considering future applications the use of the system as a
parametric source of low frequency sound with high directivity appears very
likely. In the context of parametric transmissions it has already been noted
that at long ranges a very high source level can be achieved at 80 kHz,
generated as the non-linear distortion of the signal enhances the second harmonic of the transmission frequency. The signal is sustained while within the
length of the NLA virtual endfrre array and this 'pump' effect partially offsets the normal absorption loss. Further experiments are planned but the effect has obvious uses especially if rippled or swept across a sector which is
synchronously scanned by a more conventional 'within pulse' modulation
scan receiver.
The multi-mode transmissions permit both rapid interrogation of a
sector or the selection of a specific single bearings. Data for several types of
transmission with differing characteristics can also be stacked for instant access. The flexibility gained by these techniques should be especially advantageous for target detection and classification applications.
Applications of the Multi-Mode Transmitter to fisheries research need
to be explored. Sonar estimates of fish shoal 'bio-mass' are traditionally
based on echo-sounding sections made through a selected fish shoal using a
single channel precision beam echosounder with precision signal processing
to assess the target strengths of resolved individual fish. This effect is particularly pronounced in the case of fish with swim bladders which rarely approximate spherical shapes and hence have significant directivity which
varies with swim attitude. High sonar frequencies are necessary for multi-target discrimination but an argument can also be made for the use of much
90
lower sonar frequencies where the target directivity becomes less variable.
The use of a non-linear transmission may conceivable permit both the low
and high frequency characteristics of such bio-mass to be assessed simultaneously. A multi-beam or swept transmission could sample a much greater
volume of the shoal and thus increase the data acquisition rate.
Extending phased array steering into both azimuth and elevation
planes opens the way towards stabilised beam forming and three dimensional
scanning. Such a system would require increased channel complexity but the
techniques required to implement it can be seen to be practical. The existing
Mk.2 array was configured to allow access to the vertical axis in substaves
of 4 elements. If phase steering techniques are applied to the vertical axis it
can be seen that steering is limited to a maximum angle of 7 degrees (4 A.
pitch) before the grating lobes create ambiguities. This limited beam shifting
might prove useful as a correction factor for vehicle orientation instabilities,
especially if the array is to be installed on an ROV or as part of deep towed
assembly.
Chirp or coded pulse transmissions improve target detection
thresholds very significantly if suitable matched pulse compression or correlation reception techniques are used in the receiver. The multi-mode transmitter
simplifies the synthesis of such signals and provides a suitable test facility
for the exploration of such signal processing techniques when used with
steered signals.
The ability of the multi-mode transmitter to steer signals rapidly into
adjoining parts of a sector by ripple fire or sweep techniques is demonstrably
an efficient insonification technique. However the echoes returning from
these adjacent bearing require some method of bearing discrimination. The
use of a 'within pulse' sector scan receiver, locked to these transmissions is
clearly an optimum solution although the most complex and expensive. The
wide bandwidth of the Mk.2 transducer (11 kHz) opens the way to bearing
coding of the transmissions. The simplest option being a discrete frequency
transmission for each bearing. Decorrelating the bearing information from
the echoes becomes simply a matter of spectral analysis but this needs to be
accomplished in real time. Fast Fourier Transforms can be used to analyse a
signal for its frequency components and software routines to implement
FFT's on the new generation of Digital Signal Processing ic's
e.g.
MC56000, TMS320c25 or the Inmos Transputer need to be investigated. The
91
speed of such routines will define the achievable range resolution. Simple
parallel analogue or digital filtering techniques are practical and will not suffer the same speed restrictions. An analogue receiver based on this concept is
planned. Exploiting non-linear siguals, where a low frequency 'parametric'
product is developed in the water, offers even greater bandwidth possibilities
although the efficiency is low as is the achievable source level. In addition to
very wide band performance such NLA transmissions have the unique advantage of very high directivity without sidelobes. This property of sharply
defining the beam width of a low frequency sigual has clear advantages in
highly reverberant conditions. If the low frequency products exhibit similar
directivity to the 'pump' primary, can be steered and can be encoded easily,
then a low frequency long range transmitter scanning sonar may become a
practical possibility. In the absence of bearing encoded transmissions the
reception of such low frequency signals will require a very large receiving
aperture to discriminate target bearing angles. Bearing coded transmissions at
both primary (carrier) frequencies and at NLA secondary (parametric) frequencies are therefore seen as the key to an integrated transmitter scanned
sonar 'Transcan' concept.
It is hoped that the techniques described in this study indicate practical alternative approaches to some of the problems of sonar signal generation.
92
A MULTI MODE SONAR TRANSMITTER
REFERENCES
Chapter 1
1.0
Voglis and Cook.
1966.
'Underwater applications of an advanced acoustic scanning system.'
Ultrasonics, (4).
Duck, Goodson and Griffiths.
1984.
2.0
'Seavision - A New Sector Scanning Sonar.'
Proc: IEE Colloquium (London). 'Underwater Navigation'. c3.pl-4.
3.0
Skolnik.
1962.
'Introduction to Radar Systems'
Pub: Macgraw Hill. 2nd Ed. 8:278-342.
4.0
Janes Weapons Systems.
1987.
'Marine Radar' (UK) (USA) etc.
Pub: Janes Pub.Inc. N.York.
Goodson, Griffiths, Gida and Cook.
1987.
'A High Power Flexible Sonar Transmitter'
Proc: Conf. IERE (Edinburgh), v72.:101-112.
6.2
Pratt.
1978.
'High Power Transmitters For Sector Scanning Sonar Systems'.
Proc: Conf. I.o.Acoust. (Lowestoft).
7.2
Vyas
1980
'High Definition Deep Sea Sonar'
Int.Rep: LUTEE / lIT (Delhi) Phase IT.
Bi-polar Sonar Transmitters of this family, designed and built
at Loughborough University, were supplied to:
ARE(T), MAFF, DAFS, The Rijkswaterstaat, in Holland, and the
Belgian Hydrographic Service.
Most of these transmitters are still part of operational equipment.
Goodson, Griffiths, Wood and Cook.
1986
'A Flexible Sonar Transmitter'.
8.2
9.3
Proc: Lo.Acoust. (Salford), v8.3.pI97-206.
93
10.3
1988.
Cook, Goodson and Griffiths.
.
'A LOw Frequency Sector Scanner Using NLA.'
- -------------
11.3
~---------
--
in: 'Underwater Data Processing', Ed: Chan. Pub: Kluwer, p47-53.
Cook; Goodson and Grlffiths.
1989.
'A Sector Scanning Sonar Using Transmitter Scanning.'
Proc: Under Sea Defense Technology (London) p718-724.
Chapter 2
1.0
Skolnik
1982
'An Introduction to Radar Systems'
Pub: Mcgraw Hill. 2nd Ed. p280-282.
2.4
Kock
1973
'Radar, Sonar and Holography an Introduction'
Pub:Acad.Press London.
Wames
1982
'The use of anti-phased zones in an acoustic Fresnel Lens for a
scanning sonar transmitter'
4.5
5.6
6.6
7.6
Ultrasonics (7) 184-188.
Hansen
1986
'Linear Arrays' p714-773.
in: 'The Handbook of Antenna Design'
Ed.s: Rudge, Milne, Olver and Knight
Pub: P.Perigrinus for IERE.
Rusby
1970.
'Onset of Sound Wave Distortion and Cavitation
in Water and Sea Water'. Pub: I.Sound Vib. 13(3),257-267
Clay and Medwin
1977.
'The Cavitation limit' p170-175
in: 'Acoustic Oceanography: Principles and Applications'.
Pub: WHey.
Clay and Medwin
1977.
'The virtual endfrre array' pI62-170.
in: 'Acoustic Oceanography: Principles and Applications'.
Pub: WHey.
94
8.6
9.6
Westervelt
1963.
'Parametric Acoustic Array'.
Pub: J.Acoust.Soc.Am. VoI.35 535-537.
Merklinger
1975.
'Improved Efficiency in the Parametric Transmitting Array.'
Pub: J. Acoust.Soc.Am. VoI.58.No.4.
10.7
11.7
1973.
Ross
'Coded Signal Design for a Transmitter Scanned Sonar'
Pub: Journ. Sound & Vib.29(2),p227-255.
Hill, Bahl, Carey-Smith et aI.
1987.
'An I & Q Sonar Receiver
Using Digital Signal Processing Techniques.'
Int.Rep: LUTEE.
Chapter 3
1.1
N ascom H, Manual.
1980
Pub: Lucas Logic Ltd.
1980
'The 80 bus standard'
Pub: Gemini Microcomputers Ltd.
This is based on a (5U) 77 way edge connector and defines
all the signals required for expansion of a Z80 microprocessor.
3.1
'CPM' is a trade mark of Digital Research Inc.
Control Program and Monitor is a disc based operating system
designed to be implemented on 8080, 8085 and Z80 microprocessor systems. It creates a 'machine independent' system by
4.2
routing its I/O communications through reconfigurable lookup tables.
BLS-PASCAL written by APS of Denmark
initially released as 'Blue label software' and later by
Lucas Logic Ltd as NasPas.
5.2
Crimson Elektrik(Leicester) Ltd. Now based at Stoke on Trent.
6.2
LUTEE internal report
1986.
'The 100 watt Crimson MOSFET Power Amplifier for the
7.3
Flexible Transmitter'.
Formerly Pantechnic now Tunewell Transformers Ltd.,
115a, Myddleton Road, Wood Green, London N224NG.
95
8.5
Decarpigny, Debuss, Hamonic,
1987.
Bossut, Tierce, Morrel, Boucher and Tocquet.
'Finite Element Analysis of Low Frequency Sonar Transducers'
Conf.Proc: I.o.A (Birmingham) v9.2 p42-51.
9.5
Wood et al.
10.6
11.7
12.8
1986.
'Investigation of the prototype 15 element array'. Int.Rep: LUTEE.
Wood et al.
1986.
'Wideband elements for the flexible transmitter'. Int.Rep.LUTEE.
Wood, Wood, Goodson & Griffiths 1987
'A High Power Transducer Array.'
Conf.Proc: 1.0.Acoust.(Birmingham), v9(2)p88-100.
Gida
1988
'A Synthetic Aperture Sonar'.
LUTEE PhD Thesis p223.
Chapter 4.
1.1
2.1
3.1
Jensen and Wirth
1975
Pascal User manual and Report.
Pub: Springer Verlag. N.Y. 2nd ed.
Marsh
1985
Pascldos
Pub: Kenilworth Computers Ltd,
TurboPascal 4.0
Pub: Borland International,
4585 Scotts Valley Drive, Scotts Valley, California.U.S.A.
Chapter 5.
1.0
24
3.5
1986
Hill
An Automatic Beam Plotting System'
Proc: I.o.Acoust (Salford) v8.3 p207-212.
Goodson et al.
1989.
, Subaqueous Terrain Modelling,
An aid to Scanned Sonar Interpretation.'
Symposium S.U.T. (Aberdeen).
Pub: J.Soc.for Underwater Technology. v15,(1) p22-24.
Gida
1988
Synthetic Aperture Sonar
LUTEE PhD thesis.
96
Brown.P.
PvDF Plate Hydrophones
Data sheet and calibration chart.
5.6
Central Research Laboratory, EM! Ltd., Hayes Middx.
LUTEE internal reports various (1986n) evaluation of:
Plessey SL560/ 561 / 1612 etc.
6.8
L.S'!. Colour Sound Spectrograph supplied by:
Loughborough Sound Images Ltd.,
Epinal Way, Loughborough, Leicestershire LEl1 OQE.
Chapter 7.
1.0
.1988
Hemsley
'Examination of Polyurethane Coating from Underwater Cables'
Loughborough Consultants Ltd. MP/ARM 52.
Consultants Report commissioned by ARE(T).
97
A MULTI-MODE SONAR TRANSMITTER
APPENDICES
Appendix I
ii
iii
iv
v
vi
vii
viii
Drawings and Circuit Diagrams.
Bridge A - Address and Data Buffers, Pon switched.
Bridge B - Programmable Read Address Generator.
32 k x 4 bit - Channel Buffer Memory and D/A conveners.
1 kW linear MOSFET amplifier including Hi-Slew Driver.
PCB mask for Channel Buffer D/A 'piggyback' card.
PCB mask for improved drive card for 1 kW amplifier.
Pre-release drawing of 256 element Mk.2.Array.
Appendix IT
i
ii
iii
LUTEE Beam Plotter.
Computer controlled beam plotter hardware.
Beamplotting Software.
Sampling Electronics.
Appendix lIT
Software, Control Program Listing.
Pascal listing of program - RIPPLE60.
Pascal listing of program - STEERd.
Pascal listing of program - DISPLAYf.
ii
v
xii
I -i
~
~,
--"-
r--
!=
F
~
~
~
~
_. !::
~
......
!:
-
~
c>v
F
'"
".
~
,...
~
.1.
IR>
'"
..•u
"••
•
.."..."",,
...
C>V
-
"--
!=
i=
'"n.
......
~
~
1IIIIIIiI
~1111
"
~
~
"
~-- -~II1111
"""
11
~
~
~
__
!:=
~
.,
~.
~.
~:?
M
+: ~1'-"
C>v
,.
"..
F
~j.....
~
RI~BON
CR9\.E
LINK TO
9RIDCE-R
C>v
'"nu
• I;:
~
'--
~
L UTEE
I
SONAR & SIGNAL PROCESSING RESEARCH GROUP
DRN.BY.
DATE
29/05/89
REF. NO.
FTX IBB-t9ADG
MULTI-MODE
SONAR TRANSMITTER
80 BUS EXTN. CONTROL BRIOGE-A
..
.
, • .. •
•
......
.~
'Q
,....
~
,u
-•
- ••
•
•
~
~
~
~
~.
~.
~.
:::t:t:
11
L..
~ i....-
..Ei==l
Addr ... Bu.
Do,oBva
::::f .~
:~r-·E
I
•
11
LUTEE SONAR & SIGNAL PROCESSING RESEARCH GROUP
i
PROJECT
ORN.8Y.
DATE
27/5/89
REF. NO.
FTX 19"'19AD(.
TITLE
NUL T I -MODE
SONAR TRANSMITTER
CONTROL CARD BRIDGE-B
-
-
,.
'"••
••
•
•••
......
•...••••••
••
Chonntll 1
Anologut' alp
'NO
Connector- Inutrtac.
te Analogull Circuli
Sub-A•• embl!:! PpI"CBA _ _ _J
•
LUTEE SONAR & SIGNAL PROCESSING RESEARCH GROUP
IlpROJECT
DRN.BV.
DATE
12/G/89
REF. NO.
FTX 19019 adg
MULTI-MODE
SONAR TRANSMITTER
32k RAM BUFFER <2 x 1 bit Channels)
I ITITlE
Veralon 2 (Bond on ,Uer-oead. Ltd. peS)
....,
<
-
LUTEE SONAR & SIGNAL PROCESSING RESEARCH GROUP
I
1-'.
DRN. BY.
R. O. !;oad.on
DATE
t017189
REF. NO.
FTX 97079 odg
MULTI-MODE
SONAR TRANSMITTER
1 KW MOSFET POWER AMPLIFIER
a
a
It---G
-::....
.-...
_a
~
a
a
a
a
a~
'1
a
a
a
a
a
a
a "'---'"a
a
a
::::J
FLX.TX.
D/A v.S
Printed Circuit Mask for the 'piggyback' board required to be mounted on
each channel buffer memory.
The card provides direct access to the intemal memory data bus and latches
8 bit samples on command for conversion via two 4 bit D/A converters. The
analogue signals are low pass filtered and accessed via two Suhner miniature coaxial connectors on the card front edge.
I - vi
Printed Circuit Mask for the improved High Slew version of the drive circuit
used in the 1 kW MOSFET amplifier. Each amplifiers uses two of these
mounted above the MOSFET block on socket pins. The drive cards are identical with one configured for high gain i/p and other as a low gain inverter
buffer. The track link between pin 2 and 3 needs to be broken to insert an
optional external gain control potentiometer
I - vii
8
eee
188
1~2·
.-------~J
11188
1888
ARRAV MOUNT (EXISTING)
TEE SLOTS on 254 cantr ••
Ir-------~
......
,
:S.
~.
~.
ARRAY 2
L - -_ _ _ _ _ _---' ' -_ _ _ _ _ _-----l
106 WAY CONNECTOR
.tk-"
(AMEECO)
L...--_ _ _ _ _ _---I
DU ALl 6
X
8 A RRAY
PRERELEASE DRAWING
FLEXIBLE SONAR DRG.NO: ADG84-.1-1
SONAR RESEARCH GROUP
LOUGHBOROUGH UNIVERSITY
TRANSMITTER
DATE:
19-1-85
APPENDIX IT
1
2
3
LUTEE Beam Plotter
Pan and Tilt Hardware.
Control Software.
Sampling Electronics.
i.
ii.
Hi
1
The LUT beam plotting hardware.
The LUTEE system devised for precision beam plotting utilises a
remotely controlled, stepper motor driven, waterproof training gear with
azimuth and elevation axis. Two versions of which have been acquired from
the manufacturer, Molynx Ltd. The first type is constructed using a cast
aluminium waterproof housing and this is used in both fresh and salt water.
Some corrosion problems occurred, agravated by surface damage, which
necessitated overhaul but the units have functioned reliably for some considerable some time. The more powerful unit commissioned primarily for this
project is shown in chapter 3 Fig.3.7/1 supporting the Mk.2 array during
deployment at Foremark. This second type is constructed from stainless steel
and has a rated operating depth in excess of 500 metres. Functionally the underwater units differ only in their final gear box drive ratio. An internal view
of the housing and gearbox is shown below.
II - i
The devices can be controlled manually by joystick or by axis pushbuttons or the controls can be interfaced to a microcomputer for programmed
motions. In practice, while beam plotting, only the horizontal panning axis is
driven by the computer. The synchronous acquisition of the signals received
by the remote hydrophone has to be arranged by additional sampling
electronics controlled by the same program and taking its delayed timing
from the transmitter trigger pulse.
2
Beamp\otting Software.
The control software for plotting is menu driven and permits the selection of a sector angle to be panned through and the increment size between
each sample point. Additionally the zero position can be set after manually
determining the best position. The program starts by rapidly offsetting the
array position to half the required sector angle and then with predetermined
delays for sampling steps through the whole sector whilst recording 10 bit
data samples at each step. On completion of the scan the array is rapidly
panned back to the centre zero position. Simultaneous with the action of sampling the data a screen plot graphing the amplitude received versus the angular position is displayed. This data can be subsequently labeled and stored
onto a floppy disk and a hard copy plot can be generated on either a printer
or plotter. When redisplaying the data either linear or log plots options can
be selected.
The control software has evolved in several generations. The fIrst version, written very quickly for the initial Staines reservoir trial, contained a
subtle bug which incrementally produced a zero offset after each plot. The
data files recording these plots are therefore diffIcult to relate to precise
steered angles. At the time additional accuracy checks were made using the
mechanical azimuth scales on the array support and these gave good confIdence that the phase steering modes were consistant and correlatable.
Later versions of this software were used successfully with both pan
and tilt systems and only very recently has a re-written version taken over. It
was noted during a laboratory test of the Mk.2 heavy duty pan and tilt, using
a laser, that an error in scaling of .08% existed in the positioning accuracy.
This problem existed as the software, written in BBC assembler code used integer arithmetic and the low ratio gear box in this second unit included a noninteger division factor. Additionally the original disk storage technique
II-ii
retained only the plotted screen positions and not the actual amplitude data.
This technique seriously limited the re-displayed dynamic range when a
logarithmic plot was required and introduced an undesirable artificial quanti sation noise floor below 45 dB. A re-written program in Basic has eliminated
both problems although fewer data files can now be stored on a single floppy
disk. Only the stepper motor control signals have been retained in assembler
language for efficiency and these routines were changed to assist the equipment to decelerate as it approaches each sampling point
3
Sampling Electronics.
The analogue data acquisition required additional circuitry before the
digital samples can be obtained. The interface box between the sampling
hydrophone and the computer contains adjustable gating delays triggered
from the sonar transmitter. These delays pennit an variable width range gate
to be applied to the hydrophone signal and are essential if multipath signals
are to be ignored during the plot. The analogue sample, triggered by the
range gate delay logic, feeds a peak detector and this outputs a a latched DC
level between samples derived from the signal amplitude. The output of this
peak detector is fed to a NO converter within the microcomputer (BBC
plus). One significant modification is needed in the BBC microcomputer to
take full advantage of this system, this involves replacing the internal NO
converter's reference voltage with one of greater precision. The simple
reference used as standard is vulnerable to power rail noise and it is not normally possible to achieve the full 10 bit accuracy without a circuit change.
The modification involves a pre-regulator applied to the 12 volt rail to
generate a quiet 5 volt source. This is then used with a 'bandgap' precision
reference to supply the NO converter with an effectively noise free voltage
for comparison. The result works well and the full 10 bit resolution can be
achieved.
II - iii
APPENDIX III
III-ii
III-v
III-xii
Program Listings.
Pascal Listing - RIPPLE60
Pascal Listing - STEERd
Pascal Listing - DISPLAYf.
III - i
Program RIPPLE60,
( ComputI''' dat& -Ior CSO degre ••• c.tor ripple
)
)
( Writ ..... t of unmodul&t.d -111 ... 1 mcXS8mcSO
( Last update AOG 1~6/S7 )
( C&lculates -Iocus .. ed and .. te.red data on. bearing at a time.)
( Assume. Hardware Modl-llcatlon to clamp OVP. SET77 remov.d. )
'.b.T REENTER I ,
v&r NBbegln,NSend,SAMPLE,X,J
BLOCK,BLK5,CHANNEL,YBYTE
Bd,L,H,J,K,Z,ADOR
CYCLES,FREQ,LAMBDA,FI,F,D,OMEGA
Focu.,Ph ••• STR,A,B
FI'.
II nt.g.r,
Ilnt.g.r,
Ilntegerl
Ir.&ll
Ir.&ll
,ARRAYI0 •• 2561of Inhger,
Istrlng[ll,
,StrlnglSI,
51
Eo-l.B&d,Ple&s.d.l&y
RE
I,S.ctorcount,Loop
,Strlnglll,
IBool.&nl
IR.&I,
.Inhg.rl
Y
B,a
5
Function
Function
Function
Funct I on
IStrlng[2~5ll
ItoS(Itlnteger)IStrlng[6l.Ext.rnal jC851,
Stol(SIStrlng[cSl)llntegerIExternal ~C8541
RtoS(RIRe&I.L,PsJnteg.r) IStrlng[cSellExhrn&1 j:C857,
StoR(SIStrlng[68l)IRe&I,Externa,1 jCe~J
proc.dur. CLS,
CODE .3E,.BC,.F7,
proc.dure PAUSE,
Y&.r kllnteg.r,
b.egln REPEAT kl-keoyboard lNTIL k09,end.
procedur. CLMEH,
b.gln
-Ior I.-e to jaBS do
m.m(jSeee+lllct77
.nd,
proc.dur. OECHEX.
b.gln
ca •• NBb.gln 0-1
IIBI-'I',
2,BI-'2'.
3IB,-'3' I
4IBI-'4' ,
:5IBI-'~'1
6IBI-'6';
7IBI-'7';
8,B,-'S'.
9IB,-'9'.
18.B.-'A'1
11IB.-'8' I
12.BI-'C',
13IBa-'0'1
14IBI-'E'j
IS.B,-'F';
i'nd.
end,
procedur. BYTE I
b.gln
YBYTElcround(X+lcS*Y[SAMPLEl).
YlSAHPLEI,-0,
ADDR,- .SBBB+SAHPLE+(CHANNEL-2).12S+«BLOCK-NBbogln).2B4B),
m.m(AOORl.-YBYTE,
(wrl hln(AOOR,'
, ,YBYTE,'
, ,SAMPLE) ,)
.nd.
III - ii
proc9dur9 ELEMENT,
b9gln for SAHPLE.-e to 256 do
b9gln
XI-roundC7*slnCOMEGA*SAMPLE-Focus+PhaseSTR»+7,
If odd(CHANNEL) then Y[SAMPLEI,KX
91s9 BYTE,
9nd,
9ndJ
proc9dur9 DIRECTION,
b9gln
for CHANNEL,-1 to 16 do
b90ln
scr99n(1e,13) I
wrlt9('Calculatlng Chann.l No.-',CHANNEL.2),
wrlt91nl
Focusl-(PI*sqr(CHANNEL-S»/O.
PhaS9STR I-(BLOCK-S> *(CHANNEL-S) *PI/7,
CPI/7 -4 d9g.)
(PI/14=2 dog.)
ELEMENT I
.nd,
(PI/2S-1 dog.)
.ndl
<proc9dur9 SET77, * Originally us.d to avoid hardware hangup.*
begin
for 1.-8 to S do
memC.eeee+I*jleBl.-j77;
end, )
proc9dur9 PARAM,
b9gln HI-~8BB8,I.-.lee,endl
procedure CHAR.
b9gln 11- 168-Z;
C160 to 145) wrlteCchrCI»;endJ
procedur9 HI;
b90ln 21-m.mtH+«J)*~100)+K-ll MOO 16,end,
procedure LO,
begin ZI-trunc(memtH+«J)*.100)+K-ll/16) end,
procedure PLOT,
begin
Bd.=e,CLS;
scr.en(l,16) ,
for JI-B to 7 do begin
for LI-1 to 2 do begin
Bd.-8d+l, screen(1,0»
for Kz=1 to 20 do
begin If odd(L) then LO else HI, CHAR,.nd,
screen(21,e);wrlte(BdI2),screen(24,0);
<1/2 Block)
(Full blocK)
for KI-Cte7 to 127 do)
235 to 255 do
begin If odd(L) then LO .Is. Hl,CHARJend,
scr.enCt,Bd),
endJend.end,
(proc.dure 01 SPLAYm I * Used to display start and end phases
b9gln
CLSIPARAM,PLOT,PAUSE
.nd. )
*
procedure SavemcCVar Bad.BooI9anIS,F,EIInteo.r;FIStrlng[S]),External 'C94EJ
proc9dur9 AUTOFILE,
uar FNlstrlng[6II FOIstringt211 FNAMElstrlnotSll
b.gln
FNlaB,
(ItoS(B),)
FOI-RtoS(F,2,0),
FNAMEI-concatC'mc',FN,'S0m60'),
wrl teCFNAME),
Savemc(Bad,jS0ee,tesee,e,FNAME)a
scr •• n(1:5,3e>I
If Bad then wrlt.CFNAME,1 Failed !/){else wrlte(FNAME,1
.nda
III - iii
Written'»
BEGIN
(*** MAIN PROGRAM ***>
CLSJscr •• n(4,16),writ.C'69 DEGREE SECTOR DATA - y2.3 - ADG 16/6/87')1
scr •• n
(4.1).wrlt.ln('~~
CLMEHI (Sottlng
mom[~8eee
> iB8eel to
5cr •• n(18,3),
wrlt.C'Requlrtd Cycles/Block
•
REENTER1,
.cr •• n (35,3).
r •• dCCYCLES)lwrit.ln('
---
_~II::K_=')
I
i77>
'>,
'>,
FREQ,-CYCLES*5E5/256 1
scr •• nC18,5)lwrlttC'Freq.- ',FREQ/10e912s3,' KHz, c/Bk-',CYCLESI212,'
LAMBDA,-15ee/FREQI
5cr •• n(18,7)1
wrlte('Foc&1 dlstanctCmetr •• ) • '>,
r ••dlnCF)Jlf F-e then goto RESNTER11
DI-F/LAMBDA,
OMEGA,. PI*CYCLES/1281
NBb.glnl-B,
REPEAT
NBb e olnl-NBbtgln+ll
NBtndl-NBbtOI n I
for BLOCKI-NBbeoln to NB.nd do
begin
5cr •• n(18,11),
wrlt.C'Calculating aearing No.-',BLOCKI2)1
wrl hln,
DIRECTIONI
end,
BlKS.- NBtnd-NBbegln+l,
OECHEX, 5cr •• n(1,16),
wrlttC'Wrltlng FII. 5cr •• n(16,16),
AUTOFILEI
until N8bogln-15
END.
III - iv
,)I
ProQr~ STEERdl
(Program uses dl~c sid~s e &
(Flexible Transmitter
I N.L.A. Control Program
(Written by I A.D.Goodson I Last ModI31/S/67
)
)
)
(Mod.s.
SCAN SECTOR • RIPPLE • STEER
)
CS,llets +/-30 or +/-15 dlgr.,. STEERED DATA
)
<Usts. Unmodulated or NLA modulated datafllt5 2-6 kHz.)
<*****************************************************)
C* NOTE
*
Tlxt+Code Size Ixceeds
teeee
data boundary
*)
C*****************************************************)
I ab. I RESTART21
cons.t A-41B-SICA=6;cB-7J
Va"
puls.e
prl.SAM,c,h,k,bsll,Ps.n,pc,reps
N,J,K,TXN,BLK.pau.I
CAROSEL,ALSB,AMSB,TXNS,dec
P,U,D,Hx3,Hx2,Hxl,Hx8,hlxno,Sl
Char3,FF,SF
DIR
MODE
t I tl.
FILE,Fq
Bad
Procedur.
Proc.dur.
froc.dur.
Proctdurt
froctdure
Procedurt
Proctdure
.REALI
• INTEGER I
• INTEGER I
• INTEGER I
.STRING! II1
• STRING! II1
.STRING! 41 1
.STRINGI1311
.STRINGI4SII
.STRINGISII
.BOOLEANI
Loadmc(Var Bad:BooleanIF1LEIStrlng[S])JExternal jC04B,
Sf.v.mc (Vf.r BI Bool •• n IS ,F, EI I nteoer J FI Str I ng[ 8]) I Ex hrna I jC04E.,
CLS,Codt t3E,jC,tF7,
OOS,COOE tC3,t0e,tOe;(Jump to Operating System)
Drlvv(IIIntvOtr)IExternal tC048,
PAUSE, begin r.pt.t KI-kerboard until k<>e .nd)
HEXCON, begin hl-ord(h.xno)-4811~ h>9 then h;=h-7 end;
Procedurt CON HEX , const HEXSTRING-'0123456789ABCDEF',
begin h:ah+l,hexnot-mld(HEXSTRING,h,l) end,
Proc.dure OECHEX,
btQln
(call with value in'dee'.)
hl""'dec DIV 161
CONHEXI
wrlt.(hexno),
hl-dec MOO 16,
CONHEXI
wrl h(hexno);
end;
Procedure FRQ .. ;
btgln
Drlve(l);
(30 degree sector data)
h.=KICONHEXI
FILEI-concat('mc',hexno,'S',FF,'mod');
end;
Procedure FRQbl (Constructs required File-name
begin
Orlve(0);
(60 degree sector data)
h.-KICONHEXI
FILEI-concat('mc',hexno,'S',FF,'HOO'),
,ndl
~or
Procedure INITPORT;
btoin
out(cA,tFF)lout(cA,e0)1
(Set~ port4 into mod,S I .11 bits •• t as outputs)
out(cB,tFF)lout(cB,j18),
(Set~ port5 Into modeS with bit 4 a$ input,)
( othtr$ output )
III - V
bearing and
~r.qu.ncr)
Procedurt CALCmsbf
begin hexno;=Hx31 HEXCON, c:-i6*hl
htxnol-Hx2, HEXCONI AMSB;-h+CI (Hx2 .tlects load address'
Proctdure CALClsbl
begin hexnol-Hx1, HEXCONI cl-16*hl
hexnol-HxS, HEXCON, ALSBI-h+c,
end,
Procedure TITLE.
b.gln
14 SF-'S' then tltleJ.C'30/60 degree Sector'),
if SF-"
then SF_-'B',
if SF-'A' then title,-C'
30 deor.e Sector'),
If SF-'B' then title •• C'
60 deor •• Sector'),
CLS,scr.enCe,16)1
wrlt.lnC' Flx.TxI Steered NLA
',title),
screenCe,I),
wrltelnC'
_____ a ___• • • •_ . _________
___________ • • _==
~
'),
end,
Procedure CALCpul.e,
beoin
pul •• ,-ALSB*2E-3,
(0.51,)
14 mldCFILE,5,1)-'3' then begin pul.tlce.341 Hxll-'A'JHx0_-'A'.ALSBI-~AA;endl
14 midCFILE,5,1)-'5' then beoln pul ••• -e.4BS,Hxl1='C'IHxBl-'C',ALSBI-'CC,endl
pulse.-pulse*reps;
i4 leftCMODE,2) -'RI' then pulse.-pul.e*15,
end,
Procedure PRESET,
beoin
TITLE,
CALCpul.e,
wrlhln,
.creenC12,0) I
wrltelnC'Pre.et output condition •• '),
scr.enC12,B),
wrltelnC'--·-·--·-=.--=-~===---');
screenC1e,e),
wrltelnC'Data Start Address • • • ~',Hx3,Hx2,Hx1,Hx0)1
.cre.nCle,e).
14 pre>175 then OIRa-' Up , else DIRI='Down',
screenCie,e);
wrltelnCreps,' Modulation Blocks / Searlno'),
sereenCte,B),
wrltelnC'P.u.e Length ',pauseIS,' millls.cs'),
scr •• nCtS,B),
wrlte1nC'Pulse Length
',pulse.4,i,' mllll.ecs'),
scrlenOB,e) ,
wrlt.lnC'Oper.tlonal Mode. ',MODE),
end,
Procedure DEFAULT,
beoln
outCB,j01) ,DELAY,
outCA,iiliFF) ,DELAY;
out(B,~02) ,DELAY,
outCA,ALSB) ,DELAY;
outeB,.04) ,DELAY,
outCA,AMSB) ,DELAY,
outeB,.09) ,DELAY,
outCA,pr.) ,DELAY,
outCB,j28) ,DELAY;
outCAtrep~),OELAY,
outCB,j48)
outCA,pe)
outCB,iA0)
outCA,TXNS)
PRESET,
end;
,DELAY,
,DELAY;
,DELAY,
,DELAY,
(0000 0001)
e.11 RAM cards ~e1ect.d)
(8eee 8818)
eLSB address set)
(0000 0100)
(MSB address s.t)
(8000 1800)
(U/D Preseah)
(e01e 0000)
(Block rlp.at.)
(0100 0000)
(Pause Length)
<1010 0000)
(No.Tx.Pu1s •• )
III - vi
Proc.dure GET68 I
blQln
(Default load. 60 Deg.S.ctor)
SFI-'S'I
(NOTE angl •• s.t by data!)
c •• Hx2 of
'8'
'F'
Fq 1 - ' - ' I
Fql-'+28' I
Fql-'+24',
Fql-'+20',
Fql-'+16'.
Fql-'+12',
Fql-'+8 "
Fql-'+4 ' I
Fql-'9
'1
Fql-'-4 '.
Fql-'-8 '.
Fql-'-12',
Fql-'-16',
Fql-'-20'.
Fql-'-24'.
Fql-'-28',
'E'
'0'
'c'
'B'
'A'
'9'
'9'
'7'
'6'
'5'
'4'
'3'
'2'
'1'
endJ
end,
Procedure GET30 ,
begin
SFI-'A',
cas. Hx2 of
Fql-'·.....
Fql-'+14
Fql-'+12
Fq 1-'+18
Fql-'+8
Fql-'+6
Fql"'+4
Fql-'+2
Fql-'8
Fql-'-2
Fql-'-4
Fql-'-6
Fql-'-8
Fq 1='-18
Fql"'-12
Fql-'-14
'8'
, F'
'E'
, 0'
'C'
, B'
'A'
, 9'
, 8'
, 7'
, 6'
, 3'
'4'
, 3'
'2'
'I'
.nd,
.nd!
,,,
',
',
',
,
',
',
',
,
',
',
.,
.,
',
'
'
'
'
'
'
'
Procedure ADDR,
'ab. 1 REENTER3,
~ar HEXAODR;STRING[4l;
begin
wrlte1n,
wrlt.('
REENTER3,
], ) I
kl=8.
scre.n(40,8),
read(HEXADOR),
Hx31-mld(HEXADDR,l,1>Jlf HxS)'F' then kz-I,if Hx3('9' then Kz=1;
Hx21=mld(HEXADOR,2,1),
Hxll-mld(HEXADDR,S,l),
Hx8Iamld(HEXADDR,4,l),
CALCm~blCALC1.bl
If k-I then goto REENTER3,
out(B,.S4) ,DELAYlout(A,AMSB) JOELAYI (Start Addr.ss MSB's)
out(B,.82lIDELAYlout(A,ALSBlIDELAYJ <Start Address LSB's}
wrlteln;wrlt.ln,
wrlt.1n('
Start Addr ..... of Transmission Oat& .',Hx3,Hx2,Hx1,Hx0),
H SF-'A' then GET30 e1 s. GET60 I
If 1.ft(MODE,2)-'ST' then HODEI-conc&t('STEER ',Fq)1
end,
III - vii
Proc.dur. RIPSTEER,
b.gln
CD.fault s.ttlngsl- Pr.scal.r 590 KHz - SAM -)
C pr.,-j68 s.ts count down to ~88 KHz)
C bits 8-3 - pr.scal.r ratio. bit 4 not us.d )
( bit ~ • STEERI RIPPLEI/SSP )
( bit 6. RIPPLEI/STEERI/SSP )
14 p.'p' th.n begin pr.,- B jHODEa-'SECTOR S~' end;
If P.'R' th.n b.gln pr.,-184 ,HODE.·'RIPPLE FIRE' end,
If P.'S' th.n b.gln pr •• - 48 ,MODE •• concatC'STEERED ',Fq> end;
outCB,ies> IDELAYlout(A,pr.> ,DELAY,
.nd,
Proc.dur. PASS, (Circulate Modulation Block)
b.gln
wrlt.ln,
write C'
Block repeats/Tx.Puls. Cl •• 2~~>
scr •• nC41 ,9>,
r •• dlnCr.ps>,
If r.ps)2~~ th.n reps,-2S5,
If r.ps<l
th.n reps.-l,
outCB,j28> ,OELAY,out<A,r.ps> ,DELAY,
.nd,
Proc.dur. WAtT, (PLENGTH d.lay lookup tabl. )
bogln
CASE pause OF
Ilpcl&iSO,
5Ipc.-i3S;
181pcl-i341 5B,pcI K i80,
1881pcl-j2B, 208.pc.-i2A, 3881pclca2EJ48elpcl&i29J
588Ipcl-a20, 688,pcl-i2B. 18ee,pcl-jlB,
2888Ipcl-ilAI3808Ipcl-tlE, 4e88,pcl-a19,
5800.pc.-jIOI6888,pcl·jlBll088B,pcl-ilC;
OTHERS.pc .-=0;
.nd,
.nd,
Proc.dur. PLENGTHI <Pause betw •• n transmissions)
b.gln
wrlhln,
pc. s 8,
wrlhlnC'
Pause times a",a I1 abl. are,'),
writ.lnC'
1,S,18,S8,18e,2e8,388,488,588,688 msec');
wr i h·I n('
and 1,2,3,4,5,6,18 seconds'),
wrlt.ln,
wrl hC'
Enter Pause L.ngth Ci n rni III S"cs) [ ••••• ],) I
REPEAT
scr •• nC48,8>J
r.adCpause',
WAIT I
LNTI L pc oe I
wri hln,
outCB,t48)jOELAY,outCA,pc),OELAY;
.nd,
Proc.dur. SELECT, <Pag. set.ct to load output RAM card)
btgln
cas. N of
81 bstl,-l,
I. bs.II-=ZI
2, bs.11-4,
31 bs.II-=SI
41 bs.l .... 16J
:51 bstll c 32.
61 b .. ell-=64,
71 bsell&128,
.nd,
out(B,81);OELAYloutCA,b$el).outCB.96);OELAY,
scr •• nC5,8),
writ.C'Bo&rd ',N+l.' Selected> '),screen(25,9>,
end;
III - viii
procedure TRANSFER; <Copl.s Data from base memory to selected page)
begin
TXN I~TXN*~ I ee I
for NI-a to 7 do
begin
BLKI=N * 1111313,
SELECT I
(C.rd N)
out(B,o),
CRe-enablt bridge A.)
for 11-13 to ~FF do
b.gin
memCjAaae+I+TXN1.-memC.aaaa+I+SLK1,
end,
wrlt.(N+l.' Load.d i ',TXN) I
end,
outCB,81),OELAYJoutCA,tFF),
out(S.8) ,
end,
Proctdure POSITION;
b.gln
Hx21-mid(FILE,3,1);
hexnol=Hx2;HEXCON;TXN:=h;
.nd,
p!"oc.dure COPY;
begin
Iocreen( 11,4) I
wrlt.C'Fi1. ',FILE,' - Loading
');
Char3;-mldCFILE,3,l);
hexnol=Char3;HEXCON;TXNI=hl
IocreenCl,6);
wrlteln(' Block transfers from ba~e memo!"y i teaea');
wrlt.lnC' to output RAM page .. from iAa00 + offset ');
wrlhln('
in Incremtnt .. of ~18e bytes / block
')1
TRANSFER,
endl
proctdure REAOFAILj
b.gln
~cre.n(e, 14);
wrlt.('DISC ACCESS FAILED - NO FILE'),
PAUSE,CLS
.nd;
procedure SELFREQ;
l.b.l REENTER4,
<Select Mod.frequency )
begin
RE6NTER41 screen(2,14);
writeln;
wrlteC'Enter Modulation frequency (13,2,3.4) KHz');
scr •• n(35,e);read(FF);
I'f ord(FF) )t36 then goto REENTER4;
If ordCFF)-t31 then goto REENTER4;
if ordCFF)(t3e then FFz='4';
scr.en(l,e);
wrlt.('
Selected Modulation Frequency - ',FF,' kHz
.nd.
');
Proc.dure SEQUENCE;
beoln
KI-e.
CLS,scr •• n(I,16);
write('43 KHz: CA] 313 d.gr .... s.etor or [B] 60 degr.e')lscre.nC35,0)1
re.,dln(SF);
SELFREG,
REPEAT I
If SFa'A' th.n FRQa ,1se FRQb;
Loadmc(Bad,FILE)llf Bad then READFAIL .1se COPXi
<screen(lo,2);wrlteln(FILE,' - Loaded ');)
KI-K+l;
UNTIL K>l51
if SF-'A' then GET3e else GET68;
end,
III-ix
Proc.dur. DATAIN,
l_b,l REENTER21
b.gln
wrlt.('
Load Data 4rom DI$c [Y/N or Flil1
m~m
1');
scr •• n(28.0>,r.adln(p>,CLS,(MOOEI-'
')
IF P.'F' th.n SEQUENCE, (Fill m.mory with Block S.qu.nc •• )
b.gln
IF p.'y' th.n
b.gln
REENTER2.
bogln
wrlt.ln.
wrlt,('
Ent.r Fll.nam. )mc •••••• (')1
$cr •• n(2B,e);r.&dln(FILE)lwrlt.ln~FJLEI-(concat('mc',FILE»j
.nd,
(3rd char In fll.nam. - TXN no.)
Loadmc(Bad,FILE)I
Fqr-'
'. <Blank .s e.arlng Is unknown)
MODEI-FILE,(Olsplay Fil.n.m. Just load.d)
If Sad th.n READFAIL el •• COPYj
POSITIONl
Hx3,.'A'lh.xnol-Hx3JHEXCONlcz-16*hIAMSBr-c+TXNI
out(S,ie4)IDELAYIOUT(A,AMSB);OELAYI (R ••• t MSB to new fil,)
wrlt.ln,
wrlt.-C'
Load Mor. o.. t. from Disc
• • • • [Y/Nl ').
scr •• n(43,9>,readln(P>t
IF ?a'V' then goto REENTER2r
.ndr
.ndr
.nd,
Procldur. TXSEQUENCE;
b.gln
writ. C'
Number of Tran~lssion~ C255 max)
scrl.nC41,0)lr.adlnCTXNS)1
.ndl
[ ••• 1')1
Proc.dur. LOADPARAM;
b.gln
CLoadmcCBad,'PARAM')I
Cr.ad param.t.r file from disc and display)
.nd,
Proc.dur. ChPOSN,
b.gln
If leftCHODE,2)-'SE' then Psna=43j
If l.ftCMODE,2)-'RI' thin Psnl=39r
If l.ftCMODE,2)='ST' then Psna=41
.nd,
Proc.durl NEWPARAH;
lab.l REENTER61
blgin
CLSj
TITLEl
scr.en(O,4);
ChPOSNI
writ.C'
Rlppll/ Steerld / Ping Sector. [R/S/Pl');
screen(Psn,O),
r.ad(P)lwrit.ln,RIPSTEERj
wrlt.1nl
wrlt.('
S.I,ct Start Address
• • • • • • [Y/N1'),
scr •• n(43,0)r
r.adlnCP) ;
IF p.'y' then AODR
ELSE begin
outCB,.02)IDELAYloutCA,ALSB)IDELAYI
outCB,.e4),DELAYjoutCA,AMSB)JOELAYJend;wrlteln;
wrlt.C'
S.I.ct Modulation Blocks/Pulse.
[Y/N1'),
$crtoln(43,0),
r.adlnCP),
IF p='y' thin PASS
ELSE begin
outCB,.20),DELAYloutCA,reps),OELAY,endiwrlt.ln;
III -
X
S.lect Pulse RepeAt
scrttn(43,e).
wrltt(~
R~te
••••
[Y/N]'),
I
re~dln(P)1
IF P-~Y~ th.n PLENGTH
ELSE btoln
out<B ,~4e) ,OELAY,ou HA,pc) ,DELAY Jend,wr) hi n J
(
Seltct Numbtr of Tr&nsml5slons
scrttn(43,8),rt&dln(P),wrltelnl
IF p.'y' then TXSEQUENCE ELSE) b.gln
wrltt(~
[Y/Nl');
out(8f~Ae)IDELAY,out(A,TXNS)IOELAYJ.ndlwrlteln;
REENTER6,
PRESET,
end,
Procedure OosfetchlProcedure Of cAll, External tFeS;
aeOln Inlt mem[tFeel to tCD,e,tD8,l,t21,tI2,tF,j22,t21,tD,tCD,e,tOS,t1S,tOA,e,
efjC9,t5e,j41.j~3,j43,j4C,j44,t4F,j~3.DfcallJ.ndl
Beoin
C***** HAIN PROG~ *****)
Dosfttchl <Use In Mtroed code version only!)
<Oef~ult
P&r~tter.,
C I O/P Bd.S,lect-)
< I Start Addre.~)
( • Prescal. u/d -)
C Char Posltlon-)
C Modblock~x.-)
C I Pause length -)
(
I No. of Tx's
-)
C • St •• red Modt -)
( I Select Title -)
TITLE,
CARDSEL ,-'FFIHx3,-'C',Hx2Jc'F';Hx1.-'F',Hx0 •• 'F'.
ALSB.-.FFJAMSB.-tCF,
pr •• -t6B. SAMI.~00.
P5nl-39,CRIPPLE)
rep"
I-'e I,
pc
l-t28,pau"ea-10e,
TXNS
.-ItFF,
MODE
.-'Channel T.st ';
SFa-'S',
wrlhln,
wrlttln('
Channel Test Mode Data from tCee8-CFFF
wrlhln.wrlteln,
INITPORT,DATAIN, (Loads all e boards with precomputed data)
RESTART2.
TITLE,
(wrlteln('
Selected Par.meters ar •• '),
wrlte('
Ripple/Steer/Ping Sector
~')I dec'=pre, DECHEX, wrlte1nl
wrlte('
Start Address • • • • •
t'); decl=AMSB;DECHEXlwritelnj
decf-ALSBiDECHEX, writeln,
wrlte('
Modulation Blocks/Txn.
• .'), decl=rep~IDECHEXJ wrlteln,
write('
Period between Txn •
• .'), dec,.pc. DECHEX, wrlte1n,
wrlte('
Operational Mod • • • • • ' ,MODE,'
') I
wrlteln,)
PRESET, screen(l,ll),
wrlt.('
Art dlffertnt p&ram.ters required [Y/Nl ');
screen(43,e),readln(P).
IF P<>'Y~ then DEFAULT els. NEWPARAM,
(Select ALL RAM card5 )
out(B,tel),DELAY.out(A,tFF),OELAV.writeln.
scr.en(1 ,11> I
,) ;
write('
Ready to Transmit • • • • • • •
PAUSE,screen (37,0),
wrlteln('RUNNING').
out(B,tSe),out(B,tC0).
PAUSE,
out(B.~69)
,
5cre.n(1 ,11),
wr.t.ln('
FINISHED (at end of TX block) •••••••••• ');
wrlt.ln('
-=_.a_r==== ____ .-==~_"_••=====. ___-====')J
writ.ln, wrlte('
New· [Fl.l.
/
[Rlestart
/
[Qluit.'),
5cr.en(23,0) ;
readln(P), If P-'F' then CLS;
if P-'F' then DATAINJ
if P-'Q' then DOS elst goto RESTART2,
End.
III - xi
Program DISPLAYf,
( Authors A.O.Good~on
'1.02
1S13/S6)
( R.ad~ ... lected disk fl,.s and th.n displays
>
( .. t&rt and .nds of 16 chann.'s to check phas.s.)
( R.qulres H.Graf.4 Char Gen.Chlp & 16 line mod.>
( Use. m.mtjee0e to lli98ee]
)
v&r A,BsREALI
Bd,L,H,l,J,K.X.Z I INTEGER,
File
IStrlngtB11
S
.Strlng[2~~l,
SI
.Strlng[ll,
Eof,Bad,P'eas.d.'ay
IBool.&nl
RE
IReal I
1,S.ctorcount,Loop
IInt.g.rl
Proc.dure LoadmcCV&r BadIBool.anIFlle.Strlng(81)IExt.rnal lliC04BI
Procedure CLSICod. j3E,IIiC,IIiF7J
procedure PARAMI
begin
wr.t.('Ent.r Start Addr.ss .800e'),
scru'n(21 ,e) I
r.adln(H)llf ~e then HI-lliS8Bal
wrlt.C'Ent.r Incr.m.nt
j180 ')1
~cr •• n(21.B) I
r •• dlnO),lf I-a th'n I.cue81
.nd,
proc.dur. CHAR I
b.gln
1 •• 160-Z,
(160 to 145>
wrl hCchrCI» I
end.
procedure HII
b'gin
ZI-m.m[H+(CJ).lIilee)+K-l1 MOD 16,
.ndl
proc.dure LO,
begin
Z.=truncCmem[H+CCJ)*_100)+K-l)/16)
end,
procedure PLOT I
begin
Bdl-e,
CLS;
scr •• nCl,16) I
for JamB to 7 do begin
for La-! to 2 do begin
Bdl:;o:Bd+ll
scr •• nCl,0> I
for KI-l to 20 do
b'OI n
If oddCL) then La .lse HI J
CI'AR,
.ndl
scr •• nC21,9)lwrlt.CBdI2),scr •• nC24.9)1
(1/2 Block>
for KI-(197 to 127 do)
b.oln
(Full block>
23' to
2~3
do
If oddCL) th.n La .lse HI,
CI'AR,
.nd.
scr •• nCl ,Bd) I
.nd,
end,
III'ndl
III - xii
proc.dur. PAUSE.
b.gln
REPEAT UNTIL keybo.rd
.nd.
proctdurt TITLE,
b.gln
CLSI
5cr.en(I.16)lwrlt.('DISPLAY TX.PHASES from DISC - vI.e - ADGI5/5/SS');
scr •• n(.,I),writ.('·---~__~~__
- __-----. .__
~.m.""')1
tnd.
Btogl n
TITLE I
<***
MAIN PROGRAM
***>
HI-jS000JJI-j10e.
r.p •• t
scr •• n(12 t .e)lwrlte(' New Fllename If Fi 1•• '*' then CLS
.1 ...
begin
Loadmc(Bad t File)J
PLOT I
PAUSE I
.nd,
until Flle-'*'
End.
III - xiii