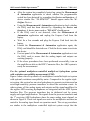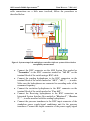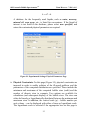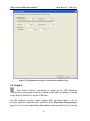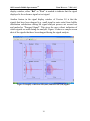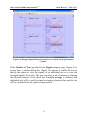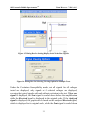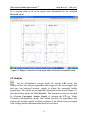
1
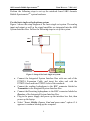
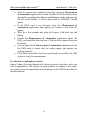
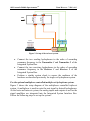
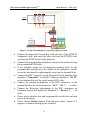
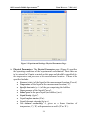
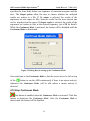
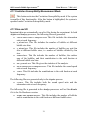
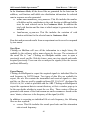
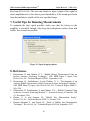
USER MANUAL 7.086-ABS-VER 6.01 ABS Acoustic Bubble Spectrometer®© User Manual X. Wu, C.-T. Hsiao, G. L. Chahine, Version 6.0 January 2011 DYNAFLOW, INC. 10621-J IRON BRIDGE ROAD JESSUP, MD 20794 U.S.A. Phone: (301) 604-3688 Fax: (301) 604-3689 E-mail: [email protected] http://www.dynaflow-inc.com ABS Acoustic Bubble Spectrometer®© USER MANUAL: 7-086 v. 6.0 Table of Contents Abstract...........................................................................................2 Intellectual Property and Software License Agreement ............3 1. Introduction................................................................................4 2. Technical Basis ...........................................................................5 2.1 THEORETICAL FOUNDATION ............................................................................................ 5 2.2 VALIDATION .................................................................................................................... 5 3. System Requirements and Setup ..............................................6 3.1 HARDWARE ...................................................................................................................... 6 3.2 SOFTWARE ....................................................................................................................... 6 3.3 SETUP AND CABLING FOR A DESKTOP BASED SYSTEM .................................................... 7 3.4 SETUP AND CABLING FOR A NOTEBOOK BASED SYSTEM ................................................. 8 4. Operating the ABS Acoustic Bubble Spectrometer®© ..........15 4.1 TOOL BAR ...................................................................................................................... 16 4.2 EXPERIMENT SETTINGS .................................................................................................. 16 4.3 ACQUIRE ........................................................................................................................ 28 4.4 VIEW SIGNALS ............................................................................................................... 29 4.5 ANALYZE ....................................................................................................................... 33 4.6 VIEW RESULTS ............................................................................................................... 34 4.8 REFERENCE SIGNALS ..................................................................................................... 37 4.9 CONTINUOUS MODE ....................................................................................................... 37 4.10 STOP CONTINUOUS MODE ............................................................................................ 38 4.11 CAVITATION SUSCEPTIBILITY MEASUREMENT MODE .................................................. 39 4.11 FILES AND I/O .............................................................................................................. 39 5. Example ABS Acoustic bubble Spectrometer®© Experiment41 6. Advanced Features...................................................................42 6.1 UTILIZING THE SIGNAL DROPPING OPTION .................................................................... 42 7. Useful Tips for Running Measurements................................43 8. References .................................................................................43 1 ABS Acoustic Bubble Spectrometer®© USER MANUAL: 7-086 v. 6.0 Abstract This manual provides a brief description of the ABS Acoustic Bubble Spectrometer© an acoustics based device that measures bubble size distributions and void fractions in liquids and measures cavitation susceptibility. It explains in detail the procedures for setting up and operating the system including support for a multiple-set hydrophone. A step-by-step operation example is also provided to help the user get started. ®© ABS Acoustic Bubble Spectrometer is a registered trademark of DYNAFLOW, INC. The ABS software is a Copyright © of DYNAFLOW, INC. 1995-2011. All rights reserved. DYNAFLOW, INC. may have patents and/or pending patent applications covering subject matter in this document. The furnishing of this document does not convey any license to these patents. Other brands or product names are trademarks (™) or registered trademarks (®) of their respective holders. No part of this document may be reproduced or transmitted in any form or by any means, electronic or mechanical, for any purpose, without the express written permission of DYNAFLOW, INC. 2 ABS Acoustic Bubble Spectrometer®© USER MANUAL: 7-086 v. 6.0 Intellectual Property and Software License Agreement This agreement governs your use of the ABS Acoustic Bubble Spectrometer®© product and any material enclosed with it, including any manuals, disks, hardware, PC cards, and computer programs. Grant of License. This agreement permits you to use one copy of the product, which is licensed as a single product. The software is “in use” on a computer when it is loaded into the temporary memory (i.e. RAM) or installed into the permanent memory (e.g., hard disk or other storage device) of that computer. Copyright and Restrictions. The software is owned by DYNAFLOW, INC. and is protected by United States copyright laws. The Hardware and its Driver and the Software are protected Copyright Laws, Patents, and Trade Secrets. You must treat the Software like any other copyrighted material, except that you may make one copy of the Software solely for backup archival purposes. You may not reverse engineer, decompile or disassemble the Software and Hardware, except to the extent applicable law expressly prohibits the foregoing restriction. DYNAFLOW, INC. may have patents and/or pending patent applications covering subject matters in this document. The furnishing of this document does not give you any license to these patents. DYNAFLOW, INC. grants you a non-exclusive license to use one copy of the ABS Acoustic Bubble Spectrometer®© Software program. Limited Warranty. For 30 thirty days from your date of purchase, DYNAFLOW, INC. warrants that the media on which the Software is distributed are free from defects in materials and workmanship. DYNAFLOW, INC. will, at its option, refund the amount you paid for the Software or repair or replace the Software provided that (a) the defective Software is returned to DYNAFLOW, INC. or an authorized dealer within 60 days from the date of purchase and (b) you have completed and returned the enclosed registration. Limitation of Liabilities. In no event will DYNAFLOW, INC. be liable for any indirect, special, incidental, economic or consequential damages arising out of the use or inability to use the ABS Acoustic Bubble Spectrometer®© Product. In no event will DYNAFLOW, INC.’s liability exceed the amount paid by you for the Product. Restricted Rights. No part of this document may be reproduced or transmitted in any form or by any means, electronic or mechanical, for any purpose, without the express written permission of DYNAFLOW, INC. Other brands or product names are trademarks or registered trademarks of their respective holders. 3 ABS Acoustic Bubble Spectrometer®© USER MANUAL: 7-086 v. 6.0 1. Introduction The ABS Acoustic Bubble Spectrometer®©, is an acoustics based device that measures bubble size distributions and void fractions in liquids. Compared to optical based devices, the ABS Acoustic Bubble Spectrometer®© is more affordable and easier to setup and use. The underlying acoustic technique is very sensitive to bubbles but practically insensitive to particulate matter unlike optical techniques that cannot readily distinguish between these. The ABS Acoustic Bubble Spectrometer®© can be used in a wide variety of two-phase flow applications where knowledge of the bubble size distribution and the volume fraction and/or area of contact between the gas and the liquid are important. These areas include oceanography, cavitation tunnels, controlled laboratory testing, industrial flows, and biomedical instrumentation. The instrument can provide the data in near real time, thus making it suitable for process or time varying applications. The initial efforts to develop the device were funded by National Science Foundation Small Business Innovation Research (SBIR) awards [1-2]. The device extracts the bubble population from acoustic measurements made at several frequencies. It consists of a pair of hydrophones or transducers connected to a signal generation / data acquisition system resident on a personal computer. A data board controls signal generation by the first hydrophone and signal reception by the second hydrophone. Short monochromatic bursts of sound at different frequencies are generated by the transmitting hydrophone and received by the second hydrophone after passage through the bubbly liquid. These signals are processed and analyzed utilizing specialized copyrighted software algorithms developed by DYNAFLOW, INC. to obtain the attenuation and phase velocities of the acoustic waves, and, from these, the bubble size distribution. All the measurements and analyses can be easily and rapidly conducted through a user-friendly Graphical User Interface (GUI). All physical, experimental, and analytical parameters can be modified by the user interactively. Both raw and processed experimental data from experiments can be saved for future use. The results are displayed graphically in real time on the screen and can also be exported or printed. 4 ABS Acoustic Bubble Spectrometer®© USER MANUAL: 7-086 v. 6.0 As an option, the standard ABS Acoustic Bubble Spectrometer®© can be upgraded and used to determine the liquid susceptibility to cavitation. In order to do so, a hydrophone projects acoustic power in the liquid with an increasing intensity. A sensitive transducer measures the resulting pressure field. The signals of this transducer are then analyzed and any high frequency emission from cavitation bubble is detected. Cavitation is “called” when a threshold of the rms of the emitted signals is crossed. 2. Technical Basis 2.1 Theoretical Foundation Bubble size distribution measurements using the ABS Acoustic Bubble Spectrometer®© are based on a dispersion relation for sound wave propagation through a bubbly liquid. A multiphase fluid model for sound propagation through bubbly liquids is combined with a model for the bubble oscillations, including various damping modes. The combined model relates the attenuation and phase velocity of a sound wave to the bubble population or size distribution. These relations produce two Fredholm integral equations of the first kind that are ill-posed and require special treatment for solution, particularly in the presence of noise. Novel algorithms developed by DYNAFLOW [1-3] are able to accurately solve these equations using a constrained optimization technique that imposes a number of physical constraints on the solution. This renders the equations well posed and the solution more accurate. A detailed presentation of the underlying physics and mathematics employed in the ABS Acoustic Bubble Spectrometer®© can be found in our JASA paper [3]. 2.2 Validation The complete procedure was initially tested on analytical data with varying amounts of artificial noise added. It was found that to successfully recover the bubble distribution, and to perform much better than previous solution techniques. The bubble distributions obtained from the ABS Acoustic Bubble Spectrometer®© were then validated by comparison with microphotography. Bubble populations were generated using electrolysis and air injection 5 ABS Acoustic Bubble Spectrometer®© USER MANUAL: 7-086 v. 6.0 through porous tubes. The bubble population obtained using the ABS Acoustic Bubble Spectrometer®© compared favorably with the results of microphotography. Details can be found in [1-8]. 3. System Requirements and Setup 3.1 Hardware The ABS Acoustic Bubble Spectrometer®© system can operate on a PC that has Windows XP/Vista/7 installed. For a desktop based system, one spare PCI slot is required. For a notebook based system, one spare PCMCIA slot (CardBus or ExpressCard type) is needed. Sufficient hard disk space is required to store the data acquired, which depends upon the parameters set by the user. The basic system also utilizes two hydrophones – one for transmission and one for reception of acoustic wave bursts. Different sets of hydrophones can be employed with the ABS Acoustic Bubble Spectrometer®© as long as they have suitable performance characteristics over the frequency and distance ranges of the application and their characteristics are known and specified to the system. For an ABS Acoustic Bubble Spectrometer®© system with optional multiple-set hydrophone support, multiple pairs of hydrophones with different resonance frequencies can be connected to the system at the same time to enhance the performance through coverage of a larger frequency band and to expand the available measurement range. For the upgraded system with the capability to measure cavitation susceptibility, a low frequency emitting hydrophone and a high sensitivity receiving transducer for cavitation detection are also provided 3.2 Software The ABS Acoustic Bubble Spectrometer®© software runs on a Windows XP/Vista/7 operating system or above. It enables the user to conduct the measurements and analyses through a user-friendly Graphical User Interface (GUI) from which the user can easily input the control and operating 6 ABS Acoustic Bubble Spectrometer®© USER MANUAL: 7-086 v. 6.0 parameters for the experiment, specify analysis options, and view analysis results. The detailed steps required for control of the various boards, data acquisition, signal analysis, inverse problem solution, and data output are thus transparent to the user. The various options and tasks are accessed through a series of menus and dialog boxes. 3.3 Setup and Cabling for a Desktop Based System The following hardware is provided as part of a desktop based ABS Acoustic Bubble Spectrometer®© system: Signal Generation / Data Acquisition Board (Installed in desktop computer or interface box) External ABS Interface Box with integrated amplifier. BNC Cables Optional programmable multiplexer switch with accompanied USB cable and terminal block Perform the following steps to set up the desktop based ABS Acoustic Bubble Spectrometer®© Generation II system hardware: For the basic single-set hydrophone system: Connect the External ABS Interface Box with the attached Signal Generation / Data Acquisition Board using the 68 Pin Shielded Cable. Connect the sending hydrophone to the BNC connection on the ABS Interface Box marked as “Transmitter”. Connect the Receiving hydrophone to the BNC connector on the Connector Box marked as “Receiver”. Turn on the computer. Turn on the amplifier switch on the ABS Interface Box. For the optional multiple-set system: Connect the External ABS Interface Box with the attached Signal Generation / Data Acquisition Board using the 68 Pin Shielded Cable. 7 ABS Acoustic Bubble Spectrometer®© . Note: USER MANUAL: 7-086 v. 6.0 Connect the programmable multiplexer switch to the computer using the accompanied USB cable If not attached, attach the accompanying terminal block to the programmable multiplexer switch. Secure the attachment by tightening the screws on the terminal block. Connect the BNC connector on the ABS Interface Box marked as “Transmitter” to the BNC connector marked as “AO IN” on the terminal block of the switch using a BNC cable. Connect the sending hydrophones to the BNC connects on the terminal block of the switch marked as “AO 1”, “AO 2”, …, in order. Connect the Receiving hydrophones to the BNC connector on the Connector Box marked as “Receiver 1”, “Receiver 2”, …, in order. Power up the programmable multiplexer switch first and then turn on the computer Turn on the amplifier switch on the BNC Connector Box Make sure the amplifier is turned on and that it has a fresh battery. (When not in use, it should be turned off. Otherwise, the battery will drain.) Also make sure the 68 pin cable connection with the Signal Generation / Data Acquisition Board is good and pushed in all the way. 3.4 Setup and Cabling for a Notebook Based System The following hardware is provided as part of a notebook based ABS Acoustic Bubble Spectrometer®© system: Integrated ABS Acoustic Bubble Spectrometer®© System Interface Box PCMCIA Expansion Cable with host card (CardBus or ExpressCard type) BNC Cables Optional programmable Multiplexer Switch 8 ABS Acoustic Bubble Spectrometer®© USER MANUAL: 7-086 v. 6.0 Perform the following steps to set up the notebook based ABS Acoustic Bubble Spectrometer®© system hardware: Flow 250 kHz Hydrophone For the basic single-set hydrophone system: Figure 1 shows the setup diagram of the basic single set system. The analog input and output as well as the signal amplifier are integrated into the ABS System Interface Box. Follow the following steps to set up the system: Laptop Signal Amplifier Analog output Analog input Figure 1. Setup of the basic single-set system. Connect the Integrated System Interface Box with one end of the PCMCIA Expansion Cable, and insert the other end with the PCMCIA host card into PCMCIA slot of the notebook. Connect the sending hydrophone to the BNC connector labeled as Transmitter in the Integrated System Interface Box. Connect the Receiving hydrophone to the BNC connector labeled as Receiver of the Integrated System Interface Box. Plug in the power supply and power up the interface box first, then power up the laptop. Select “Insert Mobility Express Card and press enter” option if it appears to continue booting up the computer. 9 ABS Acoustic Bubble Spectrometer®© USER MANUAL: 7-086 v. 6.0 After the system has completely booted up, using the Measurement & Automation application to check whether the DAQ card has been detected by expanding the Devices and Interfaces on the task panel on the left of the window. A device name such as “PCI-6115” should appear. If the DAQ card is not detected, close the Measurement & Automation application and unplug the Express Card from the laptop. Wait for a few seconds and plug the Express Card back into the laptop. Launch the Measurement & Automation application again, the DAQ card should be detected now. Click the device name to activate the device. Use test panel of the Measurement & Automation application to test the DAQ card to ensure that the analog inputs and outputs are working properly. If the above procedures have been performed successfully, the ABS system is ready for measurement. For the twin-set hydrophone system: Figure 2 shows the setup diagram of a twin-set system. It can drive up to two sets of hydrophones. The system set-up procedures are similar to the singleset system except for connecting the hydrophones to the ABS System Box as described below: 10 Flow USER MANUAL: 7-086 v. 6.0 250 kHz Hydrophone 50 kHz Hydrophone ABS Acoustic Bubble Spectrometer®© Laptop Signal Amplifier Analog output Analog input Figure 2. Set up of the twin-set system. Connect the two sending hydrophones in the order of ascending resonance frequency to the Transmitter 1 and Transmitter 2 of the Integrated System Box. Connect the two receiving hydrophones in the order of ascending resonance frequency to the Receiver 1 and Receiver 2 of the Integrated System Box. Perform a similar system check to ensure the readiness of the hardware as described previously for single-set hydrophone system. For the optional multiplexer-controlled multiple-set hydrophone system: Figure 3 shows the setup diagram of the multiplexer controlled triple-set system. A multiplexer is used to route the sent signal to desired hydrophones. As the basic and twin-set system, the analog inputs and outputs as well as the signal amplifiers are integrated into the Integrated System Interface Box. Follow the following steps to set up the system: 11 USER MANUAL: 7-086 v. 6.0 250 kHz Hyd rophone Flow 150 kHz Hydrop hone 50 kHz Hydrop hone ABS Acoustic Bubble Spectrometer®© Multiplexer Power Signal Amplifier Amplifier Laptop Analog output Analog input Figure 3. Set up of the multiplexer controlled triple-set system. Connect the Integrated System Box with one end of the PCMCIA Expansion Cable, and insert the other end with the PCMCIA host card into the PCMCIA slot of the notebook. Connect the programmable multiplexer switch to the notebook using the accompanied USB cable. If not attached, attach the accompanying terminal block for the programmable multiplexer to the chassis of the multiplexer switch, secure the attachment by tightening the screws on the terminal block. Connect the BNC connector on the Integrated System Interface Box marked as “Transmitter” to the BNC connector marked as “AO IN” on the terminal block of the switch using a BNC cable. Connect the sending hydrophones to the BNC connectors on the terminal block of the switch marked as “AO 1”, “AO 2”, …, in order. Connect the Receiving hydrophones to the BNC connectors on Integrated System Box marked as “Receiver 1”, “Receiver 2”, …, in order. Power up the interface box and programmable switch first and then power up the laptop. Select “Insert Mobility Express Card and press enter” option if it appears to continue booting up the computer. 12 ABS Acoustic Bubble Spectrometer®© USER MANUAL: 7-086 v. 6.0 After the system has completely booted up, using the Measurement & Automation application to check whether the programmable switch has been detected by expanding the Devices and Interfaces. A device similar like “NI SCXI-1127” should appear under the NIDAQmx Devices Using the Measurement & Automation application to check whether the DAQ card has been detected by expanding the Devices and Interfaces. A device name such as “PCI-6115” should appear. If the DAQ card is not detected, close the Measurement & Automation application and unplug the Express Card from the laptop. Wait for a few seconds and plug the Express Card back into the laptop. Launch the Measurement & Automation application again, the DAQ card should be detected now. Click the device name to activate the device. Use test panel of the Measurement & Automation application to test the DAQ card to ensure that the analog inputs and outputs are working properly. If the above procedures have been performed successfully, turn on the amplifier switch on the BNC Connector Box, the ABS system is ready for measurement. For the optional multiplexer-controlled multiple-set hydrophone system with cavitation susceptibility measurement (CSM): Figure 4 shows the set-up sketch of a multiplexer controlled triple-set system with optional cavitation susceptibility meter. Compared to the regular tripleset system, this system has an extra hydrophone to generate cavitation and an extra high-sensitivity pressure transducer to detect the cavitation events. As other systems, all the analog inputs and outputs and the signal amplifiers for the regular ABS receiving hydrophones are integrated into the ABS System Interface Box. The pressure transducer has its dedicated unit for power supply and signal amplification. The signals from the pressure transducer and the 1st receiving ABS hydrophone share the same analog input channel, as shown in Figure 4. These two signals are sent to the multiplexer and then are routed to the analog input based on operation mode. The set-up procedures are similar to the multiplexer controlled triple-set system except that the 13 ABS Acoustic Bubble Spectrometer®© USER MANUAL: 7-086 v. 6.0 Pressure transducer 50 kHz Hydrophone Flow 150 kHz Hydrophone 250 kHz Hydrophone cable connections are a little more involved, follow the procedures as described below: Signal Am plifier Cav. Hydro. Power Amplifier Multiplexer Laptop Signal Amplifier Analog output Analog input Figure 4. System setup of the multiplexer controller triple-set system with cavitation susceptibility measurement. Connect the BNC connector on the ABS System Box marked as “Transmitter” to the BNC connector marked as “AO IN” on the terminal block of the switch using a BNC cable. Connect the sending hydrophones to the BNC connectors on the terminal block of the switch marked as “AO 1”, “AO 2”, …, in order. Make sure the hydrophones are connected in ascending order of the resonance frequency Connect the cavitation hydrophones to the BNC connector on the terminal block of the switch marked as “Cav. AO”, Connect the Receiving hydrophones to the BNC connectors on Integrated System Interface Box marked as “Receiver 1”, “Receiver 2”, …, in order matched with the sending hydrophones. Connect the pressure transducer to the BNC input connector of the standalone power supply/signal conditioner unit for the pressure transducer. Connect the output connector of the power supply/signal 14 ABS Acoustic Bubble Spectrometer®© USER MANUAL: 7-086 v. 6.0 conditioner unit and the BNC connector on the terminal block marked as “Rec. 2”, Connect the BNC connector marked as “To Multiplexer” on the Integrated System Interface Box to the BNC connector marked as “Rcv. 1” on the terminal block Connect the BNC connector marked as “AI” on the terminal block to the BNC connector marked as “From Multiplexer” on the Integrated System Interface Box. Perform similar system check to ensure the readiness of the hardware as described previously for triple-set hydrophone system. Notes : a. Insert the PCMCIA host card into the notebook computer, plug in the 12 V power supply to the ABS System Interface Box, and turn on the power to the multiplexer. b. Before turning on the laptop computer, make sure that the green LED lights on the chassis of the multiplexer and the ABS System Box are on. c. If the ABS application fails to acquire data properly, close the ABS application and use the Measurement & Automation application to ensure that the DAQ card can be detected. Also use the test panel to test the DAQ card to ensure that the analog inputs and outputs are working properly. d. Make sure the amplifier is turned on and that it has a fresh battery. (When not in use, it should be turned off. Otherwise, the battery will drain.) Replace battery if the “low Battery” LED light is on. e. Also make sure the expansion cable connection is good on both ends and pushed all the way in. 4. Operating the ABS Acoustic Bubble Spectrometer®© Double clicking the ABS icon starts the ABS Acoustic Bubble Spectrometer®© Generation II software. This invokes the Graphical User Interface. It includes the menu, the tool bar and a plotting area. The contents displayed in the plotting area depend on the operation performed; they can be the transmitted and received signals (either reference signals or those from an actual measurement) or the analysis results. 15 ABS Acoustic Bubble Spectrometer®© USER MANUAL: 7-086 v. 6.0 4.1 Tool Bar The tool bar is located just under the main frame menu at the top of the window. It contains several shortcut buttons that are used to invoke different functions. These shortcut buttons are listed here and described in detail below. Print Preview Experiment Settings Reference Signals Acquire Analyze View Signals View Results Start Continuous Mode Stop Continuous Mode Cavitation susceptibility measurement Mode 4.2 Experiment Settings This button invokes the Experiment Settings property sheet that enables the user to input the various environmental and operating conditions for the experiment. The property sheet can also be invoked from the menu by 16 ABS Acoustic Bubble Spectrometer®© USER MANUAL: 7-086 v. 6.0 clicking Experiment / Settings or by pressing the F7 key. There are four separate property pages as described below. Screenshots of each page are shown in Figure 7 through Figure 12. General: This page has entries for title, date, time, user’s name, and comments on the experiment (Figure 7). Figure 5. Experimental Settings: General Information Page. 17 ABS Acoustic Bubble Spectrometer®© USER MANUAL: 7-086 v. 6.0 Figure 6. Experimental Settings: Signals Page. Signals: The signals property page is shown in Figure 8. The user can specify the number of periods and the nominal peak signal amplitudes (in volts; maximum signal amplitude is 10 volts) of the sent signals for test and reference signals respectively, enter the distance between the two hydrophones in the experiment, and build a table that lists signal properties. Note: The “burst” duration for each transmitted signal is then equal to the ratio of the number of periods to the signal frequency. 18 ABS Acoustic Bubble Spectrometer®© USER MANUAL: 7-086 v. 6.0 HARDWARE INFORMATION: The DAQ card information and its maximum sampling rate is automatically detected and used by the system. Information such as PCI 6115 DAQ card used, sampling rate up to 10 MS/s will be displayed, the system will automatically determine the sampling rate to use based on the signal characteristics under consideration. DATA ACQUISITION DURATION EXTENSION FACTOR: The default time duration for data acquisition is set to be four times the time of flight between hydrophones in the liquid. This equals the hydrophone distance divided by the sound speed in pure liquid, plus the duration of emission. This default setting is good in normal cases. If this default duration is not optimal for the particular experiment, e.g. the duration is too short to obtain the complete response signal; the user can adjust the time duration by changing the value of N of the user input in Extend data acquisition time by N times of default setting, which sets the duration for acquisition to be a multiple of the default acquisition time by the specified factor. 19 ABS Acoustic Bubble Spectrometer®© USER MANUAL: 7-086 v. 6.0 Figure 7. Experimental Settings: General Information Page. Figure 8. Experimental Settings: Signals Page. ENABLE SIGNAL SETTINGS AUTO CALIBRATION: Since the gain and voltage settings can be different for each frequency as well as for test and reference signal. It is tedious to manually set up the gain and voltage setting manually. The user can check Enable Signal Settings Auto Calibration to let the system figure out the best gain and voltage settings for each frequency in both test and reference condition. After checking this option, when acquiring reference signal, the system will continuously adjust the gain and voltage settings until optimal settings have been found for all frequencies, then the real reference signals will be acquired at the 20 ABS Acoustic Bubble Spectrometer®© USER MANUAL: 7-086 v. 6.0 settings optimized. When measuring the first time under the test conditions, the system will similarly adjust the gain and voltage settings until optimal settings have been found for all frequencies, then the real test signals will be acquired at the settings optimized. After the calibration for the test signal is finished, the check before Enable Signal Settings Auto Calibration will be automatically unchecked by the system, and all the subsequent tests will be conducted using the setting found in the calibration process until the user checks the selection again to reconduct the calibration process. The user can examine the optimized settings from the table. Ref Gain and Test Gain are the gain settings for the reference and test signals respectively. V Factor and Ref V Factor are the voltage factor settings for the reference and test signals respectively. The actual sent signal voltage is the product of the voltage factor and the specified nominal sent signal amplitude. FREQ (HZ): This table includes the list of selected insonification frequencies and the corresponding gains to be applied to the transmitted and received signals at each frequency. The frequency list should be arranged in ascending order. These should be set based on the hydrophone characteristics to attain sufficient resolution for the particular configuration without saturating the received signal. Trial and error may be required. The table also includes a column labeled as Ignore Signal which enables removal of any signal that is erroneous such that it will not be taken into consideration in the analysis for the bubble populations. The software automatically removes any signals that give unreasonable sound speeds or bad signal to noise ratio and sets their values of Ignore Signal to Yes. Users can also manually ignore any signal that they believe is problematic by setting the value of Ignore Signal to Yes at the corresponding frequency. AUTOMATIC FREQUENCY SETUP: To manually set up a long frequency list can be time consuming. To speed up the process, the GUI can arrange the frequency automatically. What the user needs to do is to specify the Min. Freq. (minimum frequency), the Max. Freq. (maximum frequency), and the Number of Freq. (number of frequencies), and choose how to generate the frequency list. Please notice that when the user changes the Min. Freq. and the Max. Freq. the corresponding bubble sizes will be automatically calculated and displayed as a guideline about the optimal 21 ABS Acoustic Bubble Spectrometer®© USER MANUAL: 7-086 v. 6.0 bubble size measurement ranges. Two options are available, one is to linearly arrange the frequency list with equal frequency interval (choose Linear frequency list), the other one is base on equal bubble size interval, which corresponding to the equal 1/f interval (choose Equal 1/f frequency list). If the equal 1/f interval is selected, the user can also specify when to start the equal 1/f interval arrangement. Between the minimum frequency and this frequency, equal frequency interval of 1000 Hz will be used. TRIPLE-SET HYDROPHONE OPTIONS: If it is a multiple-set hydrophone system, the user can use this option to control how to distribute the frequency list among the different sets of hydrophones. The order of the hydrophone arrangement is in ascending frequency order, e.g, for tripleset hydrophone system, the 1st set is for lower range of frequencies, the 2nd set is for the middle range of frequencies, and the 3rd set is for the higher range frequencies. What the user needs to do is to specify two cutof frequencies, the first frequency is specified after the text (Use 1st set of hydrophones for the) frequencies up to, frequencies below this one are handled by the 1st hydrophone set. The second frequency is specified after the text (Use 2nd set of hydrophones for) frequencies up to. Frequencies above this one are handled by the 3rd set of hydrophones. The system will route automatically a given frequency signal to the corresponding hydrophone according to the specification. Please make sure the order of the hydrophone connections matches among the receiving and transmitting hydrophones. HYDROPHONE RESPONSE CHARACTERISTICS: When a system is delivered, the resonance frequency and response time (as specified in dT Correction) of the hydrophones are given. They are used for analysis for improved accuracy. AUTOMATIC FREQUENCY DISTRIBUTION AMONG HYDROPHONES: Except for the basic single set ABS system, the user needs to specify the frequency range for each set of hydrophones. Since the hydrophone performance might change at different conditions, an automatic frequency distribution scheme has been implemented to remove the user guess work in specifying the frequency range for each hydrophone. To do so, the user needs to check the check box of Automatically distribute the frequency among the hydrophones. Close the signal setup page, and 22 ABS Acoustic Bubble Spectrometer®© USER MANUAL: 7-086 v. 6.0 click Acquire to start the acquisition of the auto frequency distribution process, which examines the frequency response characteristics of each hydrophone set and then assign the optimal frequency range to each set of hydrophones. (This option is presently not active) AMPLIFICATION RATIO: The system can be coupled with an external amplifier, however usually the amplifier is needed only during the actual tests and not in the reference condition. If this is the case, the user needs to specify the power amplification ratio after the text Test/Ref ratio of power amplification of sent signal, such that the difference will be taking account for in analysis. GENERATE REFERENCE DATA: Also on this page is a check box Generate Reference Data which is used to indicate whether the experiment is to be conducted as a reference with a pure liquid (with no bubbles). The pure liquid in the same experimental configuration provides a background reference state and is used in calculating the bubble size distribution in the liquid “with bubbles”. This reference data set is obtained by conducting an experiment where bubbles have been removed as much as possible from the liquid under conditions and settings otherwise identical to those to be employed in determining the desired bubble size distribution. Check the box to generate this reference data set. The reference data set can be saved to disk for later use or stored in memory. This procedure is recommended because it frees the user from errors associated with calibration of the hydrophones in the specific configuration of the experimental setup. NUMBER OF TESTS: The user can specify the number of test runs, n, desired to obtain the averaged results by entering a number between 1 and 20 in the Number of Tests box. Sets of signals are generated and acquired as many times as specified. The average of these signals is used to obtain the bubble distribution for n > 1. In this case, the signals of the last run are displayed (see 4.4 View Signals below). The sound speed ratio and attenuation vs. frequency displayed are the average values (see 4.6 View Results below). It should be noted that this option does not work with the external trigger mode (section 4.7). 23 ABS Acoustic Bubble Spectrometer®© USER MANUAL: 7-086 v. 6.0 Figure 9. Experimental Settings: Physical Parameters Page. Physical Parameters: The Physical Parameters page (Figure 9) specifies the operating conditions of the experimental environment. These data are to be entered in SI units as noted on this page and should be specified for the temperature and pressure at the measurement location. Values to be specified include: Pressure (static) of the liquid at the measurement location (Pascal) Temperature of the liquid at the measurement location (°C) Specific heat ratio (cp/cv) of the gas comprising the bubbles Vapor pressure of the liquid (Pascal) Sound speed in the pure liquid (no bubbles) (m/s) Liquid density (kg/m3) Liquid surface tension (N/m) Liquid dynamic viscosity (kg/m-s) Gas thermal conductivity, k, given as a linear function of temperature, T, (K) with parameters a and b (W/m-K ): 24 ABS Acoustic Bubble Spectrometer®© USER MANUAL: 7-086 v. 6.0 k aT b. A database for the frequently used liquids, such as water, mercury, mineral oil, corn syrup, etc., is listed for convenience. If the liquid of interest is not listed in the database, please select user specified, and enters the customized physical parameters as required. Figure 10. Experimental Settings: Physical Parameters Page. Physical Constraints: On this page (Figure 10), physical constraints are imposed in order to enable solution of the ill-posed problem, and the parameters of the computed distribution are specified. These include the minimum and maximum of the computed bubble sizes (radii) and the number of discrete sizes to compute. Two options are available for calculation (and subsequent display) of the bubble sizes. The sizes can either be linearly or logarithmically distributed between the minimum and maximum sizes. In addition, the vertical scale (y) – bubble number per unit volume – can be displayed with either a linear or logarithmic scale. The logarithmic scale is selected if the appropriate box on this page is 25 ABS Acoustic Bubble Spectrometer®© USER MANUAL: 7-086 v. 6.0 checked. Upper bounds on both the total bubble surface area and the total bubble volume per unit volume (m3) of the measurement region are also specified here. These are utilized as constraints in solving the inverse problem and need only be very approximate. They are usually set to large positive values. Figure 11. Experimental Settings: Physical Constraints Page. Cavitation Susceptibility: This page (Figure 12) provides information for the system with the optional Cavitation Susceptibility Meter to measure the cavitation susceptibility. AMPLIFICATION OF POWER AMPLIFIER: specifies the amplification of the power amplifier that drives the cavitation hydrophone. Please make sure that the actual amplification factor you set on the amplifier matches with the value specified. To do so, use constant input signal amplitude and adjust the amplification of the amplifier until the ratio of the output signal to the input signal of the amplifier reaches the 26 ABS Acoustic Bubble Spectrometer®© USER MANUAL: 7-086 v. 6.0 amplification value you require and enter the same in the ABS Cavitation Susceptibility Page. MAXIMUM SIGNAL VOLTAGE: gives the maximum signal voltage that will be applied to the cavitation hydrophone, it should not exceed the maximum output voltage of the power amplifier, for the Krohn-Hite wide band power amplifier, the maximum output voltage is 160 v (RMS). SENT SIGNAL FREQUENCY: specifies the signal frequency used to test the cavitation susceptibility, which usually is around 50 – 70 kHz and corresponds to the best response frequency range of the hydrophone provided for cavitation susceptibility measurement. SIGNAL CYCLES TO BE ACQUIRED: specifies the number of cycles to be acquired during the data acquisition process, it should be long enough to enable the detection of the cavitation events if the cavitation phenomenon exists. For the signal analysis, the low frequency signals should be removed from the received signal: RANGE OF BLOCKED FREQUENCY: specifies the range of frequency to be filtered out during the signal analysis. This purpose of this filtering process is to remove background and excitation noise and keep only high frequency signals of cavitation events. 27 ABS Acoustic Bubble Spectrometer®© USER MANUAL: 7-086 v. 6.0 Figure 12. Experimental Settings: Cavitation Susceptibility Page. 4.3 Acquire This button initiates acquisition of signal in the ABS hardware version and re-processing of the raw signals in the ABS no-hardware version if the data file loaded is a regular ABS data. For the hardware version, under regular ABS operation mode, a set of acoustic signals of characteristics specified in the Experiment Settings/Signals page are sent by the transmitting hydrophone and acquired by the receiving 28 ABS Acoustic Bubble Spectrometer®© USER MANUAL: 7-086 v. 6.0 hydrophone. In order to improve the signal analysis a rectangular wave with the same duration as that of the matching sine wave is also added. The Acquire function can also be invoked from the menu by clicking Experiment/ Acquiring Signals or by pressing the F8 key. The screen is automatically refreshed after the data acquisition is completed and processed. The raw or analyzed “sent” and “received” signals are displayed (Figure 13) based on the user selection if set in View Signals mode originally. The analysis results are displayed (Figure 18) if the View Results mode is originally set. For the hardware version operating under the cavitation susceptibility measurement mode, a set of acoustic signals of characteristics determined in the Experiment Settings/Cavitation Susceptibility page are sent by the transmitting hydrophone and acquired by the high sensitivity pressure transducer. Similar as the regular ABS mode, the raw or analyzed “sent” and “received” signals are displayed (Figure 17) based on the user selection if set in View Signals mode originally. The analysis results are displayed (Figure 21) if the View Results mode is set originally. 4.4 View Signals This button activates the View Signals mode to show the raw or analyzed “sent” and “received” signals most recently acquired (Figure 13). When clicked on while the Ctr key is pressured, a dialog box appears (Figure 15) to let the user specify the scale or magnification factors to be applied to the vertical axes of the signals for display. This enables zooming in on signal details that may be too small to see well with normal magnification. Another way to view the sent/received signals or reference signals is by selecting the Test Signals or Reference Signals under either Original Signals or Analyzed Signals type on the View pull down menu. If it is the Original Signals type, the acquired raw signal is displayed. If it is the Analyzed Signals type, the processed signals will be displayed. The following descriptions apply to regular ABS mode. As shown in Figure 13, the corresponding responses to sinusoidal and rectangular wave are displayed side by side. The duration of the rectangular wave is also output on top of the signal. Also on the upper left corner of the 29 ABS Acoustic Bubble Spectrometer®© USER MANUAL: 7-086 v. 6.0 display window, either “Ref” or “Test” is marked to indicate that the signal displayed is the reference signal or test signal. Another feature in the signal display window of Version 5.0 is that the signals that have been dropped (e.g. small signal to noise ratio) from bubble distribution calculations during the signal analysis process are crossed out and marked as “Dropped Signal”. This gives the user a direct indication of which signals are used during the analysis. Figure 14 shows a sample screen shot of the signals that have been dropped during the signal analysis. Figure 13. Display of the Raw Sent (blue) and Received (red) Signals. 30 ABS Acoustic Bubble Spectrometer®© USER MANUAL: 7-086 v. 6.0 Figure 14. Dropped signals during the analysis are crossed out in signal display window. If the Number of Tests specified in the Signals property page (Figure 9) is greater than 1, another dialog box (Figure 16) appears to enable the user to specify the option to view the signals of an individual test or to view the averaged signals of the tests. The user can select a test of interest by clicking the selection buttons. If the check box Used for average is checked, that individual test will be used for signal averaging otherwise that specific test will be excluded from the signal average process. 31 ABS Acoustic Bubble Spectrometer®© USER MANUAL: 7-086 v. 6.0 Figure 15. Dialog Box for Setting Display Scale of the Raw Signals. Figure 16. Dialog Box for Selecting Viewing Option for Multiple Tests. Under the Cavitation Susceptibility mode, not all signals for all voltages tested are displayed, only signals at 4 selected voltages are displayed, covering the typical signals with and without cavitation in the test. When raw signal is displayed, the Sent signal is scaled down before the amplification while the Received signal is displayed in the original scale. If the Analyzed signal is displayed, the graph scale is based on the analyzed Received signal, which is displayed in its original scale, while the Sent signal is scaled down 32 ABS Acoustic Bubble Spectrometer®© USER MANUAL: 7-086 v. 6.0 by a varying scale to fit in the graph scale determined by the analyzed Received signal. Figure 17. Display of sent and received signals under Cavitation Susceptibility mode. 4.5 Analyze For the No-hardware version, under the regular ABS mode, this button invokes the analysis algorithms that reprocess the saved signal data and uses the analyzed acoustic signals to obtain the measured bubble populations. The results are automatically displayed on the screen (Figure 18, described below under 4.6 View Results). This function can also be invoked by selecting Experiment /Analyze Signals or pressing the F9 key. Under Cavitation Susceptibility mode, this button invokes the algorithms that process the acoustic signals to obtain variation of the filtered received signal with voltage and the determined threshold of cavitation. 33 ABS Acoustic Bubble Spectrometer®© USER MANUAL: 7-086 v. 6.0 4.6 View Results This button activates the View Results mode to display the analysis results of the experiment (Figure 18). It is automatically enabled after clicking the Analyze Results button or can be activated by clicking the View button at any time. In the No-hardware version, both Analyze and View Results buttons will display the analyzed resulst, howerver, button will not re-analyze the saved signals and uses only the saved u and v information to obtained the measured bubble populations. View Results Figure 18. Display of the Analyzed Results. The following descriptions applied to the regular ABS mode: Four plots are displayed in this mode: Sound speed ratio (u =c/cref) vs. frequency. Attenuation ratio (v) vs. frequency. 34 ABS Acoustic Bubble Spectrometer®© USER MANUAL: 7-086 v. 6.0 Bubble size distribution in the form of the number of bubbles per cubic centimeter vs. bubble radius in microns. Void fraction contribution in the form of the void fraction contribution vs. bubble radius in microns. The total void fraction of all bubbles are also displayed above the graph, it is simply the total measured void fraction in the range of bubble size detected. Note: The number of bubbles per cubic centimeter is plotted on the vertical axis of the bubble size distribution. To obtain the number of bubbles within the measuring volume, this must be multiplied by the size of the measuring volume in cubic centimeters. After the View Results button is clicked while the Ctrl key is pressed down, a dialog box (Figure 19) appears to enable the user to select the display option for viewing the analyzed results. If the Use Previous/Default Display Settings button is clicked, the default ranges or the ranges used in the previous display are used for displaying the analyzed results. If the Specify Results Display Settings button is clicked, a new dialog window (Figure 20) appears to let the user specify the desired ranges for sound speed ratio, attenuation ratio, and bubble size distribution. In addition, the user can also select to display the attenuation ratio in either power spectrum or RMS form. The user can also show the analysis results of the experiment by clicking on Analyzed Results in the menu item View. Figure 19. Dialog Box for Selecting Display Option of the Analyzed Results. 35 ABS Acoustic Bubble Spectrometer®© USER MANUAL: 7-086 v. 6.0 Figure 20. Dialog Box for Specifying Display Range of the Analyzed Results. In the Cavitation Susceptibility mode, only one graph (Figure 21) is displayed: Filtered Received Signal Amplitude vs. Applied Voltage. Two vertical lines indicating the determined threshold voltage for cavitation susceptibility are also displayed. The blue line is based on the minimum threshold and the green line is based on the threshold of maximum slope. 36 ABS Acoustic Bubble Spectrometer®© USER MANUAL: 7-086 v. 6.0 Figure 21. Display of cavitation susceptibility results. 4.8 Reference Signals After this button is highlighted, the signals acquired by clicking on the Acquire button are designated as reference signals (see Generate Reference Data in 4.2). This button is automatically released after the acquisition is finished. Also note that this button has to be clicked to release the Cavitation Susceptibility mode if it is activated. 4.9 Continuous Mode In some cases it may be desirable to monitor the bubble characteristics continuously. Click this button to activate the Continuous Mode which runs the ABS continuously. Before activating the Continuous Mode the user needs to make sure that the reference data are available. A dialog window (Figure 22) appears after the button is clicked to allow the user to set up the Continuous Mode. The Time delay between sequences 37 ABS Acoustic Bubble Spectrometer®© USER MANUAL: 7-086 v. 6.0 specifies the time delay before one sequence of emission/reception and the next. The Output options allow the user to choose whether the analyzed results are written to a file. If No output is selected, the results of the sequences are not output to files, however results for the most current one can be displayed on the screen. If Output results is selected, the results of the sequences are written to files at the desired frequency (see 4.10 for detail). While the Continuous Mode is activated, the button will be disabled until the Continuous Mode is deactivated. Figure 22. Dialog Box for setting up the Continuous Mode. One restriction to the Continuous Mode is that the cursor has to be left on top of the button to run the ABS continuously if there is no mouse activity, otherwise the Continuous Mode will be idle unless a mouse activity is detected. 4.10 Stop Continuous Mode This button is enabled when the Continuous Mode is activated. Click this button to deactivate the Continuous Mode. After the Continuous Mode is deactivated, the button will be disabled. 38 ABS Acoustic Bubble Spectrometer®© USER MANUAL: 7-086 v. 6.0 4.11 Cavitation Susceptibility Measurement Mode This button activates the Cavitation Susceptibility mode if the system is capable of this functionality. After this button is highlighted, the system is operated under Cavitation Susceptibility mode. 4.11 Files and I/O Important data are automatically saved to files during the experiment. In both Acquire and Analyze processes, the following files are generated: ATTENUATION RATIO VS FREQUENCY.DAT This file includes the attenuation ratio at each frequency. N_M3VSR1.DAT. This file includes the number of bubbles at different bubble size bins. N_M4VSR1.DAT. This file includes the number of bubbles per unit bin size at different bubble sizes, i.e. number of bubbles divided by bin size. NGROUP1.DAT. This file includes the number of bubbles, the surface area of the bubbles, and their contribution to the void fraction at different bubble size bins. SOLN_PARAM1.DAT. This file gives the statistics of the analysis. SOUND SPEED SATIO VS FREQUENCY.DAT. This file includes the sound speed ratio at each frequency. VF.DAT. This file includes the contributions to the void fraction at each frequency. The following files are generated only in the Acquire process: UVF.DAT. This file includes both the sound speed ratio and the attenuation ratio at each frequency. The following file is generated in the Analyze process as well as View Results if it is the No-Hardware version: BUBBLE SIZE DISTRIBUTION.DAT. This file includes the number of bubbles and its contribution to the void fraction at different bubble sizes. 39 ABS Acoustic Bubble Spectrometer®© USER MANUAL: 7-086 v. 6.0 In the Continuous Mode, all the above files are generated for the latest run. In addition, void fraction and bubble size distribution information for selected runs in sequence are also generated. BUBBLE SIZE DISTRIBUTION_CONT_MODE.DAT. This file includes the number of bubbles and its contribution to the void fraction at different bubble sizes for each selected run in the Continuous Mode. In addition the total void fraction and the time at which output is generated are also included. VOIDFRACTION_VS_TIME.DAT. This file includes the variation of void fraction with time for the selected runs in Continuous Mode. Raw data and processed results from an experiment can be saved or reopened by two means. Save/Open Clicking on File/Save will save all the information in a single binary file readable by the software with a name chosen by the user. The extension of the saved file is “.ABS”. Clicking on File/Open enables users to open a previously saved .ABS file. With this feature, users can view signals and results acquired previously. Users can also re-analyze the signals (solve the inverse problem) differently. Export/Import Clicking on File/Export to export the acquired signals to individual files for each frequency in ASCII format. Two types of data files are available for export, the .DAT files contain the transmitted and received signals vs. time, and the .CPV files are used by graphic software DF_CONTOUR developed by DYNAFLOW, INC which is provided with the ABS. Clicking on File/Export to export the experiment data to current directory, at first a window pops up to let the user decide whether to export the .CPV files. Then a series of files are generated with names of the form XXXKHZ.DAT and/or XXXKHZ.CPV based on the users’ choice, where XXX is the frequency of the signal (in kHz). In addition to exporting an individual file at each frequency, the following files are also exported: UVF.INP. This file includes the sound speed ratio and the attenuation ratio at each frequency. 40 ABS Acoustic Bubble Spectrometer®© USER MANUAL: 7-086 v. 6.0 Clicking on File/Import to import the individual .DAT files for each frequency listed in the property page Signals in the experiment settings as described in section 4.2. Note that if a corresponding .DAT file does not exist for a frequency listed an error message pops up to show the information about the missing data file. 5. Example ABS Acoustic bubble Spectrometer®© Experiment An example of taking a set of measurements with the ABS Acoustic bubble Spectrometer®© is provided in this section. The bubble population in water at an ambient pressure of 110 kPa and a temperature of 15C is determined. The gas in the bubbles is air. The following procedures are performed. 1. Run the ABS Acoustic bubble Spectrometer®© software by double clicking on the ABS icon. A screen with blank plots and a tool bar will appear. If desired, an existing file from a previous session with a .ABS extension may be opened as a starting point. 2. Use the File / Save As a utility to create a new file. 3. Select the Experiment Settings button from the tool bar. 4. Go to the General information page and fill in the information desired (Figure 1). 5. Go to the Signals page. Edit the default frequencies to those desired. Edit the default gains (applied to the voltages of the transmitted and received signals by the data acquisition board) such that sufficient resolution is attained for the particular configuration without saturating the received signal (Figure 2). 6. Select the box “Generate Reference Data” option to obtain the reference background data set. 7. Go to the Physical Parameters page. Edit the default values of these physical conditions to correspond to those of the experiment as required (Figure 3). 41 ABS Acoustic Bubble Spectrometer®© USER MANUAL: 7-086 v. 6.0 8. Click on the Acquire button. A “no-bubble” reference state is generated and the sent and received raw signals are displayed (Similar to Figure 5). It is very useful to inspect the signals to assure that sufficient resolution was obtained and that there are no other problems such as no received signals or no delay between emitted and received signal which usually indicates electric leak problems between the transducers. If these signals are not satisfactory, one should return to the Signals page and modify the settings accordingly or inspect the experimental setup for problems. A new reference state can then be acquired. 9. Experiments in the presence of bubbles will now be conducted having a suitable reference state in memory. 10. Select the Experiment Settings button again and go to the Signals page. Turn off the “Generate Reference Data” option 11. Click on the Acquire button. The sent and received raw signals in the presence of bubbles are displayed (Figure 5). Again, it is useful to inspect these signals to assure that sufficient resolution was obtained and that there are no other problems. 12. Go to the Physical Constraints page and edit these as needed. 13. Select the Analyze button to process the acquired experimental data. The results will be displayed as in Figure 9. 14. If desired, one may alternately view the raw signals and the calculated results by use of the View Signals and View Results buttons. 15. The experimental data (including reference state data) and results may be saved to disk at any time by use of File/Save. 16. Based on these results, refine the parameters if desired and repeat the experiment. 6. Advanced Features 6.1 Utilizing the Signal Dropping Option In version 5.0, the user has the option to actively interfere with the signal processing. This option should only be used by a very educated user and, if not properly used, could result in very erroneous results. With this option the user can define criteria for dropping signal from the analysis. Figure 23 shows the signal drop option page which can be activated by requesting a 42 ABS Acoustic Bubble Spectrometer®© USER MANUAL: 7-086 v. 6.0 Key from DYNAFLOW. The user can choose to drop a signal if the signal to noise amplitude ratio is less than a given threshold or if the sound speed ratio from the analysis is outside of the user specified range. 7. Useful Tips for Running Measurements To maintain the best signal possible, make sure that the battery in the amplifier is powerful enough. Also keep the hydrophone surface clean and bubble free as much as possible. Figure 23. Signal dropping options. 8. References 1. Duraiswami, R. and Chahine, G. L. “Bubble Density Measurement Using an Inverse Acoustic Scattering Technique,” NSF SBIR Phase I report, also DYNAFLOW, INC. Technical Report 92004-1, September 1992. 2. Duraiswami, R., Prabhukumar, S. and Chahine, G. L., “Development of an Acoustic Bubble Spectrometer (ABS) Using an Acoustic Scattering Technique,” NSF SBIR Phase II report, also DYNAFLOW, INC. Technical Report 94001-1, July 1996. 3. Duraiswami, R., Prabhukumar, S. and Chahine, G. L., “Bubble Counting Using an Inverse Acoustic Scattering Method,” J. Acoustical Society of America, 104 (5), November 1998. 4. Hocine, C. A. and Ouarem, M., “Bubble Size Measurement Study,” DYNAFLOW, INC. Technical Report 6.002-31, October 1996. 5. Demotes-Mainard, F. and Picard, M., “Study of Bubble Size Measurement Technique,” DYNAFLOW, INC. Technical Report 6.002-46, September 1997. 43 ABS Acoustic Bubble Spectrometer®© USER MANUAL: 7-086 v. 6.0 6. Chahine, G. L., Duraiswami, R., and Frederick, G. S., “Detection of Air Bubbles in HP Ink Cartridges Using DYNAFLOW’S Acoustic Bubble Spectrometer Technology,” DYNAFLOW, INC. Technical Report 97014hp-1, January 1998. 7. Chahine, G. L., Kalumuck, K. M., Cheng, J-Y., and Frederick, G. S., “Validation of Bubble Distribution Measurements of the ABS Acoustic bubble Spectrometer®© with High Speed Video Photography,” CAV2001 – 4th International Symposium on Cavitation, Pasadena, CA, June 2001. 8. Chahine, G. L., Kalumuck, K. M., “Development of a Near Real-Time Instrument for Nuclei Measurement: the ABS Acoustic bubble Spectrometer®©,” FEDSM’03 - 4th ASME_JSME Joint Fluid Engineering Conference, Honolulu, Hawaii, July 2003. 44