1
Modified Multi-Attribute Task Battery – JavaScript
(mMATB-JS)
Documentation and User Manual
James Cline, Megan Morris, Chris Fisher, Leslie Blaha
711th Human Performance Wing
Air Force Research Laboratory
Wright-Patterson AFB, Ohio
DISTRIBUTION A: APPROVED FOR PUBLIC RELEASE; DISTRIBUTION UNLIMITED.
88ABW CLEARED 07/10/2015; 88ABW-2015-3508
1
DISTRIBUTION A: APPROVED FOR PUBLIC RELEASE; DISTRIBUTION UNLIMITED.
88ABW CLEARED 07/10/2015; 88ABW-2015-3508
2
Table of Contents
Table of Contents ..................................................................................... 2
1. Introduction .......................................................................................... 3
1.1. Purpose ........................................................................................... 3
1.2. Reference Materials ........................................................................ 3
1.3. Useful Definitions .......................................................................... 3
1.4. Required Software .......................................................................... 3
2. Installation and Setup ........................................................................... 4
3. System Overview ................................................................................. 5
3.1 Tracking........................................................................................... 7
3.2 Monitoring ....................................................................................... 7
3.3 Communications .............................................................................. 7
3.4 Resource Management .................................................................... 8
4. Admin Page Overview ......................................................................... 8
5. Running a Condition .......................................................................... 13
6. Database ............................................................................................. 13
Appendices ............................................................................................. 16
APPENDIX A. Object List.................................................................. 16
APPENDIX B. Parameter list.............................................................. 17
APPENDIX C. Data Tables and Variables ......................................... 21
APPENDIX D. Valid CSS Colors ....................................................... 23
DISTRIBUTION A: APPROVED FOR PUBLIC RELEASE; DISTRIBUTION UNLIMITED.
88ABW CLEARED 07/10/2015; 88ABW-2015-3508
3
1. Introduction
1.1. Purpose
The goal of this project is to create a fully customizable multi-tasking experiment
environment. The Modified Multi-Attribute Task Battery – JavaScript (mMATB-JS) provides a
simple-to-use interface for customizing and running experimental conditions, a means for
collecting human data in the form of inputs (mouse, keyboard) to the environment, and a
database for organizing experimental parameters and data. mMATB-JS is built in JavaScript,
HTML, and CSS on top of an SQLite database, allowing for simple storage of experimental
conditions and data.
1.2. Reference Materials
Django
D3
Original NASA MAT-B
http://djangoproject.com/
d3js.org
http://matb.larc.nasa.gov/
1.3. Useful Definitions
Server – The computer or device used to store information.
Host-Site – The webpage that is the base for the server. This will be http://<ip>:<port>
<ip>: either the ip of the server or a domain name that points to the server
<port>: port specified when launching the server; default 9000
1.4. Required Software
Python 2.7
Django 1.8 (any version)
Google Chrome (latest version)
mMATB-JS
continuum.io/downloads#all
http://www.djangoproject.com/download/1.8.7/tarball/
http://www.google.com/chrome/
http://sai.mindmodeling.org/mmatb/
DISTRIBUTION A: APPROVED FOR PUBLIC RELEASE; DISTRIBUTION UNLIMITED.
88ABW CLEARED 07/10/2015; 88ABW-2015-3508
4
2. Installation and Setup
1) Installing Python: To install mMATB-JS, first install Anaconda2 version 2.4.0, which
includes the installation of Python 2.7, to your server
o Go to continuum.io/downloads#all and download the installation file
2) Add Python Packages:
o With Internet Access: install Django from your terminal.
Open your terminal (Mac OSX: Utilities folder in Applications) or command
prompt (Windows)
Install Django using “pip install Django==1.8.2”.
o Without Internet Access: install Django and South
Go to http://www.djangoproject.com/download/1.8.7/tarball/ and download
the package file
Open your terminal (Mac OSX: Utilities folder in Applications) or
command prompt (Windows)
Change directory to where the package file is downloaded using “cd
PATH/TO/FILE”
o PATH/TO/FILE is the actual path to the file; you will need to replace
this
Install Django using “easy_install FILE_NAME”
o FILE_NAME is the actual name of the file, you will need to replace
this
*If you already have Python installed on your computer, you will only need to install
Django and Tornado. Follow the same steps for installation as above.
Tornado 4.3
www.tornadoweb.org
3) Setup mMATB-JS Environment:
o Download the mMATB-JS.zip file from http://sai.mindmodeling.org/mmatb/
o Unzip the file
o Place the resulting mMATB-JS folder in an easy to reference location on your server.
For the example, we will use the Desktop.
4) Start Server:
DISTRIBUTION A: APPROVED FOR PUBLIC RELEASE; DISTRIBUTION UNLIMITED.
88ABW CLEARED 07/10/2015; 88ABW-2015-3508
5
o Use the terminal (or command prompt) to change the present working directory to
the mMATB-JS folder by inputting “cd Desktop/mMATB-JS”
o Launch the server by running the command “python Tornado.py” in the terminal
By default the server will run on port 9000
The port can be changed by adding a parameter to the command with the
appropriate port (e.g., “python Tornado.py 8888”, which will launch the server
on port 8888).
If everything worked correctly you should see the text in the image below in your
terminal
5) Accessing the Experiment: mMATB-JS can now be accessed using a client computer
Open a Chrome browser page
Go to host-site/MATB. This will be http://<ip>:<port> where <ip> will be either the
ip of the server or a domain name that points to the server and <port> will be the port
specified when launching the server, default 9000
If you are working on the same computer you can simply input
“localhost:9000/MATB”
The resulting website should look like the image below.
3. System Overview
mMATB-JS is composed of a server and client setup. The client setup is where the actual
experiment will run and can be any computer connected to the server via a network. The server is
where all of the code is hosted, as well as where the database containing the experimental
conditions and data is stored. The server is written in python using the Django package. Once
running, the server hosts a series of webpages that can be accessed by a client computer. The two
major webpages for the site are the admin page and experiment page.
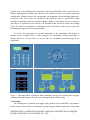
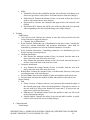
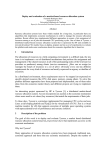
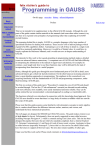
The basic mMATB task environment entails four individual decision making tasks, which
are shown in Figure 1. The tasks are self-contained in the four quadrants of the screen, and we
DISTRIBUTION A: APPROVED FOR PUBLIC RELEASE; DISTRIBUTION UNLIMITED.
88ABW CLEARED 07/10/2015; 88ABW-2015-3508
6
describe each in the following four subsections. Note that mMATB-JS allows each task to be
flexibly implemented such that each subtask can be included or not in an overall experiment
configuration. Within each task, the experimenter can manipulate all the individual parameters.
At present, only fixed values are possible for the parameters (that is, mMATB-JS cannot
currently accommodate dynamic parameter updates during an experiment, such as in staircase
procedures). It is possible to set each task to be included on the screen but to have zero alerting
events. If a task is not included in a configuration, the overall layout of the screen is preserved
but nothing will appear in the relevant quadrant.
It is left to the experimenter to provide instructions to the participants with respect to
primary versus secondary tasks or other strategies the experimenter wishes participants to
employ. However, we have built in a way to link to a modifiable instructions page in the
experiment.
Figure 1. Full mMATB-JS experiment. With monitoring task top left, tracking task top right,
communication task bottom left, and resource management task bottom right.
3.1 Tracking
The tracking task is included in the upper right quadrant of the mMATB-JS environment.
On the screen, colored dots are continually moving along pre-defined trajectories. The default
DISTRIBUTION A: APPROVED FOR PUBLIC RELEASE; DISTRIBUTION UNLIMITED.
88ABW CLEARED 07/10/2015; 88ABW-2015-3508
7
task consists of three oval trajectories. Randomly, a dot will turn red, indicating it is the target
dot. The correct response is for the participant to mouse click on the red dot, which turns green
meaning “target acquired”, and then to track the green dot with the mouse continuously. When a
dot turns red, the participant acquires and tracks this target.
Data recorded in this tracking task are x, y coordinates of the target object, x, y coordinates
of the mouse movements, and time and location of mouse clicks to acquire targets.
Failure to acquire the target dot will result in the target remaining red, continuously moving,
until the next target is cued and a miss being recorded in the data.
3.2 Monitoring
In the monitoring task (upper left quadrant), the participant must respond to two types of
“out of bounds” alerts with appropriate keyboard presses. First, a set of vertical sliders is shown
on the screen. Each slider consists of a vertical bar with hatch marks and a moving triangle
slider. The normal range of motion of the sliders is +/- 1 from the center hatch mark. If a slider
moves above or below this center range, the participant must push the F1-F4 button associated
with that slider to reset the position of the triangle. Upon key press, the triangle returns to the 0
mark, or center of the vertical slider range.
Data collected on the vertical sliders include the timestamp and input buttons of the
keyboard presses. If the correct keyboard button is not pressed when a slider is alert, it will
eventually time out and the triangle will move back in bounds and the alert state will return to
normal. A miss is recorded in the data. If an incorrect button is pushed, the button press is
recorded, but the state of the slider is unchanged until the correct button is pressed.
In addition to the sliders, the monitoring task has two colored blocks, which can “go alert”
by changing colors. The normally green block on the left can randomly turn black and must be
reset with an F5 button press. The normally black block on the right can randomly turn red and
must be reset with an F6 button press.
Data collected on the colored blocks include the timestamp and input buttons of the
keyboard presses. If the wrong button is pressed, it will be recorded in the data but the state of
the color block will not change (it will remain alert). If a color is not reset with a button press, it
will eventually time out and return to its normal color state. If the color block times out, a miss is
recorded in the data.
3.3 Communications
The visual communications task is contained in the lower left quadrant. It contains a set of
four channels, labeled with white text Ops 1, Ops 2, Int 1 and Int 2, together with their current
state values. Above these is a cue box, which cues changes to be made to the communications
channels. When the text in the cue box turns red, it is notifying the user of a change to be made;
the cue contains a channel to be adjusted and the new target state value for that channel. The user
responds to the alert by using the up/down arrows to select the target channel (selection indicated
by a bounding box) and using the right/left arrows to adjust the state value by an
DISTRIBUTION A: APPROVED FOR PUBLIC RELEASE; DISTRIBUTION UNLIMITED.
88ABW CLEARED 07/10/2015; 88ABW-2015-3508
8
increase/decrease, respectively. Once the target channel state is at the cued value, the participant
submits the changes by pressing the Enter or Return key on the keyboard.
Data recorded in this task include all arrow key presses, with timestamps, and the final
submitted value with the timestamp for the Enter/Return key press. If the cue box returns to the
non-alert state (text changes from red to white) before the user submits the corrected channel
state, then a miss is recorded with all the relevant key presses.
3.4 Resource Management
In the resource management task (lower right quadrant), participants must keep the resource
levels in the main tanks as close to the center of the target region as possible. The target region is
indicated by the thicker bars on the sides of the main tank boxes. The tanks are connected to a
fuel source (circle) and a reserve tank (smaller rectangle), as well as to each other. Directional
channels (indicated by the triangles on the connecting lines) are available between each tank and
its source and reserve, as well as between the two tanks. The channels are off at the beginning of
the experiment, indicated by the gate triangles being an empty or background color. Participants
can open the flow gates by selecting the number key associated with each gate in the diagram.
An open flow gate is green.
Gates can break, which is indicated by the triangle turning red. Participants cannot change
the state of the broken gates (which eventually time out a return to an off state), but they can
adjust the activity of other gates to accommodate any unavailable gates to maintain the
appropriate resource levels. Participants can interact as much as they want with this task with no
consequences.
The data recorded in this task consist of each number key press with its timestamp, and the
current resource levels in the tanks.
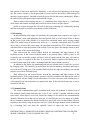
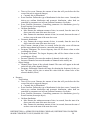
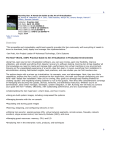
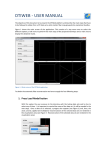
4. Admin Page Overview
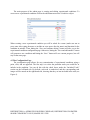
The admin page, depicted in Figure 2, is where experimental data can be viewed and
conditions can be changed.
DISTRIBUTION A: APPROVED FOR PUBLIC RELEASE; DISTRIBUTION UNLIMITED.
88ABW CLEARED 07/10/2015; 88ABW-2015-3508
9
Figure 2. Admin page.
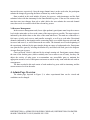
4.1 Admin Login
The admin page can be reached by going to host-site/admin/ (e.g., localhost:9000/admin) in
a web browser on a client computer. This will take you to the Admin login page, depicted in
Figure 3. By default the Username and Password will be “admin”. The username and password
can be changed once logged in by going to Users under Auth and selecting Admin and then
changing the values. You can also click on the Change password link in the top right hand
corner.
Figure 3. Admin login page.
4.2 Creating and Editing Experimental Conditions
DISTRIBUTION A: APPROVED FOR PUBLIC RELEASE; DISTRIBUTION UNLIMITED.
88ABW CLEARED 07/10/2015; 88ABW-2015-3508
10
The main purpose of the admin page is creating and editing experimental conditions. To
create a new experimental condition click on the add button next to the Conditions object.
When creating a new experimental condition you will be asked for a name (make sure not to
press enter after typing the name or include an extra space after the name) and duration for the
condition in minutes. Then, hitting the “Save and continue editing” button will take you to the
experimental condition configuration page. Otherwise, hitting the “Save and add another” button
will generate a new condition and hitting the “Save” button will save current progress, but will
stay on the same page.
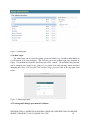
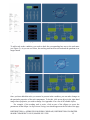
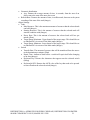
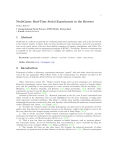
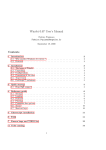
4.3 The Configuration Page
The configuration page allows for easy customization of experimental conditions using a
point, click, and set approach. The first step is to select the particular tasks you would like to
include in the condition. You can do this with the check boxes under the “Included Tasks”
section on the left-hand side. By default, each task is unchecked, and the corresponding task
images will be muted on the right-hand side, showing that they are not included in the task (see
Figure 4).
DISTRIBUTION A: APPROVED FOR PUBLIC RELEASE; DISTRIBUTION UNLIMITED.
88ABW CLEARED 07/10/2015; 88ABW-2015-3508
11
Figure 4. The configuration page when none of the tasks have been added to the condition.
To add a task to the condition, you need to check the corresponding box next to the task name
(see Figure 5). As you can see below, the tracking task has been selected and the quadrant is no
longer muted.
Figure 5. The tracking task is present in the current condition.
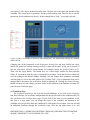
Once you have added the tasks you want to be present in the condition, you can make changes to
the particular properties of the task components. To do this, click on an object in the right-hand
image whose properties you wish to change. See Appendix A for a list of all editable objects.
For example, if the tracking task is active, click on one of the ellipses to access the
parameters of that ellipse. An Experiment Settings area should appear on the left side of the page
DISTRIBUTION A: APPROVED FOR PUBLIC RELEASE; DISTRIBUTION UNLIMITED.
88ABW CLEARED 07/10/2015; 88ABW-2015-3508
12
(see Figure 6). This area is broken into three areas. The first area is the name and duration of the
condition. The second area is parameters for the overall tracking task. The last area is specific
parameters for the path that was chosen. In the example below, Path 1 is currently selected.
Figure 6. Path 1 is currently selected for the tracking task. The Experiment Settings are outlined
in the red box.
Changing one of the parameters in the Experiment Settings list, and then clicking the Apply
button will update the settings running on the live demo on the right, giving you a preview of
how the experiment will look when running. For example, change the Satellite Radius to 25.
Then click the Apply button. You should now see a much larger satellite for that particular
ellipse. If you want to undo the Apply, click on the Reset button. Note that the Reset button will
reset the settings to the default settings. Similarly, you can change other parameters associated
with this path, as well as the other paths in the Tracking Task. A list of parameters that can be
changed and a description for each can be found in Appendix B. Clicking the Submit Changes
button will then save the changes you have made to the condition to the database and then will
proceed to the Conditions page.
4.3 Conditions Page
The Conditions page has a list of all the created conditions. If you click on the Configure
link, this will allow you to edit the configurations for the specific tasks in the condition (this will
take you back to the Configurations page). If you click on the name of your condition, it will
take you to a page where you can change the name of the condition, the duration of the
condition, and you can also delete the conditions by clicking the Delete button. You can also add
an additional condition through the Conditions page. Near the top right corner is an Add
DISTRIBUTION A: APPROVED FOR PUBLIC RELEASE; DISTRIBUTION UNLIMITED.
88ABW CLEARED 07/10/2015; 88ABW-2015-3508
13
Conditions button; this button will take you to a new page where you will input information for
your condition.
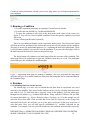
5. Running a Condition
1. Go to the experiment home page by opening a Chrome browser window
2. Go to the host-site/MATB (e.g., localhost:9000/MATB)
3. To select the condition to run, click on the drop menu in the center of the screen (see
Figure 7). You will see a list of available conditions. Select the specific condition you would
like to run
4. Enter a Participant ID and a Session ID
There are two additional buttons on the experiment home screen. The Explanation button
will bring up all four quadrants of the task on the screen, but will not actually run the condition.
This page is strictly for instructional purposes (i.e., explaining the task to the participant). There
is a Reset button available if you need to reset the quadrants. If you proceed to this page, click on
the back button in the browser to return to the previous page.
The Begin button will continue to an initial page before the execution of the condition. This
initial page allows the participant to begin the condition when they are ready. The participant
presses the space bar, and then the condition begins.
Figure 7. Experiment home page for running a condition. The circle surrounds the drop-down
menu that will give all available conditions, taken from the listing that can be found and edited in
the Conditions Page.
6. Database
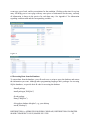
6.1 Confirming Data has Saved Correctly
The Admin page is an easy way to confirm that the data from an experiment was saved
correctly to the database. Data stored in the database can be seen by selecting which data table
you wish to view. To check that data is correctly saving to the database, go to the admin page
through host-site/admin/ (e.g., localhost:9000/admin). Along with the Conditions link are links
for various data tables (e.g., Events, Metadata, Mouse Trackings, etc.). For this example we will
select the Events data table. Click on either the Events link (see Figure 8) or the Change link
associated with Events, this will take you to a new page (see Figure 9) that gives a preview of
each data entry. Here you will find specific information (i.e., variables collected) for the
condition. For example, in Events you will find the time the condition started and the session ID,
DISTRIBUTION A: APPROVED FOR PUBLIC RELEASE; DISTRIBUTION UNLIMITED.
88ABW CLEARED 07/10/2015; 88ABW-2015-3508
14
event type, type of task, and key associations for the condition. Clicking on the time for a given
entry will bring you to a new page with any extra pieces of information for the entry, currently
all information is shown in the preview for each data entry. See Appendix C for information
regarding each data table and the corresponding variables.
Figure 8.
Figure 9.
6.2 Extracting Data from the Database
To extract data from the database, you will need to use a script to query the database and extract
the information you want. Although other programming languages have packages for accessing
SQLite databases, we provide basic R code for accessing the database.
#Install package
install.packages(“RSQLite”)
#Load package
library("RSQLite")
#Set path to database db.sqlite3, e.g. your desktop
setwd("/Desktop")
DISTRIBUTION A: APPROVED FOR PUBLIC RELEASE; DISTRIBUTION UNLIMITED.
88ABW CLEARED 07/10/2015; 88ABW-2015-3508
15
#Connect to database
drv = dbDriver("SQLite")
con = dbConnect(drv, "db.sqlite3")
#Use this command to list the tables in the database
dbListTables(con)
#Use this command to list fields within a specific table
dbListFields(con,"MATB_event")
#Query specific fields from a table
data = dbGetQuery(con, "Select id, time, sessionID, eventType, chart, arg, DomID from
MATB_event")
#Query all fields within a table
data = dbGetQuery(con, "Select * from MATB_event")
6.3 Making Changes to the Data in the Database
While not generally recommended, you can delete instances of data by checking the data you
want to delete and then clicking the drop menu labeled Action: and selecting delete this
SOURCE, where SOURCE is the type of data you are working with (e.g., trackings, conditions,
etc.). Alternatively, you can click on the Time link associated with the data. This will take you to
a different page, where a delete button is available. In order to change specific information for
the data point (e.g., change Participant ID), click on the Time link associated with the data. You
should now see the available variables you can edit. Once you have made your changes you can
either press Save and add another, Save and continue editing, and Save. You can add a data point
by clicking Add SOURCE in the top right corner. You will now see variables to fill in for that
type of data point. Once you have filled in the values you can press Save and add another, Save
and continue editing, or Save.
DISTRIBUTION A: APPROVED FOR PUBLIC RELEASE; DISTRIBUTION UNLIMITED.
88ABW CLEARED 07/10/2015; 88ABW-2015-3508
16
Appendices
APPENDIX A. Object List
Monitoring Task:
o Slider 1 (F1 slider)
o Slider 2 (F2 slider)
o Slider 3 (F3 slider)
o Slider 4 (F4 slider)
o Button 1 (F5 box)
o Button 2 (F6 box)
Tracking Task:
o Path 1 (bottom most left ellipse)
o Path 2 (middle)
o Path 3 (top most left)
Communications Task:
o Channel 1 (OPS 1)
o Channel 2 (OPS 2)
o Channel 3 (INT 1)
o Channel 4 (INT 2)
Resource Management Task:
o Tank 1 (Click on upper left square tank fuel or fuel level number)
o Tank 2 (Click on upper right square tank fuel or fuel level number)
o Tank 3 (Click on lower left square tank fuel or fuel level number)
o Tank 4 (Click on lower right square tank fuel or fuel level number)
o Switch 1 (Click on arrow 1)
o Switch 2 (Click on arrow 2)
o Switch 3 (Click on arrow 3)
o Switch 4 (Click on arrow 4)
o Switch 5 (Click on arrow 5)
o Switch 6 (Click on arrow 6)
o Switch 7 (Click on arrow 7)
o Switch 8 (Click on arrow 8)
DISTRIBUTION A: APPROVED FOR PUBLIC RELEASE; DISTRIBUTION UNLIMITED.
88ABW CLEARED 07/10/2015; 88ABW-2015-3508
17
APPENDIX B. Parameter list
Check boxes: When checked, signify that the task will be a part of the condition
Experiment Settings
- Name: Name of the condition (String)
- Duration: Duration of condition in minutes (Integer)
Monitoring
- Task Settings
Time to first event: The amount of time that will pass before the first event of the
task is triggered in seconds (Integer)
Currently this is deterministic
Event Function: Defines the type of distribution for the alert events. Currently the
choices are uniform distribution and geometric distribution, where both are
controlled by parameters set in Event Function Parameters. See below.
Event Function Parameters: Controlling parameters for distribution given by
Event Function. (Javascript object)
Uniform distribution
o Min: Denotes the minimum amount of time, in seconds, from the start of
an alert event to the start of the next alert event
o Max: Denotes the maximum amount of time, in seconds, between the start
of an alert event to the start of the next alert event
Geometric distribution
o Avg: Denotes the average amount of time, in seconds, from the start of an
alert event to the start of the next alert event
o Tick marks: Denotes the number of horizontal lines on each scale
Slider Range: Denotes the two lines that the arrows will bounce between while
not alert, with the top line being 0 (Integer array)
Decrease Sliders: Reduces the number of sliders in the task by one
Increase Sliders: Increases the number of sliders in the task by one
Decrease Buttons: Reduces the number of buttons in the task by one
Increase Buttons: Increases the number of buttons in the task by one
- Object Settings
Button
Probability: Denotes the probability that the selected button will change to an
alert at any given alert event relative to all other objects in the task (Integer)
Alert Timeout: Denotes the amount of time, in seconds, before the alert will
timeout and the button will return to its non-alert state (Integer)
Keyboard Key: Denotes the characters that appear below the selected button
(String)
Keyboard ASCII: Denotes the ASCII value of the key that needs to be pressed
when responding to the selected button changing to an alert (Integer)
Base color: Denotes the color of the button when in a non-alert state. This can
be any color supported by CSS (see Appendix D)
Alert color: Denotes the color of the button when in an alert state. This can be
any color supported by CSS (see Appendix D)
DISTRIBUTION A: APPROVED FOR PUBLIC RELEASE; DISTRIBUTION UNLIMITED.
88ABW CLEARED 07/10/2015; 88ABW-2015-3508
18
Slider
Probability: Denotes the probability that the selected button will change to an
alert at any given alert event relative to all other objects in the task (Integer)
Slider Interval: Denotes the amount of time, in seconds, it takes the selected
slider to move between two lines (Integer)
Keyboard Key: Denotes the characters that appear below the selected scale
(String)
Keyboard ASCII: Denotes the ASCII value of the key that needs to be pressed
when responding to the selected slider being out of range (Integer)
Tracking
- Task Settings
Time to first event: Denotes the amount of time that will pass before the first
event of the task is triggered (Integer)
Currently this is deterministic
Event Function: Defines the type of distribution for the alert events. Currently the
choices are uniform distribution and geometric distribution, where both are
controlled by parameters set in Event Function Parameters. See below.
Event Function Parameters: Controlling parameters for distribution given by
Event Function. (Javascript object)
Uniform distribution
Min: Denotes the minimum amount of time, in seconds, from the start of an
alert event to the start of the next alert event
Max: Denotes the maximum amount of time, in seconds, between the start of
an alert event to the start of the next alert event
Geometric distribution
Avg: Denotes the average amount of time, in seconds, from the start of an
alert event to the start of the next alert event
Refresh Rate: Denotes the amount of time, in milliseconds, between each system
recording the state of the task (Integer)
Decrease Paths: Decreases the number of paths and satellites in the task by one
Increase Paths: Increases the number of paths and satellites in the task by one
- Object Settings
Path
Points: An array of objects with an x and y property that control the shape of
the selected path using a basis-closed interpolation. All points are relative to
the task with (0,0) being in the bottom left corner and (1,1) being in the top
right corner (Javascript object array)
Path Interval: The amount of time it takes the satellite to make one full circuit
of the selected path (Integer)
Satellite Radius: Denotes the radius of the selected path's satellite, in pixels
relative to the task before screen scaling (Integer)
Communication
- Task Settings
DISTRIBUTION A: APPROVED FOR PUBLIC RELEASE; DISTRIBUTION UNLIMITED.
88ABW CLEARED 07/10/2015; 88ABW-2015-3508
19
-
Time to first event: Denotes the amount of time that will pass before the first
event of the task is triggered (Integer)
Currently this is deterministic
Event Function: Defines the type of distribution for the alert events. Currently the
choices are uniform distribution and geometric distribution, where both are
controlled by parameters set in Event Function Parameters. See below.
Event Function Parameters: Controlling parameters for distribution given by
Event Function. (Javascript Object)
Uniform distribution
Min: Denotes the minimum amount of time, in seconds, from the start of an
alert event to the start of the next alert event
Max: Denotes the maximum amount of time, in seconds, between the start of
an alert event to the start of the next alert event
Geometric distribution
Avg: Denotes the average amount of time, in seconds, from the start of an
alert event to the start of the next alert event
Alert Timeout: Amount of time, in seconds, before the alert event will timeout
and the target channel will return to a non-alert state (Integer)
Frequency Minimum: The lowest frequency that will be chosen when an alert
event happens. (Float)
Frequency Maximum: The largest frequency that will be chosen when an alert
event happens. (Float)
Decrease Channels: Decreases the number of channels in the task by one
Increases Channels: Increases the number of channels in the task by one
Object Settings
Channel Name: Name of the selected channel. The name will appear in the task
on the left side of the channel (String)
Frequency Differential: Denotes the range for choosing the frequency for the cue
box. The range will be plus or minus this value from the current value of the
selected channel. (Float)
Resource
- Task Settings
Time to first event: Denotes the amount of time that will pass before the first
event of the task is triggered (Integer)
Currently this is deterministic
Event Function: Defines the type of distribution for the alert events. Currently the
choices are uniform distribution and geometric distribution, where both are
controlled by parameters set in Event Function Parameters. See below.
Event Function Parameters: Controlling parameters for distribution given by
Event Function (Javascript object)
Uniform distribution
Min: Denotes the minimum amount of time, in seconds, from the start of an
alert event to the start of the next alert event
Max: Denotes the maximum amount of time, in seconds, between the start of
an alert event to the start of the next alert event
DISTRIBUTION A: APPROVED FOR PUBLIC RELEASE; DISTRIBUTION UNLIMITED.
88ABW CLEARED 07/10/2015; 88ABW-2015-3508
20
-
Geometric distribution
Avg: Denotes the average amount of time, in seconds, from the start of an
alert event to the start of the next alert event
Refresh Rate: Denotes the amount of time, in milliseconds, between each system
recording of the state of the task (Integer)
Object Settings
Tank
Max Resource: This is the maximum amount of resource that the selected tank
can hold (Integer)
Starting Resource: This is the amount of resource that the selected tank will
start the condition with (Integer)
Decay Rate: This is the amount of resource the selected tank will lose per
minute (Float)
Target Range Maximum: Upper bound of the target range. This should be set
to undefined if it is not one of the Main tanks (Integer)
Target Range Minimum: Lower bound of the target range. This should be set
to undefined if it is not one of the Main tanks (Integer)
Switch
Transfer Rate: The amount of resource that will be transferred from the source
to the destination per minute (Float)
Repair Time: Amount of time before a switch will repair itself after changing
to an alert (Integer)
Keyboard Key: Denotes the characters that appear near the selected switch
(String)
Keyboard ASCII: Denotes the ASCII value of the key that needs to be pressed
to turn off and on the selected switch (Integer)
DISTRIBUTION A: APPROVED FOR PUBLIC RELEASE; DISTRIBUTION UNLIMITED.
88ABW CLEARED 07/10/2015; 88ABW-2015-3508
21
APPENDIX C. Data Tables and Variables
Data Tables:
Conditions
Events: A data entry is created for every user alert (cueing of a change), input (participant
makes an action), or timeout (participant does not make an action in the required time and
alerted object goes back to the normal state) during the experiment
o Time: the specific instance of time in milliseconds from the start of the experiment
(start time is 0 ms)
o SessionID: the session ID; this is created when running the condition
o EventType: refers to the type of event. This can be either an alert (cueing of a
change), an input (participant makes an action), timeout (participant does not make an
action in the required time and alerted object goes back to the normal state)
o Chart: refers to the specific task of the instance (i.e., monitoring, tracking,
communication, or resource)
o Arg: this variable provides different information for different tasks
Monitoring task: states if the input given by the participant is correct or not (did
the participant push the correct key for the alerted boxes and sliders).
If correct, this is represented by correct: true and if false, this is represented
by correct: false.
This variable also denotes the ASCII key press associated with the input (F1
(input): 112, F2: 113, F3: 114, F4: 115, F5: 116, F6: 117)
Tracking task: states if the input given by the participant is correct or not (did the
participant click on the correct alerted satellite).
If correct, this is represented by correct: true and if false, this is represented
by correct: false
Resource Management task: denotes the ASCII key press associated with the
input (1 (input): 49, 2: 50, 3: 51, 4: 52, 5: 53, 6: 54, 7: 55, 8: 56)
Communications task: states if the input given by the participant is correct or not
(did the participant press accept with the correct channel and frequency).
If correct, this is represented by correct: true and if incorrect, this is
represented by correct: false.
This variable also denotes the channel and frequency after the input was
handled.
This variable also denotes the current frequency of the target channel and the
target frequency when an alert event happens.
o DomID: this variable provides information about which object caused the data point
Metadata: a data entry is created for every experiment that is run
o StartTime: the start time for the condition in epoch time
o SessionID: the session ID; this is created when running the condition
o Duration: the duration of the condition in milliseconds; this is set when creating the
condition
o ParticipantID: the participant ID; this is created when running the condition
o Condition: the name of the condition; this is set when creating the condition and when
running the condition
DISTRIBUTION A: APPROVED FOR PUBLIC RELEASE; DISTRIBUTION UNLIMITED.
88ABW CLEARED 07/10/2015; 88ABW-2015-3508
22
o Monitoring: a check mark signifies that the task was included in the condition; a
minus signifies that the task was not included in the condition
o Tracking: a check mark signifies that the task was included in the condition; a minus
signifies that the task was not included in the condition
o Communication: a check mark signifies that the task was included in the condition; a
minus signifies that the task was not included in the condition
o Resource: a check mark signifies that the task was included in the condition; a minus
signifies that the task was not included in the condition
Mouse Trackings: a data entry is created for each path every time the task refreshes as set
in the condition
o Time: the specific instance of time in milliseconds from the start of the experiment
o SessionID: the session ID; this is created when running the condition
o X: the x coordinate of the mouse in pixels
o Y: the y coordinate of the mouse in pixels
o DomID: the alerted satellite that the participant should be following
o TargetX: the x coordinate of the target satellite in pixels
o TargetY: the y coordinate of the target satellite in pixels
Resource Switches: a data entry is created for each switch every time the task refreshes as
set in the condition
o Time: the specific instance of time in milliseconds from the start of the experiment
o SessionID: the session ID; this is created when running the condition
o SwitchNumber: refers to a specific switch in the Resource Management Task
o State: refers to whether the corresponding switch is on (1), off (0), and broken (2)
Resource Tanks: a data entry is created for each tank every time the task refreshes as set
in the condition
o Time: the specific instance of time in milliseconds from the start of the experiment
o SessionID: the session ID; this is created when running the condition
o TankNumber: refers to a specific tank in the Resource Management Task
o State: refers to the level of fuel present in the corresponding tank
Trackings: a data entry is created every time the mouse is moved
o Time: the specific instance of time in milliseconds from the start of the experiment
o SessionID: the session ID; this is created when running the condition
o X: the x coordinate of the referenced satellite in pixels
o Y: the y coordinate of the referenced satellite in pixels
o DomID: the referenced satellite (track_circle_2, _1, or _0)
o State: whether the satellite is an alert or not (1 if the satellite is an alert and the
participant should be following, 0 if the satellite is not an alert)
o MouseX: the x coordinate of the mouse in pixels
o MouseY: the y coordinate of the mouse in pixels
DISTRIBUTION A: APPROVED FOR PUBLIC RELEASE; DISTRIBUTION UNLIMITED.
88ABW CLEARED 07/10/2015; 88ABW-2015-3508
23
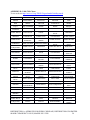
APPENDIX D. Valid CSS Colors
To see each visit http://www.w3.org/TR/SVG/types.html#ColorKeywords
BLACK
BLUE
CYAN
DARK GRAY
GRAY
GREEN
LIGHT GRAY
MAGENTA
ORANGE
RED
WHITE
YELLOW
ALICE BLUE
AQUA
BLANCHED
ALMOND
AQUA-MARINE
AZURE
BEIGE
PINK
ANTIQUE
WHITE
BISQUE
BLUE VIOLET
BROWN
BURLEY WOOD
CADET BLUE
CHART-REUSE
CHOCOLATE
CORAL
CRIMSON
DARK BLUE
DARK CYAN
DARK KHAKI
DARK
MAGENTA
DARK OLIVE
GREEN
DARK ORANGE
DARK ORCHID
DARK RED
DARK SALMON
DARK SEA GREEN
DARK SLATE
BLUE
DARK SLATE
GRAY
DARK VIOLET
DEEP PINK
DEEP SKY BLUE
DIM GRAY
FIRE BRICK
FLORAL WHITE
FOREST GREEN
GAINSBORO
GHOST WHITE
GOLD
GOLDENROD
HONEY DEW
HOT PINK
INDIGO
KHAKI
LAVENDER
LIGHT BLUE
LIGHT CORAL
LIGHT PINK
LIGHT SALMON
INDIAN RED
LAVENDER
BLUSH
LIGHT CYAN
LIGHT SEA
GREEN
FUCHSIA
GREEN
YELLOW
IVORY
LEMON
CHIFFON
LIGHT GREEN
LIGHT SLATE
GRAY
LIGHT STEEL
BLUE
LIGHT YELLOW
DARK
TURQUOISE
DODGER BLUE
CORNFLOWER
BLUE
DARK
GOLDENROD
LAWN GREEN
LIGHT GOLDEN
LIGHT SKY BLUE
LIME
LIME GREEN
CORNSILK
DARK GREEN
LINEN
MEDIUM AQUA
MARINE
MEDIUM SLATE
BLUE
MEDIUM BLUE
MEDIUM ORCHID
MEDIUM SPRING
GREEN
MEDIUM
TURQUOISE
MEDIUM
PURPLE
MEDIUM
VIOLET RED
MINT CREAM
MISTY ROSE
MOCCASIN
NAVAJO WHITE
OLD LACE
PALE
GOLDENROD
PEACH PUFF
OLIVE
OLIVE DRAB
PALE GREEN
PALE TURQUOISE
PERU
PLUM
ORANGE RED
PALE VIOLET
RED
POWDER BLUE
PURPLE
SANDY
BROWN
SKY BLUE
ROSY BROWN
ROYAL BLUE
SADDLE BROWN
SALMON
SEA GREEN
SEA SHELL
SIENNA
SILVER
SLATE BLUE
SLATE GRAY
SNOW
SPRING GREEN
STEEL BLUE
TAN
TEAL
THISTLE
TURQUOISE
VIOLET
WHEAT
WHITE SMOKE
TOMATO
YELLOW
GREEN
MAROON
MEDIUM SEA
GREEN
MIDNIGHT
BLUE
NAVY
ORCHID
PAPAYA WHIP
DISTRIBUTION A: APPROVED FOR PUBLIC RELEASE; DISTRIBUTION UNLIMITED.
88ABW CLEARED 07/10/2015; 88ABW-2015-3508
24