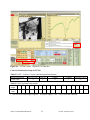
1
STXM Manual SM (10ID-1) Beamline © Canadian Light Source Inc. (CLS) University of Saskatchewan 101 Perimeter Road Saskatoon, Saskatchewan Canada S7N 0X4 SM beamline Phone: 1-306-657-3609 CLS Main (Receptionist) Phone: 1-306-657-3500 CLS User Services Phone: 1-306-657-3700 Fax: 1-306-657-3535 CLS website: http://www.lightsource.ca/ SM beamline website: http://exshare.lightsource.ca/sm/ Table of Contents Table of Acronyms ......................................................................................................................... 3 Scope of the Document ................................................................................................................... 5 SM Beamline Staff and Beam Team Leaders ................................................................................. 7 Past SM Beamline Staff .................................................................................................................. 8 1.0 Checklist before your Arrival ................................................................................................ 9 1.1 Confirm SM beamline time .................................................................................................. 9 1.2 Perform Proposal Amendment if Required........................................................................... 9 1.3 CLS Safety Training and New User Registration ................................................................. 9 1.4 Sending Samples and Equipment to the CLS ..................................................................... 11 1.5 Manuals ............................................................................................................................... 11 1.6 Remote Access .................................................................................................................... 11 2.0 At the SM Beamline .............................................................................................................. 13 2.1 Meeting with Beamline Staff prior to Starting your Experiment ....................................... 13 2.2 SM Beamline Specific Orientation (BSO) .......................................................................... 13 2.3 Laboratory Permits.............................................................................................................. 13 2.4 Permit & Pink Sheet............................................................................................................ 13 2.5 Food and Drink ................................................................................................................... 15 2.6 Floor Coordinator................................................................................................................ 15 2.7 Invoice................................................................................................................................. 15 2.8 CLS Beamline Staff Availability ........................................................................................ 17 3.0 Overview of the SM Beamline and STXM Microscope ..................................................... 19 4.0 PART A: Enabling the SM Beamline.................................................................................. 21 4.1 Starting the STXM Branch Graphical User Interface ......................................................... 21 4.2 Branch Selection ................................................................................................................. 21 4.3 Safety and Photon Shutters/Access Control Information System Panel ............................. 21 4.4 Beamline Safety and SM-Photon Shutters .......................................................................... 25 4.5 Closing the SM Beamline (at the end of the shift).............................................................. 25 4.6 Enabling the SM Beamline (Quick Guide) ......................................................................... 27 5.0 PART B: STXM Microscope Set-up ................................................................................... 29 5.1 Zone Plate Selection ........................................................................................................... 29 5.2 Grating Selection ................................................................................................................ 29 5.3 Energy Selection ................................................................................................................. 33 5.4 Harmonic Selection ............................................................................................................. 35 5.5 Polarization Selection ......................................................................................................... 35 5.6 Constant of Fixed Focus (Cff) ............................................................................................ 37 6.0 PART C: STXM Microscope Optimization ....................................................................... 39 6.1 Verify that Beam is reaching the Detector .......................................................................... 39 6.2 Detector Scan ...................................................................................................................... 41 6.3 OSA Scan ............................................................................................................................ 43 6.4 OSA Focusing Scan ............................................................................................................ 43 6.5 Exit Slits .............................................................................................................................. 45 6.6 Hori_Defl (M3STXM Mirror Pitch) ................................................................................... 45 6.7 EPU Offset .......................................................................................................................... 47 10ID-1 CLS SM STXM MANUAL 2 Version: 24 October 2011 6.8 STXM Microscope Set-up and Optimization (Quick Guide) ............................................. 49 7.0 SM Beamline (STXM) Energy Calibration ........................................................................ 51 APPENDICES ............................................................................................................................. 53 Appendix A: Selecting Parameters for Specific Elements ........................................................... 55 Appendix B: Sample Loading/Unloading ..................................................................................... 56 Appendix C: Sample Preparation.................................................................................................. 58 Appendix D: Data Analysis .......................................................................................................... 60 Appendix E: SM Beamline Polarization Setup ............................................................................. 62 Appendix F: Zone Plate, Order Sorting Aperture (OSA), Sample & Detector Relationship ....... 64 Appendix G: SM Data Access and Data Transfer ........................................................................ 66 Appendix H: Connecting to the Printer in the STXM hutch ........................................................ 70 Appendix I: SM Beamline Computer’s for Users........................................................................ 72 Appendix J: Selecting the optimum Cff value .............................................................................. 74 Appendix K: References ............................................................................................................... 76 Filename: 111024_SM_STXM_BeamlineManual.doc Table of Acronyms Acronym Meaning CLS SM STXM PEEM ACIS STXM Branch GUI SM_BEAMLINE_GUI STXM Control STXM_CONTROL_GUI cff Canadian Light Source Spectromicroscopy Scanning Transmission X-ray Microscope X-ray Photoemission Electron Microscope Access Control Information System STXM Branch Graphical User Interface SM Beamline Graphical User Interface Name of STXM control program STXM Control Graphical User Interface Constant of fixed focus 10ID-1 CLS SM STXM MANUAL 3 Version: 24 October 2011 10ID-1 CLS SM STXM MANUAL 4 Version: 24 October 2011 Scope of the Document The purpose of this manual is to help novice and less experienced Users to set-up the SM beamline and set-up and optimize the STXM End station (i.e., the microscope), in a step by step procedure, including snap shots of the actual buttons to push. Many of the steps are discussed in detail, giving the User some insight into what they are doing, and what the expected outcome should be. After following the steps in this manual the User will be able to enable the SM beamline (Part A) and set-up (Part B) and optimized (Part C) the STXM Microscope, setting the stage for Data Acquisition. For detailed discussion on Data Acquisition see the STXM USER MANUAL. Note that the SM Beamline needs to be enabled first prior to setting up the STXM microscope. Also, included is a section on gas calibration. There is also an Appendix section that deals with Sample Preparation, Sample analysis, Sample Loading/Unloading, Zone plate and sample relationship, data transfer, data analysis, etc. This manual also provides Users with some useful information, including the SM Beamline staff contact information, what a User needs to check before their arrival and what the User can expect upon their arrival at the SM Beamline. 10ID-1 CLS SM STXM MANUAL 5 Version: 24 October 2011 10ID-1 CLS SM STXM MANUAL 6 Version: 24 October 2011 SM Beamline Staff and Beam Team Leaders Chithra Karunakaran Staff Scientist Tel: 1-306-657-3749 [email protected] Jian Wang Staff Scientist Tel: 1-306-657-3546 [email protected] Yingshen Lu Science Associate Tel: 1-306-657-3743 [email protected] James Dynes STXM Research Associate Tel: 1-306-657-3840 [email protected] Adam Hitchcock Stephen Urquhart Beam Team Leader, McMaster University PEEM Leader, University of Saskatchewan Tel: 1-905-525-9140 Ext. 24749 Tel: 1-306-966-4657 [email protected] [email protected] web: http://unicorn.mcmaster.ca web: http://homepage.usask.ca/~sgu703/index.html 10ID-1 CLS SM STXM MANUAL 7 Version: 24 October 2011 Past SM Beamline Staff Uday Lanke PEEM Research Associate Martin Obst STXM Research Associate [email protected] Drew Bertwistle Science Associate [email protected] 10ID-1 CLS SM STXM MANUAL Kon Kaznatcheev Staff Scientist [email protected] 8 Version: 24 October 2011 1.0 Checklist before your Arrival 1.1 Confirm SM beamline time The CLS User Services office usually sends out a remainder to Users of their upcoming beam time one week prior to beam time. The most current beamline schedule for all beamlines is available on the CLS website (http://www.lightsource.ca/operations/schedule.php). A printable copy of the SM beamline schedule, disseminated previously by the SM Beamline Scientist, can be obtained via the SM website http://exshare.lightsource.ca/sm/ or ask the beamline Staff for a copy. If you have any questions, please do not hesitate to contact the beamline staff or the CLS User Services office. 1.2 Perform Proposal Amendment if Required Proposals must be up to date with regards to the samples the Users intend to run during their shifts at the SM beamline, and the samples must receive CLS Health, Safety & Environment (HSE) approval prior to the commencement of the shifts. Changes to on-site personnel should also be updated prior to the commencement of the shifts. Note it is the responsibility of Users to ensure that their proposal is up to date. The amendments must be done on-line, editing their previously submitted proposal. In order to ensure that HSE gives their approval, the changes should be made at least 4 weeks prior to their beam time. Samples not approved by HSE will not be allowed to be run at the SM Beamline. Contact the CLS User Services office if you have any questions regarding proposal amendments. 1.3 CLS Safety Training and New User Registration All new Users must “Complete New Users Registration” and users with expired badges must complete/update their mandatory training prior to access to the experimental floor and laboratories. Please login and view your Experimental Permit at “My Proposals” to identify any additional training or controls to be followed prior to the start of your experiment. These training modules can be completed online prior to arrival at the CLS. This is strongly recommended since it saves a considerable amount of time during the check-in process at the User Services Office. Note the training database is currently housed on a separate server, therefore, if you have not received login details specifically for the training database, please contact mailto:[email protected] for details. The CLS User Services office hours are Monday to Friday from 8:00 a.m. to 4:30 p.m. 10ID-1 CLS SM STXM MANUAL 9 Version: 24 October 2011 10ID-1 CLS SM STXM MANUAL 10 Version: 24 October 2011 1.4 Sending Samples and Equipment to the CLS To ensure the safe and timely delivery of all packages shipped To and From the CLS please follow the instructions detailed on http://www.lightsource.ca/uso/shipping.php for labeling, packing, and shipping. Due to lack of storage space we request that your equipment arrive no more than one week before your beamtime. Users are responsible for the cost of transportation and customs clearance for shipments; C.O.D packages will not be accepted. All packages must be addressed to a permanent staff member of the CLS, preferably to the beamline scientist or science associate responsible for the beamline that you will be using. To expedite outgoing shipments you can make round-trip shipping arrangements from your home institution. Please advise Shipping & Receiving if you have made these arrangements. Please notify the CLSI Receiving [email protected] at least 1 week prior to arrival to advise of any shipments that will arrive before or during your stay. This is especially important if you intend to ship hazardous materials where storage of the shipment may require advance planning; if there are any special handling instructions; or if shipment will require a forklift or crane. Users are responsible for Canada customs clearance and any charges incurred. If they do not have a Canadian Customs Broker, they can ship via Fedex or UPS and complete a One Time Agency Agreement which is available from Fedex or UPS. 1.5 Manuals The SM beamline and microscope STXM operational manuals are available on-line on the SM beamline website at http://exshare.lightsource.ca/sm/ Read them before your arrival at the CLS so that you can use your beam time more efficiently. 1.6 Remote Access Remote access to the SM STXM computer is available. Contact the CLS SM staff for details. 10ID-1 CLS SM STXM MANUAL 11 Version: 24 October 2011 Spectromicroscopy Beamline Quality Assurance Checklist Zone Plate _______________ OSA Hole Size (um) 40 50 60 70 Detector Scan Completed _______ OSA Scan Completed _______ OSA Focus Scan Completed _______ Exit Slits _______ Counts at 395 eV _______ Hz/s 80 Other Comments ______________________________________________________________________ ______________________________________________________________________ ______________________________________________________________________ ______________________________________________________________________ ______________________________________________________________________ ______________________________________________________________________ Beamline Staff that set-up and optimized the STXM Microscope ________________________ Print Name ___________________________ Signature _________________ Date Figure 2.1. Spectromicroscopy Beamline Quality Assurance Checklist. Figure 2.2. Information sheet (pink sheet) to be left with the permit when the User is away from the beamline for more than 30 mins. 10ID-1 CLS SM STXM MANUAL 12 Version: 24 October 2011 2.0 At the SM Beamline 2.1 Meeting with Beamline Staff prior to Starting your Experiment The beamline staff wants to meet with your group at least 30 mins prior to the commencement of your beamtime to discuss your experiment, and the operation of the SM beamline and STXM microscope and go over and sign the Experimental Permit. Note Users will not be allowed to run without an Experimental Permit signed by both the User and beamline staff. For complicated/non-routine STXM experiments additional time may be required to discuss your experiment; please make arrangements with the beamline staff well in advance of your beamtime to ensure that your beamtime is efficiently used. Note, if you need help to prepare your samples prior to your beamtime, please make arrangements with the beamline staff well in advance of your beamtime. The Beamline Staff will ensure that the STXM microscope is set-up initially for the Users first shift. For first time Users or those needing a refresher, the Beamline Staff will go through all the steps for enabling the beamline, and setting up and optimizing the microscope during the first shift, and any subsequent shifts as needed. The SM Beamline Staff will provide the User with a Quality assurance checklist that shows that the STXM microscope is performing as expected (Figure 2.1). 2.2 SM Beamline Specific Orientation (BSO) After successfully completing the CLS safety training the User must also complete the SM Beamline Specific Orientation (BSO) given by the SM beamline staff. The BSO training takes about 20 min, and we ask that you show up at least 20 mins prior to the start of your shift to complete the BSO if possible. For other times make arrangements with the beamline staff. Note to validate the Experimental permit requires that both the staff and User sign the BSO document, only with both parties signature on the permit will the User be permitted to operate the beamline. The BSO must be completed every 2 years. 2.3 Laboratory Permits Laboratory permits are required to use the wet laboratories (Rm. 1071 & 1080) and must be posted in the laboratories at all times during the beamline shift. All persons listed on the Laboratory permit must have completed the laboratory safety module, and the date on which it was completed must also be on the permit. 2.4 Permit & Pink Sheet Prior to using the beamline, the permit must be signed by both a beamline Staff and a User listed on the permit. Make sure that all the samples that are going to be examined are listed and that all approvals have been signed off (e.g., BSO). 10ID-1 CLS SM STXM MANUAL 13 Version: 24 October 2011 10ID-1 CLS SM STXM MANUAL 14 Version: 24 October 2011 If you leave the beamline for more than 30 minutes during your beamtime you must fill out the HSE form BEAMLINE UNATTENDED/BEAMLINE NOT IN USE (i.e., pink sheet) (Figure 2.2) and place it with your permit. The purpose of the pink sheet is so that the CLS Emergency Response Team is made aware of who is on-site in case of an Emergency (e.g., fire). 2.5 Food and Drink Food and drink are allowed at the SM beamline in the User work area. No food or drinks can be taken into the STXM hutch or past the doors to the Beamline Control Computer area/PEEM end station. 2.6 Floor Coordinator The Floor Coordinator’s (FC) roles are to communicate CLS Policies/Procedures to Users, monitor compliance with those policies/procedures, including inspection of the Experimental Permit and perform periodic inspections of all experimental areas. When the SM beamline staff is unavailable, the FC will act as liaison between the Users and the Controls Operator and HSE personnel. They provide first response in the event of accidents/incidents on the experimental floor. They can disable the SM beamline if CLS policies/procedures are not adhered to. They have access to the on-site food, and accept payments. For FC assistance call 657-3639. 2.7 Invoice In your yellow experimental folder there is an invoice for your shifts. We encourage you to pay while at the CLS. Remit payment at the CLS Reception (1-306-657-3500) during normal office hours (8am to 4:30pm) or to the Floor Coordinator outside of normal office hours. Payment methods include: Cash, Cheque, USASK CFOAPAL, Credit Card (Visa, Mastercard). Make cheques payable to "Canadian Light Source Inc." If you have any questions please contact the CLS User Services at 1-306-657-3700 or [email protected]. 10ID-1 CLS SM STXM MANUAL 15 Version: 24 October 2011 10ID-1 CLS SM STXM MANUAL 16 Version: 24 October 2011 2.8 CLS Beamline Staff Availability This page was taken from document 6.7.1.1 Rev. B, dated 2009-02-03. Please see the complete document for more information. Role of the beamline staff: Beamline staff will set up the beamline. They will be present at the scheduled start of the experiment to complete the necessary paperwork, and provide any required safety training. They will train the users to operate the beamline, and will assist new user groups through the first few hours of their experiment. The beamline staff will assist users with their experiments. However, it is not their role to perform experiments for users, including Beam Team members, except by special arrangement. It is the users’ responsibility to provide enough qualified individuals to run the experiment for the duration of the beamtime – note that the CLS has 24 hour operation. Normal working hours: During normal working hours (9am-5pm Mon-Fri) the beamline staff will be present at the CLS, or able to respond at short notice. Note that under the present schedule only three or four user shifts per week fall within these times. Outside normal working hours: Up to 10pm Mon-Fri, and 10am to 10pm weekends and holidays, users may contact the beamline staff for assistance using the contact details provided. If telephoning is indicated, users should use the beamline phone, so that staff can identify that this is likely to be a request for user assistance. A response is not guaranteed, but beamline staff will endeavour to inform users, in advance, of times when no coverage is available. Staff may attempt to solve problems remotely, but may come in to the lab, at their discretion. Outside these hours we request that users do not attempt to contact the beamline staff, unless prior arrangements have been made for additional support. In the event that the Floor Coordinator (FC) is familiar with the beamline, they may be able to offer assistance. However, in general the FC is not authorized to perform technical fixes, and users should not expect the FC to solve technical problems. Since 24 hour support cannot be provided, users should be prepared that on occasion no help will be available until the start of normal working hours. Additional support: Support beyond that detailed above may be available by prior agreement between the users and the beamline staff. As much as possible, arrangements will be make to provide the highest level of assistance for new user groups. If significant assistance with experimental planning, data acquisition and interpretation is required, it is normally expected that the users will treat the beamline staff as collaborators, with appropriate recognition given (e.g. co-authorship). Where practical, additional assistance should be solicited ahead of the user’s experiment. 10ID-1 CLS SM STXM MANUAL 17 Version: 24 October 2011 EPU M1 mirror M2 PGM M3PEEM M3STXM M4PEEM X-PEEM STXM branch Figure 3.1. Layout (top) and photograph (bottom) of the SM facility. A A B STXM END STATION STXM COMPUTER Figure 3.2. STXM Hutch. (A) STXM End Station/Tank, and (B) STXM Control Computer work area. A B C Figure 3.3 (A) Sample Mounting area & Optical Microscope (B) User work area and (C) SM Beamline Control Computer work area. 10ID-1 CLS SM STXM MANUAL 18 Version: 24 October 2011 3.0 Overview of the SM Beamline and STXM Microscope The SM beamline consists of an elliptically polarizing undulator (EPU) located inside the storage ring, the M1 mirror inside the SM hutch, and a plane grating monochromator (PGM) (Fig.3.1). There are two branches on the SM beamline with dedicated end stations, the scanning transmission X-ray microscope (STXM) (Fig. 3.2) and photoemission electron microscope (PEEM) (Fig. 3.1). The STXM branch has 1 mirror (M3STXM) and the PEEM branch has 2 mirrors (M3PEEM, M4PEEM) (Fig. 3.1). Note that only 1 branch is operational at any one time since the M3PEEM mirror must move in front of the M3STXM mirror in order for the PEEM end station to receive beam. There are 2 separate computers, one for operating the SM Beamline (i.e., SM Beamline CONTROL) and one for the STXM (i.e., STXM CONTROL). The User is not permitted to use the “SM Beamline Control” computer unless otherwise directed by the SM Beamline staff. The STXM hutch consists of the STXM endstation/Tank and the STXM CONTROL Computer and display #3 for the SM Beamline CONTROL computer (Fig. 3.2). The SM Beamline work area is located outside the STXM Hutch, consisting of an area for mounting samples, along with an Optical Microscope (VLM) for previewing the samples (Fig. 3.3A). For more detailed sample preparations such as those involving a reaction, the User is to use the wet labs (1071/1080). There is also a User Work area available for data analysis, with space enough for 3 computers (Fig. 3.3B). The SM Beamline Control computer work area is shown in Fig. 3.3C. Table 3.1 summarizes the important parameters of the SM beamline. The energy range of the SM beamline is from 130 to 2500 eV (soft X-ray). A table of the elements accessible in the energy range of the SM beamline, as well as the specific edge, energy range, grating, harmonic and polarization for a particular element is shown in Appendix A (The table is incomplete, so if you do not see the element or edge of interest, contact the Beamline Staff to determine whether the element can be run at the SM beamline). Table 3.1. Summary of SM beamline important parameters. Source Apple II type Elliptically Polarizing Undulator, period=75mm End Stations STXM, PEEM Energy Range 130 to 2500 eV Flux STXM: 108ph/s for a resolving power of R~3000 PEEM:1012ph/s for a resolving power of R~3000 Spatial Resolution STXM: 30 nm; PEEM: 50 nm Nominal 3000, can reach >104 Resolving Power (E/∆E) 10ID-1 CLS SM STXM MANUAL 19 Version: 24 October 2011 Figure 4.1. “STXM Branch” Graphical User Interface accessed from the SM Beamline Control computer. Figure 4.2. STXM, PEEM, SM, OTHER Button on the task bar located on SM Beamline Control Display 2. 10ID-1 CLS SM STXM MANUAL 20 Version: 24 October 2011 4.0 PART A: Enabling the SM Beamline The SM Beamline Computer controls the beamline, including the valves, shutters, EPU, grating and mirrors. The valves and shutters need to be opened before setting-up and optimization of the STXM Microscope. The following sections show in detail how to enable the beamline and is summarized in a Quick Guide (Section 4.6). The sections are presented in the recommended order for enabling the beamline. 4.1 Starting the STXM Branch Graphical User Interface Usually, the “STXM Branch” Graphical User Interface (GUI) (Fig. 4.1) is already running and is visible on the SM Beamline Control monitor Display #3 located in the STXM hutch, left of the STXM Control Monitor (Fig. 3.2B). If the “STXM Branch” GUI is already running proceed to Section 4.2, otherwise, The “STXM Branch” GUI can be accessed from the SM beamline Control Computer, located outside of the STXM hutch (Fig. 3.3C): 1. Make sure you are on the STXM display window and not the SM, PEEM or OTHER window (Fig. 4.2) - button located on the task bar, displayed on SM Beamline Control Computer monitor Display #2. This may be the problem if you are not seeing the “STXM Branch” GUI. 2. To access the “STXM Branch” GUI click on the runSTXM shortcut on the desktop display (Display 2), which opens to the SM Beamline Control monitor Display #1. Drag the “STXM Branch” GUI onto the SM Beamline Control monitor Display #2, which will also be displayed on the SM Beamline Control Display #3 in the STXM hutch, next to the STXM Control computer monitor. 4.2 Branch Selection Ensure that the STXM branch is selected which is indicated in the Branch&Grating Selection section of the “STXM Branch” GUI (Fig. 4.1). Change from the PEEM branch to the STXM branch by clicking on the PEEM icon and dragging down to the STXM icon. The changeover is complete when the yellow “not in position” disappears and is replaced by “Branch 2: STXM”. 4.3 Safety and Photon Shutters/Access Control Information System Panel To protect the SM beamline each section is separated by valves that can isolate each section automatically in the case of a sudden pressure increase or are used to isolate sections during scheduled maintenance/beamline development. Shutters are located in various spots on the beamline to block X-rays from going further downstream in the beamline. 10ID-1 CLS SM STXM MANUAL 21 Version: 24 October 2011 A B Figure 4.3. (A) Safety (SSH) and Photon (PSH) Shutters/Access Control Information System Panel, located on the wall outside the SM hutch at the start of the SM beamline and (B) a close-up of the panel indicator lights and safety shutter button. Figure 4.4. “STXM Branch” Graphical User Interface. 10ID-1 CLS SM STXM MANUAL 22 Version: 24 October 2011 The sample can be loaded prior to opening the shutters and enabling the beamline and/or STXM microscope. The SAMPLE LOADING/UNLOADING procedure is shown in Appendix B. The Safety (SSH) and Photon (PSH) shutters are closed by the Control Room during an injection, when there is a beam dump or for planned maintenance. These shutters must be opened before beam can come down the beamline. The SSH indicator light/button and the PSH indicator light are located on the Access Control Information System (ACIS) Panel (Fig. 4.3). Permission to open the SSH shutter is given by the Control Room and is indicated when all the lights before the SSH shutter are green. Open the SSH by pushing the LARGE GREEN BUTTON, at which time the LARGE RED BUTTON will go off and the GREEN BUTTON on. The PSH shutter can only be opened after the SSH shutter is opened, and is opened from the “STXM Branch” GUI (Fig. 4.4). Note that the SSH and PSH shutters also control the beam access to the REIXS beamline and may be opened by their Users/Staff. If you cannot open the SSH or PSH shutters after the injection is complete, contact the floor coordinator for assistance. Note also, that the SSH and PSH shutters cannot be closed from the STXM CONTROL computer once they are opened. 10ID-1 CLS SM STXM MANUAL 23 Version: 24 October 2011 Figure 4.5. “STXM Branch” Graphical User Interface. 10ID-1 CLS SM STXM MANUAL 24 Version: 24 October 2011 4.4 Beamline Safety and SM-Photon Shutters The SM-PSH shutter is to be closed whenever there is a grating or branch change to protect the PGM. The BSH shutter is to be closed whenever there is a sample change or the STXM Endstation is being accessed, thereby protecting the User from the X-rays. 1. To Open/Close the SM-PSH or BSH shutters click on the OPEN or CLOSED buttons (Fig. 4.5). 2. Click the “OpenBM” button. There should now be beam to the STXM End Station. Follow the procedures in Section 5 to verify that there is beam to the STXM Microscope. 4.5 Closing the SM Beamline (at the end of the shift) At the end of the shift we want to prevent beam from hitting the mirrors, particularly the M1 and silicon nitride window on the zone plate snout, as this will extend their life and cut down on carbon contamination. This is accomplished by closing the shutters and variable aperture (Fig. 4.5). 1. Close the SM-PSH shutter 2. Close the BSH shutter 3. Click the “CloseBM” button. 4. Turn OFF the detector. 10ID-1 CLS SM STXM MANUAL 25 Version: 24 October 2011 10ID-1 CLS SM STXM MANUAL 26 Version: 24 October 2011 4.6 Enabling the SM Beamline (Quick Guide) Enabling the SM Beamline (Quick Guide) (“STXM Branch” GUI, unless otherwise stated) 4.0 Enabling the SM Beamline (Samples can be loaded at any time) 4.1 Start STXM Branch GUI- usually already displayed 4.2 Branch Selection (Close SM-PSH shutter)- Select STXM branch if on PEEM Branch 4.3 Open safety shutter (only after injection) – Green button on ACIS panel and Open PSH shutter 4.4 Open SM-PSH and BSH shutters 4.2 Grating or Branch Change 1. Close SM-PSH shutter Branch change (only necessary if on PEEM branch) a. Click on PEEM icon and drag down to STXM icon Grating change a. Click HOME– when complete indicates DONE b. Click the appropriate grating (e.g., LEG, MEG, HEG) – when complete a number is indicated (250=LEG, 500=MEG, 1250=HEG) 2. Open SM-PSH shutter Sample Change (Appendix B) 1. Close SM-PSH and BSH shutters 2. Turn OFF the Detector 3. Move “Coarse Z” to 5000 um 4. Open vent valve to let air into the STXM End Station 4.5 Closing the Beamline – at the end of the shift 1. Close SM-PSH and BSH shutters 2. CloseBM 3. Turn OFF the Detector 10ID-1 CLS SM STXM MANUAL 27 Version: 24 October 2011 Figure 5.1. STXM Control window when the computer restarts. Table 5.1. Preferred grating and harmonic settings as a function of photon energy. Energy Range Polarization Grating Harmonic (eV) 1st LinHor, CirRight, 130 to 750 LEG CirLeft LinHor, CirRight, 330 to 1000 MEG 1st CirLeft 1000 to 1800 MEG 3rd LinHor th 1800 to 2500 MEG 5 LinHor th th >2200 HEG 5 or 7 (not well characterized) LinHor 10 12 Flux (ph/s/500mA/R=3000) 4 2 10 11 6 4 2 10 10 6 4 2 10 LEG (250 l/mm) MEG (500 l/mm) HEG (1250 l/mm) 9 200 10 B 6 Flux (ph/s/500mA/R=3000) A 10 10 12 10 10 10 10 400 600 Energy (eV) 800 1000 cff ~2.0 for all; except HEG 3rd,5th,7th cff ~2.5 11 9 8 7 1st-Harmonics LEG MEG 3rd-Harmonics MEG HEG 5th-Harmonics MEG HEG 7th-Harmonics HEG 500 1000 HEG 1500 Energy (eV) 2000 Figure 5.2. Photon flux as a function of energy at the STXM exit slits for (A) First order light using circular polarization, and (B) First, third and fifth order light using linear horizontal polarization. 10ID-1 CLS SM STXM MANUAL 28 Version: 24 October 2011 2500 5.0 PART B: STXM Microscope Set-up The following assumes that the SM beamline has been enabled. The STXM computer controls the microscope set-up and optimization and data acquisition (See STXM User Manual for details on data acquisition), and is located inside the STXM hutch (Fig. 3.2A). Sometimes it is necessary to “restart” the computer, which is done through the Windows software or by rebooting the STXM computer (button located on the front of the computer) (Fig. 3.2A) If the STXM computer is restarted, the User must log back on and the screen opens to Figure Fig. 5.1. The login selection and password (PW) are found on the bottom left of the STXM Control computer screen monitor, and the PW is case sensitive. Note, usually the sample is loaded previous to setting up and optimizing the STXM Microscope. To see the loading procedure, as well as the sample plate design and numbering system see Appendix B. Also, Users need to understand the relationship between the zone plate, order sorting aperture (OSA), Sample and Detector, which is discussed in Appendix D. We encourage new Users to look at Appendix D before proceeding. 5.1 Zone Plate Selection There are a number of Zone Plates that can be used, defined by their spatial resolution, mainly 25, 35 and 40 nm. For energies before ~280 eV the 40 nm zone plate must be used as the focal length of the 25 and 35 nm prevent their use due to physical constraints. Only Beamline Staff can change zone plates. It takes about 20-30 mins to change a zone plate and set-up the microscope again. Experiments should be planned so that the changing of zone plates is kept to a minimum. 5.2 Grating Selection The SM beamline has 3 gratings, the low energy grating (LEG, 250 l/mm), the medium energy grating (MEG, 500 l/mm) and the high energy grating (HEG, 1250 l/mm). The flux of the gratings is energy dependent, thus, choosing the appropriate grating depends on the element of interest. Table 5.1 shows the photon energy range of each grating and the photon flux as a function of energy (Fig. 5.2). 10ID-1 CLS SM STXM MANUAL 29 Version: 24 October 2011 Figure 5.3. “STXM Branch” Graphical User Interface. 10ID-1 CLS SM STXM MANUAL 30 Version: 24 October 2011 Note changing the grating will result in the energy being changed. 1. To change gratings first click on the “HOME” button on the “STXM Branch” GUI (Fig. 5.3), this moves the PGM tank to a set position. The ”green” button will change to “yellow” when the tank is moving, and back to “green” when the tank has stopped moving. Note it may be necessary to click the ``HOME`` again as sometimes the move is not completed as evident by `DONE` not appearing and the `not in position`` stops flashing. 2. Then click on the desired grating (i.e., LEG, MEG or HEG) (Fig. 5.3), and while the grating is moving the display will show “not in position” and will display the numbers 250 (LEG), 500 (MEG) or 1250 (HEG) when complete. Following this procedure ensures that the energy calibration is more reproducible. If the grating is selected without pushing the “HOME” button the energy scale may change by up to 0.3 eV from its previous setting when changing gratings. 10ID-1 CLS SM STXM MANUAL 31 Version: 24 October 2011 Cursor STATIC Figure 5.4. “STXM Control” Graphical User Interface. Many of the menus have pull downs. Current Zone Plate Calculated Zone Plate Position Figure 5.5. Zone Plate focus parameters and Ao (OSA to Sample distance (um)). 10ID-1 CLS SM STXM MANUAL 32 Version: 24 October 2011 5.3 Energy Selection CAUTION: There is a risk of crashing the zone plate into the Order Sorting Aperture (OSA) when going from HIGHER ENERGY to LOWER ENERGY. The next couple of steps are to protect the zone plate from crashing into the OSA. We will now use the “STXM Control” Graphical User Interface (GUI)) (Figure 5.4) to change the energy. 3. Change the zone plate `focus` from AUTO to STATIC (``focus`` window, bottom middle) (Fig. 5.4). This is done by dragging from the AUTO to STATIC. In the static mode, the zone plate will not move when a new energy value is entered. 4. Enter 395 eV in the Destination box (or the Energy for your experiment) and either press the ``Go`` button or Enter. This will calculate the position that the zone plate should move to using the current Ao value. Note that the Ao value is the expected sample position relative to the OSA. Thus, the focal length (f) is calculated based on the distance of the zone plate from the OSA (Z) and the distance from the OSA to the Sample (Ao) (f = Z + Ao). Ao increases with increasing energy. The reason that we change the Ao instead of just moving the zone plate further back from the OSA is due to alignment issues and physical constraints. So if we move from higher energy to lower energy, the calculation of the new focal length is based on the Ao from the higher energy, subsequently the zone plate position is moved closer to the OSA to satisfy f = Z + Ao. Consequently, the zone plate may crash into the OSA when moving from higher energy to lower energy. 5. Change Ao to the recommended value. To see the recommended Ao value, click on the ``S`` box next to the ``Focus`` box (AUTO or STATIC displayed) (Fig. 5.4), which opens into a new window (Figure 5.5). The maximum Ao for the current energy estimation is shown on the bottom right. Select an Ao value less than the maximum, usually within about 50 um of the Ao maximum. The exact Ao value is not that critical as the zone plate position will adjust accordingly. Input the new Ao (top left) and click OK. Also, notice the zone plate that is currently being used, indicated by the round circle being filled. 6. Change the zone plate focus back from STATIC to AUTO. If this is not done, the zone plate position will not change with a change in energy. 7. Click on the energy `Go`` button. Observe that the Zone Plate position changes. At this time it would be advantageous to look through the STXM Tank viewport and estimate the distance between the zone plate and the OAS. The expected value is that shown by the ZonePlate box. If you think the zone plate and OSA are touching you may need to open the STXM Tank. Note, if the zone plate and OSA are touching, and you continue to acquire data, irreversible damage may result to the zone plate and/or the OSA. Call the Beamline Staff to assist you before damaging that $10,000 zone plate. 10ID-1 CLS SM STXM MANUAL 33 Version: 24 October 2011 Figure 5.6. “STXM Control” Graphical User Interface. Codes for Polarization Setup for STXM Table 5.2. EPU –Vertical, Circular, and Horizontal Polarizations Actual Polarization IncVert (-90) CirLeft LinHor STXM value -2 -1 0 CirRight 1 IncVert (+90) +2 Table 5.3. EPU-Inclined Polarizations 1 Actual -80 -70 -60 -50 -40 -30 -20 -10 10 20 30 40 50 60 70 80 Angle STXM 20 30 40 50 60 70 80 90 110 120 130 140 150 160 170 180 value 1. Add 100 to the actual angle required, 80 (Actual Angle) + 100 = 20 (STXM value entered). 10ID-1 CLS SM STXM MANUAL 34 Version: 24 October 2011 5.4 Harmonic Selection The harmonic determines the EPU gap settings, which influences the flux. The recommended harmonic for each energy range is displayed in Table 5.1 or for each element in Appendix A. 1. To change the harmonic drag down to the desired harmonic using the EPU Harmonic box on the “STXM Control” GUI (Fig. 5.6) or click on the HARMONIC button on the “STXM Branch” GUI (Fig. 4.1). It is preferable to use the “STXM Control” GUI as the parameters file is updated, whereas making the change in the “STXM Branch” GUI does not update the parameter file. Note, initial optimization of the microscope is usually done at 395 eV (just below the N K-edge), so initially use the values for N K-edge (i.e., harmonic 1). 5.5 Polarization Selection The SM beamline is designed to produce plane horizontal (LinHor) or vertical (IntVert- (90°), IntVert+ (+90°), circular left (CirLeft) or right (CirRight) and linear polarized light (LinInc) with the polarization planes inclined at any angle (see Appendix C for more details). For nonmagnetic samples, where no change in polarization is required, 3 settings are available (LinHor, CirLeft or CirRight). The polarization influences the flux at a selected energy, thus, the polarization selection depends on the element of interest. The recommended polarization for each energy range is shown in Table 5.1 or for each element in Appendix A. Note, initial optimization of the microscope is usually done at 395 eV (just below the N K-edge), so initially use the values for N K-edge (i.e., polarization either CirLeft or CirRight) 1a. To change polarization enter the appropriate value in the EPU Polarization box (CirLeft=-1, CirRight=1, LinHor=0, IntVert -90°=-2 and IntVert +90°=+2) (Table 5.2) on the “STXM Control” GUI (see Fig. 5.6) or click on the MODE button in the “STXM Branch” GUI (Fig. 4.1), and drag down to the appropriate polarization. The advantage of making the change in the “STXM Control” GUI is that the polarization used is recorded with the data; otherwise the previous polarization is recorded with the data. For magnetic samples, where a change in polarization is required (e.g., X-ray magnetic circular dichroism (XMCD) studies), the angle can be varied from 20 to 180 degrees. 1b. To change polarization enter the appropriate value in the EPU Polarization box (Table 5.3) on the “STXM Control” GUI or click on the MODE button, and drag down to LinInc and enter the appropriate value for the angle. To obtain the actual angle required a value needs to be entered into the ANGLE box. The value to enter is determined by adding 100 to the angle required. For example, for an actual angle of -80°, enter the value 20 (-80 + 100). See Table 5.3 for the values for angles for every 10°, starting at -80°. 10ID-1 CLS SM STXM MANUAL 35 Version: 24 October 2011 10ID-1 CLS SM STXM MANUAL 36 Version: 24 October 2011 5.6 Constant of Fixed Focus (Cff) The constant of fixed focus (Cff) value controls the angles for the M1 mirror and the grating of the PGM, which determines the amount of the reflected and diffracted light hitting the M3STXM mirror. Generally the higher the reflected light, the better the spectral resolution, while the higher the diffracted lighted the higher the flux. Usually the Cff value is set at 2.15, a value that gives a resolving power over 3000 and good flux. By increasing the Cff value, the resolving power will increase at the expense of the flux (Appendix J). The Cff value is displayed on the “STXM BRANCH” GUI but can only be changed from the “SM Beamline Control” GUI (not shown). To change the Cff value consult with Beamline Staff. 10ID-1 CLS SM STXM MANUAL 37 Version: 24 October 2011 Figure 6.1. Photomultiplier Tube (PMT) High Voltage Controller on top of the STXM Tank. Remember to turn off the High Voltage when opening the STXM Tank to light. Spectrum and Counts Displayed Here Cursor Figure 6.2. “STXM Control” Graphical User Interface. 10ID-1 CLS SM STXM MANUAL 38 Version: 24 October 2011 6.0 PART C: STXM Microscope Optimization The STXM Microscope is optimized by maximizing the flux for a particular set-up. 6.1 Verify that Beam is reaching the Detector It is assumed that the beamline has been enabled, that is, all valves and shutters are open including the variable aperture. The STXM microscope is routinely optimized at 395 eV as there is lots of flux and the amount of flux expected is well known. Thus, to verify that the detector is responding to the beam, we will use the set-up conditions for 395 eV (See Section 5 for details). Grating: MEG Harmonic: 1 Polarization: CirLeft or CirRight Energy: 395 eV Exit Slits: 20/20 (Dispersive/Nondispersive) (see below for details) Also, it is assumed that a sample plate with samples has been loaded (See Appendix B for the procedure for Loading/Unloading a sample) and that the STXM tank has been pumped and filled with 1/6 atmosphere of He. 1. Turn on the PMT detector by turning on the high voltage controller, which is usually sitting on top of the STXM chamber (Fig. 6.1). The voltage should be around 1050 V. 2. Move to an open hole on your sample plate (assumes a sample is loaded). See Appendix B for the sample plate coordination system. 3. Move the sample holder to 3000 um using ``Coarse Z`` (the distance can visually confirmed). This distance is just to ensure that the sample holder is not blocking the beam. For looking at actual samples, the expected position between the sample holder and OSA is about +300 um larger than the Ao value (e.g., Ao = 300, expect Coarse Z about +700 for a Si3N4 window). CAUTION is advised though, as sometimes the calibration of the Coarse Z scale goes off. Thus, it is usually better to gradually move (e.g., starting position = Ao + 1000 um) the Coarse Z closer (i.e., sample holder) and use the focus as the guide. 4. On the spectral display window (top right corner) on the “STXM Control” GUI (Fig. 6.2) the counts from the detector are displayed. If you see a spectrum on a yellow background it means that the detector counts are not being displayed. Click on the CHART button (very top right) to get the count screen. If the detector is connected to the STXM computer, and the HV is turned on there should be counts around 400 in the display, even if the SM-PSH and BSH shutters are closed. If the counts are reading 0 (i.e., flat line as shown) it means that the 10ID-1 CLS SM STXM MANUAL 39 Version: 24 October 2011 Figure 6.3. “STXM Control” Graphical User Interface. B A Figure 6.4. (A) Detector scan parameters and (B) detector scan image. 10ID-1 CLS SM STXM MANUAL 40 Version: 24 October 2011 detector is probably not connected to the STXM computer. Consult with the Beamline Staff for possible solutions. 5. Open the shutter on the “STXM Control” GUI by changing the ``AUTO`` to ``OPEN (Fig. 6.3). There should be an increase in the number of counts. Usually we expect around 800,000+ counts at 395 eV, depends on exit slit size, zone plate and whether the microscope has been optimized. Nevertheless, as long as the counts were observed to increase (e.g., 2000) when the shutter was opened it should be possible to optimize the microscope using the procedures outlined below. Note, the shutter is usually left in the ``AUTO`` `position, opening automatically when acquiring data. 6. If there was no increase in the counts, it indicates that the beam is possibly being blocked. To trouble shoot consider the following: a. PMT detector is turned on; b. You are in an open hole on the sample plate; c. Valves are opened; d. OSA is aligned (see below); e. Detector is aligned (see below). 6.2 Detector Scan For the best sensitivity, the detector needs to be aligned with the beam. The Detector Scan menu can be accessed from the Scan Control by dragging down to the Detector Scan (Fig. 6.3). The usual parameters for a detector scan are shown in Figure 6.4A. Click “Begin Scan” and the expected result of a well centered detector is shown in Figure 6.4B. To align the detector, move the cursor to the centre of the Detector image by clicking on the detector image, which will activate the “Detector to Cursor + Set to 0,0” button on the left hand side under the image display window. Click on the “Detector to Cursor + Set to 0,0”button. If the detector is not found there are likely three reasons. First, you may not be in a hole and the sample/sample plate is blocking the beam- make sure you are in a hole. Secondly, the OSA may not be aligned and is blocking the beam. Move the OSA out of way by clicking on the “OSA Out” button. Do another detector scan. Remember to put the OSA back by clicking the “OSA In” button. Finally, the detector may not be aligned, increase the scan size from the usual 1000 x 1000 um to 2500 x 2500 um. Do another detector scan. If the detector is still not found contact the Beamline staff for assistance. Note that the detector scan usually only needs to be done once, at the beginning of the shift, to confirm that the detector is well aligned. 10ID-1 CLS SM STXM MANUAL 41 Version: 24 October 2011 A B Zone plate D OSA Figure 6.5. (A) OSA scan parameters, (B) OSA scan at 300 eV (70 x 70 um) and (C) OSA scan at 300 eV of the OSA and ZP (300 x 300 um) and when ZP in focus (is checked) A B C Figure 6.6. (A) Normal OSA focus scan parameters, (B) Green line on OSA image (C) OSA focus scan 10ID-1 CLS SM STXM MANUAL 42 Version: 24 October 2011 6.3 OSA Scan The purpose of the OSA is to filter out zero order light (Appendix F), requiring that the OSA be well aligned with the beam. The OSA Scan menu can be accessed from the Scan Control by dragging down to the OSA Scan (Fig. 6.3). The usual parameters for an OSA scan are shown in Figure 6.5A. Make sure that the ``ZP in focus`` box is not checked at this time. Click “Begin Scan” and the expected result of a well centered OSA at 395 eV is shown in Figure 6.5B. To align the OSA, estimate the centre of the OSA (i.e., bright circle) and move the cursor to the centre of the OSA by clicking on the OSA image, which will activate the “OSA to Cursor + Set to 0,0” button on the left hand side under the image display window (not shown), appears in place of the “Sample To Cursor” and “Sample to Cursor Coarse” buttons (Fig. 6.3). Click on the “OSA to Cursor + Set to 0,0” button to mark the centre of the OSA as 0 (OSA X), 0 (OSA Y) If the OSA is not found within the usual 70 x 70 um scan size, the likely reason is that it was bumped during sample loading, increase the size to 300 x 300 um and do another OSA Scan. Centre the OSA as outlined above. The accuracy of centering the OSA is better at 70 x 70 um than 300 x 300 um, so repeat at 70 x 70 um. If the OSA is still not found contact the Beamline staff for assistance. To check the size of the OSA hole, check the `ZP in focus`` box and repeat the OSA scan at 70 x 70 um. The expected result is shown in Figure 6.5C. The size of the OSA can be determined by clicking on the left and right edges of the OSA. Generally, the 50 um OSA hole is used. DO NOT Align the OSA now- just for reference. To see the OSA and Zone plate the range is increased to 300 x 300 um (Figure 6.5D). DO NOT Align on the 300 x 300 image- just for reference/uniformity of the zone plate. Note, the OSA scan should be done whenever loading a sample to verify that it was not bumped during the sample change. Also, an OSA scan could be done when changing to different edges, particularly if there was a large energy change (e.g., 500 eV). 6.4 OSA Focusing Scan The OSA Focus Scan is done to calibrate the Zone Plate scale using the OSA as the reference point. The OSA Focus Scan is done right after the OSA Scan. The OSA Focus Scan menu can be accessed from the Scan Control by dragging down to the OSA Focus Scan (Fig. 6.3). The usual parameters for an OSA focus scan are shown in Figure 6.6A. Note a Green Line appeared onto the OSA image when the OSA focus scan was opened (Figure 6.6B). Usually it is not necessary 10ID-1 CLS SM STXM MANUAL 43 Version: 24 October 2011 Figure 6.7. “STXM Control” Graphical User Interface. 10ID-1 CLS SM STXM MANUAL 44 Version: 24 October 2011 to move the Green line. Click `Begin Scan`` and expected image of a calibrated zone plate is shown in Figure 6.6C. Move the cursor to the focused position by clicking on the OSA focus scan image, which will activate the “Focus to Cursor + Set ZP calibration`` button (not shown), appears in place of the “Sample To Cursor” and “Sample to Cursor Coarse” buttons (Fig. 6.3). Click on the “Focus to Cursor + Set ZP calibration`` If it was not possible to see the focal point, it may be because the zone plate was way out of focus. Consult the Beamline Staff for assistance. Usually, the OSA Focus Scan needs to be conducted only when initially setting up the microscope at 395 eV. The OSA Focus Scan can be done after every OSA Scan (usually not necessary), however, above 1000 eV there can be problems. Ask the Beamline staff for details. 6.5 Exit Slits The exit slit controls the beam size, in both the vertical and horizontal directions, that hits the zone plate. While the flux is determined by both the Dispersive (vertical) and Nondispersive (horizontal) exit slits (Fig. 6.7), only the Dispersive slit influences the spectral resolution. Hence, the nondispersive exit slit can be opened larger than the dispersive exit slit to increase the flux but maintain the desired spectral resolution. The exit slits are usually selected so that the maximum flux is < 20 MHz. The exit slit size is often displayed as the Dispersive/Nondispersive slits (e.g., 20/20). The size of the exit slits are adjusted to prevent saturation of the PMT detector as a linear response is necessary for quantification and good image quality. The PMT saturates when the Io signal intensity is above 20 MHz/s. Click on the CHART button (very top right) to get the count screen. The chart units are Hz/s. The PMT is usually set to PMT/10. So a chart reading of 2 x 10⁶ Hz/s is equal to 20 MHz (multiply by 10 for the PMT and 1 MHz = 106 Hz). On your image, for 2000 Hz/ms maximum = 20 MHz/s for a dwell time of 1 ms (2000 Hz/ms x 10 (PMT/10) x 1000 ms/s). So when counts > 2000 on an image may indicate that your detector is saturated (if your frame is in the image counts may be > 2000). Since the signal intensity is a function of the energy, the selection of the energy at which the exit slit size is adjusted to keep the intensity < 20 MHz/s is usually done at the lowest energy of the edge that you will collect a stack/line scan, as generally the Io signal intensity decreases with increasing energy (Figure 5.2). For example at the Fe L-edge, use 695-700 eV. For the C Kedge we generally set-up at 300 eV because of the big dip in the C K-edge Io signal due to C contamination on the optics and windows; the flux at 300 eV is usually around 10 MHz with slits 35/35 and the Ti filter in but above 20 MHz at 320 eV which is OK. 6.6 Hori_Defl (M3STXM Mirror Pitch) The position of the beam on the M3STXM mirror changes slightly with a change in energy. That is, the beam moves off of the best spot on the M3STXM mirror, resulting in a reduction in 10ID-1 CLS SM STXM MANUAL 45 Version: 24 October 2011 Figure 6.8. “STXM Control” Graphical User Interface. Figure 6.9. (A) Hori_Defl_(urad) (M3STXM pitch) window opens by clicking on “S” 10ID-1 CLS SM STXM MANUAL 46 Version: 24 October 2011 the intensity of the beam. The loss in intensity can be corrected for by adjusting the pitch of the M3STXM Mirror. The M3STXM pitch is shown on the “STXM CONTROL” GUI as the Hori_Defl_(urad) box (Fig. 6.8). Click on the “S” button beside the Hori_Defl box, opening to Figure 6.9. Under the JOG, enter 1 if not already entered (sometimes 0 if STXM Control program was restarted). Clear the Chart display (“Clear” button top left of display) to make it easier to see small changes. Use the red arrows left and right of the JOG box to maximize the intensity. If the signal is going down, use the other arrow. Be patient between each movement, as there is a backlash sometimes and the signal may actually decrease initially then increase. When optimized, close the Hori_Defl “S” display. You may need to readjust the exit slits so that the Io signal maximum is < 20 MHz/s. 6.7 EPU Offset The position of the beam relative to the EPU Gap changes slightly with a change in energy. That is, the beam may be off centre of the EPU Gap, resulting in a reduction in the intensity of the beam. The loss in intensity can be corrected for by adjusting the “EPU Offset” (Fig. 6.8). Adjust the “EPU Offset” by 0.05 to 0.1 units (negative or positive) until the maximum signal is realized. Note, you must click on the “SET” button to implement the change. Confirm that the change was made by comparing that the actual and input values are the same. Clear the display (Clear button top left of display) to make it easier to see small changes. The “EPU Offset” is usually between -0.3 and 0.3. You may need to readjust the exit slits so that the Io signal maximum is < 20 MHz/s. 10ID-1 CLS SM STXM MANUAL 47 Version: 24 October 2011 10ID-1 CLS SM STXM MANUAL 48 Version: 24 October 2011 6.8 STXM Microscope Set-up and Optimization (Quick Guide) STXM Microscope Set-up and Optimization (Quick Guide) Use “STXM Control” GUI Consult the manual for complete details STXM Set-Up 5.1 Select Zone Plate (Discuss options with Beamline Staff) 5.2 Select Grating 5.3 Select Energy CAUTION : Changing from High to Low Energy. a) Change zone plate focus from “AUTO” to “STATIC” b) Enter Energy c) Change Ao (click on “S” to open new screen) d) Change zone plate focus from “STATIC” to “AUTO” e) Click Energy “Go” button 5.4 Select Harmonic 5.5 Select Polarization STXM Optimization 6.1 Verify the Beam is reaching the Detector Change “AUTO” to “OPEN” to open the shutter If no beam check that: a. PMT detector is turned on; b. You are in an open hole on the sample plate; c. All valves are open; d. OSA is aligned (see below); e. Detector is aligned (see below). 6.2 Detector Scan 6.3 OSA Scan 6.4 OSA Focus Scan 6.5 Adjust Exit Slits (< 20 MHz/s counts, 2 x 10⁶ on display) 6.6 Adjust Hori-Defl (urad) (i.e., M3STXM Mirror Pitch) 6.7 Adjust EPU Offset 10ID-1 CLS SM STXM MANUAL 49 Version: 24 October 2011 A B Vacuum Pump Switch Digital Pressure Gauge Analogue Pressure Gauge C D E Gas Inlet Valve STXM pump valve Tank Valve Figure 7.1. (A) Gas Cylinders at the SM entrance, (B) Vacuum pump switch and gas inlet values for He, CO2, Ne and N2 , (C) Analogy Gas gauge for measuring He level in the STXM Tank, (D) Digital gauge for measuring gases pressure for calibration, and (E) Vacuum pump value. Table 7.1. Gas Calibration Lines for STXM. Edge Gas Line Energy, eV S 2p SF6 A1g (1/2) 173.44 4s Ryd (3/2) 177.42 T2g (1/2) 184.57 S 1s SF6 C 1s CO2 N 1s N2 O 1s O2 CO2 F 1s SF6 Ne 1s Ne π*(v=0) 3s(v=0) 3p(v=0) π*(v=0) 3s(v=0) 3p(v=0) π*(v=3) Rydberg π*(v=0) 3s(Ryd) 6a1g 2t2g 3p 4p 10ID-1 CLS SM STXM MANUAL 290. 74 292.74 294.96 400.87 406.150 407.115 530.75 541.85 535.4 538.9 688.0 698.9 867.12 868.69 50 References Hudson et al, Phys Rev A 47 (1993) 361 Ma et al, Phys Rev A 44 (1991) 1848 Chen et al, Phys Rev A 40 (1989) 6737 Prince et al, J. Elec. Spect. 42 (1999) 141 Ma et al, Phys Rev A 44 (1991) 1848 Hitchcock et al, J. Elec. Spect. 42 (1987) 11 Francis et al, Phys Rev A 52 (1995) 4665 Coreno et al, Phys Rev A 59 (1999) 2494 Version: 24 October 2011 7.0 SM Beamline (STXM) Energy Calibration The energy scale of the beamline is calibrated generally about 3 or 4 times a year by the Beamline Staff, taking about 4 hours to complete. However, for many reasons, the energy scale may change after the calibration procedure. Thus, Users are recommended to use reference compounds (with known peak positions) and/or compressed gases to accurately adjust the energy scale of their collected data. Compressed gases available for calibration at the beamline include carbon dioxide, nitrogen, neon and SF6 (check for availability). The carbon dioxide, and nitrogen are outside the STXM hutch near the entrance to the SM beamline, while Ne is in a small cylinder inside the STXM hutch (Fig. 7.1). Gas Calibration Procedure (Note, only Beamline Staff are permitted to change the gas cylinders) 1. Identify the gas that is closest to your energy of interest (Table 7.1). 2. Remove the sample or move to a hole in the sample plate (Gas calibration can be done with your sample inside the STXM Tank). 3. Pump the STXM Tank to below 200 mTorr, making sure that the pump value is closed when the pump is first started, then open the value after the pump is started. Note the End Station should be opened to atmosphere if it was filled with He, as He is very difficult to pump. 4. Fill the STXM Tank with the recommended pressure of gas (Table 7.2) using the digital gauge. If too much gas is allowed into the Tank, pump the excess gas out until the desired pressure is reached. 5. Select the size of the Exit Slits (Table 7.2). 6. Collect a “Point Scan” through an empty hole. The calibration parameters are found in the Folder “Gas-Calibration”. 7. Examples of the spectra are shown in Figure 7.2 (next page). Table 7.2. Parameters used for the Compressed Gases. Edge Gas Pressure (Torr) Exit Slit Size (µm) Carbon CO2 3 30x30 Nitrogen N2 2 30x30 Oxygen O2 (Air) or CO2 7 30x30 Neon Ne 20* 10x10 Fluorine SF6 3 15x15 Sulfur SF6 * The gauge has trouble reading the Neon, so fill to 10 Torr, and it will continue to increase. 10ID-1 CLS SM STXM MANUAL 51 Version: 24 October 2011 C1s: CO2 N1s: N2 Expected 400.87 eV Actual 401.06 eV Difference +0.81 eV Expected 294.96 eV Actual 294.03 eV Difference +0.93 eV O1s: CO2 Expected 539.0 eV Actual 538.95 eV Difference +0.05eV Ne1s: Ne Expected 867.12 eV Actual 867.06 eV Difference +0.06 eV Expected 688.0 eV Actual 688.6 eV Difference -0.6eV F1s: SF6 Figure 7.2. Gas spectra used for calibrating at the C, N, O, F and Ne 1s edges. 10ID-1 CLS SM STXM MANUAL 52 Version: 24 October 2011 APPENDICES 10ID-1 CLS SM STXM MANUAL 53 Version: 24 October 2011 10ID-1 CLS SM STXM MANUAL 54 Version: 24 October 2011 Appendix A: Selecting Parameters for Specific Elements The table is incomplete, consult with the Beamline Staff for elements not listed. * Element Edge Energy Grating Harmonic Polarization Normal Exit Slits Range (eV) (Dispersive/Nondispersive) B K 185-220 LEG 1st LH, CR, CL 35/35 st C K 280-320 LEG 1 LH, CR, CL 35/35 (Ti Filter), 25/25 st N K 390-460 LEG 1 LH, CR, CL 20/20 O K 520-560 MEG 1st LH, CR, CL 15/15 st F K 675-715 MEG 1 LH, CR, CL 10/10 st Ne K 865-870 MEG 1 LH, CR, CL 10/10 Na K 1060-1090 MEG 1st LH 15/15 st Mg K 1295-1320 MEG 1 LH 15/15 rd Al K 1550-1610 MEG 3 LH 15/15 Si K 1835-1890 MEG 5th LH 30/30 th P K 2135-2165 MEG 5 LH 40/40 P L 125-155 LEG 1st LH, CR, CL 40/40 S K 2415-2500 MEG 35/35 st S L 155-190 LEG 1 LH, CR, CL 40/40 Cl L 190-215 LEG 1st LH, CR, CL 35/35 st K K 290-320 LEG 1 LH, CR, CL 35/35 (Ti Filter), 25/25 st Ca L 340-360 LEG 1 LH, CR, CL 25/25 Ti L 450-490 MEG 1st LH, CR, CL 20/20 st V L 505-560 MEG 1 LH, CR, CL 20/20 st Cr L 570-600 MEG 1 LH, CR, CL 15/15 Mn L 630-670 MEG 1st LH, CR, CL 12/12 st Fe L 690-730 MEG 1 LH, CR, CL 8/8 st Co L 770-810 MEG 1 LH, CR, CL 8/8 Ni L 845-885 MEG 1st LH, CR, CL 8/8 st Cu L 920-950 MEG 1 LH, CR, CL 20/20 Zn L 1010-1080 MEG 3rd LH 15/15 rd Ga L 1105-1165 MEG 3 LH 20/20 rd As L 1320-1390 MEG 3 LH 20/20 Se L 1420-1520 MEG 3rd LH 20/20 st Cd M 390-435 MEG 1 LH, CR, CL 25/25 th Au M 2150-2400 MEG 5 LH 35/35 Ru M 445-475 MEG 1st LH, CR, CL 25/25 st Ag M 340-390 MEG 1 LH, CR, CL 25/25 st Sn M 480-510 MEG 1 LH, CR, CL 25/25 * Exit slits estimated, always adjust so that maximum intensity < 20 MHz. 10ID-1 CLS SM STXM MANUAL 55 Version: 24 October 2011 Appendix B: Sample Loading/Unloading Appendix B: Sample Loading/Unloading Recommend that gloves be worn when loading/unloading samples. Before opening the STXM Tank the following is required: 1. Turn OFF the Detector (extents the life of the detector) 2. Move the sample holder away from the OSA and Zone Plate by moving ``Coarse Z`` to 5000 (STXM_CONTROL_GUI) 3. Close the BSH shutter (on “STXM Branch” GUI, protects User from X-rays) 4. Open the vent valve on the STXM tank to break the vacuum (may already be at atmosphere) 5. Record the sample information, sample position and the empty hole positions (Figs. B1, B2) in your logbook. Open the STXM Tank by removing the left front plate. 1. Remove the sample plate (if applicable) which is held by clips on the Sample Holder (Fig. B1B) by gently lifting it straight up, being careful to avoid hitting the OSA, Zone Plate, detector and mirrors 2. Load the sample plate, again being careful to AVOID hitting the components in the STXM End Station. 3. Look inside the STXM End Station to make sure the sample plate was correctly mounted and the sample holder is about 5000 um back from the OSA. Use a flashlight if necessary. CAUTION: For WET CELLS, pumping may cause the windows to break, thus flushing with Helium may be preferred. In this case do not pump. Ask the Beamline Staff for assistance. 4. Make sure that the vacuum pump valve is closed 5. Turn on the vacuum pump using the switch on the wall 6. Open the vacuum pump valve 7. Pump until pressure is less than 200 mTorr (bottom scale on the digital gauge) 8. Close the vacuum pump valve 9. Turn off the vacuum pump 10. Open the Helium valve on the wall (Make sure there is He in the tank, located outside the SM entrance way 11. If Helium was not the gas previously used open the release valve to flush the gas line 12. Open the gas valve on the STXM tank and allow Helium to fill the tank to 1/6 atmosphere (red line marked on the analog gauge). 13. Turn off the Helium valve on the wall 14. Turn on the Detector 10ID-1 CLS SM STXM MANUAL 56 Version: 24 October 2011 A B C D Figure C1. (A) Sample Plate in storage case with samples on Si3N4windows, and labeling information, (B) Sample Holder inside STXM Tank, (C) Si3N4 windows fastened with double-sided tape and epoxy and (D) FIB samples fastened to sample plate. Figure C2. Sample plate coordination system. Note for ALS 5.3.2 Hole #1 and for 11.02 Holes #1, 2 and 3 are not accessible. 10ID-1 CLS SM STXM MANUAL 57 Version: 24 October 2011 Appendix C: Sample Preparation Sample preparation is briefly discussed here, for more detailed information and for information on alternative experimental set-ups (e.g., humidity chamber) see the SM website http://exshare.lightsource.ca/sm/Pages/SM-Home.aspx Samples are mounted on samples plates specifically designed to fit into the STXM sample Holder (Fig. C1). The SM beamline will supply the User with sample plates and plastic storage cases. Samples can be mounted on Si3N4 windows or TEM grids. For other materials consult with the Beamline staff. The Si3N4 windows or TEM grids are usually fastened to the sample plate using double-sided tape (Fig. C1C). We also recommend that the windows/grids be fastened down with epoxy for added stability (Fig. C1C). The SM beamline can supply the User with a small number of Si3N4 windows, otherwise, the User is asked to purchase the windows directly from the suppliers. Two known suppliers of silicon nitride windows are: Silson Ltd. in Northampton, England http://www.silson.com Norcada in Edmonton, Canada http://www.norcada.com/products.php There are a number of different sizes of silicon nitride windows; generally, we find that a window thickness of 75 or 100 nm and a window size of 0.5 x 0.5 mm on a 200 um thick frame are suitable for most applications. The windows can be purchased in large sheets, where the User has to break them apart, or already separated and put into a gel case, the sheets are considerably cheaper. TEM grids can be purchased from any TEM supplier. Both formvar coated and lacey-carbon grids have been found to be suitable for STXM measurements. Consult with the Beamline staff for more information. Samples can also be prepared using Focused ion beam (FIB) milling (Fig. C1D). Radiation damage is a possibility; consult with the Beamline staff for more information. 10ID-1 CLS SM STXM MANUAL 58 Version: 24 October 2011 10ID-1 CLS SM STXM MANUAL 59 Version: 24 October 2011 Appendix D: Data Analysis The data is routinely analyzed using the aXis2000 software. The Beamline staff is familiar with aXis2000 and can assist Users in using it for data analysis. aXis2000 is freeware and is maintained by Adam Hitchcock. The aXis2000 program and the IDL virtual machine package (from ITT Visual Information) can be downloaded from http://unicorn.mcmaster.ca/. Users that do not have an IDL License must use the IDL Virtual Machine Version. If you have trouble getting the aXis2000 program to run prior to your arrival at the SM beamline, the Beamline staff will be able to help you install it at the time of your arrival. There are some aXis2000 manuals/tutorials available that can help New Users at: http://exshare.lightsource.ca/sm/Documents/axis2000.pdf http://unicorn.mcmaster.ca/aXis2000.html Note, however, the manuals are dated, and significant changes have been made to the aXis2000 program and some routines may no longer be applicable. 10ID-1 CLS SM STXM MANUAL 60 Version: 24 October 2011 10ID-1 CLS SM STXM MANUAL 61 Version: 24 October 2011 Appendix E: SM Beamline Polarization Setup The helical APPLE II type undulator for 10ID-1 Spectromicroscopy beamline is designed to produce plane (Horizontal and vertical), circular, and linear polarized lights with the polarization planes inclined at any angle. It consists of four magnet assemblies that are designed to move longitudinally relative to each other as shown in Figure 7.1. The top and bottom girders can be moved vertically to change the gap and the four assemblies or rails in the longitudinal direction to change the phase. Figure E1. Schematic of the elliptically polarizing undulator (Attwood 2005). The following list describes the positions of the magnet assemblies in relation to the operating parameters. 1. Circular polarization – Two assemblies on the extreme opposite sides are moved in the same direction – Parallel mode 2. Plane polarization a. Horizontal – Four assemblies are at the same position longitudinally b. Vertical – Like case 1 for circular polarization, but the longitudinal movement length is equal to the undulator period length c. Inclined – Like case 1, but the assemblies are moved in the opposite directions to each other – antiparallel mode. i.e., upper left moved forward and the lower right moved backward 10ID-1 CLS SM STXM MANUAL 62 Version: 24 October 2011 Figure F1. Relationship between the position of the zone plate, OSA, sample and detector in the Z direction (e.g., Coarse Z). Figure F2. Zone plate position as a function of energy. E2 > E1, zone plate moves further away from the OSA. 10ID-1 CLS SM STXM MANUAL 63 Version: 24 October 2011 Appendix F: Zone Plate, Order Sorting Aperture (OSA), Sample & Detector Relationship The spatial relationship between the zone plate, OSA, Sample holder and detector are shown in Figures F1, F2 and F3. OSA is assigned the coordinates (0, 0, 0), left of the OSA is the zone plate and it is negative, while right of the OSA where the sample holder is, is positive. The OSA and Detector do not move during data acquisition, whereas the zone plate and sample holder (i.e., sample) do move during data acquisition. The zone plate will change position as it is a function of the energy. The Ao value is the expected sample position relative to the OSA. The zone plate uses the Ao in its calculation to determine its relative position to the OSA. Thus, the focal length (f) is calculated based on the distance of the zone plate from the OSA (Z) and the distance from the OSA to the Sample (Ao) (f = Z + Ao). Ao increases with increasing energy. The reason that we change the Ao instead of just moving the zone plate further back from the OSA is due to alignment issues and physical constraints. So if we move from higher energy to lower energy, the calculation of the new focal length is based on the Ao from the higher energy, subsequently the zone plate position is moved closer to the OSA to satisfy f = Z + Ao. Consequently, the zone plate may crash into the OSA when moving from higher energy to lower energy Sample Holder ZP Detector OSA Figure F3. Layout of zone plate (ZP), OSA, Sample Holder and detector. 10ID-1 CLS SM STXM MANUAL 64 Version: 24 October 2011 A B Figure G1. Mapping of Network Drives menus for (A) Windows 7 and B) XP machines. Figure G2. Windows address window in Explorer 10ID-1 CLS SM STXM MANUAL 65 Version: 24 October 2011 Appendix G: SM Data Access and Data Transfer The raw data files are archived and saved indefinitely. STXM Data is stored on Drive E. All STXM data is stored by date and the order of collection. For example, the first scan on February 9, 2011 would be stored as 110209000, the next as 110209001, and so forth. Users can copy their data (i.e., Optical Microscope (VLM Data) or the STXM Control (STXM Data) ) while at the CLS over the internet or can access the data after they leave the CLS via ftp. Accessing Data while at the CLS Laptops connected to any CLS network port (VLAN110 or 110) can access the internet. Wireless is also available, ask the Beamline Staff for the information. To set-up your laptop requires that you map your network drive and select the appropriate computer and folders. 1. Map the Network Drive. For Windows 7 computers Click “START” opening to another screen (Figure G1A). then “COMPUTER” then “Map Network Drive” For XP computers Right Click “START”, then select Explore then Right Click “My Network Places” and select “Map Network Drive” opening to another screen (Figure G1B). 2. In the FOLDER option, For the STXM Control computer enter \\station8107\sm_stxm\, click Finish For the Optical Microscope computer enter \\WKS-W0000120540\VLM-data\, click Finish Note that this only needs to be done once on your computer. Alternatively, can access the data on the STXM Control computer using the Windows Map_Network_Drive feature by entering ‘\\station8107\sm_stxm\’ in the address window of Explorer (Fig. G2). 10ID-1 CLS SM STXM MANUAL 66 Version: 24 October 2011 10ID-1 CLS SM STXM MANUAL 67 Version: 24 October 2011 Accessing data from outside the CLS using an ftp program In order to access your CLS-SM experimental data from outside the CLS it is necessary that the data be copied to the ftp data server, which can only be done from the STXM computer at the CLS. If your data is not in the ftp data server (i.e., not copied yet) and you are no longer at the SM beamline, email the Beamline staff to complete the ftp data transfer. Data transfer to the CLS ftp data server is done from the STXM Control computer: 1. Double click the “copy STXM data” icon on the desktop. This will copy the data files from STXM Control to the ftp data server. Note the VLM data is also accessible provided that it was copied previously from the Optical Microscope using the “copy VLM data” icon on the desktop. 2. Use your ftp program to connect to the CLS ftp data server: Port: #21 Hostname: (ask the Beamline Staff or look in the Manual at the SM beamline) Username: (ask the Beamline Staff or look in the Manual at the SM beamline) Password: (ask the Beamline Staff or look in the Manual at the SM beamline) 3. Your data is in the \sm-user\STXM-data folder. 10ID-1 CLS SM STXM MANUAL 68 Version: 24 October 2011 10ID-1 CLS SM STXM MANUAL 69 Version: 24 October 2011 Appendix H: Connecting to the Printer in the STXM hutch Printer name: prd-cp3525n-e-0 Windows 7 machines 1. Click “Devices & Printers” 2. Click “Add Printer” 3. Click “Add Network, wireless or Bluetooth printer” 4. Click “The printer that I want wasn’t listed” Click “NEXT” 5. Select “Select a shared printer by name” 6. Enter in box \\vsrv-print-01\prd-cp3525n-e-0 (May actually give you list of printers before entering a printer name) 7. Click “Next” 8. Should indicate you have been successful. 9. Click “next’ 10. Click “finish” XP machines 1. Click “Printer and Faxes” 2. “File” click “Add Printer” 3. Click Next 4. Select “A network printer, or a printer attached to another computer” then click “NEXT” 5. Select “Connect to this printer (or…)” 6. In box type \\vsrv-print-01\prd-cp3525n-e-0 (May actually give you list of printers before entering a printer name) 7. Then asks you if you want to set as default printer 8. Click “Finish” Apple machines Must have internet connection to download drivers 1. System preferences 2. Print & scan 3. Add printer 4. IP top 5. Select protocol as IP (IP address 10.40.0.71) 6. Add HP Color LaserJet CP3525 10ID-1 CLS SM STXM MANUAL 70 Version: 24 October 2011 10ID-1 CLS SM STXM MANUAL 71 Version: 24 October 2011 Appendix I: SM Beamline Computer’s for Users Users cannot install any software on any SM beamline computer without prior permission from the Beamline Staff. The program available for image and spectral analysis is aXis2000 (IDL Language), and it is loaded on the STXM Control Computer and the VLM computer. At the time of data collection (i.e., during your shift), the STXM Control computer can be used for data analysis using aXis2000. Outside of a User’s shift, the SM beamline has one computer (VLM optical microscope) that may be available to Users for data analysis, however, its availability cannot be guaranteed, and thus, Users are encouraged to bring their own laptop computers for data analysis. If you use the SM beamline computers for data analysis, save your work under the folder C:\Users and copy onto a memory stick or transfer through the CLS ftp data server site (see Appendix F) before leaving the CLS as folders older than 1 month will be deleted. 1. Optical Microscope (VLM) Computer (only available when not required for previewing samples) Username: Posted on Monitor or Keyboard Password: Posted on Monitor or Keyboard aXis2000 – Spectral and image analysis of STXM and PEEM data Microsoft office suite: Word, Excel, PowerPoint 10ID-1 CLS SM STXM MANUAL 72 Version: 24 October 2011 10ID-1 CLS SM STXM MANUAL 73 Version: 24 October 2011 Appendix J: Selecting the optimum Cff value The constant of fixed focus (Cff) value controls the angles for the mirror and the grating of the PGM. Usually the Cff value is set at 2.15. To change the Cff values consult with the Beamline Staff. One can select different Cff values in order to trade off intensity for increased spectral resolution. This section gives information on how these quantities change as a function of the Cff value for the LEG (250 l/mm) and MEG (500 l/mm) (Fig. J1). Use Cff values between 1.75 to 2.5 for better intensity and to reduce second order light Intensity at CirRight polarization is higher than at LinHor polarization. 12 2.45 3.13 4.0 4 21 Mar 2007 2 12 10 6 4 4 11 10 6 4 1.92 2.45 3.13 10 4.0 21 Mar 2007 2 11 10 2 12 1.5 8 6 Current (/250mA) 1.92 Flux(ph/s/500mA/R~3000) Flux(ph/s/500mA/R~3000) 1.5 6 4 2 1.5 1.92 2.45 3.13 4.0 6 4 21 Mar 2007 2 11 10 8 8 Current (/250mA) 10 6 Current (/250mA) Flux(ph/s/500mA/R~3000) 13 10 8 6 4 2 2 10 10 10 200 220 240 260 280 300 10 300 10 350 400 450 500 10 400 450 Energy (eV) Energy (eV) 500 550 600 Energy (eV) Figure J1. Peak photon flux in the first order near the carbon, nitrogen and oxygen K-edges in circular polarization measured using the LEG (at STXM exit slit). Second order contribution near the Carbon K-edge for the LEG and MEG (Fig. J2). 1. Second order contribution increases with an increase in the cff value 2. Second order contribution is higher at LinHor polarization than at CirRight polarization 3. Use cff values of 2.0 to 2.5 at the Carbon K-edge for both the LEG and MEG. Second order suppression STXM Exit Slit, 250 l/mm grating 10 14 CircularRight 200eV CircularRight 265eV Linear Hor. 200eV Linear Hor. 265eV Second order contribution (%) Second order contribution (%) 12 Second order suppression STXM Exit Slit, 500 l/mm grating 8 6 4 2 0 1.5 2.0 2.5 Cff 3.0 3.5 4.0 12 10 CircularRight 200eV CircularRight 265eV LinearHor. 200eV LinearHor. 265eV 8 6 4 2 0 1.5 2.0 2.5 Cff 3.0 3.5 4.0 Figure J2. Second order contribution as a function of Cff value near the Carbon K-edge for the LEG (250 l/mm) and MEG (500 l/mm). 10ID-1 CLS SM STXM MANUAL 74 Version: 24 October 2011 10ID-1 CLS SM STXM MANUAL 75 Version: 24 October 2011 Appendix K: References 1. Kaznatcheev, K.V., Karunakaran, Ch., Lanke, U.D., Urquhart, S.G., Obst, M., Hitchcock, A.P. 2007. Soft X-ray spectromicroscopy beamline at the CLS: Commissioning results. Nuclear Instruments & Methods in Physics Research A. 582, 96-99. 10ID-1 CLS SM STXM MANUAL 76 Version: 24 October 2011