1
Sample Champion PRO 3.8
User Guide
by Paolo Guidorzi, PureBits.com
Sample Champion PRO 3.8 – User Manual
p. 1
Contents
Welcome to Sample Champion!
Sample Champion is a powerful real-time dual channel MLS (Maximum Length Sequence)
analyzer. We recommend a careful reading of this manual before using the program.
For a survey of the program, read General Overview, then go to Quick Starting Guide.
Contents
Before Starting............................................................................................................... 5
General Overview.......................................................................................................... 6
System Requirements................................................................................................... 7
Quick Starting Guide...................................................................................................... 8
File Management
Open.............................................................................................................................. 12
Save............................................................................................................................... 14
Measurement types
Scope Window............................................................................................................... 16
Impulse Response Window........................................................................................... 22
Frequency Domain Window........................................................................................... 26
Measurement Type Selection........................................................................................ 35
Settings
General.......................................................................................................................... 37
Advanced....................................................................................................................... 44
FFT................................................................................................................................ 47
Compensation................................................................................................................ 49
Calibration...................................................................................................................... 56
Hardware....................................................................................................................... 64
File Options.................................................................................................................... 65
Quick Settings
Quick Seettings.............................................................................................................. 68
Tools
Measurement (geometry) Setup.................................................................................... 69
Mixer.............................................................................................................................. 70
Measurement Information Window................................................................................ 71
Control Bar..................................................................................................................... 72
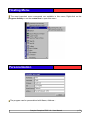
Floating Menu................................................................................................................ 73
Personalization.............................................................................................................. 73
Tweaks........................................................................................................................... 74
Sample Champion PRO 3.8 – User Manual
p. 2
Sampling engine commands
Rec, Play, Sync Rec and Play....................................................................................... 76
Windows managing commands
Maximize, Minimize........................................................................................................ 76
RemoteSC.................................................................................................................. 77
Post-processing functions
Invert I.R........................................................................................................................ 78
Reverse I.R.................................................................................................................... 78
Normalize I.R. Peak to 1................................................................................................ 78
Find and subtract I.R. Offset.......................................................................................... 79
Wrap I.R......................................................................................................................... 79
Move Impulse Response Peak at.................................................................................. 79
Move Impulse Response Peak at X=100 at Measurement Cycle End.......................... 79
Increase / Decrease / Normalize FFT Spectrum(s) Magnitude .................................... 79
Smooth Spectrum Data................................................................................................. 80
File Operations, Position-Weighting associations TXT file............................................ 81
Spectra Merge............................................................................................................... 83
Apply Mic. Weighting (and Inverse) to I.R..................................................................... 83
Apply Frequency Weighting (and Inverse) to I.R........................................................... 83
Apply Pink Filtering (and Inverse) to I.R........................................................................ 83
Clear all Data Buffers..................................................................................................... 85
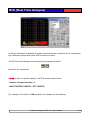
RTA (Real Time Analyzer) ................................................................................... 86
Transfer function............................................................................................................
Cross-Spectrum.............................................................................................................
Coherence.....................................................................................................................
Cross-Correlation...........................................................................................................
Auto-Correlation.............................................................................................................
Correlation Meter...........................................................................................................
Stereo Check.................................................................................................................
90
90
92
92
92
93
93
Audio Quality functions..................................................................................................
SNR...............................................................................................................................
THD and THD+N...........................................................................................................
IMD................................................................................................................................
95
95
98
100
Load and Save Spectra in RTA window........................................................................ 101
Troubleshooting
F.A.Q............................................................................................................................. 102
Tips................................................................................................................................ 104
Most common problems (and solutions)........................................................................ 107
Sample Champion PRO 3.8 – User Manual
p. 3
Other features (available in the plugins)
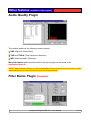
Audio Quality Plugin.................................................................................................... 113
SNR (Signal to Noise Ratio)
THD and THD+N (Total Harmonic distortion)
IMD (Intermodulation Distortion)
Filter Banks Plugin...................................................................................................... 113
BUTTERWORTH, CHEBYSHEV low-pass, band-pass and high-pass analog filters
IEC 1260 Octave and 1/3 Octave band filters
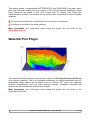
Waterfall Plot Plugin.................................................................................................... 114
3D Cumulative Spectral Decay
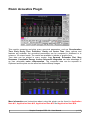
Room Acoustics Plugin............................................................................................... 115
Reverberation Time
Early Decay Time
Definition
Clarity
Centre Time
Log Squared Plot
Schroeder Plot
Step Response Plot
Cumulative Energy Plot
Inverse Schroeder Integration
Enhanced View Plugin................................................................................................ 116
Energy Time Curve
Spectrogram
Nyquist Plot
Phase Unwrapping
Minimum and Excess Phase computation
Minimum Phase Impulse Response Plot
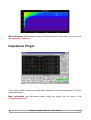
Impedance Plugin........................................................................................................ 117
Loudspeaker impedance measurement
Thiele-Small parameters computation
License....................................................................................................................... 118
License terms
Sample Champion PRO 3.8 – User Manual
p. 4
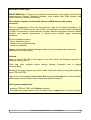
BEFORE STARTING...
READ CAREFULLY: To prevent any resizing or reallocating of the virtual memory during
measurements, Sample Champion allocates, once started, ALL RAM memory and
system resources required for working.
This software requires a substantial amount of RAM memory and system
resources.
This is a consequence of the very high accuracy used for all internal operations. For
example the FFT (limited for the user to 64K, but extended for some internal operations
to 256K) is computed on double-precision complex data and using both frequency bands
(positive and negative frequencies) to perform some specific signal processing
operations.
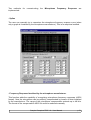
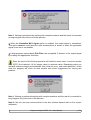
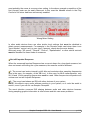
IF error messages such as:
- Plugin_default not found
- Canvas does not allow drawing
- Uncorrect parameter
...
appear, most probably Sample Champion does not have enough system resources
available for running correctly.
Solution:
Leave at least 2-300 MB of free space on the disk where the Windows swap file is
allocated (usually disk c).
Close any other software before starting Sample Champion (this is always
recommended).
Disable all running programs and system tasks. Check the active running tasks pressing
once CTRL-ALT-DEL.
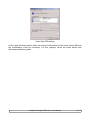
Tip: click on the windows taskbar Start / Run and type msconfig then in the Automatic
Start section uncheck all the useless tasks and reboot the system.
Ideal system configuration:
- pressing CTRL-ALT-DEL only Explorer is shown.
- the system tray (right bottom corner of windows bar) is empty (only the clock is shown).
Sample Champion PRO 3.8 – User Manual
p. 5
General Overview
Sample Champion can operate in real-time (while performing a measurement) or in
post-processing mode (at the end of a measurement cycle) or with loaded files.
There are no differences between these operating modes.
Basically, there are different types of windows, each with different contents and behaviors:
Time domain windows
Scope windows
Impulse Response windows
Frequency domain windows
FFT of Selection in scope window
FFT of Selection A in impulse response window
FFT of Selection B in impulse response window
Plugin windows
Frequency domain plugins
Time domain plugins
All frequency domain and plugin windows have a specifical ID type (shown in the lower
right hand corner of frequency windows) to distinguish them. This ID is written also inside
the .SPE (frequency) files.
Sample Champion uses some memory banks to store Time and Frequency data. To
reduce RAM memory requirements, only one memory bank of each type is used at the
same time.
For example the user can view simultaneously:
1 Scope memory bank
1 Impulse Response memory bank
1 FFT of scope selection memory bank
1 FFT of impulse response selection A memory bank
1 FFT of impulse response selection B memory bank
1 Frequency domain plugin memory bank
Sample Champion PRO 3.8 – User Manual
p. 6
For each memory bank, it is possible to open as many view windows as desired. For
example, the user can open simultaneously two impulse response windows showing
different time intervals or with different time scales (X axis zoom). The data of the same
frequency bank can be plotted in different windows with different Y axis view options such
as Magnitude linear, Magnitude (dB), third-band of octave, phase...
You can find some examples in the Quick Starting Guide.
System Requirements
Hardware:
Standard PC, Pentium or later, or compatible processor
(Pentium II 200MHz or faster, or equivalent compatible processor, recommended)
64 MB RAM (recommended: 128 MB or more)
Fast video card (recommended settings: 64K colors or greater, 800x600 or greater
screen size)
Windows compatible full-duplex 16 or 24 bit sound card
10 MB Hard Disk space, at least 200 MB Hard Disk free (for Windows swap file)
Software:
Microsoft Windows 95, 98, ME, 2000 or XP
Full-duplex sound card drivers (supplied by sound card manufacturer). Only standard
MMSYSTEM support is required (MME / WDM drivers).
DirectX or ASIO support is not required.
Sample Champion PRO 3.8 – User Manual
p. 7
Quick Starting Guide
Here you'll find a step-by-step procedure to start using Sample Champion
It is assumed that a full-duplex sound card is installed and working.
In order to make some tests, it could be a good idea to have a MICROPHONE (connected
to the MIC IN of the sound card) placed in front of a LOUDSPEAKER (connected to the
output of the sound card, using a power amplifier, if necessary).
Alternately, a short jack-jack cable (or as required by the sound card) could connect
direcly the LINE OUTPUT of the sound card with its LINE INPUT (loop back).
Now we are ready to start some measures!
Start Sample Champion
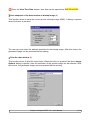
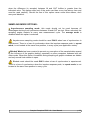
Open the settings window and set the following parameters
General Settings:
- INPUT: Mono, 4K
- OUTPUT: 16 bit, Mono
- Disable Automatic Time Latency Calibration
- Sampling rate: 48000 Hz
- Block: 1
- Mode: Repeat
- Step: 2
- MLS Type: 4K MLS (Taps 12,7,4,3)
- Level: 50%
Sample Champion PRO 3.8 – User Manual
p. 8
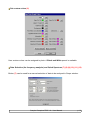
Advanced Settings:
- Uncheck everything
- Check only "Remove offset from sampled data"
FFT Settings:
- FFT Size: 4K
- Weighting window: Blackman-Harris, Half-right
- Check "Show window..."
- Uncheck "Phase shifting..."
- Check "Transfer Function Measurement"
- Write a voltage value in the "Signal Amplitude" field, for example 1000 or 2000 (milliVolt)
- Select Channel 1(L) for all three cursor selection channel assignements
Compensation Settings:
- Uncheck INPUT Correction Enable checkbox
- Uncheck OUTPUT Correction Enable checkbox
- Uncheck Pink Filter checkbox
Calibration Settings:
- Uncheck Manual or Automativ Latency Calibration
- Do not change Amplitude calibration
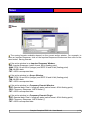
Open an Impulse Response window (press )
Press and select "Selection A in the Impulse Response Window"
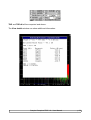
Press to have a more comfortable view (if you are using 800 x 600 pixel windows
desktop setting, it could be useful to hide the taskbar to get more work space)
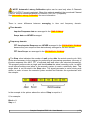
Now press
and a single cycle MLS measurement should be performed.
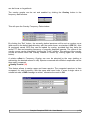
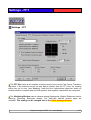
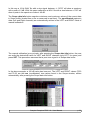
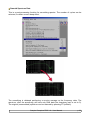
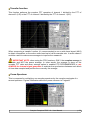
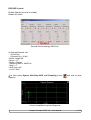
Click 2 times on the Show Info on image icon inside the Impulse Response window to
see extra information.
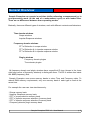
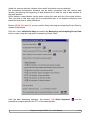
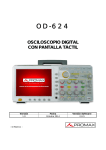
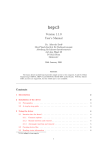
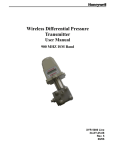
If you are testing a loudspeaker, the Impulse Response should look like the following
picture (obviously, with the Impulse Response of your loudspeaker!):
Sample Champion PRO 3.8 – User Manual
p. 9
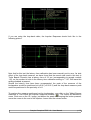
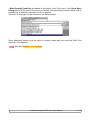
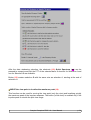
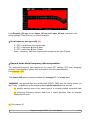
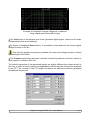
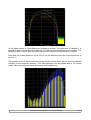
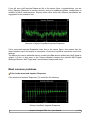
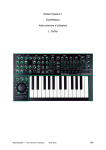
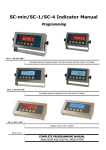
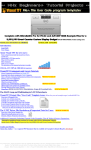
If you are using the loop-back cable, the Impulse Response should look like in the
following picture:
Note that for this test the latency time calibration has been manually set to zero. As side
effect of the loop back measure, we have found that the sound card used in this test (a
Turtle Beach Pinnacle) has a latency time of 2.6 ms (corresponding to sample number
115), so the number to write in the latency time calibration setting is "-115". But leave this
setting disabled at present.
Should the latency time have been compensated, the peak of the measure of the
loudspeaker would be positioned at t=0.96 (=3.56-2.6) and the loop-back measure peak
would be positioned in the proximity of t=0.
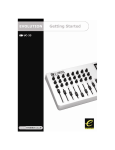
To analyze the measure performed on the loudspeaker, now click on the "Make/Change
Selection A" icon inside the Impulse Response window ( ). The cursor will become a
cross. Click now on the I.R. image, just before the peak and, keeping the button pressed,
move the cursor to the end of the Impulse. Leave then the mouse button.
Sample Champion PRO 3.8 – User Manual
p. 10
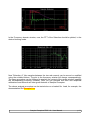
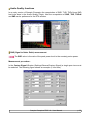
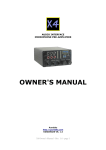
In the Frequency domain window, now, the FFT of the Selection should be plotted, in the
desired viewing mode.
Now "Selection A" (the samples between the two red cursors) can be moved or modified
using the suitable buttons. The plot in the frequency window will change correspondingly.
The same procedure can be followed to analyze the content of the scope window (opening
the corresponding frequency window). Now you can proceed with time and amplitude
calibrations and discover all other great features of Sample Champion.
The above analysis procedure can be tested also on a loaded file. Load, for example, the
demonstration file Example1.ire.
Sample Champion PRO 3.8 – User Manual
p. 11
Open
Open
The following formats are supported for input files:
.IRE: Impulse Response (native format, 80 bit floating point)
.SPE: Spectral data, Real + Imaginary parts (native format, 80 bit floating point)
.WAV: PCM 16, 24 and 32 bit (integer) and IEEE 32 and 64 bit (floating point)
.TIM: MLSSA™ data
.FRD: Frequency Response, ASCII format (*)
.TXT: ASCII raw exported data
- Opening a file of a certain type, the corresponding window will open (if it is not already
open)
- Global sampling rate is adjusted according with the loaded file
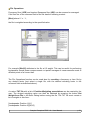
- When a file is selected in the list, some information will be shown on the right side of the
window
- Multiple views of the same file can be opened by using the corresponding button or
measurement selection
–
Most Recent Used files are added in the bottom of the File menu. If the Show Open
Dialog option (at the end of File menu) is checked the open dialog is shown when a
file in the MRU list is selected, otherwise the file is opened.
Sample Champion PRO 3.8 – User Manual
p. 12
See also Settings / File Options
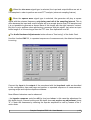
(*) FRD files are an ASCII stadard format for frequency response exchange between
different software systems.
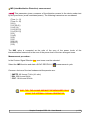
This is an FRD file format example:
* Frequency Data Exported from Sample Champion
* DeltaF (Hz) = 5.85937500
* FFT Length = 8192
* Data (from f=0 to f=24000.00000000 Hz):
* FREQUENCY ---------- SPL ----------- ----------PHASE --------5.859375000 -6.6413279209929422 161.172205576833990
11.71875000 -6.2717003153797555 142.893539456514790
17.57812500 -5.7170485135652076 125.547620204225055
23.43750000 -5.0415376898741889 109.294398830669541
29.29687500 -4.3013566780912727 94.1163743150220921
35.15625000 -3.5376477339700959 79.8990622262171842
41.01562500 -2.7771475142395961 66.4949803316312349
46.87500000 -2.0357062995903430 53.7595379304933006
52.73437500 -1.3218866288923240 41.5660817383207405
...
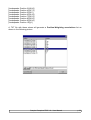
Sample Champion can save and load frequency data also in this format. In order to have
the better results, the current FFT size setting in Sample Champion must be the same of
the loaded FRD file.
Sample Champion PRO 3.8 – User Manual
p. 13
Save
Save
The saving formats available depend on the current active window. For example, to
save an Impulse Response, click on the Impulse Response Window and then click on the
save button. Saving formats:
If the active window is an Impulse Response Window:
.IRE: Impulse Response (native format, 80 bit floating point)
.WAV: PCM 16 and 32 bit (integer) and IEEE 32 and 64 bit (floating point)
.TIM: MLSSA data
.TXT: ASCII raw exported data
If the active window is a Scope Window:
.WAV: PCM 16 and 32 bit (integer) and IEEE 32 and 64 bit (floating point)
.TIM: MLSSA data
.TXT: ASCII raw exported data
If the active window is a Frequency Domain Window:
.SPE: Spectral data, Real + Imaginary parts (native format, 80 bit floating point)
.FRD: Frequency Response, ASCII format (*)
.TXT: ASCII raw exported data
If the active window is a Frequency Domain Plugin:
.SPE: Spectral data, Real + Imaginary parts (native format, 80 bit floating point)
.FRD: Frequency Response, ASCII format (*)
.TXT: ASCII raw exported data
Sample Champion PRO 3.8 – User Manual
p. 14
- Most Recently Used files are added in the bottom of the File menu. If the Show Open
Dialog option (at the end of File menu) is checked, the open dialog is shown when a file in
the MRU list is selected, otherwise the file is opened.
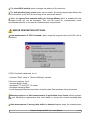
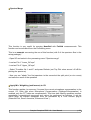
The WAV format type can be selected in the Save window:
Some additional options must be taken in account when data are saved as WAV files
(Settings / File Options).
See also Settings / File Options
Sample Champion PRO 3.8 – User Manual
p. 15
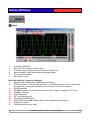
Scope Window
Scope
1
2
3
4
5
6
-
AutoScale (ON/OFF)
Set View Time Interval (Lock/Unlock)
View data values / Export time data as XLS (Excel) file
Save snapshot of the data window as bitmap image
Print the data window
Set custom colors
Data Selection (for frequency analysis):
7 - Manual Data windowing and additional information
8 - START selection (if no data are selected) or CHANGE selection size (if some data
are selected), moving the selection cursor nearest to the mouse pointer
9 - MOVE selection
10 - EXTEND selection to the current maximum input length or maximum FFT size
11 - DISABLE selection
12 - Quick Spectrum
13 - SET plot starting point
14 - Overlay generated Signal
15 - PLOT Left and/or Right channel data (if the measurement is stereo)
16 - ZOOM time scale
17 - ZOOM amplitude (only view)
Sample Champion PRO 3.8 – User Manual
p. 16
Pressing the scope button
an empty window will open.
When one or more measurements are performed, the sampled data will be plotted
there.
Scope Window Features:
AutoScale (ON/OFF) (1)
This function allows to enable/disable Y autoscale for the current plot.
Tip: We suggest to disabled this function after the first measurement and enable it
again (just a few moments) only if the measured signal falls outside of the plot bounds.
Set View Time Interval (Lock/Unlock) (2)
This function allows to set accurately the graph time range. When it is enabled, the scroll
bars in the Scope window are disabled.
View data values (ON/OFF) (3)
This button opens the View Data window.
Sample Champion PRO 3.8 – User Manual
p. 17
From the View Time Data window, time data can be exported as XLS (Excel) file.
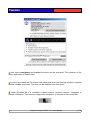
Save snapshot of the data window as bitmap image (4)
This function allows to save the current plot as a bitmap image (BMP). A dialog is opened
when the button is pressed:
The user can now select the desired resolution for the bitmap image. After this choice, the
generated image can be previewed before saving.
Print the data window (5)
This function allows to print the current plot. When the button is pressed, the above Image
Options dialog is opened. Here the resolution of the printed image can be selected. After
this choice, the generated image can be previewed before printing.
Sample Champion PRO 3.8 – User Manual
p. 18
Set custom colors (6)
Here custom colors can be assigned to plota. A Black and White preset is available.
Data Selection (for frequency analysis) and Quick Spectrum (7) (8) (9) (10) (11) (12)
Button (7) can be used for a manual selection of data to be analyzed in Scope window.
Sample Champion PRO 3.8 – User Manual
p. 19
Inside the manual selection window other useful information can be obtained:
the microphone-loudspeaker distance can be easily computed from the current data
window, just placing the beginning of data window at t=0 and the end of data window at
the peak position.
Other distance computations can be done moving the start and end of the data window.
This can help to find and verify the true anechoical part of an Impulse Response and
isolate the first floor or walls reflections.
Buttons (8) (9) (10) and (11) can be used for freely selecting and analyzing Scope Data by
means of the mouse.
Click the menu Help/Quick Help and select the Measuring and Analyzing Scope Data
button to see a step by step guide for analyzing Scope Data:
After the data windowing selection, the shortcut (12) Quick Spectrum (
pressed to compute and plot the FFT of the selected data.
Sample Champion PRO 3.8 – User Manual
) can be
p. 20
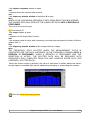
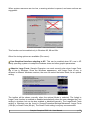
Overlay generated Signal (14)
Using this option, the WAVE generated by the internal signal generator can be overlaid
with the sampled data (in Scope Mode). This can be extremely useful for comparing the
result of a measurement with the Ideal wave in the Time Domain. The example above
shows a 200 Hz Square wave (the sampled wave is green and the generated wave is
fuchsia).
PLOT Left and/or Right channel data (for stereo measures) (15)
This function can be used for plotting only one channel, when the measurement is stereo.
Plot Zoom (13) (16) (17)
Sliders (13) (16) (17) can be used for zooming X e Y axis of the plot.
Y Zoom (17) is very useful to check negligible signals.
Sample Champion PRO 3.8 – User Manual
p. 21
Impulse Response Window
Impulse Response
1
2
3
4
5
6
-
AutoScale (ON/OFF)
Set View Time Interval (Lock/Unlock)
View data values / Export time data as XLS (Excel) file
Save snapshot of the data window as bitmap image
Print the data window
Set custom colors
Two impulse response selections (for frequency analysis) are available.
Data Selection "A" and Data Selection "B". Two series of buttons, one for Selection “A”
and one for Selection “B” are available, with same functions.
7 - Manual Data windowing and additional information
8 - START selection (if no data are selected) or CHANGE selection size (if some data
are selected), moving the selection cursor nearest to the mouse pointer
9 - MOVE selection
10 - EXTEND selection to the current maximum input length or maximum FFT size
11 - DISABLE selection
12 - Quick Spectrum
13 - CREATE selection B with the same size as selection A, starting at the end of
selection A
Sample Champion PRO 3.8 – User Manual
p. 22
14 15 16 17 18 19 20 21 22 -
MOVE the view point to localize the maximum peak of the impulse response (the
button is enabled only if the impulse peak is outside the plot view range)
SHOW extra information about the impulse on the plot area
OVERLAY the Free Field impulse response (if selected)
PLOT Left and/or Right channel data (if the measurement is stereo)
CLEAR (set to 0) impulse response data between Selection A cursors
CLEAR (set to 0) ALL impulse response data
SET plot starting point
ZOOM time scale
ZOOM amplitude (this affects only the plot)
Pressing the impulse response button an empty window will open.
When one or more measurements are performed, the Impulse Responses computed
from the sampled data are plotted here at the end of every cycle.
If the Average option is enabled, the plot is updated at every measurement cycle with
the partial result of the average operation.
Impulse Response Window Features:
Functions (1) to (6) are quite similar to those described for Scope window.
Data Selection “A” and “B” (7), (8), (9), (10), (11), (12), (13)
These buttons can be used for selecting and analyzing Impulse Response Data. Two data
selections are available (called A and B). The frequency contents of the data selected in
these selections can be viewed separately and independently.
Buttons (7) can be used for manual selection of data to be analyzed in Impulse Response
window, as described for Scope window.
Click the menu Help/Quick Help to see a step by step guide for analyzing Impulse
Response Data.
Inside the Quick Help window, by selecting the Measuring and Analyzing Impulse
Response Data button, the following short Step by Step Guide will be shown:
Sample Champion PRO 3.8 – User Manual
p. 23
After the data windowing selection, the shortcuts (12) Quick Spectrum ( ) can be
pressed to compute and plot the FFT of the selected data. A shortcut for Selection A and
one for Selection B are available.
Button (13) creates selection B with the same size as selection A, starting at the end of
selection A.
MOVE the view point to localize the maximum peak (14)
This function can be used for moving the view point (only the view) and localizing quickly
the maximum peak of the impulse response. The button (a little lens) is enabled only if the
impulse peak is outside the plot view range.
Sample Champion PRO 3.8 – User Manual
p. 24
SHOW extra information about the impulse on the plot area (15)
This function shows some extra information about the measured Impulse Response.
OVERLAY the Free Field impulse Response (if selected) (16)
This function allows to overlay two Impulse Responses. A reference I.R. can be set in the
Settings/Compensation window. Pressing the button (16), the reference I.R. Is plotted
over the current I.R.
Note 1: the sample rate of the reference and current impulses must be the same. The
reference I.R. color can be set by the user (see custom color function).
Note 2: the I.R. files (.ire) store also data selection information. Reference I.R. data
selected or unselected can be plotted using different colors (see again custom color
function).
PLOT Left and/or Right channel data (if the measurement is stereo) (17)
This function can be used for viewing only one channel, when the measurement is stereo.
CLEAR (set to 0) impulse response data between Selection A cursors (18)
This function can be used for zeroing a portion of the data.
CLEAR (set to 0) ALL impulse response data (19)
This function can be used for setting to 0 all data in the memory bank.
Plot Zoom (20) (21) (22)
Sliders (20) (21) (22) can be used for zooming X e Y axis of the plot.
Y Zoom (22) is very useful to check negligible signals.
Sample Champion PRO 3.8 – User Manual
p. 25
Frequency Domain Window
FFT of Selection (Frequency Analysis of Scope Data),
FFT of Selection A (Frequency Analysis of Impulse Response Data)
FFT of Selection B (Frequency Analysis of Impulse Response Data)
1
2
3
4
5
-
6 7 8 -
View Options
View frequency data values (ON/OFF)
Save snapshot of the data window as bitmap image
Print the data window
Set custom colors
Y Autoscale on current data
Y Autoscale (ON/OFF)
Round dB Y scale (ON/OFF).
9 - X Zoom out full (display all the measurement frequency band)
10 - Set view frequency range (ON/OFF)
11 - Set logarithmic Y range (ON/OFF)
12 - IFT. Inverse Fourier Transform
Sample Champion PRO 3.8 – User Manual
p. 26
13 - Edit Frequency Data.
14 - Frequency Data Overlay
15 - Quality Control.
16
17
18
19
-
Frequency zoom. This slider changes the maximum frequency value on the plot
Set the amplitude zoom plotting value
Set bottom plotting value
Set the starting frequency value in the plot
20 - Show frequency data types (ID):
This window shows frequency domain data computed from a selection in the scope
window or in the Impulse Response window. It can display also the results of a
computation performed by a plugin working in the frequency domain.
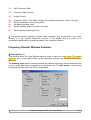
Frequency Domain Window Features:
View Options (1)
This function opens the View Options dialog in order to select the view mode. The values
shown on the Y scale depend also on the calibration settings (see Settings/Calibration
Window).
The drawing mode option specifies whether the data are plotted as points connected with
a line or every data value is plotted as an horizontal bar. The Bar mode is much faster
and should be used when the CPU is overloaded.
Sample Champion PRO 3.8 – User Manual
p. 27
The label of frequency plots can be customized,.allowing to the user the personalization of
the title label of the frequency plot, adapting it to the kind of data analyzed and to current
settings.
View frequency data values (ON/OFF) (2)
This window shows the values of the currently plotted data. The frequency step depends
obviously on the current FFT size (see Settings/FFT Window).
From the View Frequency Data window, data can be exported as XLS (Excel) file.
Save snapshot of the data window as bitmap image (3)
This function allows to save the current plot as a bitmap image (BMP). The user can
select the desired resolution for the saved image.
Print the data window (4)
This function allows to print the current plot. The resolution of the printed image can be
selected.
Set custom colors (5)
Custom colors can be assigned to the frequency domain plot. A Black and White preset is
available.
Sample Champion PRO 3.8 – User Manual
p. 28
Y Autoscale on current data (6)
When this button is pressed (once), the minimum and maximum Y plot values are set in
an automatic way.
Y Autoscale (ON/OFF) (7)
When this function is ON (the button remains down) the autoscale on the frequency plot is
computed at every measurement cycle.
Tip: This function can be disabled after the first measurement. If some measured data are
out of the plot, the Y Autoscale on current data (6) button can be pressed once.
Round dB Y scale (ON/OFF) (8)
When this function is ON and the Y is in dB scale, only integer values are shown. This
applies only to the plot, data are untouched
X Zoom out full (9)
When this button is pressed, all the measurement frequencies are plotted.
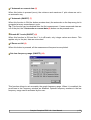
Set view frequency range (ON/OFF) (10)
This function allows to set accurately the graph frequency range. When it is enabled, the
scroll bars in the Frequency window are disabled. Optional frequency markers in the low
frequency range can be activated by the user.
Sample Champion PRO 3.8 – User Manual
p. 29
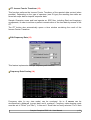
Set logarithmic Y range (ON/OFF) (11)
This function allows to set accurately the graph frequency range. When it is enabled, the
scroll bars in the Frequency window are disabled. Some options about frequency markers
can be set too.
Also a custom dB/div value can be set. Example:
- set the desired Top Y value (in dB)
- set the desired dB/div value (in dB) and press the Set (constant Top) button
- press Refresh
Now the frequency plot is updated with the set Y scale values.
Sample Champion PRO 3.8 – User Manual
p. 30
IFT. Inverse Fourier Transform (12)
This function performs the Inverse Fourier Transform of the spectral data content (when
possible). Depending on the type of spectrum (see ID type) the resulting time data are
stored as scope data or impulse response data.
Sample Champion saves and load spectra as .SPE files, including Real and Imaginary
components, in order to achieve a perfect reconstruction of the time data by means of the
IFT.
The IFT button also automatically opens a time window containing the result of the
Inverse Fourier Transform
Edit Frequency Data (13)
This feature implements a simple frequency edit function.
Frequency Data Overlay (14)
Frequency data (in any view mode) can be overlayed. Up to 5 curves can be
simultaneously displayed (current data and 4 overlays). Frequency data drawing mode
must be set to "Draw" (not "Bar"), Y Axis and Y Scale can be freely selected. The X Axis
Sample Champion PRO 3.8 – User Manual
p. 31
can be Linear or Logarithmic.
The overlay graphs can be set and enabled by clicking the Overlay button in the
frequency data window.
This will open the Overlay Frequency Data window.
By clicking the "Set" button, the currently plotted spectrum will be set as overlay curve
(and saved in the default data directory with the name shown, as standard .SPE file). Also
all previously saved .SPE files can be loaded for overlay, provided that they have the
same FFT size and sampling frequency of currently displayed spectra. The colors of the
overlay curves can be changed by clicking the "Color" buttons. The settings of the overlay
curves are saved when the Overlay window is closed (by clicking again the Overlay
button).
A relative offset in Frequency Overlay can now be selected by the user (adding or
subtracting the desired amount in dB). Spectra measured with different amplitudes can be
thus easily compared.
Quality Control (15)
This feature allows to assign upper and lower spectra. The computed spectrum is then
compared, for each frequency, with the upper and lower limits. If even a single value is
outside bounds, a BAD message is written, otherwise the result is OK.
Sample Champion PRO 3.8 – User Manual
p. 32
Load Example_QC.spe and set Upper_QC.spe and Lower_QC.spe (included in the
setup package, Data directory) to see an example.
Show frequency data types (ID) (20)
2 = FFT of a selection from scope data
4 = FFT of selection A from IR data
6 = FFT of selection B from IR data
other = frequency data from plugins (each plugin has his own ID type)
General notes about frequency data computation
The computed frequency data depend on to current FFT settings (FFT size, weighting
window, cursor selection, phase shift and transfer function measurement).
See Settings / FFT.
The phase shift option is always enabled for averaged FFT of scope data.
WARNING: the spectral data are recomputed EVERY TIME that the refresh button (or
the F5 key ) is pressed. In the following cases special attention must be paid:
(1) loading spectral data of the same type of a currently plotted computed data
(2) analyzing frequency domain data from a scope selection after an average
measurement cycle
(1) For instance, if
Sample Champion PRO 3.8 – User Manual
p. 33
- the impulse response window is open
and
- selection A on the impulse data is active
and
- the frequency domain window of selection A is open
then
WHEN A FILE CONTAINING FREQUENCY DATA FROM SELECTION A IS OPENED,
THE LOADED DATA WILL REPLACE THE COMPUTED DATA UNTIL A REFRESH IS
PERFORMED.
This is true for every file type.
(2) For instance, if
- the scope window is open
and
- selection on the scope data is active
and
- the average mode is active and a measure cycle has been performed (number of blocks
greater than 1)
and
- the frequency domain window of the scope selection is open
then
THE FREQUENCY DATA PLOTTED WHEN THE MEASUREMENT CYCLE IS
COMPLETED ARE THE DATA AVERAGED (IN THE FREQUENCY DOMAIN) UNTIL A
REFRESH IS PERFORMED. WHEN A REFRESH IS PERFORMED AND THE
SELECTION IS ACTIVE, THE PLOTTED DATA WILL BE REPLACED WITH
FREQUENCY DATA COMPUTED FROM THE LAST SAMPLED SCOPE DATA (THE
CURRENTLY PLOTTED DATA).
When the Octave mode is selected, the value of each band is shown above the band if
enough space is available (this can be obtained by enlarging or maximizing the window).
See also Post-Processing menu.
Sample Champion PRO 3.8 – User Manual
p. 34
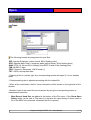
Measurement Type Selection
Measurement type selection
Pressing this button the measurement type selection window will open. Here it is
possible to select which type of analysis/measurement must be performed on the sampled
data. This dialog can be used for opening the Frequency Domain Window above.
In this window it is also possible to open or close plugins.
Three standard types of analysis are available:
(1) Selection in Time Window
(2) Selection A in Impulse Response Window
(3) Selection B in Impulse Response Window
Selection in Time Window (1)
Clicking here, the program will open a window showing frequency domain data
(magnitude, phase, real or imaginary part) of the scope window data selection, using
current FFT settings.
FFT selections can be opened / closed also by means of shortcuts buttons on the
Control Bar and using the Quick Spectrum button ( ) on the Time and Impulse
Response windows.
Sample Champion PRO 3.8 – User Manual
p. 35
Selection A in Impulse Response Window (2)
Clicking here the program will open a window showing frequency domain data
(magnitude, phase, real or imaginary part) of the impulse response window data
selection A, using current FFT settings.
Selection B in Impulse Response Window (3)
Clicking here the program will open a window showing frequency domain data
(magnitude, phase, real or imaginary part) of the impulse response window data
selection B, using current FFT settings.
Frequency domain plugins (4)
Here the program will show the list of available frequency domain plugins. Selecting one
of them, the program will open the corresponding plugin. No frequency domain plugins are
available in the above picture.
Time domain plugins (5)
Here the program will show the list of available time domain plugins. Selecting one of
them, the program will open the corresponding plugin. One time domain plugin is available
in the picture above.
Sample Champion PRO 3.8 – User Manual
p. 36
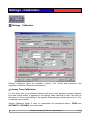
Settings - General
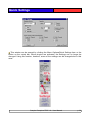
Settings - General
The input (recording) and output (playing) PCM format can be set in this window.
24 bit sampling. Two modes have been implemented:
- 24 bit (1) uses an internal data block align of 3 bytes (actually 24 bit). This mode is
suggested for sound cards with A/D and D/A converters with bit resolutions of 18 or 20 bit
(for example Pinnacle sound card)
- 24 bit (2) uses an internal data block align of 4 bytes (actually 32 bit). This mode should
work with all 24 bit sound cards.
Sample Champion PRO 3.8 – User Manual
p. 37
The Sampling Rate is the same for IN and OUT. When the settings window is open or
the sampling rate is changed, the program performs a silent full-duplex synchronous
PLAY/REC test. If the selected sampling frequency is not supported by the sound card, a
red alert message is shown. Note that the alert is shown also when the audio card is busy
(for example is currently used by another program).
Every sampling rate is supported in post-processing mode, for example loading a TIM file
sampled with MLSSA™ system at any sampling rate.
A CUSTOM SAMPLE RATE CAN BE SET JUST BY TYPING IT IN THE
FREQUENCY BOX. Using the arrows near the frequency box, the standard sample rates
can be selected.
The Buffer Length (input buffer) is actually equal to the value selected - 1 (for example
8K means 8*1024-1=8191 samples), in order to have the same length of the
corresponding MLS sequence.
The Block value indicates how many measurement cycles must be performed before
stopping the sampling.
This value can be changed also in the Quick Settings Window.
The Mode option indicates whether measured data (if Block>1) are averaged or the
data measured at every cycle overwrite the data of the previous measurement.
This setting can be changed also in the Quick Settings Window.
When the Power Frequency Average Mode is selected, the magnitude is averaged
and the phase information is ignored (set to 0)
The power average mode can be useful when sampling pure tones generated by an
external source (asynchronously). Note that when a spectrum averaged in power mode is
saved, the .SPE file is compatible with all other .SPE files (a vector of complex data,
positive and negative frequencies), but the Real part of the data is the magnitude of the
spectrum while the Imaginary part of the data is 0.
WARNING: When the Complex Frequency Average Mode is selected, the average
in the frequency domain is actually computed on complex data. This kind of average
should be performed ONLY by using the internal signal generator, to assure synchronism
and coherence between all measurements.
This setting can be changed also in the Quick Settings Window.
When the audio input format parameters are changed, the output format will be
changed accordingly. Also a Buffer Length change will cause the automatic selection of a
right length MLS signal. Output parameters and MLS signal settings can still be changed
manually.
Sample Champion PRO 3.8 – User Manual
p. 38
NOTE: Automatic Latency Calibration option can be used only when 2 Channels
INPUT / OUTPUT format is selected. When this option is enabled, the soundcard Channel
2 INPUT must be connected directly to Channel 2 OUTPUT (Loopback).
See Automatic Latency Calibration for more information.
There is some difference between averaging in time and frequency domain:
Time domain:
Impulse Response data are averaged in the TIME DOMAIN
Scope data are NEVER averaged.
Frequency domain:
FFT from Impulse Response are NEVER averaged in the FREQUENCY DOMAIN
because they are computed from data already averaged in the time domain
FFT from Scope: are averaged in the FREQUENCY DOMAIN
The Step value indicates the number of wait cycles after the actual record cycle. Wait
cycles are necessary to the program for performing all processing operations (recovery of
impulse response from MLS, FFT of selected data and other user selected processing).
The program performs also a single wait block before the actual recording cycle, to adjust
some internal settings and allow to the acoustic system to reach a stationary state. This
single block is not counted in the Step value. The signal generator is active during wait
states, in order to leave the acoustic system excited and maintain the synchronism with
the sampler.
In the example in the picture above the value of Step is equal to 4
If, for example:
Block = 8
Step = 4
Sample Champion PRO 3.8 – User Manual
p. 39
then the complete cycle of measures (repeated or averaged) requires 8*(1+1+4) = 48
recording cycles (each one containing Buffer Length samples).
This value can be changed also in the Quick Settings Window.
From the MLS Type list, it is possible to select the length and type of the MLS stimulus
or other signals
Note that when MLS length and Buffer length are not equal, the program will show
a red alert message inside the Impulse Response window.
To achieve the correct impulse response recovery, MLS LENGTH AND INPUT
LENGTH MUST BE THE SAME!
Under the MLS Type menu, the program shows the current MLS spectrum status (see
Settings / Compensation)
A custom WAV file can be used as MLS signal. It is possible in this way to pre-filter the
MLS signal itself. This could be useful, for example, when performing measurements on
tweeters or woofers.
An MLS signal generated by Sample Champion can be saved (Menu File), filtered by
means of an external software and set as custom MLS.
Tip:
The MLS signal can be filtered by means of the "Filter Banks Plugin" (that works only on
Impulse Responses), by using the following procedure:
1- Save the current generated MLS signal (Menu File) as a WAV file
2- Set (in Settings/File Options dialog) "Load WAV file as.. Impulse Response"
3- Load the WAV file (now considered as an Impulse Response)
4- Open the Filter Banks Plugin and filter the I.R. as desired
5- Save the I.R. as a WAV file and set it as custom MLS signal.
Now the filtered MLS can be used. Note that the MLS type selected in the Settings
MUST have the same order AND TAPS of the custom MLS file, for a proper
reconstruction of the Impulse Response.
Sample Champion PRO 3.8 – User Manual
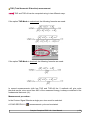
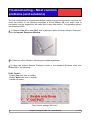
p. 40
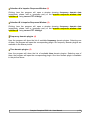
Example of Loop-Back Impulse Response, measured
using a band-pass filtered MLS signal
The Level value is the percent level of the generated digital signal, referred to full scale
(independently from mixer settings)
By means of Load and Save buttons, it is possible to load and save the current global
settings from/to an INI file.
Note that the program settings are updated only when the settings window is closed
by pressing the OK button.
The Custom signal button will open a window for selecting either a multi-tone, square or
ramp signal or a custom WAV file.
The actual frequencies of the generated signals are slightly different from those written by
the user, in order to have a perfect correspondence with the discrete frequencies analyzed
by the FFT. An increase in the FFT length will reduce the difference between generated
and desired frequencies.
Sample Champion PRO 3.8 – User Manual
p. 41
When the sine wave signal type is selected, the input and output buffers are set at
2^N samples in order to perform an exact FFT analysis (coherent sampling feature).
When the square wave signal type is selected, the generator will play a square
signal with the selected frequency only during one half of the sampling interval. This is
done because the input and output lengths are one sample shorter than 2^N samples and
it is not possible to generate a square wave of this length with the right harmonic content.
But this is not a problem when performing a measure with this signal: just select an input
buffer length 2 or 4 times longer than the FFT size. See Apllication note #5.
The Audio Hardware Adjustements button allows a "fine tuning" of the Audio Card.
Use this function ONLY if, in repeated sequences of measurements, the obtained impulse
is moving.
Connect the input to the output of the soundcard with the loop-back cable as described
in the configuration tips web page and perform a repeated sequence of measurements,
opening scope and impulse response windows.
Now different behaviors can be observed:
- the impulse response could be still (in time) and clean: in this case the adjustment for
this buffer length, channel setting and bit depth does not require any adjustment (leave
"0"). Check the cleanness by zooming the impulse amplitude to max by means of the Y
zoom slider.
Sample Champion PRO 3.8 – User Manual
p. 42
- the impulse is moving and probably is also not clean (while in the loop-back measure it
should, if input and output levels are correctly set): increase the length of this buffer (the
current setting is marked in blue in the adjustment window) if the impulse moves to the
right at every measurement cycle and decrease its length if the impulse moves to the
left. The same adjustment should be done also when the impulse is still but not clean.
Check also ALL scope data to verify whether if something is wrong.
NOTE: This function should be used only as last resource, to compensate buggy
soundcard drivers!
Sample Champion PRO 3.8 – User Manual
p. 43
Settings - Advanced
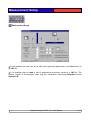
Settings - Advanced
Some advanced options can be selected in this window.
MEASUREMENT OPTIONS:
The Remove Offset from Sampled Data option causes the subtraction of the offset
present in scope data, only for the computation of the Impulse Response. The scope data
and FFT from scope data are not affected by this option.
The Normalize option causes the normalization of the calculated Impulse Response
peak between 0 and 1, overriding calibration settings.
Sample Champion PRO 3.8 – User Manual
p. 44
The Invert MLS polarity option changes the polarity of the stimulus.
The Add [number] play cycles option can be used if the testing signal stops before the
end of measure cycle, due to some bugs in the soundcard drivers.
When the Ignore first sampled buffer (in Average Mode) option is enabled the first
sampled buffer will not be averaged. This can be useful for compensating some
soundcards behavior or for specific measurements requirements.
ERROR PREVENTION OPTIONS:
Halt measurement if CPU Overload option stops the program when the CPU load is
excessive.
If CPU Overload is detected, try to:
- increase ''Step'' value in ''General Settings'' window
If the error remains, try to:
- increase Buffer length
- decrease FFT size (if FFT is used)
- decrease Sampling Rate
- avoid changing Selections and other controls inside Data windows during measures
Warnings beeps and Halt measurement if application loses focus options prevent
the user switching to applications that could break or corrupt the normal sampling data
flow.
Halt measurement if wrong data buffer is detected option stops the measurement
Sample Champion PRO 3.8 – User Manual
p. 45
when the difference (in samples) between IN and OUT buffers is greater than the
indicated value. This option works only if the audio card has a very low latency time and
must be used carefully. Should the use of this option cause some false alarms, don't
worry and disable it.
SAMPLING MODE OPTIONS:
Asynchronous sampling mode: this mode should not be used because all
advantages deriving from synchronism between IN and OUT are lost. When activated, the
sampling engine restarts at every new measurement cycle. The average mode is
disabled when this option is selected.
Asynchronous sampling mode should be used ONLY when loss of synchronism is
experienced. There is a loss of synchronism when the impulse response peak, in repeat
mode, is not located at the same time position, in every cycle (see application notes).
Blinded' Mode has been created to prevent any corruption of the sampled data caused
by the influence of the graphic plotting, especially on slow computers endowed with old
video cards. When this option is enabled, during sampling all graphic windows are hidden
and only a small text window is open.
Blinded mode should be used ONLY when a loss of synchronism is experienced.
There is a loss of synchronism when the impulse response peak, in repeat mode, is not
located at the same time position in every cycle.
Sample Champion PRO 3.8 – User Manual
p. 46
Settings - FFT
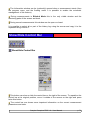
Settings - FFT
The FFT Size value is the number of points used by the current Fast Fourier Transform
algorithm. If the selection length on time data is shorter than the FFT size, the missing
points are set to zero (zero padding). Note that the implemented algorithm works on
double precision complex data and both positive and negative frequencies are computed.
The Weighting Window can be chosen among Rectangular, Bartlett, Blackman-Harris,
Hanning, Hamming, Blackman shapes. Full, half-right, half-left window types are
available. This setting can be changed also in the Quick Settings Window.
Sample Champion PRO 3.8 – User Manual
p. 47
When Show Weighting Window over Selection is checked, the shape of the window
is superimposed to the plotted data in the Scope Window or in the Impulse Response
Window.
The Phase Shifting option, when active, performs a phase shifting on the FFT data. An
IFT (Inverse Fourier Transform) on shifted data forces the computed time series to start at
t=0.
The Phase Shifting option is always enabled for averaged FFT of scope data.
When the Transfer Function Measurement option is active, the computed FFT data
are normalized by the Signal Amplitude voltage value. Use this option when analyzing
Impulse Response data.
The Signal Amplitude voltage value is the RMS level of the output signal. It must be
manually set. Note that this value is expressed in milliVolts.
The Cursor Selection channel assignments option assigns one of the two data
channels to the FFT, in case of 2 channel measurements.
This function is available also in the Quick Settings Window.
Sample Champion PRO 3.8 – User Manual
p. 48
Settings - Compensation
Settings - Compensation
Here the user can select some pre and post-filtering operations on the sampled data or
on the generated signals.
Sample Champion PRO 3.8 – User Manual
p. 49
The following flow chart describes the input and output signal paths:
In the chart, Acoustic System denotes the system under test, for example a room or a
loudspeaker.
When the Measure Chain Equalization (INPUT Correction) option is enabled, the
content of all frequency domain banks (FFT of a selection of scope or impulse response
data) are processed by performing the selected operation (Multiply or Divide) by the
selected frequency domain file (.SPE). This operation, represented by OP1 in the flow
chart, is performed on complex numbers. Note that both internal frequency domain banks
and .SPE files contain complex numbers and both positive and negative frequencies.
The number of samples of the selected frequency .SPE file and the internal current
FFT size must be the same. Also the Sampling Frequency of the selected file and the
current internal Sampling Frequency must be equal.
When the Microphone Compensation option is enabled, the content of all frequency
domain banks (FFT of a selection of scope or impulse response data) are processed by
performing the compensation that has been selected.
NOTE: only frequency domain banks are automatically compensated! Time
domain data (Impulse Response) can be manually compensated (see Post-Processing
functions).
Sample Champion PRO 3.8 – User Manual
p. 50
Two methods
implemented:
for
reconstructing
the
Microphone
Frequency
Response
are
- Spline
The user can manually try to reproduce the microphone frequency respone curve (when
only a graph is furnished by the microphone manufacturer). This is an empirical method.
- Frequency Response furnished by the microphone manufacturer.
This function adds the capability of recognizing microphone frequency responses (ASCII
format). Now the microphone can be perfectly compensated by means of data furnished
by the manufacturer. The range of the microphone compensation extends up to 48 kHz.
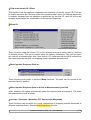
The format of the compensation ASCII file must be selected manually
Sample Champion PRO 3.8 – User Manual
p. 51
The above figure shows a configuration example for recognizing a microphone
compensation file in the following format:
MDF (Microphone Data Format) File
Author=LinearX Systems Inc
Date=May 3,2000 Wed 11:52AM
Model=M53
Serial=105271
dBspl= 94.00
dBm= -14.16
Points=552
Index Freq(Hz) dB Deg <-- 9 comment lines
1 10.15 -13.44 0.00
2 10.31 -12.81 0.00
3 10.46 -12.50 0.00
4 10.62 -12.31 0.00
5 10.78 -12.01 0.00
6 10.94 -11.64 0.00
7 11.11 -11.41 0.00
[...]
Sample Champion PRO 3.8 – User Manual
p. 52
NOTE: to use spectrum data exported from Sample Champion as Microphone
Compensation files, select the following settings:
- FFT Size 1K points
- Export frequency data as a TXT file and use the following exporting options (Settings /
File Options):
- Use the following Manufacturer Microphone Data File Format options:
When the Frequency Weighting option is enabled, the content of all frequency domain
banks (FFT of a selection of scope or impulse response data) are processed by
performing the selected frequency weighting (A, C, U or AU).
When the MLS Equalization (OUTPUT Correction) is enabled, the output signal is
filtered before being sent to the loudspeaker. The selected operation (Multiply or Divide)
is performed in the frequency domain using the selected file (.SPE) and complex
numbers. This operation is denoted In the flow chart as OP2.
The number of samples of the selected frequency .SPE file and the internal current
FFT size must be the same. Also the Sampling Frequency of the selected file and the
current internal Sampling Frequency must be the same.
Since the result of the filtering operation will feed the sound card, it must be smaller
than 32767 (the maximum 16 bit integer value) in absolute value, when 16 bit output
signal is used. Depending on the filter gain (at every frequency) this could not occur, and
cause distortion. In this case the program will show an alert window with some
suggestions for solving this problem:
Sample Champion PRO 3.8 – User Manual
p. 53
Note 1: filtering is performed by working with complex numbers and the result is converted
to long integers only at the end of the process.
When the Normalize MLS signal option is enabled, the output signal is normalized.
This option must be used when the alert window above is shown or when the generated
signal is too low or not audible.
A high-precision narrow-band Pink Filter can be applied, if desired, to the output signal
by marking the appropriate checkbox.
Since the result of the filtering operation will feed the sound card, it must be smaller
than 32767 (the maximum 16 bit integer value) in absolute value. Depending mainly on
the MLS sequence length and amplitude, this could not occur, and cause distortion. In this
case the program will show an alert window with some suggestions for solving this
problem:
Note 1: filtering is performed working with complex numbers and the result is converted to
long integers only at the end of the process.
Note 2: the min and max values written in the alert window depend also on the current
calibration.
Sample Champion PRO 3.8 – User Manual
p. 54
The Free Field Reference Impulse Response selection allows the selection of a .IRE
file that can be plotted (overlapped) in the Impulse Response Window. This feature could
also be used by future developments of the program or by specific plugins. The Impulse
Response in the file must use the same Sampling Frequency inserted in the current
program settings.
The Default Dir button allows the selection of a default directory for file operations.
Sample Champion PRO 3.8 – User Manual
p. 55
Settings - Calibration
Settings - Calibration
Different calibration types are available: Latency Time (Fixed and Automatic) and
Amplitude Calibration (Real-time and Manual).
Latency Time Calibration:
it is the delay (due to soundcard hardware and drivers and operating system) between
input and output buffers; it depends on the specific audio card that is used. The effect of
this delay is a left or right shifting of the Impulse Response peak (ideally placed at t = 0 for
a loopback mesurement).
Sample Champion allows 2 ways to compensate the soundcard latency: FIXED and
AUTOMATIC / DYNAMIC (recommended).
Sample Champion PRO 3.8 – User Manual
p. 56
NOTE: the FIXED calibration can be used when the soundcard presents always the
same latency delay every time that a measurement is started (SYNC REC/PLAY ).
A soundcard has fixed latency if the peak of a measured loopback impulse
response is placed always at the same time position, in different measurements.
If, in different measurements, the peak of a measured loopback impulse response
is placed at different time positions, the DYNAMIC latency calibration option must be
used. In this last case the measurement must be stereo and the channel 2 must be in
loopback (soundcard output channel 2 connected to soundcard input channel 2).
Generally the DYNAMIC latency calibration option is preferred when external
soundcards (USB or Firewire) are used.
LATENCY TIME CALIBRATION PROCEDURE (FIXED)
Automatic procedure: press the Detect Now! button and the Go! Button. The delay is
measured and set automatically. Note that the INPUT of the audio card must be directly
connected to its OUTPUT and the levels must be correctly set (see the manual procedure
below for more details).
Some audio cards are not compatible with the automatic procedure. In this case, the
manual procedure can be used.
Manual procedure:
- Connect the INPUT of the audio card directly to its OUTPUT (loop back)
- Open the Impulse Response Window
- Open the Settings Window and set (for example) the following parameters:
- In and Out 16 bit, Mono
- Buffer Length = 4K
- Block = 1
- Mode: Repeat
- Sampling Rate 44100 Hz
- Step: 2
- MLS: 4K (12, 11, 10, 2)
- Uncheck any Output Correction
- Press Syncro Start/Stop and perform a measurement
Sample Champion PRO 3.8 – User Manual
p. 57
- If the input level is too low, open the mixer and adjust it
- Locate the X value of the impulse response peak by moving the cursor on the
wave (use the Locate Peak button and the Show Info on Image for help)
- Open the Settings|Calibration window and insert the X value found in the Latency
Time Calibration field, changing its sign, and check Manual (for example if
X=112, write: -112)
- Repeat the single measure procedure and search for the peak. Now it should be
located near zero (the t=0 value is not visible). If this does not happen, adjust the
latency time value until the peak is in the proximity of zero. Remember that the
Impulse Response recovered using MLS is wrapped at the end of the buffer length:
an excessively negative value will cause the impulse peak to move to the end of
the data buffer. In this case simply increase the inserted value as much as
necessary.
Note: every audiocard has a specific latency time value. Just one measurement is
needed. The latency time value could change when audio card drivers or configuration are
updated and (in rare cases) changing sample frequency.
AUTOMATIC LATENCY TIME CALIBRATION (DYNAMIC)
This option allows a very robust synchronization of your soundcard and avoids all
errors due to data sync loss. It allows extremely accurate measurements when used
in the Average mode.
When the auto-sync function is active, the time latency calibration (that depends on many
factors: soundcard hardware and drivers, operating system, etc..) will be automatically
compensated.
It can be enabled in the Settings/General window:
or in the Settings/Calibration window:
Sample Champion PRO 3.8 – User Manual
p. 58
When this option is enabled, the soundcard Channel 2 INPUT must be connected directly
to Channel 2 OUTPUT (loopback).
Example of connection:
Sample Champion PRO 3.8 – User Manual
p. 59
Adjust input and output levels of Channel 2 in order to obtain a low input peak level.
Usually a value of 1% or 2% of the peak level is enough to activate the sync function.
The microphone (or any other input device) can be connected to Channel 1 INPUT. The
power amplifier and loudspeaker can be connected to Channel 1 OUTPUT.
When this option is active, the saving window consents to optionally save only the impulse
response channel 1 data (channel 2 contains only sync information).
Tip: In most of soundcards the crosstalk between channels and between in / out is
sufficient for the sync information (very sensible). In this case the Automatic latency
feature can work also without connecting a loopback cable on channel 2.
Amplitude Calibration:
it is possible to perform an amplitude calibration in real-time, using the internal signal
generator or an external calibrator (standard 1 kHz calibrator), or manually.
- The Input % F.S. field shows the measured input peaks (Left and Right channel)
as full scale percentage
- The Input Level field must be used to insert the requested value (be sure to use
'.' or ',' according with the international settings of your operating system)
- The Scope Value and Spectrum Value fields are filled by the program at the end
of the calibration procedure
- All other check buttons can be selected by the user to change the input calibration
level mode (Peak or RMS), the level units (Volts, mVolts or SPL (dB)) and the view
mode (Peak or RMS)
Sample Champion PRO 3.8 – User Manual
p. 60
AMPLITUDE CALIBRATION PROCEDURE
CALIBRATION USING AN INTERNAL SOURCE:
- Open the Settings|Calibration window
- Connect the INPUT of the audio card directly to its OUTPUT (loop back)
- Press the calibration using an INTERNAL source button to start the procedure.
A pure tone (1 kHz) will be generated by the sound card
- Open the mixer by pressing the Open Mixer button, check by means of the input
peak level meter (if available) the absence of any saturation and that the indicated
values are reasonable (for example -6 dB for both channels). Check also that the
output peak level meter (if available) does not indicate any saturation and that the
indicated values are reasonable
- Write in the Input Level fields the desired values for left (or mono) and right
channels. Select also all other options (Peak, RMS...) as desired
- Press the Go! button and wait the ENDED status of the sampling engine
- The Scope Value and Spectrum Value fields should be now filled by the
program with the requested values. From now on, all measured values will be
calibrated
according
to
these
values
CALIBRATION USING AN EXTERNAL SOURCE:
- Open the Settings|Calibration window
- Place on the microphone an external calibrator and turn it on
- Press the calibration using an EXTERNAL source button to start the procedure
- Open the mixer by pressing the Open Mixer button, check by means of the input
peak level meter (if available) the absence of any saturation and that the indicated
values are reasonable (for example -6 dB for both channels).
- Write in the Input Level fields the desired values for left (or mono) and right
channels. Select also all other options (Peak, RMS...) as desired
- Press the Go! button and wait the ENDED status of the sampling engine
- The Scope Value and Spectrum Value fields should be now filled by the
program with the requested values. From now on, all measured values will be
calibrated according to these values
Sample Champion PRO 3.8 – User Manual
p. 61
Examples of calibraton:
(1)
(2)
(3)
(5)
MANUAL CALIBRATION:
In the Setting / Calibration window the following section is present:
The manual procedure allows to set a dB (Peak) calibration without a real measurement.
The user can assign to a time peak value (Scope window, raw sampled data) a dB (Peak)
power level by pressing the SET button.
In the example above a peak value of 32767 in Scope window has been assigned to 0 dB.
Sample Champion PRO 3.8 – User Manual
p. 62
In this way a 16 bit WAV file with a sine signal between +/- 32767 will show a spectrum
with a peak of 0 dB. With this same calibration a WAV file with a sine between +/-327 will
show a peak in the spectrum of about -40 dB.
The Scope data info button searches minimum and maximum values of the current data
in Scope buffer (loaded from a file or measured in real-time). The uncalibrated maximum
data (Left and Right channels) are automatically written in the LEFT and RIGHT fields of
manual calibration.
The manual calibration is very simple: after pressing the Scope data info button, the user
can write the desired dB value for LEFT and RIGHT channels (only LEFT for mono) and
press SET. This procedure assumes that a pure tone signal is in Scope data buffer.
In the above example a 100 dB value has been set. The LEFT and RIGHT values (7976
and 7912) are the raw (uncalibrated) max values found in the Scope window, written
automatically after pressing the Scope data info button.
Sample Champion PRO 3.8 – User Manual
p. 63
Settings - Hardware
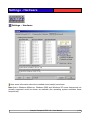
Settings – Hardware
Here some information about the installed sound card(s) are shown.
Note that in Windows Millenium, Windows 2000 and Windows XP some frequencies not
actually supported could be shown as available (the operating system emulates those
frequencies).
Sample Champion PRO 3.8 – User Manual
p. 64
Settings – File Options
Settings – File Options
Save Impulse Response as WAV
Impulse Response can be exported as WAV file. The following WAV formats are
supported:
PCM WAV 16 bit (Integer format)
PCM WAV 32 bit (Integer format)
IEEE WAV 32 bit (Floating Point format)
IEEE WAV 64 bit (Floating Point format)
The WAV type can be selected in the drop-down menu of the Save window.
Sample Champion PRO 3.8 – User Manual
p. 65
Some normalization options concerning WAV files LOAD and SAVE are available.
Example: a PCM 16 bit WAV file can handle integer data between +/-32767. A
measured impulse response has a peak value of 0.254 mPascal. If it is saved as PCM 16
bit WAV without normalization, the resulting WAV file will contain only zero values.
The same happens when saving as PCM 32 bit WAV, that can handle integer data
between +/-2147483647.
The IEEE floating point WAV format does not have this problem since can handle floating
point data. A normalization to "1" is available anyway for giving the better compatibility
with other software.
The normalization feature can be disabled setting the normalization peak value to "0".
TIM File Exporting Options
When a measured STEREO IR or Scope is saved in .TIM format, it is possible here to
select the channel to be exported (TIM files support only 1 channel).
Load WAV File as...
A WAV file, when loaded, can be recognized by Sample Champion as Scope or Impulse
Response Data.
When loading a WAV file (that can be classified as Scope or Impulse Response by the
Load WAV file as setting), another option is available:
- Impulse Responses: the peak can be optionally normalized to "1"
- Scope data: the current amplitude calibration can be optionally applied.
Frequency Data Exporting Options
Some options for exporting Fequency Data as ASCII file (type of exported data, separator
characters, spaces between values) can be selected here.
Sample Champion PRO 3.8 – User Manual
p. 66
Impulse Response and Scope Data Exporting Options
Some options for exporting Impulse and Scope Response Data can be selected here.
The Simple Form exporting option enables the simplest format of the exported Impulse
Response and Scope Data.
ASCII (TXT) Impulse Response files measured by using other software can be also
imported. Only single channel Data are accepted. The format of the imported files is the
following:
Row nr. 1 --> Title (Text, Ignored)
Row nr. 2 --> DeltaT (ms)
Row nr. 3 --> Number of Data = N
Row nr. 4 --> Data nr.1
Row nr. 5 --> Data nr.2
Row nr. 6 --> ..
Last Row ---> Data nr.N
Example (4096 data, Fs=48kHz):
My Impulse Response
0.0208333 <-- This is DeltaT (ms); DeltaT=1000/Sampling Frequency
4096 <-- This is the number of the following Data
0.00114076 <-- This is the Data nr. 1
0.00135692 <-- This is the Data nr. 2
...
The above format is similar to the format of the files exported by the MLSSAsystem. IR
and Scope Data are exported by Sample Champion in this format when the Simple Form
option is enabled.
Sample Champion PRO 3.8 – User Manual
p. 67
Quick Settings
This window can be opened by clicking the Menu Options/Quick Settings item or the
button on the control bar. When plugins are activated, the Settings can no longer be
changed. Using this function, however, some of the settings can be changed also in this
case.
Sample Champion PRO 3.8 – User Manual
p. 68
Measurement Setup
Measurement Setup
In this window the user can set or edit some geometry parameters, and Save them in
an .INI file.
It is possible also to Load a set of parameters previously saved in a .INI file. The
current version of the program uses only the information concerning Selection A and
Selection B.
Sample Champion PRO 3.8 – User Manual
p. 69
Mixer
Mixer
The built-in mixer is a general purpose mixer. It tries to read all input and output sources
and the available real-time peak meters from the sound card driver. Some hardware is not
completely compatible with the internal mixer. In these cases please use the standard
Windows™ mixer or the mixer application provided by the audio card manufacturer. See
Tweaks function to find more information about selecting the mixer application.
The OUTPUT SOURCE SELECTION list shows all available sound card outputs.
If a source is checked the corresponding output is enabled.
The INPUT SOURCE SELECTION list shows all available sound card inputs.
If a source is checked the corresponding input is enabled.
It is recommended to select ONLY the input (line or mic) and the output (wave out)
sources strictly necessary for the measure (see for example the picture above, concerning
a Turtle Beach Pinnacle audio card).
Generally speaking, it is better to use the Line In input instead of the Microphone
input because Line In has a better signal/noise ratio. There are, however, some positive
exceptions (for example the TB Pinnacle audio card, that can handle also condenser
microphones with phantom power).
Sample Champion PRO 3.8 – User Manual
p. 70
Measurement Info Window
Measurement Information
This window shows some information about the measure. At every measurement cycle,
the number of blocks that have been processed and the peak position are reported here.
This log should be used especially for Impulse Response measurements: the value of the
peak position must be the same for every measurement in the same cycle. If this does
not happen, some measure error has occurred and further investigation is required.
Other features in the Information window:
- Estimated remaining measurement time
- Impulse Response Peak/Noise ratio
- Automatic control of repeated measurement correctness, checking peak position of
every measure
Sample Champion PRO 3.8 – User Manual
p. 71
The Information window can be (optionally) opened when a measurement starts (from
the program menu and the floating menu it is possible to enable the automatic
management of this feature).
During measurements in Blinded Mode this is the only visible window and the
remaining parts of the screen are black.
During normal measurements this window can be open or closed.
It is possible to select all or part of the history log using the mouse and copy it to the
clipboard using Control-C.
Show/Hide Control Bar
Show/Hide Control Bar
This button can show or hide the control bar on the right of the screen. To reposition the
control bar at its original position, move it outside of the screen on the right and press
twice this button.
The control bar are shows some important information on the current measurement
parameters and state.
Sample Champion PRO 3.8 – User Manual
p. 72
Floating Menu
The most important menu commands are available in this menu, Right-click on the
program desktop or on the control bar to open this menu.
Personalization
The program can be personalized with Name, Address...
Sample Champion PRO 3.8 – User Manual
p. 73
Tweaks
Here some emergency and service functions can be accessed. The selection of the
mixer application is located here.
In some rare cases the Full-duplex test performed when the Settings window is opened
causes troubles and errors. This test can be disabled from this menu.
Under Windows 98 it is available a global system resource monitor, integrated in
Sample Champion. The resource usage level information is located on the remote bar.
Sample Champion PRO 3.8 – User Manual
p. 74
When system resources are too low, a warning window is opened, and some actions are
suggested :
This function can be enabled only in Windows 95, 98 and Me.
Other fine tuning options are available (File menu):
User Graphical Interface adapting to XP. This can be enabled when SC runs in XP
family operating systems to adapt the windows sizes and other graphic parameters.
Adapt to Large Fonts: Sample Champion can work correctly also when Large Fonts
are in use in Windows. Since the Windows appearance, with Large Fonts in use, is
different in different Windows versions, the user can select the better Mode, for an optimal
setting.
The toolbar will be shown correctly when the optimal Mode is selected. The Adapt to
Large Fonts function is enabled or disabled automatically when the user changes the Font
setting in windows, but can be also enabled or disabled manually. The Large/Small Fonts
setting in Windows can be found in Screen/Properties/Settings/Advanced: Large Fonts
(120 dpi) or Small Fonts (96 dpi). The Small Fonts setting is anyway recommended.
Sample Champion PRO 3.8 – User Manual
p. 75
Sampling Engine Commands
Record
This button starts the sampling engine without starting the signal generator.
Play
This button starts the signal generator without starting the sampling engine.
Sync Rec-Play
This button starts the signal generator and the sampling engine synchronously.
Windows Managing
Cascade
This button arranges all child windows inside the program in the Cascade mode.
Tile
This button arranges all windows inside the program in the Tile mode. It is particularly
useful when only 2 windows are open (for example Impulse Response and FFT of
Selection A of Impulse Response).
Minimize
This button Minimizes all child windows inside the program.
Refresh
This button Refreshes the plots in all child windows inside the program.
NOTE: The refresh action has also some side effects such as reprocessing the data
in all enabled selections (see previous sections).
Sample Champion PRO 3.8 – User Manual
p. 76
RemoteSC
Sample Champion can now be triggered by means of a command line (from a DOS
window or an external program). A small utility called RemoteSC is included in the setup
package. This utility can be called from a command line or from any external program. It
allows to start a measurement and save automatically the measured Impulse Response
as TXT or WAV files.
BEFORE using this utility:
- Start and leave open Sample Champion that must be ready to start a measurement
Usage example:
C:\RemoteDirectory>RemoteSC c:\data\filename.wav -wav
Starts a measurement cycle and saves the measured Impulse Response as a WAV file
C:\RemoteDirectory>RemoteSC c:\data\filename.txt -txt
Starts a measurement cycle and saves the measured Impulse Response as a TXT file
From the website it is possible to download an example, which includes the Delphi 5
source code, for calling RemoteSC from a custom program.
Sample Champion PRO 3.8 – User Manual
p. 77
Post-Processing Functions
Some useful post processing functions can be accessed from this menu.
Invert I.R.
This function changes the sign of the current I.R.
Reverse I.R.
This function reverses the current I.R. with respect to the middle time point.
Normalize I.R. Peak to 1
This function normalizes to 1 the peak value of the current I.R..
Sample Champion PRO 3.8 – User Manual
p. 78
Find and subtract I.R. Offset
This function finds the continue component and subtracts it from the current I.R. This can
be useful also when the "Remove offset from sampled data" option (in Settings Advanced)
is enabled, because here the operation is performed on the final I.R. (and not on the raw
sampled signal before the computation of the Impulse Response).
Wrap I.R.
These functions wrap the current I.R. by the selected amount of points (also by fractions
of discrete points). This can be useful when the Latency Calibration Time had not been
set correctly at measurement time. Note that an I.R. measured with the MLS method has
the same period as the MLS, so wrapping doesn't generate discontinuities.
Move Impulse Response Peak at...
These functions are similar to previous Wrap functions. The peak can be moved at the
selected (fixed) X position.
Move Impulse Response Peak at X=100 at Measurement Cycle End
When enabled, this option automatically place the impulse peak at sample N. 100 when
the measurement cycle is ended.
Increase / Decrease / Normalize FFT Spectrum(s) Magnitude
These functions can be useful for a quick comparision of frequency spectra measured at
different amplitude levels. See also Edit Frequency function
Sample Champion PRO 3.8 – User Manual
p. 79
Smooth Spectrum Data
This is a post-processing function for smoothing spectra. The number of cycles can be
selected, to obtain a more deep effect.
The smoothing is obtained performing a moving average on the frequency data. The
spectrum, after the smoothing, will have only Real data (the Imaginary part is set to 0).
The original (unsmoothed) spectrum can be restored by pressing F5 (refresh).
Sample Champion PRO 3.8 – User Manual
p. 80
File Operations
Frequency files (.SPE) and Impulse Response files (.IRE) can be summed or averaged.
If the first line of the comment field of the file has the following content:
[W=x] where 0 ≤ x ≤ 1,
the file is weighted according to the specified value.
For example [W=0,5] attributes to the file a 0,5 weight. This can be useful for performing
loudspeaker sound power measurements or spatial averages of measurements made in
different points of a concert hall.
The File Operations function can be used also for rescaling a frequency or time file by
any desired factor (just select a single file, with the desired rescaling factor in the
comment field as described above).
A custom TXT file with a list of Position-Weighting associations can be created by the
user. The desired weighting value can then be obtained by pressing the button Get
Weight from File in the Save Dialog before saving the file. The TXT file must contain a
list of weights in this form:
[Loudspeaker Position 1]=[1]
[Loudspeaker Position 2]=[0,85]
Sample Champion PRO 3.8 – User Manual
p. 81
[Loudspeaker Position 3]=[0,80]
[Loudspeaker Position 4]=[0,75]
[Loudspeaker Position 5]=[0,5]
[Loudspeaker Position 6]=[0,45]
[Loudspeaker Position 7]=[0,55]
[Loudspeaker Position 8]=[0,85]
[Loudspeaker Position 9]=[0,90]
[Loudspeaker Position 10]=[1]
A .TXT file with these values will generate a Position-Weighting associations list as
shown in the following picture:
Sample Champion PRO 3.8 – User Manual
p. 82
Spectra Merge
This function is very useful for merging Nearfield with Farfield measurements. This
function can be activated from the Processing menu.
This is an example concerning the use of this function (with 2 of the spectrum files in the
setup package):
- Open SC and select in the processing menu "Spectra merge"
- Load as File 1 "Lower_QC.spe"
- Load as File 2 "Upper_QC.spe"
- Select "Combine file 1 and 2" and press Refresh (set Top Plot value around -42 dB for
plotting the spectrum)
- Now you can "attach" the first spectrum to the second at the split point (or vice versa)
and save the result of the operation
Apply Mic. Weighting (and Inverse) to I.R.
This function applies (or removes, if inverse) the current microphone compensation to the
current I.R. Note that when Microphone Compensation (Settings/Compensation) is
enabled, only the FFT data are compensated). This time data filtering operation requires
remarkable computational resources and cannot be performed in real-time. It can be
useful when an Impulse Response must be processed by a Time Domain plug-in
(Waterfall Plot, Room Acoustics, Enhanced View...).
Sample Champion PRO 3.8 – User Manual
p. 83
Apply Frequency Weighting (and Inverse) to I.R.
This function has the same behavior of the above Mic. Weighting function, but
compensates the I.R. according to the currently selected frequency weighting
(Settings/Compensation).
Apply Pink Filtering (and Inverse) to I.R.
This function applies to the Impulse Response a Pink (or inverse Pink) filtering. This
operation can be useful when analyzing in octave bands measurements performed with
an unfiltered MLS signal.
Here is a pink filtering example:
This is a simple loop-back measurement and gives a flat power spectrum when its
frequency content is analyzed in narrow band. But when an 1/3 octave frequency analysis
is required, the graph will look like the following:
In the above plot, the effect of 1/3 octave band analysis is correctly shown: every
subsequent band is about 1 dB greater than the previous one (3 dB in 1/1 octave
analysis).
By applying pink filtering to the Impulse Response, the result will look as follows:
Sample Champion PRO 3.8 – User Manual
p. 84
Now the 1/3 octave plot will look as follows:
where every band has the same amplitude. See also Application note#6 about Pink
Filtering.
Clear all Data Buffers
This function clears all data buffers (Time and Frequency) of the software.
Sample Champion PRO 3.8 – User Manual
p. 85
RTA (Real Time Analysis)
In Sample Champion is possible to analyze simultaneously in real-time the 2 oscilloscope
input channels and perform some DSP functions on them.
The RTA functions display can be opened by pressing the button:
placed on the remote bar.
In order to operate properly, the RTA window requires that:
- Number of input channels = 2
- INPUT BUFFER LENGTH = FFT LENGTH
For example, for a buffer of 16K samples, the settings are the following:
Sample Champion PRO 3.8 – User Manual
p. 86
All the frequency windows in the main program must be closed when RTA functions are
used.
In the SIGNAL ANALYSIS FUNCTIONS window, the FFTs of one or both input channels
can be plotted simultaneously, using different graph options. Note that, in some cases,
when the FFTs of both channels are plotted, it could be necessary to use the line plotting
option, to prevent the masking of one channel by the other.
Sample Champion PRO 3.8 – User Manual
p. 87
Also 1/3 Octave and 1/1 Octave plot of both channels or of a single one are available:
It is possible to optionally write the Octave or 1/3 Octave value and frequency directly on
the plot.
Sample Champion PRO 3.8 – User Manual
p. 88
From the FFT data of the 2 input channels it's possible to perform in real-time and plot the
following DSP functions:
- Transfer function [L(1)] / [R(2)] (Frequency Domain)
- Transfer function [R(2)] / [L(1)] (Frequency Domain)
- Cross-Spectrum [L(1)] * [R(2)] (Frequency Domain)
- Cross-Spectrum [R(2)] * [L(1)] (Frequency Domain)
- Coherence (Frequency Domain)
- Auto-Correlation [L(1)] (Time Domain)
- Auto-Correlation [R(2)] (Time Domain)
- Cross-Correlation (Time Domain)
- Correlation Meter
- Stereo Check
Sample Champion PRO 3.8 – User Manual
p. 89
Transfer function
This function performs the complex FFT operation of channel 1 divided by the FFT of
channel 2 (L/R) or the FFT of channel 2 divided by the FFT of channel 1 (R/L).
When measuring a transfer function, it's recommended to use a wide band signal (MLS)
to obtain information on the entire audio band up to half the sample rate. In some cases it
could be useful to make some averages to improve the measures.
IMPORTANT NOTE: when using the RTA functions, ONLY the complex average is
available and NOT the power average. In other words, the average is done on the
complex FFT data and when average option is enabled IT'S RECOMMENDED to use
ALWAYS the internal signal generator to maintain the synchronism between each block
of time data sampled and perform thus correctly the average.
Cross-Spectrum
This is computed by multiplying one complex spectrum by the complex conjugate of a
second spectrum. It gives information about the power common to 2 signals.
Sample Champion PRO 3.8 – User Manual
p. 90
In the figure above a Cross-Spectrum example is shown. The spectrum of channel 1 is
plotted in green, the spectrum of channel 2 in red and the Cross-Spectrum in yellow. The
frequency axis is linear. Also the MAX values of the spectrums are shown on the plot .
Note that the Cross-Spectrum of ch.1*ch.2 can be different from the Cross-Spectrum of
ch.2*ch.1!
The spectra of the 2 input channels can be plotted on the same plot as the the selected
function (in the frequency domain). The input spectrum can be plotted also in 1/3 octave
mode, like in the example below (frequency axis logarithmic):
Sample Champion PRO 3.8 – User Manual
p. 91
Coherence
This function is the ratio of the squared magnitude of the Cross-Spectrum and the
spectrum of channel 1 multiplied by the spectrum of channel 2. It gives information about
the mutual linearity of the channels.
The example below shows the coherence of a signal before (ch.1) and after (ch.2) a digital
reverb effect.
Cross-Correlation and Auto-Correlation
These Time domain functions give information about the mutual correlation of 2 signals
(or the same signal in case of Auto-Correlation). It is very useful for finding, for example,
echo or delays in time data. In the example below a signal has been passed through a
digital echo effect; the peaks correspond to the delays (with feedback) set on the effect
machine.
Sample Champion PRO 3.8 – User Manual
p. 92
Correlation Meter
This function offers a quick and easy way to check the correlation between the 2 input
channels. This measurement can be performed by pressing only REC (red) button (no
signal generator) for measuring, for example, a stereo musical signal. In other cases it is
possible to use the signal generator.
The result gives a correlation index between the 2 channels. Specifically:
+1 means that LEFT and RIGHT signals are identical
0 means that LEFT and RIGHT signals are not correlated
- 1 means that LEFT and RIGHT signals are identical and exactly out of phase (180º)
Stereo Check
This function plots the LEFT channel versus the RIGHT channel. It's easy, in this way, to
obtain information about the 2 channels.
–
Example of a stereo musical signal:
Sample Champion PRO 3.8 – User Manual
p. 93
- Example of a mono musical signal. The amplitude of the 2 signals are exactly the same
since the slope of the line is exactly 45 degrees:
- Example of a signal present only on the right channel:
Sample Champion PRO 3.8 – User Manual
p. 94
Audio Quality functions
In an early version of Sample Champion the computation of SNR, THD, THD+N and IMD
had to be done in the Audio Quality Plugin. Now the computation of SNR, THD, THD+N
and IMD can be performed in the RTA window.
SNR (Signal to Noise Ratio) measurement
The SNR value is the ratio of the peak power level to the remainig noise power.
Measurement procedure:
In the Custom Signal Window (Settings/General/Custom Signal) a single pure tone must
be selected. The following figure shows an example (1 kHz tone).
Sample Champion PRO 3.8 – User Manual
p. 95
Then a SYNC REC/PLAY (
loopback connection).
) measurement cycle can be started (for example with a
If the Averaging Mode has been selected, at each cycle the SNR value will decrease until
the minimum value is reached.
A data box containing all details about the parameters computation can be shown inside
the data box (View details option).
Different methods can be selected for the evaluation of the Noise Floor value in the SNR
computation.
1- computation of the Noise Floor level as logarithmic sum of narrow band power levels in
a frequency range selected by the user. This option can be used for estimating the
Noise Floor WITHOUT the harmonics due to distortion; it is, for instance, possible to
select the band 100..800 Hz when a 1 kHz tone is used as signal generator.
2- manual: this option allows to set manually the Noise Floor value. It can be measured,
for example, recording the background noise in absence of input signals.
3- computation of the Noise Floor level as logarithmic sum of narrow band power levels on
the whole bandwidth from 20 to 20000 Hz.
Sample Champion PRO 3.8 – User Manual
p. 96
A yellow line corresponding to the Noise Floor level and a blue line under the frequency
range selected by the user for the computation can be optionally visualized on the plot.
If the pure tone used for the measure falls inside the frequency range selected by the
user, it is automatically excluded from the computation.
The Noise Floor value used for THD+N computation is not influenced by this option and is
computed on the whole bandwidth; all harmonics generated by the 2 pure tones are also
automatically excluded.
IMD computation is not influenced by this option.
Sample Champion PRO 3.8 – User Manual
p. 97
THD (Total Harmonic Distortion) measurement
THD and THD+N can be computed using in two different ways.
If the option THD Mode is unchecked, the following formulas are used:
If the option THD Mode is checked, the following formulas are used:
In normal measurements (with low THD and THD+N) the 2 methods will give quite
identical results, since more than 99% of the measured energy is always contained in the
fundamental harmonic (H1).
Measurement procedure:
In the Custom Signal Window a single pure tone must be selected.
A SYNC REC/PLAY (
) measurement cycle can be started.
Sample Champion PRO 3.8 – User Manual
p. 98
THD and THD+N will be computed and shown.
The View details window can show additional information:
Sample Champion PRO 3.8 – User Manual
p. 99
IMD (InterModulation Distortion) measurement
This parameter gives a measure of the distortion caused in the device under test
by two pure tones (cross modulated power). The following harmonics are considered:
(Tone 1 = f1)
(Tone 2 = f2)
(f2-f1)
(f1-2*(f2-f1))
(f1-(f2-f1))
(f1+2*(f2-f1))
(f1+3*(f2-f1))
(2*f1)
(f1+f2)
(2*f2)
(3*f1)
(2*f1+f2)
(2*f2+f1)
(3*f2)
The IMD value is computed as the ratio of the sum of the power levels of the
intermodulation harmonics to the sum of the power level of the two strongest tones.
Measurement procedure:
In the Custom Signal Window two pure tones must be selected.
Select the IMD function and start a SYNC REC/PLAY (
) measurement cycle.
Common choices of the two fundamental frequencies are:
* SMPTE: 60 Hz and 7 kHz (4:1 ratio)
* DIN: 250 Hz and 8 kHz
* CCIF: 19 kHz and 20 kHz
SNR, THD, THD+N AND IMD MUST BE MEASURED ONLY
USING THE INTERNAL SIGNAL GENERATOR
Sample Champion PRO 3.8 – User Manual
p. 100
Load and Save Spectra in RTA window
Spectra measured in RTA window (narrow band, 1/1 or 1/3 octave) can be loaded and
saved. The functions (Transfer function, Cross-Spectrum, Coherence, Auto-Correlation,
Cross-Correlation) can be computed in post-processing mode on loaded data.
Left channel and right channel FFT banks can be saved and loaded independently.
Data of scope spectrum or functions can be exported as TXT files (with options set in
Settings/File Options) and the graph can be saved as BMP image.
POINTS TO REMEMBER WHEN USING RTA FUNCTIONS:
- THE AVERAGE IS COMPUTED ONLY IN COMPLEX MODE
- ONLY THE INTERNAL SIGNAL GENERATOR MUST BE USED
- IF THE YELLOW LABEL "BUFFER OK" ON THE REMOTE BAR IS NOT VISIBLE
EVERY SAMPLING CYCLE, THE STEP VALUE MUST BE INCREASED TO AVOID
LOSS OF DATA
Sample Champion PRO 3.8 – User Manual
p. 101
Troubleshooting – F.A.Q.
[1] Which is the accuracy of a measurement done with Sample Champion ?
[2] Which sound cards are more suitable for Sample Champion?
[3] Why Sample Champion requires a lot of RAM memory?
[4] How can I test whether Sample Champion will work perfectly with my PC
configuration?
[5] In full-duplex operations, should I play at 8, 16 or 24 bit the MLS signal?
[6] My SoundBlaster audio card refuses to perform full-duplex operations
[1] Which is the accuracy of a measurement done with Sample Champion ?
The accuracy of a measurement (not considering external devices like microphones,
amplifiers...) depends basically on the sound card. You can evaluate the performance of
your sound card using Sample Champion itself in a loop back configuration. See
application notes and FAQ #4.
If your sound card has a poor frequency response, some improvements could be obtained
using MLS filtering and the equalization capabilities of Sample Champion. A nice solution
could consist in using an audio card with S/PDIF digital IN/OUT and an external high
quality A/D-D/A converter.
[2] Which sound cards are more suitable for Sample Champion?
Any sound card working under windows 95/98/2000/NT4 in full-duplex mode is suitable.
Nowadays all sound cards satisfy these requirements.
Some sound cards have peculiar characteristics.
For example:
Turtle Beach audio cards (Pinnacle, Fiji...) have an excellent frequency response,
low noise and in our tests NEVER lost a bit of sound data or the sync between
input and output audio streams. They work very well also on slow computers
because of their hardware architecture and efficient software drivers. These audio
cards are recommended for Sample Champion.
Last generation SoundBlaster cards (ex. SBLive, PCI128...) have a very good
frequency response but can be used with Sample Champion ONLY at the sampling
frequency of 12 kHz, 24 kHz and 48 kHz because they work internally always at 48
kHz. Other sampling frequencies are obtained by an internal frequency conversion
that can give poor results with Sample Champion.
Good old first generation SoundBlasters (SB16, SB32, some AWE...) used on slow
computers can experience sync losses caused by software interference with the
video cards. Sample Champion, in Blinded Mode, performs a workaround. Anyway
we reccomend to update your sound card!
Sample Champion PRO 3.8 – User Manual
p. 102
[3] Why Sample Champion requires a lot of RAM memory?
This is a consequence of the very high accuracy used for all internal operations. For
example the FFT (limited for the user to 64K, but extended for some internal operations to
256K) is computed on double-precision complex data and using both frequency bands
(positive and negative frequencies) to perform some specific signal processing operations
and in prevision of any future DSP expansion (using special purpose plugins). To prevent
any resizing or reallocating of the virtual memory during measurements, Sample
Champion allocates, once started, all RAM memory required for working.
[4] How can I test whether Sample Champion works perfectly with my PC
configuration?
First of all download the full-working trial version and install it.
The main test to be performed is whether your computer is fast enough to perform the
real-time operations required by Sample Champion and nothing in the system interferes
with the input and output audio streams.
The test:
Connect in loop back the input and output of your sound card
Start Sample Champion and open the Impulse Response and Info windows
Set a sampling frequency of 44100 Hz and the 'Repeat' mode
Start a Sync Rec&Play loop of 4096 cycles and read the peak position of each
cycle, in the info window
Adjust, if necessary, the in and out levels from the mixer to obtaind a distorsionfree impulse response; increase the 'Step' value (if required, see the manual for
details) until you can read in the control bar the yellow label 'BUFFER OK' for at
least 1 second. Repeat the above procedure several times.
If the peak is at the same position at every cycle, your computer can perform real
measurements with Sample Champion (once calibrated, the peak will be near t=0).
Note 1: When a measurement cycle starts, it is normal to observe a small change of
the peak position, that could be advanced or delayed by one or two samples with respect
to other measurement cycles. The peak must, however, remain at the same position
during a measurement cycle.
Note 2: See the FAQ about sound cards. If you have a SBLive or similar, perform the
test at 48 kHz.
Note 3: If the peak changes its position, during the test, this means that something
interferes with either input or output audio streams. This is not due to Sample Champion
but to the specific software/hardware configuration. WARNING: If this happens, all
programs manipulating audio data in real-time (for example multitrack recording or other
measurement software) on your system could experience the same problems. However
only performing synchronous playing and recording (and expecially using correlation
techniques with MLS) it is possible to discover them! Sample Champion tells you the
truth!
ANYWAY, the above test is very significant and, if performed correctly with positive
results, can assure you that Sample Champion works fine.
Sample Champion PRO 3.8 – User Manual
p. 103
If the problem is caused by the sound card, see the above FAQs about most suitable
sound cards.
[5] About full-duplex operations, should I play at 8, 16 or 24 bit the MLS signal?
Sample Champion can play at 8, 16 or 24 bit resolution (8 for backward compatibility with
some old audio devices). When playing tonal signals it is recommended to use at least 16
bit resolution, but when playing MLS signals (just a series of +K and -K, where K is the
output value) it doesn't matter. In our tests we didn't find any difference using 8, 16 or 24
bits in playing MLS signals.
[6] My SoundBlaster audio card refuses to perform full-duplex operations
Download and install the latest driver! Remember also to disable 3D spazialization
enhancements and set bass and treble controls to zero when performing measurements.
If any loss of sync is observed (see FAQ #4) try also other IRQ and DMA settings
because Windows can share some of these channels and some configurations could give
poor performances in terms of audio quality.
Troubleshooting – TIPS
[1] How can I optimize my operating system for real-time audio measurements?
[2] How avoiding common errors using digital audio cards and improving sampling
result?
[3] In Sample Champion the wave and the spectrum data seem to "jump" high and
low. What happens?
[1] How can I optimize my operating system for real-time audio measurements?
You should eliminate all not strictly necessary programs running in background. In
Windows 95/98 by pressing CTRL-ALT-DEL it is possible to see all running tasks (at least
those installed by the user). Close all programs and windows then press CTRL-ALT-DEL:
the best thing would be to see listed only "Explorer". In Windows NT4 or Windows 2000
use the taskmanager to see all running processes and try to close all unnecessary ones.
Refer to the operating system manual to avoid automatic start of the unnecessary tasks.
[2] How avoiding common errors using digital audio cards and improving sampling
result?
The worst thing that can happen working with digital audio is distorsion caused by
excessive input levels. For musical audio recording this is a big problem because
distorsion caused by A/D saturation is usually very unpleasant. The same problem can
occur when making measurements with digital instrumentation.
The suggestion is to monitor constantly the peak level meters and adjust consequently the
input level in the mixer. As a rule, the maximum peak level should be at least 6 dB under
the saturation level.
Note that in some old sound cards the output section (D/A) can give some distorsion on
the last bit (actually playing signals higher than 16384=2^14 in absolute value). If you
notice this using Sample Champion, the solution is simple: in Settings|Level use
Sample Champion PRO 3.8 – User Manual
p. 104
values<50%. Fortunately Sample Champion gives you a simple way to analyze the
acoustical performance of your audio card in terms of distorsion in order to perform a fine
tuning of your level settings. See the application notes concerning this kind of
measurements.
[3] In Sample Champion the wave and the spectrum data seem to "jump" high and
low. What happens?
Sample Champion has the "Y Auto Scale" option turned on (default).
Simply perform a test measure to let the program measure the maximum peak amplitude
and then turn off the autoscale or, in a repeated or averaged measure cycle, turn off the
option once that the result of the first measure is plotted. When the austoscale is off, it is
always possible to perform a manual autoscale by pressing the button on the left of the
autoscale button.
Troubleshooting – Known issues
We had a problem sampling with TurlteBeach Pinnacle and length of the input buffer
equal to 16K samples (with pure tones or custom waves, NOT MLS signal). The problem
is certainly due to a bug in the Pinnacle drivers, since it is not present with other audio
cards.
Solution: if you experience this problem, avoid that input length (use instead 8K or 32K).
- This problem does not affect MLS measurements (impulse response) because when a
16K MLS signal is selected, the actual input length is 16K-1 samples.
Windows 2000 seems to be very stable and suitable for audio measurement software.
But some precautions must be taken:
- We found that W2K does not "inform" the audio software of the correct maximal
sampling frequency allowable for a specific sound card. The consequence is that, when
a sampling frequency not allowable is selected, the system could hang (in this case try
stopping the non responding application with Task Manager). This affects all audio
software and not only Sample Champion.
Solution: see your sound card manual to learn the maximal allowable sampling
frequency.
- Another minor problem we found concerns the audio mixer of W2000: for some audio
devices, the "Enable"-"Disable" checkboxes are inverted.
Solution: with Sample Champion, make some test measurements and check the input
level meters to see if the signal IN/OUT are correctly selected.
Troubles have been noticed during the concomitant execution of Sample Champion and
other programs when a reduced disk space (less than about 100 MB) is available. This
Sample Champion PRO 3.8 – User Manual
p. 105
happens because Windows creates a swap file (Win386.swp, usually located inside the
Windows directory) for emulating the RAM memory required by specific programs (when
not present as RAM). The disk space required by Sample Champion (when all RAM
memory is used by other software) is about 70 MB or more, depending on settings and
opened plugins. If this amount of free disk space is not available, Sample Champion will
not work properly and will terminate with unexpected errors. The symptoms are error
messages such as Plugin_default not found and other fatal errors during startup.
Solution: Leave at least 200 MB of free space on the disk where the Windows swap file
is allocated. Close any other software before starting Sample Champion (this is always
recommended).
Sample Champion PRO 3.8 – User Manual
p. 106
Troubleshooting – Most common
problems (and solutions)
The first configuration to be performed before making any test measurement concerns the
audio card mixer. In the following examples a Sound Blaster SB Live! audio card is
considered, but the suggestions are valid also for any other device. The operating system
was Windows 2000.
1- Connect Line IN to Line OUT with a jack-jack cable and start Sample Champion.
Open the Impulse Response Window.
2- Close any other software, including any taskbar application.
3- Open the internal Sample Champion mixer or the standard Windows mixer and
enable ONLY the following:
PLAY Control:
- Enable Play (set level to middle)
- Enable Wave (set level to middle)
- Disable all others
Play Control settings (SB Live!)
Sample Champion PRO 3.8 – User Manual
p. 107
RECORD Control:
Enable Line-In (set level to middle)
Disable all others
Record Control settings (SB Live!)
In Settings/General, set:
- 1 Channel In
- 1 Channel Out (16 bit)
- Buffer Length 4K
- Block = 16
- Mode = Repeat
- Sampling Rate = 48000 Hz
- Step = 4
- MLS type = 4K
- Level = 50%
4- Now press Syncro Start/Stop MLS and Sampling button
happens.
and look at what
Correct Loop-Back Impulse Response
Sample Champion PRO 3.8 – User Manual
p. 108
If you will see a still Impulse Response like in the above figure, congratulations, you are
lucky! Sample Champion is running correctly and your hardware/software configuration is
suitable for MLS measurements. Anyway some other tests with different parameters are
suggested for an extensive test.
Absence of signal Loop-Back Impulse Response
If the computed Impulse Response looks like in the above figure, this means that the
chain between input and output is interrupted. Check the loop-back connection and mixer
settings.
The above plot can be obtained also by pressing the Rec button without any MLS signal in
output; it is due, in this case, to the cross-correlation between the selected MLS signal
(Settings/General, MLS Type) and (uncorrelated) background noise.
Most common problems
Echo in the measured Impulse Response
If the measured Impulse Response (?!) looks like the following
Wrong Loop-Back Impulse Response
Sample Champion PRO 3.8 – User Manual
p. 109
most probably the cause is a wrong mixer setting. In the above example a repetition of the
first (correct) peak can be easily observed. In this case the Line-In volume in the Play
Control of the mixer had been erroneously enabled.
Wrong Mixer Setting
In other audio devices there are other similar level settings that must be disabled to
obtain correct measurements. For example in the Pinnacle audio card mixer there is an
"Input Monitor" control: set it to zero (and, if present, check also the mute button).
Obviously every "3D sound", "Reverb", "Chorus", "Spatialization" or other similar controls
must be disabled for these kinds of measures.
Not still Impulse Response
When the measured Impulse Response has a correct shape for a loop-back measure, but
does not remain still during the cycle measures, the reasons could be different:
1- The sound card works internally at 48 kHz and emulates other sampling frequencies
(this is the case, for example, of the SB Live). In this case, for MLS measurements, only
48, 24 and 12 kHz sampling frequencies must be used. Other frequencies will produce an
unclean and not still Impulse Response.
2 - The sound card shares an IRQ with other devices of your system.
NOTE: this affects every audio software working in your system, so it could be worth to
avoid it, even if you will not use Sample Champion.
The worst situation concerns IRQ sharing between audio and video devices because
during sampling graphic information is often shown and this can cause problems.
Sample Champion PRO 3.8 – User Manual
p. 110
This is an example of IRQ sharing (to be avoided!):
System configuration IRQ resources
As shown above, IRQ 11 is shared between Modem, SCSI adapter, USB adapters, audio
card and video card!!
By the way, IRQs 2, 5, 7 and 10 are free.
The solution is to assign to the audio device one of the free IRQs. Sometimes uninstalling
and reinstalling the device could be necessary, but it will be surely worth!
The figures that follow show in detail the settings of the audio and of the video cards.
Audio Card IRQ setting
Sample Champion PRO 3.8 – User Manual
p. 111
Video Card IRQ setting
In this case Windows doesn't allow the manual configuration of the audio device IRQ and
the reinstallation could be necessary. For this purpose, follow the audio device and
Windows installation guides.
Sample Champion PRO 3.8 – User Manual
p. 112
Other features (available in the plugins)
Audio Quality Plugin
This module performs the following measurements:
SNR (Signal to Noise Ratio)
THD and THD+N (Total Harmonic distortion)
IMD (Intermodulation Distortion)
More information and instructions about using the plugin can be found in the
Application Note #8.
NOTE: Audio Quality Plugin is still available but discontinued. All its functions (with
more features) are now included inside the RTA window!
Filter Banks Plugin (freeware)
Sample Champion PRO 3.8 – User Manual
p. 113
This module allows to approximate BUTTERWORTH and CHEBYSHEV low-pass, bandpass and high-pass analog filters by means of IIR (Infinite Impulse Response) digital
filters. Moreover two banks of IEC 1260 Octave and 1/3 Octave Filter Banks are
implemented as presets. This module can be used to filter a measured or loaded impulse
response.
The computed coefficients of the IIR filter can be exported to clipboard.
The plugin is included in the setup package.
More information and instructions about using the plugin can be found in the
Application Note #9.
Waterfall Plot Plugin
This module computes and plots (see the above figure) a 3D Cumulative Spectral Decay
of an impulse response. This is an invaluable information for finding loudspeaker and box
resonances. Many options are available, such as different FFT sizes and weighting
windows (independently from the main program settings). Unreliable computed low
frequencies are automatically rejected from the plot.
More information and instructions about using the plugin can be found in the
Application Note #10.
Sample Champion PRO 3.8 – User Manual
p. 114
Room Acoustics Plugin
This module computes and plots many acousical parameters, such as Reverberation
Time, Early Decay Time, Definition, Clarity and Centre Time. Many options and
features are available: the acoustical parameters can be computed in wideband or in
octave or 1/3 octave bands. The results are available in tabular or graphic form.
Time data can be plotted in many modes: Log Squared, Schroeder Plot, Step
Response, Cumulative Energy. Inverse Schroeder Integration can take advantage of
an user selectable noise compensation. The computed data can be exported to
Clipboard and the plots can be saved on disk as Bitmap images.
More information and instructions about using this plugin can be found in Application
Note #11, Application Note #12, Application Note #13 and Application Note #14.
Sample Champion PRO 3.8 – User Manual
p. 115
Enhanced View Plugin (freeware)
This module extends the Impulse Response view modes and analysis. It can compute
and plot Energy Time Curve, Spectrogram, Nyquist Plot, Phase Unwrapping,
Minimum and Excess Phase and Minimum Phase Impulse Response Plot.
Sample Champion PRO 3.8 – User Manual
p. 116
More information and instructions about using the Enhanced View plugin can be found in
the Application Note #15.
Impedance Plugin
This module allows measuring Loudspeaker impedance and the computation of ThieleSmall parameters.
More information and instructions about using this plugin can be found in the
Application Note #16.
Sample Champion PRO 3.8 – User Manual
p. 117
License
SAMPLE CHAMPION FOR WINDOWS 95/98/2000/ME/XP
Copyright (c) 1995-2005 by Paolo Guidorzi. All rights reserved.
END USER LICENSE AGREEMENT
This End-User License Agreement is a legal agreement between you (either an individual
or a single entity) and Paolo Guidorzi for the Sample Champion "SOFTWARE" product
identified below, which includes computer software, "online" or electronic documentation,
and may include associated media and printed materials.
Please read the following terms and conditions carefully before using this SOFTWARE.
Your use of this SOFTWARE indicates your acceptance of this license agreement and
warranty.
NOTICE: This SOFTWARE is protected by copyright laws and international copyright
treaties, as well as other intellectual property laws and treaties. This SOFTWARE product
is licensed, not sold. The SOFTWARE is not public domain software, nor is it free
software. Sample Champion is copyrighted by Paolo Guidorzi.
Unauthorized reproduction or distribution of this SOFTWARE, or any portion of it, may
result in severe civil and criminal penalties, and violators will be prosecuted to the
maximum extent possible under law.
REGISTERED VERSION
One REGISTERED copy of this SOFTWARE may either be used by a single person who
uses the SOFTWARE personally on one or more computers, or installed on a single
workstation used nonsimultaneously by multiple people, but not both.
You may access the REGISTERED version of this SOFTWARE through a network,
provided that you have obtained individual licenses for the SOFTWARE covering all
workstations that will access the SOFTWARE through the network, regardless of the
number of persons who really use this SOFTWARE at a specific time.
You may not distribute any copies of the REGISTERED VERSION of the SOFTWARE or
any part of it.
If you wish to use this SOFTWARE on additional computers, you must purchase a license
for every additional copy of the SOFTWARE.
TRIAL VERSION
This is not free software. You are hereby licensed to use the TRIAL VERSION of this
SOFTWARE for evaluation purposes and test its compatibility with other products and
computer systems without charge for a period of 30 days.
Sample Champion PRO 3.8 – User Manual
p. 118
The UNREGISTERED TRIAL VERSION of this SOFTWARE may be freely distributed,
provided the distribution package is not modified. No person or company may charge a
fee for the distribution of the UNREGISTERED TRIAL VERSION without written
permission from the author.
UNREGISTERED use of TRIAL VERSION of this software by any person, business,
corporation, government agency or any other entity after the trial period is in violation of
copyright laws and may result in severe civil and criminal penalties.
All rights not expressly granted here are reserved by Paolo Guidorzi.
DISCLAIMER OF WARRANTY
THIS SOFTWARE IS DISTRIBUTED "AS IS". NO WARRANTY OF ANY KIND IS
EXPRESSED OR IMPLIED. YOU USE THIS SOFTWARE AT YOUR OWN RISK. THE
AUTHOR WILL NOT BE LIABLE FOR DATA LOSS, DAMAGES, LOSS OF PROFITS OR
ANY OTHER KIND OF LOSS WHILE USING OR MISUSING THIS SOFTWARE. TO THE
EXTENT PERMITTED BY YOUR APPLICABLE LAW, NO WARRANTIES, EITHER
EXPRESS OR IMPLIED, ARE MADE WITH RESPECT TO THE SOFTWARE,
INCLUDING, BUT NOT LIMITED TO THE IMPLIED WARRANTIES OF
MERCHANTABILITY AND FITNESS FOR A PARTICULAR PURPOSE. THE AUTHOR
DOES NOT WARRANT THAT THE SOFTWARE OR ANY FUNCTIONS CONTAINED IN
THE SOFTWARE WILL MEET YOUR REQUIREMENTS OR THAT THE OPERATION
OF THE SOFTWARE OR ANY COMPONENT OF THE SOFTWARE WILL BE
UNINTERRUPTED OR ERROR-FREE. THE AUTHOR HAS NO OBLIGATION OR
RESPONSIBILITY TO CORRECT ANY ERRORS OR DEFECTS IN THE SOFTWARE.
This SOFTWARE is not fault-tolerant and is not designed, manufactured or intended for
use or resale as on-line control equipment in hazardous environments requiring fail-safe
performance ("High Risk Activities"). Paolo Guidorzi specifically disclaim any express or
implied warranty of fitness for High Risk Activities.
Good data processing procedure dictates that any program be thoroughly tested with noncritical data before relying on it. The user must assume the entire risk of using the
program.
LICENSE RESTRICTIONS
You may not modify the SOFTWARE or create derivative works from the SOFTWARE.
You may not reverse engineer, decompile, or disassemble the SOFTWARE.
Copyright 2005 © Paolo Guidorzi & PureBits.com
All Rights Reserved.
http://www.purebits.com
[email protected]
Sample Champion PRO 3.8 – User Manual
p. 119