Download RM - Geocomp
Transcript
RESILIENT MODULUS TESTING
© 2013 Geocomp Corp.
Frequently Asked Questions
Hardware
I. NETWORK COMMUNICATION
I-1. Q: We have several systems connected to the same PC. We were running only one of
the systems, so we shut off the ones we were not using. Then we got an error message
stating that the system we had left on was not responding. It seems that we lost
communication. What is happening?
A: A temporary loss of communication is normal when you either shut off or boot up any
system unit connected to the same network. Whenever a unit connected to the network is
powered down or powered up, the network goes into a re-configuration mode during which no
communication is allowed. Depending on how many other units are on the network, this
process may take some time. If the software checks connections while the process is going
on, you will get the “not responding” message. If not, no message will appear. Should it
appear, simply wait a short period of time and then click the Retry button. Everything should
be back to normal.
I-2. Q: The Network LEDs are RED on the front panel of the LoadTrac-II unit. There is no
communication between the PC and either the LoadTrac-II unit or the Cyclic-RM unit. All
of our ID numbers are correct. What else should we check?
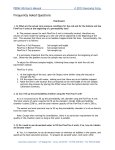
A: Probably the network communication cable (gray cable) is plugged into the Ethernet
jack on the back of your PC instead of into the special (black) adapter that is plugged into the
network communication card that we provided. If you find that this is the case, unplug the
cable and plug it into the adapter on the card (see picture below). The LEDs should now glow
a solid green.
II. POWER OUTAGE
II-1. Q: After an electrical power problem in our building, it seems that the system is not
working properly. We suspect that the set-up values on the embedded controllers are not
correct. How do we revert to the original set-up values or default values set at the
factory?
Geocomp Corporation · 125 Nagog Park · Acton, MA 01720 · Tel 978-635-0012 · Fax 978-635-0266
RESILIENT MODULUS TESTING
© 2013 Geocomp Corp.
A: The default values may change either after an electrical power problem or due to
inadvertent actions by the end user.
You will need to revert back to the internal default values of your system by following
these steps:
1. Turn off the units in the system.
2. Wait about 10 sec.
3. Turn each unit back on (one at a time) and immediately press the ESC key on the
keypad to reset everything back to the imbedded controller default values.
4. If you had been running several test systems with one PC, you will need to reenter
Node ID numbers (on the hardware units) so that they correspond to the values you
were using in the control programs. (The default values for the hardware units are: 65
for LoadTrac-II and 64 for Cyclic-RM.)
Software
I. CALIBRATION /ZEROING
I-1. Q: In many of our different test files, the calibration values in the Summary Table and
the values in each sensor's individual calibration table are not in sync. Could you please
explain which values the program uses, and how to make sure they are correct?
A: When running a test, the RM5 software uses only the parameters that are shown in the
Calibration Summary. A mismatch between these values and those on the Calibrate window
for a particular sensor can occur if the Calibrate window values have not been saved by
clicking the Save button on that window.
To determine whether or not the Summary values are correct, you need to know how the
test was set up. The two possibilities are described below.
The parameters are correct
You have two LoadTrac-II/Cyclic-RM systems, A and B. You plan to run a test on unit A. A
file for a test run on unit B is a good template for the test, but the calibration parameters in
it are those for the sensors on unit B. You open an RM5 control window and load that file into
the window. We will call that file Test-B.
Next, you open a second RM5 control window and load into it a file for a test that was run
on unit A. We will call that file Test-A.
Finally, you copy the calibration parameters from the Calibration Summary in Test-A and
paste them into the Calibration Summary in Test-A.
Geocomp Corporation · 125 Nagog Park · Acton, MA 01720 · Tel 978-635-0012 · Fax 978-635-0266
RESILIENT MODULUS TESTING
© 2013 Geocomp Corp.
You now have a control program that contains the correct calibration parameters for
running a test on unit A, but those shown on the Calibration Summary will be different from
those on the individual sensor Calibrate windows.
The parameters are not correct
You have two LoadTrac-II/Cyclic-RM systems, A and B. You plan to run a test on unit A. A
file for a test run on unit B is a good template for the test, but the calibration parameters in
it are those for the sensors on unit B. You open an RM5 control window and load that file into
the window. We will call that file Test-B.
You decide to calibrate the sensors and use Test-B to do it. You go through the
calibration procedure for each sensor and click the Calibrate button on each Calibrate
window. But you forget to click the Save button on each window before closing it.
You now have a control program that has the correct calibration parameters on each
Calibrate window, and they will be different from those in the Calibration Summary.
However, it is the incorrect Summary values that will be used to run the test.
If you know (or suspect) that a test was run using a file with incorrect calibration
parameters on the Summary window, you can recover from the error.
Error Recovery
Open an RM5 control window and load the erroneous test file into it.
You will need to replace the calibration parameters (factor and offset) that are shown on
the Calibration Summary with correct ones.
If you are certain that the parameters on the individual Calibrate windows are correct,
simply click Save on each of those windows.
If you will have to enter new values manually, there are two ways to do this: (1) delete
the original values and type the new ones into the text fields or (2) copy and paste the new
ones. For the second option, you will need to open a second copy of RM5 and load the test
file that contains the correct calibration parameters.
Finally, save the file and reload it. The new values will be applied to the processed data.
*Note: The raw data and the results of data reduction shown on the report pages will
be changed. The stress target values that were entered into the Consolidation Table
page will not be changed.
I-2. Q: When I view the system before starting a test, there is always an offset of about
±0.005 kN (1 lb). Why? There is no contact between the vertical load cell and specimen,
so why is there a small offset in the load and how can I make it zero?
A: Between tests, the load cell output can drift a small amount. At best, the no-load
condition will be in the range of ±0.025% of load cell full capacity, which translates to about
Geocomp Corporation · 125 Nagog Park · Acton, MA 01720 · Tel 978-635-0012 · Fax 978-635-0266
RESILIENT MODULUS TESTING
© 2013 Geocomp Corp.
±0.001 kN (±0.25 lb) for a 4.45 kN (1000 lb) load cell. If you observe a no-load condition on
the System Monitor window that is greater than ±0.025% of full capacity, use the following
steps to zero the load cell.
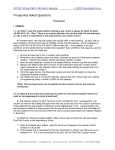
1. Be sure the load cell is not in contact with anything.
2. Bring down the Calibrate menu and select Summary to open the Calibration
Summary window. Position this window beside the System Monitor window.
3. Note the Load reading in counts on the System Monitor window (top left text
field).
4. Replace the Offset value that is shown on the Calibration Summary window (when
Load is selected for the Channel choice) with the Load reading (in counts) that is
on the System Monitor window.
5. Click the Apply button, the Download button and then the Ok button to close the
Calibration Summary window.
6. You should now see in the System Monitor window that the vertical load cell
reading (in engineering units) is within ±0.025% of full capacity.
*Note: This zeroing process can be applied to other sensors such as a pressure
transducer.
I-3. Q: I calibrated my transducer and filled out the Calibration table under the Options
menu. However, I can't get the program to save the new calibration numbers. When I
open the file back up the old calibration numbers are still there. How do I save the new
calibration data?
A: Go to File>Save As. Save the file under a new name such as newtemplate.dat
II. GENERAL
II-1. Q: During the test when I open the Load Channel Monitor window (using the View
menu), the real-time display of the load versus time shows a graph with data all over the
place instead of the expected cyclic load. Is it electrical noise, or is the system not
working properly?
A: The Channel option in the View menu is a feature of all Geocomp Corp. software
programs. Its intended use is as a diagnostic tool to keep track (in general but not in detail)
of the readings in real time of any sensor connected to the system. This feature cannot be
used to monitor a cyclic test for the following reason.
The refresh rate of a monitor window is always 1 sec. But usually the period of each cycle
is 1 sec and there are 200 readings per cycle. Consequently the window is always updated
after 200 readings have been taken. It is not possible for the graph to show the data
acquisition details.
To view details of the test results while the test is running, bring down the File menu and
click Save. Then bring down the Report menu and click Raw Data. Test result up the time of
clicking Save will be shown. You may need to expand the horizontal axis by resetting the
minimum and maximum values (using the Raw Data page on the Report Settings window) to
Geocomp Corporation · 125 Nagog Park · Acton, MA 01720 · Tel 978-635-0012 · Fax 978-635-0266
RESILIENT MODULUS TESTING
© 2013 Geocomp Corp.
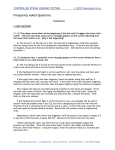
see the amount of detail you need. The example below shows raw data Load vs. Cycle curves
with the Cycle axis reset to 60 through 66.
II-2. Q: All values for the sensors on the System Monitor window show counts of about
32000, and no sensor seems to be active. What could be causing this?
A: Possible causes are:
1. The Cyclic-RM unit is turned off
2. There is no physical connection between the Cyclic-RM unit and the PC
II-3. Q: I noticed that the engineering readings on the LCD screen are different than the
ones on the PC screen. Are they supposed to be the same? Did it affect the results of a
test I just ran?
A: First, be assured that any mismatch of the engineering readings values between the
LCD and the PC screens will not affect the results of a test that you run using the RM5
program.
A mismatch can occur if the calibration parameters that are shown in the Calibration
Summary (opened using the Calibration menu) have not been downloaded into the imbedded
controllers of the LoadTrac-II and Cyclic-RM units. However, the software uses only the
Calibration Summary values when it runs a test. Consequently, it is very important that these
are correct.
To synchronize the LCD and PC screen readings, you need to update the calibration
parameters in the imbedded controller of the LoadTrac-II unit. To do this, follow the steps
shown below.
1. Bring down the Calibrate menu and select Summary.
Geocomp Corporation · 125 Nagog Park · Acton, MA 01720 · Tel 978-635-0012 · Fax 978-635-0266
RESILIENT MODULUS TESTING
© 2013 Geocomp Corp.
2. On the Calibration Summary window, select the sensor that you want to update (from
the list shown when the pull-down button to the right of the top text field is clicked).
3. Click the Download button. This will automatically transfer (copy and save) the
current calibration parameters (Factor and Offset) for the selected sensor into the
embedded controller.
4. Repeat the above procedure for each sensor.
You should now see that the PC and LCD screen values match.
II-4. Q: Can the software detect wrong values that are manually entered by the end user?
A: Yes, the software program detects any erroneous values that have been entered. It
also detects certain hardware malfunctions. Examples include:
1. Negative values for sample dimensions, calibration factors, and PID control parameters
2. Zero values for sample dimensions, calibration factors (except for offset value), and
PID control parameters
3. Wrong Node ID number
4. A malfunctioning sensor that it is giving an analog reading of either 0 (the minimum
value) or 65535 (the maximum value)
5. Any unit (LoadTrac-II or Cyclic-RM) that is not on.
Geocomp Corporation · 125 Nagog Park · Acton, MA 01720 · Tel 978-635-0012 · Fax 978-635-0266
RESILIENT MODULUS TESTING
© 2013 Geocomp Corp.
II-5. Q: We are experiencing some vibrations during the rest period. The soil that we are
testing is very stiff. Is there any way to reduce these vibrations?
A: For a very stiff soil, the Proportional Gain on the Actuator Settings window needs to be
reduced from its default value. While the P-Gain setting can be as high as 1 for very soft soil
samples, the setting may need to be as low as 0.05 for very stiff samples.
For stiff samples, a P-Gain setting that is too high results in changes during the pulse
occurring too rapidly. The result is that there is an undershoot at the beginning of the rest
period and then an oscillating effort to reach a steady condition. This causes the vibration
you are seeing.
II-6. Q: I am running a test. Do I need to wait until the end of the test to see the results?
A: You do not need to wait until the end of the test. While the test is running:
1. Go to the File menu.
2. Select and click Load.
3. Go to the Report menu. You will be able to see the partial test results up to the point
when you did the Load.
4. Repeat the above steps as the test progresses.
III. PID
III-1. Q: What are the effects and correlations between the PID values?
A: The RM5 program uses a control technique that is very complex. Consequently it is
difficult to explain in detail how the PID values are used. In general terms, as a pulse is
applied by the actuator, the program periodically gathers information and adjusts the pulse
rate by using the information and the PID (Proportional gain, Integral gain and Derivative
gain) values. Both the Proportional Gain (P-Gain) and Integral Gain (I-Gain) affect the overall
rate at which the pulse proceeds, but in somewhat different ways. An increase in value
increases the rate; a decrease in value decreases the rate.
As an increment of pulse nears completion, the P-Gain functions to decrease the pulse
rate so that the increment end value is not reached too suddenly. On the other hand, I-Gain
functions to increase the loading rate throughout the loading process. The values of these
parameters that will produce the smoothest application of a pulse is the optimal setting. The
default values of 2 and 1 for the P-Gain and I-Gain respectively work well for most soil types.
The graphs that are included in the answer to Q/A IV-2 below help to show the effects of
the P-Gain and I-Gain. As can be seen, the I-Gain needs to be changed only for very stiff
soils.
III-2. Q: The User’s Manual says that the Proportion Gain on the Actuator Settings window
can be as high as 0.5 for soft soils and as low as 0.1 for stiff soils. What other values
might be used and how are we going to decide on the best values to use? Please clarify.
Geocomp Corporation · 125 Nagog Park · Acton, MA 01720 · Tel 978-635-0012 · Fax 978-635-0266
RESILIENT MODULUS TESTING
© 2013 Geocomp Corp.
A: It is possible to use any Proportional Gain (P-Gain) value from 0.1 to 0.5. (The Integral
Gain value of 1.e-004 and the Derivative Gain value of 0 should not be changed.) The rate at
which a pulse increment is applied depends on both the P-Gain and the I-Gain: lower value =
slower rate, higher value = faster rate.
The following information may help your understanding of how the P-Gain and I-Gain
function.
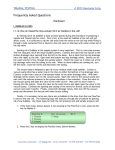
The graphs shown below are for loading curves generated during a consolidation test and
so are not relevant to an RM test. (They were generated from data dumped into a file after
the test.) Note that the time scale is not the same for the different soil types. When
possible, the target load during a consolidation test should be reached in less than 0.5 min.
Consequently a high P-Gain setting is good for very soft soils.
It is easy to reach the target load value for stiff soils. However (as seen in the last two
graphs), the target value may not be reached smoothly. To help this situation, the I-Gain (or
both the I-Gain and P-Gain) can be decreased.
Geocomp Corporation · 125 Nagog Park · Acton, MA 01720 · Tel 978-635-0012 · Fax 978-635-0266
RESILIENT MODULUS TESTING
© 2013 Geocomp Corp.
Very Soft Soil (Modulus 290 psi)
PID: 5, 1, 0
1.2
1.2
1.0
1.0
0.8
0.8
Load/Target
Load/Target
PID: 0.5, 1, 0
0.6
0.4
0.2
0.6
0.4
0.2
0.0
0.0
0.0
0.5
1.0
1.5
2.0
2.5
3.0
3.5
4.0
0
0.5
1
1.5
Time (min)
2
2.5
3
3.5
4
Time (min)
Medium Soil (Modulus 4000 psi)
PID: 0.5, 1, 0
PID: 5, 1, 0
1.2
500
1.0
400
0.8
Load/Target
Force (n
600
300
200
100
0
0.00
0.6
0.4
0.2
0.05
0.10
0.15
0.20
0.25
0.30
0.35
0.40
0.45
0.0
0.00
0.50
0.05
0.10
0.15
0.20
Time (mi n)
0.25
0.30
0.35
0.40
0.45
0.50
Time (mi n)
Stiff Soil (Modulus 10,000 psi)
PID: 0.5, 1, 0
1.2
1.2
1.0
1.0
0.8
0.8
Load/Target
Load/Target
PID: 0.1, 0.1, 0
0.6
0.4
0.2
0.0
0.00
0.6
0.4
0.2
0.05
0.10
0.15
Time (mi n)
0.20
0.25
0.0
0.00
0.05
0.10
0.15
0.20
0.25
Time (mi n)
Geocomp Corporation · 125 Nagog Park · Acton, MA 01720 · Tel 978-635-0012 · Fax 978-635-0266
RESILIENT MODULUS TESTING
© 2013 Geocomp Corp.
To change a P-Gain setting click Actuator on the Options menu to open the Actuator
Settings window. Replace the default value with the new value, click the Apply button and
then close the window.
IV. REPORT
IV-1. Q: After running a successful test we ran into troubles with the report. We were
not able to generate a report because all links on the report pull-down menu are
inactive. Are we missing something, or is the software not entirely installed?
A: To make the links active, parameters and data for a test must be loaded into the RM
program so that they can be displayed on the various RM windows. Go through the following
steps to load a data file.
1. First pull down the File menu.
2. Next, click Load. This will display a window that shows data files for tests that have
been completed (and for any test that is currently running). Highlight the file name
for the test you wish to load and then click Open.
3. Finally, pull down the Report menu. You should now see all options activated.
Using these options, you can view the results of the test, change various settings for the
report and edit the test data points. Remember that each time you change or edit any item,
you will need to save the file and load it again.
III-4. Q: I start running a test; I notice that there was noise during the rest period as you
can you below. Any ideas about what is going on and how we can get rid of this noise?
Geocomp Corporation · 125 Nagog Park · Acton, MA 01720 · Tel 978-635-0012 · Fax 978-635-0266
RESILIENT MODULUS TESTING
© 2013 Geocomp Corp.
A: Your PID control values need to be fine-tuned. First decrease the P-Gain by 0.05
increment. Next you need to check the calibration of your actuator (see section of manual
that outlines step by step the calibration of the actuator)
IV-4. Q: On the Resilient Modulus Test Data window (opened by clicking Table in the
Report menu) data for only the last 5 cycles for each step (or sequence) can be seen. Is it
possible to see data for the other cycles also?
A: The only way to see all the data is to use the Dump option under the File menu. You
can then view the data either in Notepad, or first in Notepad and then after transferring it to
Excel. (See Appendix B for details.) There will be a lot of data. Microsoft Excel has a limit
of 65536 rows.
IV-5. Q: I noticed in the report summary table and test data table that the nom. max.
deviator stress is off from the target deviator stress on the load table. Is this going to
affect the resilient modulus results?
A: The resilient modulus is a ratio of stress difference over strain difference.
Consequently its value will not be affected if the applied stress is off the target.
RM = Δσ/Δε
IV-6. Q: We would like to know about the default and 1,2,3,4 equations which are being
used for calculating the MR value. Is it possible to show the equations in the help file?
Geocomp Corporation · 125 Nagog Park · Acton, MA 01720 · Tel 978-635-0012 · Fax 978-635-0266
RESILIENT MODULUS TESTING
© 2013 Geocomp Corp.
A: The equations will be included in the help file in a future version of the software.
They are shown below with some explanatory comments. The information is taken from the
Design Pamphlet for the Determination of Design Subgrade in Support of the 1993 AASHTO
guide for the Design of Pavement Structures (AASHTO Publication No. FHWA-RD-97-083).
IV-7. Q: In some steps the nominal deviator stress is different than the mean deviator
stress. Is this something to worry about?
A: Even if the applied load (or stress) is off target, the value of the resilient modulus is
still correct. The resilient modulus is equal to the change of stress divided by the change of
strain as shown in the equation below.
Geocomp Corporation · 125 Nagog Park · Acton, MA 01720 · Tel 978-635-0012 · Fax 978-635-0266
RESILIENT MODULUS TESTING
© 2013 Geocomp Corp.
RM = Δσ/Δε
Because only the change is critical, the actual stress values are not important.
Geocomp Corporation · 125 Nagog Park · Acton, MA 01720 · Tel 978-635-0012 · Fax 978-635-0266


