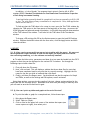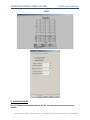
1
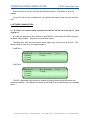
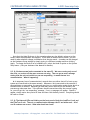
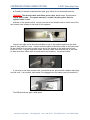
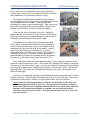
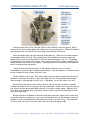
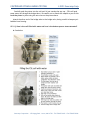
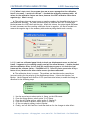
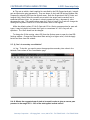
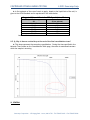
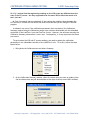
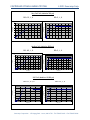
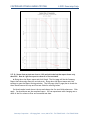
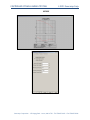
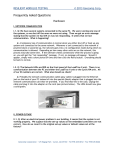
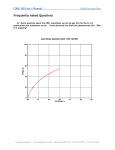
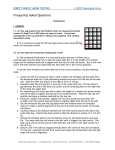
CONTROLLED STRAIN LOADING TESTING
© 2013 Geocomp Corp.
Frequently Asked Questions
Hardware
I. LIMIT SWITCHES
I-1. Q: The platen moves down at the beginning of the test until it triggers the lower limit
switch. Then the test stops and an error message appears on the screen indicating that
the lower limit switch is on. Why is this happening?
A: This occurs if, at the start of a test, the load cell is registering a load that is greater
than the target value for the first incremental consolidation step. To ensure that this does
not happen, always zero the load cell before starting a test. (See Section 6.2 for the zeroing
procedure.)
I-2. Q: During the test, a controller error message appears on the screen telling me that a
limit switch is on; what should I do?
A: The first thing to do is to look at the front panels of the LoadTrac-II and the FlowTrac-II
units to see which unit has a red limit switch flashing.
If the flashing limit switch light is on the LoadTrac-II unit, lock the piston and then open
the System Monitor window. Record the Load value in engineering units.
If the upper limit switch has been triggered, lower the platen (using the LoadTrac-II
keypad) and then lower the cross bar one notch. If the lower limit switch has been triggered,
raise the cross bar one notch and then raise the platen slightly (using the LoadTrac-II keypad).
Now reapply the load you recorded using the LoadTrac-II LCD menus and keypad. (From
the main menu select Control, then Apply and Maintain Load, then Final Load. Using the
keypad, enter the load value you recorded and then press Ent.) Unlock the piston. Click
Retry on the error window.
If the flashing limit switch light is on the FlowTrac-II unit, you probably will be able to
recover from the problem only if your CSL test cell is designed such that the line from the
FlowTrac-II unit is connected to the cell by way of a valve. If this is the case, close the valve
and then open the System Monitor window. Record the cell pressure value in engineering
units.
Depending on which limit switch was triggered, refill the pump it was empty or empty it if
it was full so that the pump is about 50% full. Reconnect the line to the test cell valve.
Before opening the valve, use the FlowTrac-II LCD menus and keypad reapply the
pressure you recorded. (From the main menu select Control, then Apply and Maintain
Pressure, then Final Pressure. Using the keypad, enter the pressure value you recorded and
then press Ent.)
Geocomp Corporation · 125 Nagog Park · Acton, MA 01720 · Tel 978-635-0012 · Fax 978-635-0266
CONTROLLED STRAIN LOADING TESTING
© 2013 Geocomp Corp.
Open the valve on the test cell and then unlock the piston. Click Retry on the error
window.
If your CSL cell has only a bridge valve, you probably will need to abort the test and start
over.
II. NETWORK COMMUNICATION
II-1. Q: There is no communication between the LoadTrac-II/FlowTrac-II and the PC. What
is going on?
A: Check the Node IDs on the LoadTrac-II and FlowTrac-II units and in the CRC.S program
Hardware Setup window. They have to be the same values.
The Node ID for each test unit is shown at the upper right on the screen of the unit. The
default values are shown in the examples below.
LoadTrac-II:
LoadTrac II.
1. Monitor
2. Position
3. Control
Rev: xx.xx.xxxx
4. Setup
ID: 65
FlowTrac II.
1. Monitor
2. Position
3. Control
Rev: xx.xx.xxxx
4. Setup
ID: 66
FlowTrac-II
The CRC.S Hardware Setup window is opened by bringing down the Options menu and
selecting Hardware. The Node IDs are shown in the Node ID text fields as seen in the example
below.
Geocomp Corporation · 125 Nagog Park · Acton, MA 01720 · Tel 978-635-0012 · Fax 978-635-0266
CONTROLLED STRAIN LOADING TESTING
© 2013 Geocomp Corp.
Note that the Node IDs shown in the examples above are the default values set at the
factory when the equipment was shipped. If the node ID numbers do not match, you will
need to make whatever change is needed so that they do match. A number can be changed
on the Hardware Setup window by simply typing in a different number and then clicking
Apply. To change the Node ID on a hardware unit, select the Node ID option on the System
Setup menu. (See your hardware User Manual for details.)
II-2. Q: We have several units connected to the same PC. We were running only one of
the units, so we shut off the ones we were not using. Then we got an error message
stating that the unit we had left on was not responding. It seems that we lost
communication. What is happening?
A: A temporary loss of communication is normal when you either shut off or boot up any
system unit connected to the same network. Whenever a unit connected to the network is
powered down or powered up, the network goes into a re-configuration mode during which no
communication is allowed. Depending on how many other units are on the network, this
process may take some time. If the software checks connections while the process is going
on, you will get the “not responding” message. If not, no message will appear. Should it
appear, simply wait a short period of time and then click the Retry button. Everything should
be back to normal.
II-3. Q: The Network LEDs are blinking on the front panel of both the LoadTrac-II unit and
the FlowTrac-II unit. There is no communication between the PC and either unit. All of
our ID numbers are correct. What else should we check?
Geocomp Corporation · 125 Nagog Park · Acton, MA 01720 · Tel 978-635-0012 · Fax 978-635-0266
CONTROLLED STRAIN LOADING TESTING
© 2013 Geocomp Corp.
A: Probably a network communication cable (gray cable) is not connected correctly.
*WARNING: The network cable looks like a phone cable, but it is not. Do not use a
regular phone cable. The system warranty is voided if anything other than the
supplied cable is used.
As shown in the picture below, connect one end of the network cable to either one of the
two network card sockets on the back of the computer.
Connect the other end of the network cable to one of the network sockets on the back
panel of your LoadTrac-II unit. Connect a second cable to the other socket on the back panel
of your LoadTrac-II unit and its other end to one of the sockets on the back panel of your
FlowTrac-II unit. Plug the terminator cable (the short cable with the black tip) to the other
(it does not matter which cable is connected to which socket). See picture below.
If you have an old-style network card, you should have a special (black) adapter that plugs
into the card. Your network cable needs to be plugged into this adapte (see picture below).
The LEDs should now glow a solid green.
Geocomp Corporation · 125 Nagog Park · Acton, MA 01720 · Tel 978-635-0012 · Fax 978-635-0266
CONTROLLED STRAIN LOADING TESTING
© 2013 Geocomp Corp.
III. POWER OUTAGE
III-1. Q: After an electrical power problem in our building, it seems that the system is not
working properly.
A: The default values may change either after an electrical power problem or due to
inadvertent actions by the end user.
You will need to revert back to the internal default values of your system by following
these steps:
1. Turn off both of the LoadTrac-II and FlowTrac-II units.
2. Wait about 10 sec.
3. Turn each back on and immediately press the ESC key on the keypad to reset
everything back to the imbedded controller default values.
4. Now go to your LoadTrac-II and FlowTrac-II hardware manuals. In Section 2.1.4
(Setup) of each, you will find a table of default settings for your system. Go through
each LCD menu and be sure the settings on the menu agree with those in the table. If
a setting does not agree, change it to the one in the manual.
5. If the Node ID numbers on your units were changed (because you are controlling more
than one system with your computer), set each to the value it was changed to.
III-2. Q: Can we turn off the PC while the test is running (because this test is timeconsuming)?
A: No, absolutely NOT, but you can use other windows programs while the test is running
and you can turn off just the monitor.
IV. SAMPLE PREPARATION
IV-1. Q: This is our first time that we are preparing a consolidation sample. Do you have
any recommendation?
A: Preparing a specimen for testing with LoadTrac-II/FlowTrac-II system utilizes
techniques similar to those commonly used in specimen preparation. (If you are unfamiliar
with preparing a specimen, refer to the specimen preparation section of the Annual Book of
ASTM Standards, ASTM D4186.
Take the cover off the CSL test cell and remove the chamber. Remove the consolidation
ring. Note the knife edge of the sample ring. This will be used to cut excess from your soil
sample as the ring is filled. It also serves to center the sample within the cell. Weigh the
sample ring to the nearest 0.01 gm.
Trim the sample until it is very nearly the same dimensions as the inside of the ring (see
top picture in picture set below). Your objective now will be to lower the consolidation ring
onto your soil sample, with a minimum of disturbance to the sample and with as little rocking
of the ring relative to the sample as possible, so that excess sample is trimmed off as the ring
is filled (see middle picture in picture set below). It is possible to extrude a sample directly
Geocomp Corporation · 125 Nagog Park · Acton, MA 01720 · Tel 978-635-0012 · Fax 978-635-0266
CONTROLLED STRAIN LOADING TESTING
© 2013 Geocomp Corp.
from a tube into the consolidation ring with the right setup.
You may have to use a tool to trim away the excess soil outside
the consolidation ring (see bottom picture at right).
Once you have pressed the consolidation ring completely
over the sample, use a wire saw to trim off excess material from
the top and bottom of the sample. Save representative
trimmings for a water content determination. Take care to trim
both ends of the sample as cleanly as possible. When you are
finished, you will have a 25.4 mm (1 inch) high sample.
Clean any soil from the exterior of the ring. Weigh the
sample and ring to the nearest 0.01 gm. Place a moist piece of
filter paper trimmed to the sample diameter on the bottom of
the sample (the end opposite the ring knife edge).
Immediately after completing the procedure described
above, select a representative sample of the trimmings that
were left after you pushed the ring over the sample and the
trimmings that came from the ends of the sample. You will
need to put the trimmings in a container (e.g., a large
evaporating dish) so that they can be dried. The container is
referred to as the tare. The results of the measurements
described below will be put in the dialog boxes of the Before
Test section of the Water Content page (see Section 6.7).
First, mark the container with some identifying label. Next, weigh the container to the
nearest 0.01 gm and record the value. (This will be the Trimmings Tare Weight in the Before
Test section of the Water Content page.) Now put the sample of trimmings into the container
and weigh the combination of trimmings and container to the nearest 0.01 gm. Record the
resulting value. (This will be the Trimmings Wet Weight in the Before Test section of the
Water Content page.)
You can dry the trimmings while you are finishing the specimen preparation and/or while
the test is running. The dry weight information will need to be put in the After Test section
of the Water Content page. However, it can be entered after the test is finished.
*Note: Details for mounting the sample in CSR test cell and filling it with water will
vary depending on the design of your cell. The important final condition to keep in
mind is that when the cell is completely assembled and all the water tubes have been
attached, no air bubbles are anywhere in chamber, the pore-pressure monitor
connector, tube connectors or tubes. The following instructions are for a cell of the
type shown below.
Geocomp Corporation · 125 Nagog Park · Acton, MA 01720 · Tel 978-635-0012 · Fax 978-635-0266
CONTROLLED STRAIN LOADING TESTING
© 2013 Geocomp Corp.
Carefully remove the O-ring from the groove in test cell base, clean the groove, lightly
coat the O-ring with vacuum grease and replace the O-ring in the groove. Remove the bottom
stone from the test cell and fill the recess (that held the stone) with water.
Place the sample plus ring onto the stone (knife edge up). Take care to avoid movement
of the sample within the ring. Now carefully place the combination of bottom stone and
sample into the cell so that the stone fits into the recessed bottom of the cell. The sample
ring should be in the center of the stone. Place a moist piece of filter paper trimmed to the
sample diameter on the top of the sample. Carefully place the top cap on the filter paper so
that it is centered over the sample.
Clean the top and bottom surfaces of the chamber and then lower it over the
consolidation ring (inner larger diameter portion down). Seat the chamber in the base recess
so that it makes an even contact with the O-ring.
Fill the chamber with water. (The water does not have to be de-aerated, but the less air
absorbed in the water the better.) Open the bridge valve for a few seconds to allow some
water through it (thus getting rid of air in it). If necessary, top off the water in the cell.
Be sure the bridge tube is connected to the test-cell top and that the piston is pushed
through the sleeve so that it is just past the top’s underside. Remove the O-ring from the cell
top, clean it and the groove and lightly coat the O-ring with vacuum grease. Replace the Oring. With the top upside down, pour clean water into the recessed area allowing the water
to fill the bridge tube.
Be sure there are no bubbles at the end of the tube, place your finger over the tube end
to prevent water from coming out, turn over the top and place it on the chamber so that the
chamber is in the recessed portion and makes even contact with the O-ring. Align the holes
in the top with the holes in the base, insert the bolts and hand tighten them.
Geocomp Corporation · 125 Nagog Park · Acton, MA 01720 · Tel 978-635-0012 · Fax 978-635-0266
CONTROLLED STRAIN LOADING TESTING
© 2013 Geocomp Corp.
Carefully push the piston into the cell until it just touches the top cap. (This will push
some water out through the bridge tube.) Be careful not to disturb the sample as you do this.
Lock the piston in place using the set screw on the piston sleeve.
Attach the other end of the bridge tube to the bridge valve, being careful to keep any air
bubbles from forming.
IV-2. Q: How is the cell filled with water and how is the bottom porous stone saturated?
A: See below.
Geocomp Corporation · 125 Nagog Park · Acton, MA 01720 · Tel 978-635-0012 · Fax 978-635-0266
CONTROLLED STRAIN LOADING TESTING
© 2013 Geocomp Corp.
Software
I. CALIBRATION/ZEROING
I-1. Q: When I view the system before starting a test, there is always an offset of about
±0.005 kN (1 lb.). Why? There is no contact between the vertical load cell and specimen,
so why is there a small offset in the load and how can I make it zero?
A: Between tests, the load cell output will usually drift a small amount. At best, the noload condition will be in the range of ±0.025% of load cell full capacity, which translates to
about ±0.001 kN (±0.25 lb) for a 4.45 kN (1000 lb) load cell. If you observe a no-load
condition on the System Monitor window that is greater than ±0.025% of full capacity, use the
following steps to zero the load cell.
1. Be sure the load cell is not in contact with anything.
2. Bring down the Calibrate menu and select Summary to open the Calibration Summary
window. Position this window beside the System Monitor window.
3. Note the Load reading in counts on the System Monitor window (top left text field).
4. Replace the Offset value that is shown on the Calibration Summary window (when
Load is selected for the Channel choice) with the Load reading (in counts) that is on
the System Monitor window.
5. Click the Apply button, the Download button and then the Ok button to close the
Calibration Summary window.
6. You should now see in the System Monitor window that the vertical load cell reading
(in engineering units) is within ±0.025% of full capacity.
*Note: Steps 2-6 of this re-zeroing process can be applied to any other sensor once it
has been physically set at the “zero” condition.
I-2. Q: In many of our different test files, the calibration values in the Summary Table and
the values in each sensor's individual calibration table are not in sync. Could you please
explain which values the program uses, and how to make sure they are correct?
A: When running a test, the CRC.S software uses only the parameters that are shown in
the Calibration Summary. A mismatch between these values and those on the Calibrate
window for a particular sensor can occur if the Calibrate window values have not been saved
by clicking the Save button on that window.
To determine whether or not the Summary values are correct, you need to know how the
test was set up. The two possibilities are described below.
The parameters are correct
You have two LoadTrac-II/FlowTrac-II systems, A and B. You plan to run a test on system
A. A file for a test run on system B is a good template for the test, but the calibration
parameters in it are those for the sensors on system B. You open a CRC.S control window and
load that file into the window. We will call that file Test-B.
Geocomp Corporation · 125 Nagog Park · Acton, MA 01720 · Tel 978-635-0012 · Fax 978-635-0266
CONTROLLED STRAIN LOADING TESTING
© 2013 Geocomp Corp.
Next, you open a second CRC.S control window and load into it a file for a test that was
run on system A. We will call that file Test-A.
Finally, you copy the calibration parameters from the Calibration Summary in Test-A and
paste them into the Calibration Summary in Test-A.
You now have a control program that contains the correct calibration parameters for
running a test on system A, but those shown on the Calibration Summary will be different
from those on the individual sensor Calibrate windows.
The parameters are not correct
You have two LoadTrac-II/FlowTrac-II systems, A and B. You plan to run a test on system
A. A file for a test run on system B is a good template for the test, but the calibration
parameters in it are those for the sensors on system B. You open a CRC.S control window and
load that file into the window. We will call that file Test-B.
You decide to calibrate the sensors and use Test-B to do it. You go through the
calibration procedure for each sensor and click the Calibrate button on each Calibrate
window. But you forget to click the Save button on each window before closing it.
You now have a control program that has the correct calibration parameters on each
Calibrate window, and they will be different from those in the Calibration Summary.
However, it is the incorrect Summary values that will be used to run the test.
If you know (or suspect) that a test was run using a file with incorrect calibration
parameters on the summary window, you can recover from the error.
Error Recovery
Open a CRC.S control window and load the erroneous test file into it.
You will need to replace the calibration parameters (factors and offsets) that are shown
on the Calibration Summary with correct ones.
If you are certain that the parameters on the individual Calibrate windows are correct,
simply click Save on each of those windows.
If you will have to enter new values manually, there are two ways to do this: (1) delete
the original values and type the new ones into the text fields or (2) copy and paste the new
ones. For the second option, you will need to open a second copy of CRC.S and load the test
file that contains the correct calibration parameters.
Finally, save the file and reload it. The new values will be applied to the processed data.
*Note: The raw data and the results of data reduction shown on the report pages
will be changed. The stress target values that were entered into the Initialization
page, the Consolidation Table pages and the Shear Table page will not be changed.
Geocomp Corporation · 125 Nagog Park · Acton, MA 01720 · Tel 978-635-0012 · Fax 978-635-0266
CONTROLLED STRAIN LOADING TESTING
© 2013 Geocomp Corp.
I-3. Q: When I start a test, the program gives me an error message that the calibration
factor is too small. I cannot run the test. I checked the calibration summary table. All
values for the calibration factors are there; however the LVDT calibration factor has a
negative sign. What’s wrong?
A: The software does not accept zeros or negative numbers for the calibration factors in
the calibration summary. The most convenient way to calibrate the LVDT is to add gage
blocks between the LVDT shaft and the stop. When this is done, the output signal decreases
for each increment and the resulting calibration factor is negative. All that is needed is to
remove the negative sign in the summary table and everything should work correctly.
I-4. Q: I used our calibrated gauge blocks to check our displacement sensor on the load
frame. It appears to give readings roughly one half the actual distance. I double checked
that the calibration factor (in/cnt) from the certificate you gave us is in both the load
frame and the software (factor = 3.6498841x10⁻⁵). Does this factor seem to be off by a
factor of two, based on the other similar sensors you have calibrated?
A: The calibration factor is correct. The problem you describe can be caused by an
incorrect setting for the polarity of the displacement sensor. It has to be Unipolar, not
Bipolar. Use the keypad and LoadTrac-II LCD (see illustration below) to make the change as
described in the following steps.
LoadTrac II.
1. Monitor
2. Position
3. Control
1.
2.
3.
4.
5.
6.
Rev: xx.xx.xxxx
4. Setup
ID: 65
Use the arrow keys to select option 4, Setup, on the LCD screen.
From the Setup options, select option 3, A/D Setup.
From the A/D Setup options, select option 2, Channel 2.
From the Channel 2 options, select option 2, Polarity.
Of the two polarity options, select Unipolar.
Finally, turn off the LoadTrac-II and then back on for the changes to take effect.
Geocomp Corporation · 125 Nagog Park · Acton, MA 01720 · Tel 978-635-0012 · Fax 978-635-0266
CONTROLLED STRAIN LOADING TESTING
© 2013 Geocomp Corp.
I-5. Q: Can I use a new calibration factor and apply it to the previous test I have already
ran and get the correct results?
A: Yes, you can.
Open the CRC.S program and load the file for the test you had already run.
You will need to replace the calibration parameters (factor and offset) that are shown on
the Calibration Summary with the new ones. There are two ways to do this: (1) delete the
original values and type the new ones into the text fields or (2) copy and paste the new ones.
For the second option, you will need to open a second copy of CRC.S and load the test file
that contains the new calibration parameters.
Save (using the Save or Save As option in the CRC.S file menu) the altered test file.
When you load that file again, the new parameters will have been applied to the
processed data.
*Note: The raw data and the results of data reduction shown on the report pages
will be changed. Information that was entered using the various Property Pages
will not be changed.
I-6. Q: I calibrated my transducer and filled out the Calibration table under the Options
menu. However, I can't get the program to save the new calibration numbers. When I open
the file back up the old calibration numbers are still there. How do I save the new calibration
data?
A: Go to File>Save As. Save the file under a new name such as newtemplate.dat
II. CONSOLIDATION PHASE
II-1. Q: I am processing the data from the consolidation test we ran on a new load frame.
From the looks of the results, it appears that when the data are dumped in engineering
units, the compression of the machine is NOT accounted for in the data that have been
dumped. Is this correct?
A: Yes, that is correct. Compensation for machine compression is not applied to dumped
data. Dumped data includes only raw data values. To view the corrected data, bring down
the Report menu and select Table. You can than look at all of the corrected results by
opening the various pages using the options on the View menu (upper left corner of a page) or
the Page Down, Page Up keys on your keyboard.
II-2. Q: I noticed that when running a test on a soft soil sample it takes a relatively long
time for the load to reach the specified value. How can I change the rate at which the
load is applied?
Geocomp Corporation · 125 Nagog Park · Acton, MA 01720 · Tel 978-635-0012 · Fax 978-635-0266
CONTROLLED STRAIN LOADING TESTING
© 2013 Geocomp Corp.
A: The rate at which a load is applied is controlled by the PID (Proportional gain, Integral
gain and Derivative gain) parameters. They are shown on the Load PID Settings window that
is opened by selecting PID from the Options menu. Both the Proportional Gain (P-Gain) and
Integral Gain (I-Gain) affect the overall rate at which the target load is reached, but in
somewhat different ways. An increase in value increases the rate; a decrease in value
decreases the rate. The possible value range for P-Gain is from 0.5 to 5 and will change the
loading time by about a factor of 3 from the lowest value to the highest.
While the default values (2.5 for P-Gain and 0.2 for I-Gain) are appropriate for most soil
types, it may be helpful to increase the P-gain to a maximum of 5 for a very soft soil
specimen. The I-Gain should not be changed.
To change the P-Gain setting, select PID from the Options menu to open the Load PID
Settings window. Change the Proportional Gain setting to a higher value, click the Apply
button and then close the window.
II-3. Q: Can I do secondary consolidation?
A: Yes. To do this, you need to enter the appropriate secondary time value in the
Maintain Time column of the Consolidation page.
II-4. Q: What’s the suggested rate of stain to be used in order to give an excess pore
pressure in the range of 3% - 20% of the total applied vertical stress?
Geocomp Corporation · 125 Nagog Park · Acton, MA 01720 · Tel 978-635-0012 · Fax 978-635-0266
CONTROLLED STRAIN LOADING TESTING
© 2013 Geocomp Corp.
A: A first estimate of the rate of strain to apply, based on the liquid limit of the soil, is
given in the ASTM Standard and is reproduced in the table below.
Suggested Rates of Strain for CRS Consolidation Tests
Liquid limit range
(%)
Up to 40
40-60
60-80
80-100
100-120
120-140
Based on ASTM D 4186-82
Rate of strain
(% per minute)
0.04
0.01
0.004
0.001
.0004
.0001
II-5. Q: Why is there a vertical drop at the end of the final consolidation stress?
A: This drops represent the secondary consolidation. During the time specified in the
Maintain Time column on the Consolidation Table page, the stress is maintained constant
while the sample is straining.
III. GENERAL
Geocomp Corporation · 125 Nagog Park · Acton, MA 01720 · Tel 978-635-0012 · Fax 978-635-0266
CONTROLLED STRAIN LOADING TESTING
© 2013 Geocomp Corp.
III-1. Q: While starting the test, the machine will ask "Position Platen?" When I press "Yes",
the LoadTrac-II should move the platen up until it just touches the load cell, but how do I
know whether the load cell is being touched? (The computer immediately asks me to
"Press OK when ready," but I am not aware of any other indication that the proper
condition for starting the test.)
A: When you press “Yes,” the Positioning Platen window appear, the green LED for Motor
Up will come on, you will hear the stepper motor in the load frame start to run and the
platen will move up until the LoadTrac-II system senses a very small load that typically is less
than 0.002 kN (0.50 lb). (If the sample starts out very close to the load cell, the upward
motion of the platen may not be very noticeable.) As soon at the small load is sensed, the
green LED will turn off and the stepper motor will stop. These are the indications that the
condition for starting the test has been reached. It is at this point that you should press OK.
The “Unlock Piston” message will appear. Unlock the piston and the press OK on that
window.
III-2. Q: Why is my final saturation value higher than 100%?
A: This value is sensitive to several factors:
The specific gravity of the sample.
The water content.
The exact measurements of the inside diameter and height of the ring. (For
instance, the diameter may be 2.489 inches instead of 2.500 inches, and the height
may likewise vary. We recommend using precise calipers to measure the
dimensions of the ring. This should only have to be done once.)
III-3. Q: How do you correctly enter the water content information?
A: In order to get accurate results for the CSL test using the CRC.S software and LoadTracII/FlowTrac-II system, it is important that you pay close attention to the entry of data into
the computer program by way of the Property Pages. Dimension values must be correct to
±0.1 mm (±0.004 in) and weight values must be correct to ±0.01 gm.
Specimen
On the Specimen page in the CRC.S program, be sure the actual dimensions of Initial
Diameter and Initial Height for the sample are entered. Initial Sample Weight has to be the
actual mass of the sample only (do not include the tare value).The actual or listed Specific
Gravity value must be specified. If the Liquid Limit and Plastic limit are known or specified,
these two items should be entered for reporting purchase in the printout of the test results
produced by the software.
Water Content
On the Water Content page, accurate values must be entered so that the program will
correctly compute initial water content, final water content and void ratio. On the Water
Geocomp Corporation · 125 Nagog Park · Acton, MA 01720 · Tel 978-635-0012 · Fax 978-635-0266
CONTROLLED STRAIN LOADING TESTING
© 2013 Geocomp Corp.
Content page, you will see sections labeled Before Test and After Test. Data entry should be
as follows.
Before Test
Tare ID: This the name, number or other identifying label of the tare container itself
(e.g., Icon1, Test2, can A, etc.).
Tare Weight: this is the actual weight of the container identified above.
Wet Weight: this is the combined weight of both the tare and portion or trimmings of the
wet sample to be tested.
Dry Weight: this is the combined weight of both the tare and portion or trimmings of the
oven-dried sample to be tested.
After Test
This portion of the Water Content section has two parts: Specimen weight and Trimmings
weight.
Specimen
Specimen Tare ID: insert the label “ring” as you will actually be inserting the weight of
the ring without any sample and will clearly identify the actual part of the test apparatus
used during the test.
Specimen Tare Weight: insert the weight of the consolidation ring, the separate
component into which the test sample is extruded.
Specimen Wet Weight: insert the combined pre-test weight of the ring and the original
wet sample (this should not include the weight of the filter papers and porous stones).
Trimmings
Trimmings Tare ID: this is the label name of the container, usually a large evaporating
dish.
Trimmings Tare Weight: this is the weight of the tare or container identified above.
Trimmings Wet Weight: this the wet weight of the immediate post test sample plug which
has been carefully ejected from the consolidation ring after the top and bottom filter papers
have been removed, including the weight of the tare.
Trimmings Dry Weight: this is the oven dried weight of the tare and sample.
The computer program uses the water content of the trimmings to compute the After Test
Dry Weight, the final water content of the sample and, together with the initial water
content, the void ratio values, dry unit weight and saturation.
Geocomp Corporation · 125 Nagog Park · Acton, MA 01720 · Tel 978-635-0012 · Fax 978-635-0266
CONTROLLED STRAIN LOADING TESTING
© 2013 Geocomp Corp.
III-4. Q: I noticed that the engineering readings on the LCD screen are different than the
ones on the PC screen. Are they supposed to be the same? Did it affect the results of a
test I just ran?
A: First, be assured that any mismatch of the engineering readings values between the
LCD and the PC screens will not affect the results of a test that you run using the TRIAXIAL
program.
A mismatch can occur if the calibration parameters that are shown in the Calibration
Summary (opened using the Calibration menu) have not been downloaded into the imbedded
controllers of the LoadTrac-II unit and FlowTrac-II units. However, the software uses only the
Calibration Summary values when it runs a test. Consequently, it is very important that these
are correct.
To synchronize the LCD and PC screen readings, you need to update the calibration
parameters in the imbedded controller of the LoadTrac-II unit. To do this, follow the steps
shown below.
1. Bring down the Calibrate menu and select Summary.
2. On the Calibration Summary window, select the sensor that you want to update (from
the list shown when the pull-down button to the right of the top text field is clicked).
Geocomp Corporation · 125 Nagog Park · Acton, MA 01720 · Tel 978-635-0012 · Fax 978-635-0266
CONTROLLED STRAIN LOADING TESTING
© 2013 Geocomp Corp.
3. Click the Download button. This will automatically transfer (copy and save) the
current calibration parameters (Factor and Offset) for the selected sensor into the
embedded controller.
4. Repeat the above procedure for the other sensors.
You should now see that the PC and LCD screen values match.
III-5. Q: Can the software detect wrong values that are manually entered by the end user?
A: Yes, the software program detects any erroneous values that have been entered. It
also detects certain hardware malfunctions. Examples include:
1. Negative values for sample dimensions, calibration factors, and PID control parameters
2. Zero values for sample dimensions, calibration factors (except for offset value), and
PID control parameters
3. Wrong Node ID numbers
4. A malfunctioning sensor that it is giving an analog reading of either 0 (the minimum
value) or 65535 (the maximum value)
5. Any unit (LoadTrac-II or FlowTrac-II) that is not on.
III-6. Q: I am running a test right now. Do I need to wait until the end of the test to see
the results?
A: You do not need to wait until the end of the test. While the test is running:
1. Go to the File menu.
2. Select Load.
3. Go to the Report menu. You will be able to see the partial test results up to the point
when you did the Load.
4. Repeat the above steps as the test progresses.
III-7. Q: Do the data that are obtained through the dump feature include the machine
calibration or are they raw data?
A: The dumped data are raw data; they do not include any correction.
III-8. Q: We would like to use the CRS in a slightly different form. We would like to select
a rate based on material type and not change it during the test (regardless of how much
pore pressure is generated). In other words, we want to use true “Constant Rate of
Strain” during the entire test. We could not do it using the current software as the rate is
adjusted during loading. Please advise how we can get around with this problem.
A: You need to specify unattainable lower and upper ressure ratios such as -1 and 1. Then
the strain rate will remain unchanged.
Geocomp Corporation · 125 Nagog Park · Acton, MA 01720 · Tel 978-635-0012 · Fax 978-635-0266
CONTROLLED STRAIN LOADING TESTING
© 2013 Geocomp Corp.
IV. PID SETTINGS
IV-1. Q: What are the effects and correlations between the PID values?
A: The ICONP program uses a control technique that is very complex. Consequently it is
difficult to explain in detail how the PID values are used. In general terms, as an applied load
is reaching its target value, the program periodically gathers information and adjusts the
loading rate by using the information and the PID (Proportional gain, Integral gain and
Derivative gain) values. Both the Proportional Gain (P-Gain) and Integral Gain (I-Gain) affect
the overall rate at which the load reaches the target value, but in somewhat different ways.
An increase in value increases the rate; a decrease in value decreases the rate.
As the load gets close to the target value, the P-Gain functions to decrease the loading
rate so that the target value is not reached too suddenly. (Keeping the loading rate constant
would be like hitting the specimen with a hammer.) On the other hand, I-Gain functions to
increase the loading rate throughout the loading process. The values of these parameters
that will produce the most rapid loading rate while preventing the target from being “hit” too
rapidly differs for each soil type. The default values of 2.5 and 0.2 for the P-Gain and I-Gain
respectively work well for most soil types.
The graphs that are included in the answer to Q/A V-2 below help to show the effects of
the P-Gain and I-Gain. As can be seen, the I-Gain needs to be changed only for very stiff
soils.
IV-2. Q: Do I have to adjust the PID value for the type of soil that I am testing?
A: Yes, you may have to. It is possible to use any Proportional Gain (P-Gain) value
from 0.5 to 5 and any Integral Gain (I-Gain) from 0.1 to 1. (The Derivative Gain value of 0
should not be changed.) The rate at which a load is applied at the beginning of a step
depends on both the P-Gain and the I-Gain: lower value = slower rate, higher value =
faster rate. The time to reach a target value increases by a factor of about 3 from a PGain of 0.5 to 5. The table below gives general guidelines for P-Gain settings.
Sample stiffness
LOOSE /VERY SOFT
MEDIUM SOFT/MEDIUM
DENSE/STIFF
Recommended P-Gain
value
5.0
2.5
0.5
Geocomp Corporation · 125 Nagog Park · Acton, MA 01720 · Tel 978-635-0012 · Fax 978-635-0266
CONTROLLED STRAIN LOADING TESTING
© 2013 Geocomp Corp.
In addition, the following information may help you to decide what value will be best
for your sample.
The graphs shown below are for loading curves generated during a test. (They
were generated from data dumped into a file after the test.) Note that the time
scale is not the same for the different soil types. When possible, the target load
should be reached in less than 0.5 min. Consequently a high P-Gain setting is good
for very soft soils.
It is easy to reach the target load value for stiff soils. However (as seen in the
last two graphs), the target value may not be reached smoothly. To help this
situation, the I-Gain (or both the I-Gain and P-Gain) can be decreased.
Geocomp Corporation · 125 Nagog Park · Acton, MA 01720 · Tel 978-635-0012 · Fax 978-635-0266
CONTROLLED STRAIN LOADING TESTING
© 2013 Geocomp Corp.
Very Soft Soil (Modulus 290 psi)
PID: 5, 1, 0
1.2
1.2
1.0
1.0
0.8
0.8
Load/Target
Load/Target
PID: 0.5, 1, 0
0.6
0.4
0.2
0.6
0.4
0.2
0.0
0.0
0.0
0.5
1.0
1.5
2.0
2.5
3.0
3.5
4.0
0
0.5
1
1.5
Time (min)
2
2.5
3
3.5
4
Time (min)
Medium Soil (Modulus 4000 psi)
PID: 0.5, 1, 0
PID: 5, 1, 0
1.2
500
1.0
400
0.8
Load/Target
Force (n
600
300
200
100
0
0.00
0.6
0.4
0.2
0.05
0.10
0.15
0.20
0.25
0.30
0.35
0.40
0.45
0.0
0.00
0.50
0.05
0.10
0.15
0.20
Time (mi n)
0.25
0.30
0.35
0.40
0.45
0.50
Time (mi n)
Stiff Soil (Modulus 10,000 psi)
PID: 0.5, 1, 0
1.2
1.2
1.0
1.0
0.8
0.8
Load/Target
Load/Target
PID: 0.1, 0.1, 0
0.6
0.4
0.2
0.0
0.00
0.6
0.4
0.2
0.05
0.10
0.15
Time (mi n)
0.20
0.25
0.0
0.00
0.05
0.10
0.15
0.20
0.25
Time (mi n)
Geocomp Corporation · 125 Nagog Park · Acton, MA 01720 · Tel 978-635-0012 · Fax 978-635-0266
CONTROLLED STRAIN LOADING TESTING
© 2013 Geocomp Corp.
In addition, a “rule of thumb” for response time is given in Section 6.0 of ASTM
standard D2435: Standard Test Methods for One-Dimensional Consolidation Properties
of Soils Using Incremantal Loading.
“Load application generally should be completed in a time corresponding to 0.01 t100
or less. For soils where primary consolidation is completed in 3 min, load application
should be less than 2 s.”
To find out what the T100 value is for a step in a test, open the Test T100 window (by
choosing the T100 option in the View menu) at the beginning of the step. As soon as the
ICONP program has gathered enough information, it will show the graphical determination
of the T100 value on the window. It will also list the T100 value in the Test Monitor
window.
To change a PID setting click PID on the Options menu to open the Load PID Settings
window. Replace the default value with the new value, click the Apply button and then
close the window.
V. REPORT
V-1. Q: After running a successful test we ran into troubles with the report. We were not
able to generate a report because all links on the report pull down menu are inactive.
Are we missing something, or is the software not entirely installed?
A: To make the links active, parameters and data for a test must be loaded into the CRC.S
program so that they can be displayed on the various CRC.S windows. Go through the
following steps to load a data file.
1. First pull down the File menu.
2. Next, click on Load. This will display a window that shows data files for tests that
have been completed (and for any test that is currently running). Highlight the file
name for the test you wish to load and then click Open.
3. Finally, pull down the Report menu. You should now see that the options for Graph
and Table, as well as the Settings and Edit options, are all activated.
Using these options, you can view the results of the test, change various settings for the
report and edit the test data points. Remember that each time you change or edit any item
you will need to save the file and load it again.
V-2. Q: How can I print my tables and graphs at the end of the test?
A: To print the table or graph for a completed test, follow these steps:
1. Bring down the Report menu.
2. Select Table (or Graph).
3. Click on View at the upper left corner of the window that opens (see
screen capture at right), then select print.
Geocomp Corporation · 125 Nagog Park · Acton, MA 01720 · Tel 978-635-0012 · Fax 978-635-0266
CONTROLLED STRAIN LOADING TESTING
© 2013 Geocomp Corp.
V-3. Q: When I look at my results using the Graph option on the Report menu, I find that
some data points from my test are “chopped” and not shown. What’s the problem?
A: Bring down the Report menu and click Settings. On the Cv page, you can change the
data that will be displayed by adjusting the values of Minimum Time Change, Minimum Stress
Change, Minimum Excess Pressure, Minimum Pressure Ratio, and Maximum Pressure Ratio.
These values determine what data will be shown on the graph.
You should enter these values as zeros to see all of the recorded data. If some of these
values are too large, the data will be displayed as “chopped.”
V-4. Q: My test does not seem to be going very well. See attached. Any comment?
A: It appears that for this type of soil, you should use a lower final stress; the test is
complete once you reach 20-30% vertical strain. In fact the theory of consolidation is only
valid for small strains.
Geocomp Corporation · 125 Nagog Park · Acton, MA 01720 · Tel 978-635-0012 · Fax 978-635-0266
CONTROLLED STRAIN LOADING TESTING
© 2013 Geocomp Corp.
V-5. Q: I know that my test ran close to 14% vertical strain but the report shows only
about 4%. How do I get the report to show all of the test data?
A: Bring down the Report menu and click Graph. The first page will be the Summary
Report that shows only about 4% vertical strain. Bring down the Report menu and click
settings to open the Report Settings window. The first page (the Cv page) has to check the
three check boxes at the top and five text fields for entering values.
Put check marks in each box at the top and change the five text-field values zero. Click
apply. You should now see the complete report. You can experiment with changing one or
more of the five values to filter out unwanted test data.
Geocomp Corporation · 125 Nagog Park · Acton, MA 01720 · Tel 978-635-0012 · Fax 978-635-0266
CONTROLLED STRAIN LOADING TESTING
© 2013 Geocomp Corp.
BEFORE
Geocomp Corporation · 125 Nagog Park · Acton, MA 01720 · Tel 978-635-0012 · Fax 978-635-0266
CONTROLLED STRAIN LOADING TESTING
© 2013 Geocomp Corp.
AFTER
VI. SATURATION PHASE
VI-1. Q: During the saturation phase of the CSL test should I have the valve open or
closed?
Geocomp Corporation · 125 Nagog Park · Acton, MA 01720 · Tel 978-635-0012 · Fax 978-635-0266
CONTROLLED STRAIN LOADING TESTING
© 2013 Geocomp Corp.
A: You need to set up the Saturation phase so that it will have a long duration and the
valve will have to be open. Then, before the Saturation phase ends, you need to close the
valve and send the test to the Consolidation phase. With the valve open, the pressure
applied during the long Saturation phase should result in sufficient saturation of the sample.
Geocomp Corporation · 125 Nagog Park · Acton, MA 01720 · Tel 978-635-0012 · Fax 978-635-0266