1
GX LogViewer Version 1
Operating Manual
-SW1DNN-VIEWER-M
SAFETY PRECAUTIONS
(Read these precautions before using this product.)
Before using this product, please read this manual carefully and pay full attention to safety to handle the product correctly.
The precautions given in this manual are concerned with this product only. For the safety precautions for the programmable
controller system, refer to the user's manual for the module used and the system manuals(MELSEC iQ-R Module
Configuration Manual, QCPU User's Manual (Hardware Design, Maintenance and Inspection), and MELSEC-L CPU Module
User's Manual (Hardware Design, Maintenance and Inspection)).
In this manual, the safety precautions are classified into two levels: "
WARNING" and "
CAUTION".
WARNING
Indicates that incorrect handling may cause hazardous conditions, resulting in
death or severe injury.
CAUTION
Indicates that incorrect handling may cause hazardous conditions, resulting in
minor or moderate injury or property damage.
Under some circumstances, failure to observe the precautions given under "
CAUTION" may lead to serious
consequences.
Observe the precautions of both levels because they are important for personal and system safety.
Make sure that the end users read this manual and then keep the manual in a safe place for future reference.
1
CONDITIONS OF USE FOR THE PRODUCT
(1) Mitsubishi programmable controller ("the PRODUCT") shall be used in conditions;
i) where any problem, fault or failure occurring in the PRODUCT, if any, shall not lead to any major or serious accident;
and
ii) where the backup and fail-safe function are systematically or automatically provided outside of the PRODUCT for the
case of any problem, fault or failure occurring in the PRODUCT.
(2) The PRODUCT has been designed and manufactured for the purpose of being used in general industries.
MITSUBISHI SHALL HAVE NO RESPONSIBILITY OR LIABILITY (INCLUDING, BUT NOT LIMITED TO ANY AND ALL
RESPONSIBILITY OR LIABILITY BASED ON CONTRACT, WARRANTY, TORT, PRODUCT LIABILITY) FOR ANY
INJURY OR DEATH TO PERSONS OR LOSS OR DAMAGE TO PROPERTY CAUSED BY the PRODUCT THAT ARE
OPERATED OR USED IN APPLICATION NOT INTENDED OR EXCLUDED BY INSTRUCTIONS, PRECAUTIONS, OR
WARNING CONTAINED IN MITSUBISHI'S USER, INSTRUCTION AND/OR SAFETY MANUALS, TECHNICAL
BULLETINS AND GUIDELINES FOR the PRODUCT.
("Prohibited Application")
Prohibited Applications include, but not limited to, the use of the PRODUCT in;
• Nuclear Power Plants and any other power plants operated by Power companies, and/or any other cases in which the
public could be affected if any problem or fault occurs in the PRODUCT.
• Railway companies or Public service purposes, and/or any other cases in which establishment of a special quality
assurance system is required by the Purchaser or End User.
• Aircraft or Aerospace, Medical applications, Train equipment, transport equipment such as Elevator and Escalator,
Incineration and Fuel devices, Vehicles, Manned transportation, Equipment for Recreation and Amusement, and
Safety devices, handling of Nuclear or Hazardous Materials or Chemicals, Mining and Drilling, and/or other
applications where there is a significant risk of injury to the public or property.
Notwithstanding the above, restrictions Mitsubishi may in its sole discretion, authorize use of the PRODUCT in one or
more of the Prohibited Applications, provided that the usage of the PRODUCT is limited only for the specific
applications agreed to by Mitsubishi and provided further that no special quality assurance or fail-safe, redundant or
other safety features which exceed the general specifications of the PRODUCTs are required. For details, please
contact the Mitsubishi representative in your region.
2
INTRODUCTION
Thank you for your patronage. We appreciate your purchase of the Mitsubishi integrated FA software, MELSOFT series.
This manual is designed for users to understand operations of GX LogViewer.
Before using the product, please read this manual carefully and develop familiarity with the functions and performance of GX
LogViewer and supported modules to handle the products correctly.
3
CONTENTS
SAFETY PRECAUTIONS . . . . . . . . . . . . . . . . . . . . . . . . . . . . . . . . . . . . . . . . . . . . . . . . . . . . . . . . . . . . . . . . . . . .1
CONDITIONS OF USE FOR THE PRODUCT . . . . . . . . . . . . . . . . . . . . . . . . . . . . . . . . . . . . . . . . . . . . . . . . . . . .2
INTRODUCTION . . . . . . . . . . . . . . . . . . . . . . . . . . . . . . . . . . . . . . . . . . . . . . . . . . . . . . . . . . . . . . . . . . . . . . . . . . .3
RELEVANT MANUAL . . . . . . . . . . . . . . . . . . . . . . . . . . . . . . . . . . . . . . . . . . . . . . . . . . . . . . . . . . . . . . . . . . . . . . .8
TERMS . . . . . . . . . . . . . . . . . . . . . . . . . . . . . . . . . . . . . . . . . . . . . . . . . . . . . . . . . . . . . . . . . . . . . . . . . . . . . . . . . .9
CHAPTER 1
OVERVIEW
11
1.1
Overview of GX LogViewer. . . . . . . . . . . . . . . . . . . . . . . . . . . . . . . . . . . . . . . . . . . . . . . . . . . . . . . . . . . . . . . . 11
1.2
Features . . . . . . . . . . . . . . . . . . . . . . . . . . . . . . . . . . . . . . . . . . . . . . . . . . . . . . . . . . . . . . . . . . . . . . . . . . . . . . . 12
CHAPTER 2
2.1
2.2
SYSTEM CONFIGURATION
16
Operating Environment. . . . . . . . . . . . . . . . . . . . . . . . . . . . . . . . . . . . . . . . . . . . . . . . . . . . . . . . . . . . . . . . . . . 16
System Configuration . . . . . . . . . . . . . . . . . . . . . . . . . . . . . . . . . . . . . . . . . . . . . . . . . . . . . . . . . . . . . . . . . . . . 16
Displaying data logged by RCPU on GX LogViewer . . . . . . . . . . . . . . . . . . . . . . . . . . . . . . . . . . . . . . . . . . . . . . 16
Displaying data logged by QnUDVCPU/LCPU on GX LogViewer. . . . . . . . . . . . . . . . . . . . . . . . . . . . . . . . . . . . 18
Displaying data logged by Analog module on GX LogViewer . . . . . . . . . . . . . . . . . . . . . . . . . . . . . . . . . . . . . . . 19
Displaying data logged by Data logger/Data communication on GX LogViewer . . . . . . . . . . . . . . . . . . . . . . . . . 22
Considerations for connection . . . . . . . . . . . . . . . . . . . . . . . . . . . . . . . . . . . . . . . . . . . . . . . . . . . . . . . . . . . . . . . 24
CHAPTER 3
FUNCTION LIST
27
CHAPTER 4
OBTAINING AND STARTING GX LogViewer
31
4.1
Obtaining GX LogViewer. . . . . . . . . . . . . . . . . . . . . . . . . . . . . . . . . . . . . . . . . . . . . . . . . . . . . . . . . . . . . . . . . . 31
4.2
Installing and Uninstalling GX LogViewer. . . . . . . . . . . . . . . . . . . . . . . . . . . . . . . . . . . . . . . . . . . . . . . . . . . . 31
4.3
Starting and Exiting GX LogViewer . . . . . . . . . . . . . . . . . . . . . . . . . . . . . . . . . . . . . . . . . . . . . . . . . . . . . . . . . 31
4.4
Switching the Display Language . . . . . . . . . . . . . . . . . . . . . . . . . . . . . . . . . . . . . . . . . . . . . . . . . . . . . . . . . . . 31
CHAPTER 5
SCREEN CONFIGURATION
33
5.1
Main Window . . . . . . . . . . . . . . . . . . . . . . . . . . . . . . . . . . . . . . . . . . . . . . . . . . . . . . . . . . . . . . . . . . . . . . . . . . . 33
5.2
Child Windows. . . . . . . . . . . . . . . . . . . . . . . . . . . . . . . . . . . . . . . . . . . . . . . . . . . . . . . . . . . . . . . . . . . . . . . . . . 34
5.3
Assistant Screen . . . . . . . . . . . . . . . . . . . . . . . . . . . . . . . . . . . . . . . . . . . . . . . . . . . . . . . . . . . . . . . . . . . . . . . . 35
5.4
Menu Configuration. . . . . . . . . . . . . . . . . . . . . . . . . . . . . . . . . . . . . . . . . . . . . . . . . . . . . . . . . . . . . . . . . . . . . . 36
CHAPTER 6
OPERATION FLOWS
39
6.1
Displaying Data of CPU Module/Analog Module . . . . . . . . . . . . . . . . . . . . . . . . . . . . . . . . . . . . . . . . . . . . . . 41
6.2
Displaying Data/Events of Data Logger. . . . . . . . . . . . . . . . . . . . . . . . . . . . . . . . . . . . . . . . . . . . . . . . . . . . . . 42
6.3
Displaying Data of Data Communication . . . . . . . . . . . . . . . . . . . . . . . . . . . . . . . . . . . . . . . . . . . . . . . . . . . . 43
6.4
Displaying CSV Files in GX LogViewer Format . . . . . . . . . . . . . . . . . . . . . . . . . . . . . . . . . . . . . . . . . . . . . . . 43
Displaying Data Saved with Energy Measuring Unit . . . . . . . . . . . . . . . . . . . . . . . . . . . . . . . . . . . . . . . . . . . . . . 43
Displaying Sampling Trace Data Saved with GX Works2 . . . . . . . . . . . . . . . . . . . . . . . . . . . . . . . . . . . . . . . . . . 44
Displaying Data Saved with FLEXIBLE HIGH-SPEED I/O CONTROL Module Configuration Tool . . . . . . . . . . 44
CHAPTER 7
7.1
CONNECTING TO MODULE
45
Selecting Connection Target . . . . . . . . . . . . . . . . . . . . . . . . . . . . . . . . . . . . . . . . . . . . . . . . . . . . . . . . . . . . . . 45
Connection target and connection methods . . . . . . . . . . . . . . . . . . . . . . . . . . . . . . . . . . . . . . . . . . . . . . . . . . . . 45
7.2
Connecting to RCPU . . . . . . . . . . . . . . . . . . . . . . . . . . . . . . . . . . . . . . . . . . . . . . . . . . . . . . . . . . . . . . . . . . . . . 46
Transfer Setup screen . . . . . . . . . . . . . . . . . . . . . . . . . . . . . . . . . . . . . . . . . . . . . . . . . . . . . . . . . . . . . . . . . . . . . 46
Method for connecting to RCPU . . . . . . . . . . . . . . . . . . . . . . . . . . . . . . . . . . . . . . . . . . . . . . . . . . . . . . . . . . . . . 46
4
7.3
Connecting to QCPU/LCPU . . . . . . . . . . . . . . . . . . . . . . . . . . . . . . . . . . . . . . . . . . . . . . . . . . . . . . . . . . . . . . . 47
Transfer Setup screen . . . . . . . . . . . . . . . . . . . . . . . . . . . . . . . . . . . . . . . . . . . . . . . . . . . . . . . . . . . . . . . . . . . . . 47
Method for connecting to QCPU/LCPU . . . . . . . . . . . . . . . . . . . . . . . . . . . . . . . . . . . . . . . . . . . . . . . . . . . . . . . . 48
7.4
Connecting to Data logger/Data communication . . . . . . . . . . . . . . . . . . . . . . . . . . . . . . . . . . . . . . . . . . . . . . 50
Transfer setup screen . . . . . . . . . . . . . . . . . . . . . . . . . . . . . . . . . . . . . . . . . . . . . . . . . . . . . . . . . . . . . . . . . . . . . 50
Method for connecting to Data logger/Data communication . . . . . . . . . . . . . . . . . . . . . . . . . . . . . . . . . . . . . . . . 50
USING TREND GRAPH FUNCTION
52
8.1
Overview. . . . . . . . . . . . . . . . . . . . . . . . . . . . . . . . . . . . . . . . . . . . . . . . . . . . . . . . . . . . . . . . . . . . . . . . . . . . . . . 52
8.2
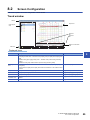
Screen Configuration . . . . . . . . . . . . . . . . . . . . . . . . . . . . . . . . . . . . . . . . . . . . . . . . . . . . . . . . . . . . . . . . . . . . 55
Trend window . . . . . . . . . . . . . . . . . . . . . . . . . . . . . . . . . . . . . . . . . . . . . . . . . . . . . . . . . . . . . . . . . . . . . . . . . . . 55
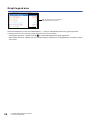
Graph legend area. . . . . . . . . . . . . . . . . . . . . . . . . . . . . . . . . . . . . . . . . . . . . . . . . . . . . . . . . . . . . . . . . . . . . . . . 56
Graph area . . . . . . . . . . . . . . . . . . . . . . . . . . . . . . . . . . . . . . . . . . . . . . . . . . . . . . . . . . . . . . . . . . . . . . . . . . . . . 57
Difference information area . . . . . . . . . . . . . . . . . . . . . . . . . . . . . . . . . . . . . . . . . . . . . . . . . . . . . . . . . . . . . . . . . 58
Status bar . . . . . . . . . . . . . . . . . . . . . . . . . . . . . . . . . . . . . . . . . . . . . . . . . . . . . . . . . . . . . . . . . . . . . . . . . . . . . . 59
8.3
Displaying Trend Graph . . . . . . . . . . . . . . . . . . . . . . . . . . . . . . . . . . . . . . . . . . . . . . . . . . . . . . . . . . . . . . . . . . 60
CONTENTS
CHAPTER 8
Displaying logged devices (Historical trend graph) . . . . . . . . . . . . . . . . . . . . . . . . . . . . . . . . . . . . . . . . . . . . . . . 60
Displaying current device status (Realtime trend graph). . . . . . . . . . . . . . . . . . . . . . . . . . . . . . . . . . . . . . . . . . . 61
Displaying current device status (Realtime monitor graph) . . . . . . . . . . . . . . . . . . . . . . . . . . . . . . . . . . . . . . . . . 62
Operating Realtime trend graph/Realtime monitor graph monitoring status . . . . . . . . . . . . . . . . . . . . . . . . . . . . 72
8.4
Checking Data . . . . . . . . . . . . . . . . . . . . . . . . . . . . . . . . . . . . . . . . . . . . . . . . . . . . . . . . . . . . . . . . . . . . . . . . . . 73
Checking and comparing data values/status . . . . . . . . . . . . . . . . . . . . . . . . . . . . . . . . . . . . . . . . . . . . . . . . . . . . 73
Adding/deleting data to/from graph legend area . . . . . . . . . . . . . . . . . . . . . . . . . . . . . . . . . . . . . . . . . . . . . . . . . 75
8.5
Operating Trend Graphs . . . . . . . . . . . . . . . . . . . . . . . . . . . . . . . . . . . . . . . . . . . . . . . . . . . . . . . . . . . . . . . . . . 76
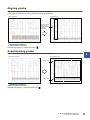
Displaying/hiding graphs . . . . . . . . . . . . . . . . . . . . . . . . . . . . . . . . . . . . . . . . . . . . . . . . . . . . . . . . . . . . . . . . . . . 77
Aligning graphs . . . . . . . . . . . . . . . . . . . . . . . . . . . . . . . . . . . . . . . . . . . . . . . . . . . . . . . . . . . . . . . . . . . . . . . . . . 79
Superimposing graphs. . . . . . . . . . . . . . . . . . . . . . . . . . . . . . . . . . . . . . . . . . . . . . . . . . . . . . . . . . . . . . . . . . . . . 79
Moving cursor by specifying value/time/index . . . . . . . . . . . . . . . . . . . . . . . . . . . . . . . . . . . . . . . . . . . . . . . . . . . 80
Specifying upper/lower limit display value . . . . . . . . . . . . . . . . . . . . . . . . . . . . . . . . . . . . . . . . . . . . . . . . . . . . . . 84
Widening/narrowing the display scale . . . . . . . . . . . . . . . . . . . . . . . . . . . . . . . . . . . . . . . . . . . . . . . . . . . . . . . . . 87
Moving graph up/down/left/right . . . . . . . . . . . . . . . . . . . . . . . . . . . . . . . . . . . . . . . . . . . . . . . . . . . . . . . . . . . . . 87
Expanding/reducing time scale . . . . . . . . . . . . . . . . . . . . . . . . . . . . . . . . . . . . . . . . . . . . . . . . . . . . . . . . . . . . . . 88
Displaying consecutive previous/next trend graph . . . . . . . . . . . . . . . . . . . . . . . . . . . . . . . . . . . . . . . . . . . . . . . 89
8.6
Changing Display Items in Graph Area . . . . . . . . . . . . . . . . . . . . . . . . . . . . . . . . . . . . . . . . . . . . . . . . . . . . . . 94
Displaying multiple cursor . . . . . . . . . . . . . . . . . . . . . . . . . . . . . . . . . . . . . . . . . . . . . . . . . . . . . . . . . . . . . . . . . . 94
Displaying cursor labels. . . . . . . . . . . . . . . . . . . . . . . . . . . . . . . . . . . . . . . . . . . . . . . . . . . . . . . . . . . . . . . . . . . . 95
Displaying data names . . . . . . . . . . . . . . . . . . . . . . . . . . . . . . . . . . . . . . . . . . . . . . . . . . . . . . . . . . . . . . . . . . . . 95
Displaying grid . . . . . . . . . . . . . . . . . . . . . . . . . . . . . . . . . . . . . . . . . . . . . . . . . . . . . . . . . . . . . . . . . . . . . . . . . . . 96
Switching graph plot format . . . . . . . . . . . . . . . . . . . . . . . . . . . . . . . . . . . . . . . . . . . . . . . . . . . . . . . . . . . . . . . . . 96
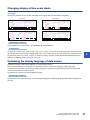
Changing display of time scale labels . . . . . . . . . . . . . . . . . . . . . . . . . . . . . . . . . . . . . . . . . . . . . . . . . . . . . . . . . 97
Optimizing the display language of data names . . . . . . . . . . . . . . . . . . . . . . . . . . . . . . . . . . . . . . . . . . . . . . . . . 97
8.7
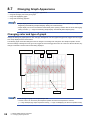
Changing Graph Appearance. . . . . . . . . . . . . . . . . . . . . . . . . . . . . . . . . . . . . . . . . . . . . . . . . . . . . . . . . . . . . . 98
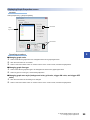
Changing color and type of graph . . . . . . . . . . . . . . . . . . . . . . . . . . . . . . . . . . . . . . . . . . . . . . . . . . . . . . . . . . . . 98
Highlighting graph . . . . . . . . . . . . . . . . . . . . . . . . . . . . . . . . . . . . . . . . . . . . . . . . . . . . . . . . . . . . . . . . . . . . . . . 100
Thickening graph line . . . . . . . . . . . . . . . . . . . . . . . . . . . . . . . . . . . . . . . . . . . . . . . . . . . . . . . . . . . . . . . . . . . . 100
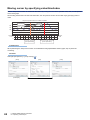
8.8
Registering and Reflecting Graphical Display Settings of Trend Windows . . . . . . . . . . . . . . . . . . . . . . . 101
8.9
Reflecting Graph Display Automatically When Opening File . . . . . . . . . . . . . . . . . . . . . . . . . . . . . . . . . . . 103
8.10
Initializing Graph Display . . . . . . . . . . . . . . . . . . . . . . . . . . . . . . . . . . . . . . . . . . . . . . . . . . . . . . . . . . . . . . . . 103
8.11
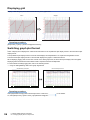
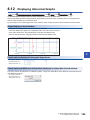
Graph Display for Missing Data or Time Reversed Data . . . . . . . . . . . . . . . . . . . . . . . . . . . . . . . . . . . . . . . 104
8.12
Displaying Abnormal Graphs . . . . . . . . . . . . . . . . . . . . . . . . . . . . . . . . . . . . . . . . . . . . . . . . . . . . . . . . . . . . . 105
5
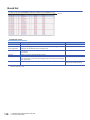
8.13
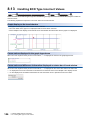
Handling BCD Type Incorrect Values . . . . . . . . . . . . . . . . . . . . . . . . . . . . . . . . . . . . . . . . . . . . . . . . . . . . . . 106
CHAPTER 9
USING EVENT MONITORING FUNCTION
107
9.1
Overview. . . . . . . . . . . . . . . . . . . . . . . . . . . . . . . . . . . . . . . . . . . . . . . . . . . . . . . . . . . . . . . . . . . . . . . . . . . . . . 107
9.2
Screen Configuration . . . . . . . . . . . . . . . . . . . . . . . . . . . . . . . . . . . . . . . . . . . . . . . . . . . . . . . . . . . . . . . . . . . 109
Event window . . . . . . . . . . . . . . . . . . . . . . . . . . . . . . . . . . . . . . . . . . . . . . . . . . . . . . . . . . . . . . . . . . . . . . . . . . 109
Event list . . . . . . . . . . . . . . . . . . . . . . . . . . . . . . . . . . . . . . . . . . . . . . . . . . . . . . . . . . . . . . . . . . . . . . . . . . . . . . 110
Status bar . . . . . . . . . . . . . . . . . . . . . . . . . . . . . . . . . . . . . . . . . . . . . . . . . . . . . . . . . . . . . . . . . . . . . . . . . . . . . 111
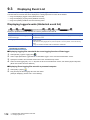
9.3
Displaying Event List . . . . . . . . . . . . . . . . . . . . . . . . . . . . . . . . . . . . . . . . . . . . . . . . . . . . . . . . . . . . . . . . . . . 112
Displaying logged events (Historical event list) . . . . . . . . . . . . . . . . . . . . . . . . . . . . . . . . . . . . . . . . . . . . . . . . . 112
Displaying ongoing events (Realtime event list) . . . . . . . . . . . . . . . . . . . . . . . . . . . . . . . . . . . . . . . . . . . . . . . . 113
Operating Realtime event list monitoring status . . . . . . . . . . . . . . . . . . . . . . . . . . . . . . . . . . . . . . . . . . . . . . . . 113
9.4
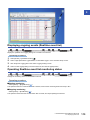
Operating Event List . . . . . . . . . . . . . . . . . . . . . . . . . . . . . . . . . . . . . . . . . . . . . . . . . . . . . . . . . . . . . . . . . . . . 114
Displaying only events that meet specific conditions (Filtering) . . . . . . . . . . . . . . . . . . . . . . . . . . . . . . . . . . . . 114
Sorting events (Sorting). . . . . . . . . . . . . . . . . . . . . . . . . . . . . . . . . . . . . . . . . . . . . . . . . . . . . . . . . . . . . . . . . . . 115
Optimizing the display language of event logging names and comments. . . . . . . . . . . . . . . . . . . . . . . . . . . . . 116
Displaying consecutive previous/next event . . . . . . . . . . . . . . . . . . . . . . . . . . . . . . . . . . . . . . . . . . . . . . . . . . . 117
9.5
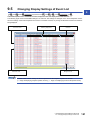
Changing Display Settings of Event List . . . . . . . . . . . . . . . . . . . . . . . . . . . . . . . . . . . . . . . . . . . . . . . . . . . 121
CHAPTER 10 SAVING LOGGING FILES TO PERSONAL COMPUTER
123
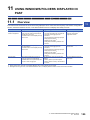
CHAPTER 11 USING WINDOWS/FOLDERS DISPLAYED IN PAST
125
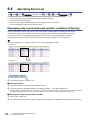
11.1
Overview. . . . . . . . . . . . . . . . . . . . . . . . . . . . . . . . . . . . . . . . . . . . . . . . . . . . . . . . . . . . . . . . . . . . . . . . . . . . . . 125
11.2
Adding/Restoring Frequently-Used Window Configuration to Menu. . . . . . . . . . . . . . . . . . . . . . . . . . . . . 126
11.3
Redisplaying Recently-Used Windows . . . . . . . . . . . . . . . . . . . . . . . . . . . . . . . . . . . . . . . . . . . . . . . . . . . . . 127
11.4
Redisplaying Recently-Used Folders . . . . . . . . . . . . . . . . . . . . . . . . . . . . . . . . . . . . . . . . . . . . . . . . . . . . . . 127
CHAPTER 12 SAVING DISPLAYED DATA/EVENTS
128
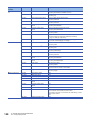
12.1
Save Target Data/Event . . . . . . . . . . . . . . . . . . . . . . . . . . . . . . . . . . . . . . . . . . . . . . . . . . . . . . . . . . . . . . . . . . 128
12.2
Saving Displayed Data . . . . . . . . . . . . . . . . . . . . . . . . . . . . . . . . . . . . . . . . . . . . . . . . . . . . . . . . . . . . . . . . . . 128
Saving displayed data to Unicode text file. . . . . . . . . . . . . . . . . . . . . . . . . . . . . . . . . . . . . . . . . . . . . . . . . . . . . 128
Saving displayed data to CSV file . . . . . . . . . . . . . . . . . . . . . . . . . . . . . . . . . . . . . . . . . . . . . . . . . . . . . . . . . . . 132
Saving displayed trend graphs to image file . . . . . . . . . . . . . . . . . . . . . . . . . . . . . . . . . . . . . . . . . . . . . . . . . . . 144
12.3
Saving Displayed Events . . . . . . . . . . . . . . . . . . . . . . . . . . . . . . . . . . . . . . . . . . . . . . . . . . . . . . . . . . . . . . . . 145
Saving displayed events to CSV file . . . . . . . . . . . . . . . . . . . . . . . . . . . . . . . . . . . . . . . . . . . . . . . . . . . . . . . . . 145
Saving displayed events to image file . . . . . . . . . . . . . . . . . . . . . . . . . . . . . . . . . . . . . . . . . . . . . . . . . . . . . . . . 147
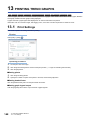
CHAPTER 13 PRINTING TREND GRAPHS
148
13.1
Print Settings . . . . . . . . . . . . . . . . . . . . . . . . . . . . . . . . . . . . . . . . . . . . . . . . . . . . . . . . . . . . . . . . . . . . . . . . . . 148
13.2
Checking Print Preview. . . . . . . . . . . . . . . . . . . . . . . . . . . . . . . . . . . . . . . . . . . . . . . . . . . . . . . . . . . . . . . . . . 149
CHAPTER 14 HELP MENU
14.1
150
Opening Manual. . . . . . . . . . . . . . . . . . . . . . . . . . . . . . . . . . . . . . . . . . . . . . . . . . . . . . . . . . . . . . . . . . . . . . . . 150
14.2
Connecting to MITSUBISHI ELECTRIC FA Global Website . . . . . . . . . . . . . . . . . . . . . . . . . . . . . . . . . . . . . 150
14.3
Version Information. . . . . . . . . . . . . . . . . . . . . . . . . . . . . . . . . . . . . . . . . . . . . . . . . . . . . . . . . . . . . . . . . . . . . 150
CHAPTER 15 TROUBLESHOOTING
152
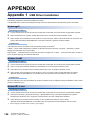
APPENDIX
154
Appendix 1 USB Driver Installation . . . . . . . . . . . . . . . . . . . . . . . . . . . . . . . . . . . . . . . . . . . . . . . . . . . . . . . . . . . . . 154
6
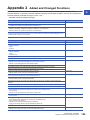
Appendix 2 Added and Changed Functions . . . . . . . . . . . . . . . . . . . . . . . . . . . . . . . . . . . . . . . . . . . . . . . . . . . . . . 155
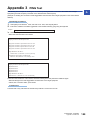
Appendix 3 PING Test . . . . . . . . . . . . . . . . . . . . . . . . . . . . . . . . . . . . . . . . . . . . . . . . . . . . . . . . . . . . . . . . . . . . . . . . 159
INDEX
161
REVISIONS. . . . . . . . . . . . . . . . . . . . . . . . . . . . . . . . . . . . . . . . . . . . . . . . . . . . . . . . . . . . . . . . . . . . . . . . . . . . .163
CONTENTS
TRADEMARKS . . . . . . . . . . . . . . . . . . . . . . . . . . . . . . . . . . . . . . . . . . . . . . . . . . . . . . . . . . . . . . . . . . . . . . . . . .164
7
RELEVANT MANUAL
Manual name [manual number]
Description
Available form
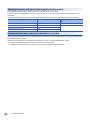
GX LogViewer Version 1 Operating Manual
[SH-080915ENG] (this manual)
Explains the system configuration, functions, and operating methods of
GX LogViewer.
Print book
e-Manual
EPUB
PDF
e-Manual refers to the Mitsubishi FA electronic book manuals that can be browsed using a dedicated tool.
e-Manual has the following features:
• Required information can be cross-searched in multiple manuals.
• Other manuals can be accessed from the links in the manual.
• The hardware specifications of each part can be found from the product figures.
• Pages that users often browse can be bookmarked.
8
TERMS
Unless otherwise specified, this manual uses the following terms.
Term
Description
Analog module
A generic term for MELSEC iQ-R series analog module, MELSEC-Q series analog module, and MELSEC-L
series analog module
ATA card
An abbreviation for AT Attachment card
A generic term for Q2MEM-8MBA, Q2MEM-16MBA, and Q2MEM-32MBA
This memory card is required for the logging function of MELSEC-Q series analog module.
Binary file
A file which is in non-text format and can be interpreted correctly only with the dedicated tools such as GX
LogViewer
BOX Data Logger
A generic term for NZ2DL BOX Data Logger
CompactFlash card
A storage card regulated by the "CF+ and CompactFlash Specification" issued by the CompactFlash Association
This memory card is required for operating High Speed Data Logger Module and BOX Data Logger.
Configuration tool
A generic term for CPU Module Logging Configuration Tool, High Speed Data Logger Module Configuration Tool,
BOX Data Logger Configuration Tool, and High Speed Data Communication Module Configuration Tool
CPU module
A generic term for RCPU, QnUDVCPU, and LCPU
CPU Module Logging Configuration Tool
A tool to configure the respective settings required for the logging function or operation of RCPU, QnUDVCPU,
and LCPU
CSV file
An abbreviation for Comma Separated Values, which is a text file that consists of comma-delimited data
CSV file in GX LogViewer format
A generic term for data saved with Energy Measuring Unit, sampling trace data, a simulation result saved with
FLEXIBLE HIGH-SPEED I/O CONTROL Module Configuration tool.
Data communication
Another term for High Speed Data Communication Module
Data logger
A generic term for High Speed Data Logger Module and BOX Data Logger
Data logging file
A file in which data sampled by a module is saved in the specified format
Energy Measuring Unit
An abbreviation for Logging Unit for Energy Measuring Unit (EcoMonitorLight) (EMU4-LM)
Event logging file
A file in which events sampled by High Speed Data Logger Module or BOX Data Logger are saved in the
specified format
FLEXIBLE HIGH-SPEED I/O CONTROL
Module Configuration tool
A Configuration tool for MELSEC-L series Flexible High Speed I/O Control Module (LD40PD01).
GX LogViewer
A generic product name for SWnDNN-VIEWER ("n" indicates version.)
GX Works2
A generic product name for SWnDNC-GXW2-E ("n" indicates version.)
High Speed Data Communication Module
An abbreviation for MELSEC-Q series High Speed Data Communication Module (QJ71DC96)
High Speed Data Logger Module
An abbreviation for MELSEC-Q series High Speed Data Logger Module (QD81DL96)
Index
A sequential number which is assigned to logging data/monitoring data individually
LCPU
A generic term for L02CPU, L02CPU-P, L06CPU, L06CPU-P, L26CPU, L26CPU-P, L26CPU-BT, and L26CPUPBT
Logging file
A generic term for Data logging file and Event logging file
MELSEC iQ-R series analog module
A generic term for MELSEC iQ-R series analog module (R60AD4, R60ADV8, R60ADI8, R60AD8-G, R60AD16G, R60RD8-G, and R60TD8-G)
MELSEC-L series analog module
A generic term for MELSEC-L series Analog-Digital Converter Module (L60AD4, and L60AD4-2GH) and
MELSEC-L series Analog Input/Output Module (L60AD2DA2)
MELSEC-Q series analog module
A generic term for MELSEC-Q series High Speed Analog-Digital Converter Module (Q64ADH) and MELSEC-Q
series Current Transformer Input Module (Q68CT)
Memory card
A generic term for SD memory card, CompactFlash card, and ATA card
Module
A generic term for connectable modules with GX LogViewer (RCPU, QnUDVCPU, LCPU, High Speed Data
Logger Module, BOX Data Logger, High Speed Data Communication Module, MELSEC iQ-R series analog
module, MELSEC-Q series analog module, MELSEC-L series analog module).
OpenGL
An application programming interface (API) for 2D/3D graphics applications.
Personal computer
A generic term for personal computer on which Windows operates
Plot
Each single point of data sampled by a module when displayed on a trend graph
QCPU
A generic term for Q00JCPU, Q00UJCPU, Q00CPU, Q00UCPU, Q01CPU, Q01UCPU, Q02CPU, Q02HCPU,
Q02PHCPU, Q02UCPU, Q03UDCPU, Q03UDECPU, Q03UDVCPU, Q04UDHCPU, Q04UDEHCPU,
Q04UDVCPU, Q04UDPVCPU, Q06HCPU, Q06PHCPU, Q06UDHCPU, Q06UDEHCPU, Q06UDVCPU,
Q06UDPVCPU, Q10UDHCPU, Q10UDEHCPU, Q12HCPU, Q12PHCPU, Q12PRHCPU, Q13UDHCPU,
Q13UDEHCPU, Q13UDVCPU, Q13UDPVCPU, Q20UDHCPU, Q20UDEHCPU, Q25HCPU, Q25PHCPU,
Q25PRHCPU, Q26UDHCPU, Q26UDEHCPU, Q26UDVCPU, Q26UDPVCPU, Q50UDEHCPU, and
Q100UDEHCPU
QnUDVCPU
A generic term for Q03UDVCPU, Q04UDVCPU, Q06UDVCPU, Q13UDVCPU and Q26UDVCPU
9
Term
Description
RCPU
A generic term for R04CPU, R04ENCPU, R08CPU, R08PCPU, R08SFCPU, R08ENCPU, R16CPU, R16PCPU,
R16SFCPU, R16ENCPU, R32CPU, R32PCPU, R32SFCPU, R32ENCPU, R120CPU, R120PCPU,
R120SFCPU, and R120ENCPU
RnENCPU
A generic term for R04ENCPU, R08ENCPU, R16ENCPU, R32ENCPU, and R120ENCPU
RnPCPU
A generic term for R08PCPU, R16PCPU, R32PCPU, and R120PCPU
RnSFCPU
A generic term for R08SFCPU, R16SFCPU, R32SFCPU, and R120SFCPU
SD memory card
An abbreviation for Secure Digital Memory Card, which is a memory device configured by flash memory
A memory card required for the logging function of RCPU, QnUDVCPU, LCPU, MELSEC iQ-R series analog
module, Q series analog module, L series analog module, and Energy Measuring Unit
Unicode text file
A text file which consists of tab-delimited data
URL
An abbreviation for Uniform Resource Locator
A method to describe the location of information resources including documents and images on the Internet
Windows Vista
A generic term for Microsoft Windows Vista Ultimate Operating System (English),
Microsoft Windows Vista Home Premium Operating System (English),
Microsoft Windows Vista Home Basic Operating System (English),
Microsoft Windows Vista Business Operating System (English),
and Microsoft Windows Vista Enterprise Operating System (English)
Windows Vista or later
A generic term for Windows Vista, Windows 7, Windows 8, and Windows 8.1
Windows 7
A generic term for Microsoft Windows 7 Starter Operating System (English),
Microsoft Windows 7 Home Premium Operating System (English),
Microsoft Windows 7 Professional Operating System (English),
Microsoft Windows 7 Ultimate Operating System (English),
and Microsoft Windows 7 Enterprise Operating System (English)
Windows 7 or later
A generic term for Windows 7, Windows 8, and Windows 8.1
Windows 8
A generic term for Microsoft Windows 8 Operating System (English),
Microsoft Windows 8 Pro Operating System (English),
and Microsoft Windows 8 Enterprise Operating System (English)
Windows 8.1
A generic term for Microsoft Windows 8.1 Operating System (English),
Microsoft Windows 8.1 Pro Operating System (English),
and Microsoft Windows 8.1 Enterprise Operating System (English)
Windows XP
A generic term for Microsoft Windows XP Professional Operating System (English),
and Microsoft Windows XP Home Edition Operating System (English)
Definitions of icon
RCPU
R Analog
QnUDVCPU
High Speed Data Logger
High Speed Data Communication
Q Analog
LCPU
L Analog
BOX Data Logger
Others
The above icons indicate the target modules and data for operating explanation in this manual.
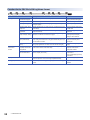
Icon
10
Target modules and data for operating explanation
RCPU
RCPU
R Analog
MELSEC iQ-R series analog module
QnUDVCPU
QnUDVCPU
High Speed Data Logger
High Speed Data Logger Module
High Speed Data Communication
High Speed Data Communication Module
Q Analog
MELSEC-Q series analog module
LCPU
LCPU
L Analog
MELSEC-L series analog module
BOX Data Logger
BOX Data Logger
Others
CSV file in GX LogViewer format
• Data saved with Energy Measuring Unit
• Sampling trace data
• Simulation result saved with FLEXIBLE HIGH-SPEED I/O CONTROL Module Configuration tool.
1
RCPU
OVERVIEW
R Analog
1.1
QnUDVCPU
High Speed Data Logger
1
High Speed Data Communication
LCPU
Q Analog
L Analog
BOX Data Logger
Others
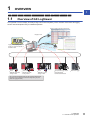
Overview of GX LogViewer
GX LogViewer is a tool to display and analyze large-volume data sampled by various modules which feature the logging
function with the simple and easy-to-understand operation.
Display the logging results with graphs and lists
Display events
Display data
Logging files, sampling trace data
saved to a personal computer, or
simulation result
RCPU
QnUDVCPU
LCPU
High Speed Data Logger Module
MELSEC iQ-R series
analog module
MELSEC-Q series
analog module
MELSEC-L series
analog module
High Speed Data
Communication Module
BOX Data Logger
The connection destination setting can be performed with the same
operation as the Configuration tool and the Engineering tool, and
check the logging file easily.
1 OVERVIEW
1.1 Overview of GX LogViewer
11
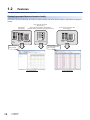
1.2
Features
This section explains features of GX LogViewer.
Displaying sampled data and events visually
Data check is performed efficiently since data and events sampled and saved with the module or GX Works2 are displayed
visually.
Data saved with GX Works2
(Sampling trace)
Sampled data
(Data logging)
Data saved with FLEXIBLE HIGH-SPEED I/O
CONTROL Module Configuration tool (Simulation result)
:
:
Unicode
text
format
:
:
CSV
format
:
Binary format
CSV format
(GX LogViewer format)
Open
:
Binary format
Open
History of event
occurrences/restorations
can be checked.
Trend graph display
1 OVERVIEW
1.2 Features
CSV
format
Open
Data shift can be
easily checked.
12
Event occurrence/restoration data
(Event logging)
Event monitor display
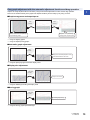
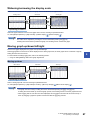
Easy graph adjustment with the automatic adjustment function and drag operation
1
Graphs are easily adjusted without manuals by using the automatic adjustment function and the drag operation.
Data can be checked instantly since graphs are adjusted intuitively and smoothly by only using a mouse.
■Graph arrangement and superimpose
Click
a button
Click
a button
Multiple data can be compared by
Graphs are easily viewable by
superimposing graphs.
arranging them at equal spaces.
Page 79 Aligning graphs
Page 79 Superimposing graphs
■Automatic graph adjustment
Click
a button
Display size is automatically adjusted according
to the maximum/minimum value of data.
Page 84 Specifying upper/lower limit display value
■Display size adjustment
Drag with
a mouse
Enlarge the error location.
Page 87 Widening/narrowing the display scale
■Moving graph
Drag with
a mouse
Position graphs freely.
Page 87 Moving graph up/down/left/right
1 OVERVIEW
1.2 Features
13
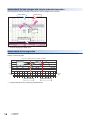
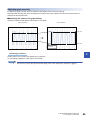
Instant check for data changes with easy-to-understand operation
Data changes are instantly checked by using the two cursors (multiple cursor function).
Cursor B (blue)
Cursor A (red)
Data shift can be
viewed at a
glance.
The shift in value and
time between the cursors
can be instantly checked.
Page 94 Displaying multiple cursor
Instant check for the target data
Data values are instantly checked by using the Jump cursor function to jump a cursor to the specified value/time/index
position on the trend graph.
Jump to the position where the condition is satisfied.
[Value search]
Condition search
Value
400
400
300
200
7/7/2014,
14:50
11
7/7/2014,
15:06
27
[Time specification]
[Index specification]
Page 80 Moving cursor by specifying value/time/index
14
1 OVERVIEW
1.2 Features
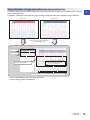
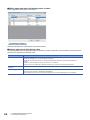
Easy confirmation of logging data differences among multiple files
1
By displaying logging data stored in the multiple files on the same graph area, the difference of each data can be confirmed
with the same time interval.
Furthermore, superimposing the graphs with simple operation enables the easier data comparison among multiple files.
Data of File B
Data of File A
Display the logging data of multiple files
on the same graph area.
Data of File A
Data of File B
Superimposing the graphs enables
the easier data comparison!
The file can be moved on a per file basis
by dragging and dropping the graph to
upward/downward/left/right with the
key + mouse operation!
The difference of each data can be confirmed with the same time interval.
Page 75 Adding/deleting data to/from graph legend area
Page 87 Moving graph up/down/left/right
1 OVERVIEW
1.2 Features
15
2
SYSTEM CONFIGURATION
This chapter explains the operating environment and the system configuration of GX LogViewer.
2.1
Operating Environment
For details of the GX LogViewer operating environment, refer to the installation instructions stored in the "Manual" folder.
CPU Module Logging Configuration Tool/GX LogViewer Installation Instructions (BCN-P5999-0506)
2.2
RCPU
System Configuration
R Analog
QnUDVCPU
High Speed Data Logger
High Speed Data Communication
LCPU
Q Analog
L Analog
BOX Data Logger
Others
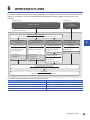
This section explains the system configuration to display data logged by respective modules on GX LogViewer.
Item
Reference
System
configuration
Page 16 Displaying data logged by RCPU on GX LogViewer
Page 18 Displaying data logged by QnUDVCPU/LCPU on GX LogViewer
Page 19 Displaying data logged by Analog module on GX LogViewer
Page 22 Displaying data logged by Data logger/Data communication on GX LogViewer
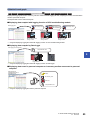
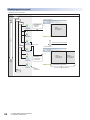
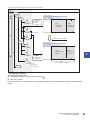
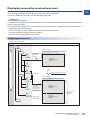
Displaying data logged by RCPU on GX LogViewer
RCPU
R Analog
QnUDVCPU
High Speed Data Logger
High Speed Data Communication
Q Analog
LCPU
L Analog
BOX Data Logger
Others
The system configuration to display data logged by RCPU on GX LogViewer is shown below.
The connectable route is the same as the connection with CPU Module Logging Configuration Tool.
Connection from USB
SD memory card
(Required, Sold separately)
Connection from Ethernet port
RCPU
GX LogViewer
Obtain the data from RCPU, and display it.
USB/Ethernet
Display personal computer
RCPU and a personal computer can be connected with the following communication route.
Item
Reference
Type of communication route
Page 17 Connection from USB port
Page 17 Connection from Ethernet port
For details on the considerations when connecting to RCPU using a USB or an Ethernet, refer to the following
section.
Page 24 Considerations for connection
16
2 SYSTEM CONFIGURATION
2.1 Operating Environment
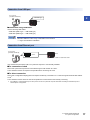
Connection from USB port
GX LogViewer
(SW1DNN-VIEWER-M)
2
USB miniB type
RCPU
■Connection using USB cable
Use the following USB cables:
• USB cable (USB A type USB miniB type)
• USB cable (USB B type USB miniB type)
Install the USB driver when using a USB cable for the first time.
Page 154 USB Driver Installation
Connection from Ethernet port
GX LogViewer
(SW1DNN-VIEWER-M)
+ Driver
RCPU
Programmable controller on host/another station
Use an Ethernet board that is built-in to a personal computer or commercially available.
■For connection via hub
RCPU and a personal computer are connected through a local network via a hub*1.
The IP address of RCPU is required to be specified when connecting via a hub.
■For direct connection
RCPU and a configuration/display personal computer are directly connected on a 1:1 basis through an Ethernet cable without
a hub*1.
The IP address of RCPU does not need to be specified for communication when directly connecting.
*1
For RnENCPU, use the Ethernet port of CPU part to connect to a personal computer. Note that connecting from Ethernet ports of
network part is not supported.
2 SYSTEM CONFIGURATION
2.2 System Configuration
17
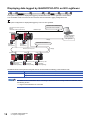
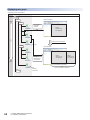
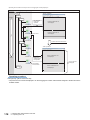
Displaying data logged by QnUDVCPU/LCPU on GX LogViewer
RCPU
R Analog
QnUDVCPU
High Speed Data Logger
High Speed Data Communication
Q Analog
LCPU
L Analog
BOX Data Logger
Others
The system configuration to display data logged by QnUDVCPU/LCPU on GX LogViewer is shown below.
The connectable route is the same as the connection with CPU Module Logging Configuration Tool.
Ex.
The system configuration to display data logged by LCPU on GX LogViewer
Connection from USB/serial port
Connected to LCPU to perform
logging
via another station QnUDVCPU.
USB/serial port
QnUDVCPU
CC-Link/Ethernet/CC-Link IE Field Network
Connection from I/F boards
LCPU
Configuration/display
personal computer
GX LogViewer
Display
SD memory card
(Required,
Sold separately)
SD memory card
(Required,
Sold separately)
Connection via network
Display
Ethernet, CC-Link, C24
QnUDVCPU
LCPU
SD memory card
(Required,
Sold separately)
SD memory card
(Required,
Sold separately)
LCPU
SD memory card
(Required,
Sold separately)
QnUDVCPU/LCPU and a personal computer can be connected with the following communication route.
Item
Reference
Type of communication route
Page 20 Connection from USB/serial port(Connection via network)
Page 21 Connection from I/F boards
For details on the considerations when connecting to QnUDVCPU/LCPU using a USB or an Ethernet, refer to
the following section.
Page 24 Considerations for connection
18
2 SYSTEM CONFIGURATION
2.2 System Configuration
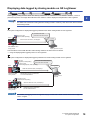
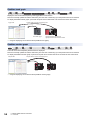
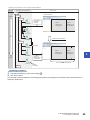
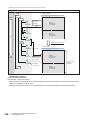
Displaying data logged by Analog module on GX LogViewer
RCPU
QnUDVCPU
R Analog
High Speed Data Logger
High Speed Data Communication
LCPU
Q Analog
L Analog
BOX Data Logger
Others
Data logged by Analog module is saved in a memory card inserted in RCPU/QCPU/LCPU module. Therefore, connect a
2
personal computer to each target RCPU/QCPU/LCPU module in order to display the sampled data on GX LogViewer.
For details on the methods of saving data from Analog module to a memory card, refer to the user's manual of
each analog module.
Ex.
The system configuration to display data logged by MELSEC iQ-R series analog module on GX LogViewer
Connection from USB
SD memory card
(Required, Sold separately)
Connection from Ethernet port
RCPU
GX LogViewer
Obtain the data from RCPU, and display it.
Save
data
USB/Ethernet
MELSEC iQ-R series
analog module
Display personal computer
Communication route for MELSEC iQ-R series analog module is the same as that for RCPU.
Page 16 Displaying data logged by RCPU on GX LogViewer
Ex.
The system configuration to display data logged by MELSEC-Q/L series analog module on GX LogViewer
ATA card
(Required, Sold separately)
Connection from USB/serial port
Connection from I/F boards
SD memory card
(QnUDVCPU)(Required, Sold separately)
QCPU
GX LogViewer
Obtain the data from QCPU, and display it.
ta
da
Save
MELSEC-Q series
analog module
USB/serial port/CC-Link IE Controller Network/
MELSECNET/H(10)/CC-Link/Ethernet/
CC-Link IE Field Network
Display personal
computer
SD memory card
(Required, Sold separately)
LCPU
Obtain the data from LCPU, and display it.
Save
data
MELSEC-L series
analog module
USB/serial port/CC-Link/Ethernet/
CC-Link IE Field Network
For L60AD4, the logging function is supported only by modules with a serial number whose first five digits are
'13041' or higher.
2 SYSTEM CONFIGURATION
2.2 System Configuration
19
Connection from USB/serial port
The system configuration connectable from the USB/serial port of a personal computer is shown below.
USB communication
USB cable
or
QCPU
LCPU
QC30R2
Serial port direct connection
or
Converter/Cable
QCPU
LCPU
+RS-232 adaptor
Serial communication link
GX LogViewer
(SW1DNN-VIEWER-M)
RS-232 cable
Via computer link
or
Converter/Cable
C24
QCPU
LCPU
CC-Link network
USB port
or
serial port
Via CC-Link (G4)
Converter/Cable
or
G4 module
G4-S3 module
Configuration/display personal computer
QCPU
LCPU
Via modem
Cable attached to modem
Modem
Serial communication link
Cable attached to modem
Modem
or
C24
QCPU
LCPU
Via GOT
Cable
or
GOT
QCPU
LCPU
■Connection using USB cable
Use the following USB cables:
• USB cable (USB A type USB miniB type)
• USB cable (USB B type USB miniB type)
• Install the USB driver when using a USB cable for the first time.
Page 154 USB Driver Installation
• For the methods of checking the COM port number when connecting a personal computer to QCPU/LCPU
by using a cable such as USB/RS-232 conversion cable, refer to the manual for each cable.
20
2 SYSTEM CONFIGURATION
2.2 System Configuration
■Connection using RS-232 cable
The following table shows the RS-232 cable whose operation have been confirmed by Mitsubishi Electric.
Model name
QC30R2 (Personal computer connector: 9-pin D-sub connector)
Mitsubishi Electric Corporation RS-232 cable
2
Precautions
• For high-speed communication (transmission speed: 115.2/57.6kbps), use a personal computer supporting high-speed
communication.
• When a communication error occurs, retry the communication after reducing the transmission speed setting.
■Connection via GOT
Using the transparent function of GOT enables the access to QCPU/LCPU via GOT.
For details, refer to the following manuals:
Connection Manual of GOT2000 Series
Connection from I/F boards
The system configuration to connect QCPU/LCPU using an I/F board mounted on a personal computer is shown below.
I/F board for MELSEC personal
computer
GX LogViewer
(SW1DNN-VIEWER-M)
(Other station)
and driver
General-purpose I/F board
(Other station)
or
QCPU
LCPU
(Host station or other station)
(Host station or other station)
or
and driver
QCPU
LCPU
I/F board name
I/F board for MELSEC
personal computer
MELSECNET/H board
CC-Link IE Controller Network board
CC-Link IE Field Network board
CC-Link Ver.1 board
CC-Link Ver.2 board
General-purpose I/F board
Ethernet board
For more details on connectable QCPUs/LCPUs, I/F board models, and drivers, refer to the manual of each I/F board.
• The TCP connection is recommended for the Ethernet connection.
• Longer time is required for processes to open or save a logging file to the personal computer when using
the Ethernet direct connection or the UDP connection.
2 SYSTEM CONFIGURATION
2.2 System Configuration
21
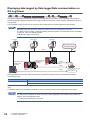
Displaying data logged by Data logger/Data communication on
GX LogViewer
RCPU
R Analog
QnUDVCPU
High Speed Data Logger
High Speed Data Communication
Q Analog
LCPU
L Analog
BOX Data Logger
Others
The system configuration to display data logged by Data logger/Data communication on GX LogViewer is shown below.
Connect a personal computer to respective Data logger or Data communication in order to display data logged by those on
GX LogViewer.
The connectable route is the same as the connection with Configuration tool of Data logger/Data communication.
BOX Data Logger has three ports: serial port, Ethernet port (CH1), and Ethernet port (CH2).
For details on CPU modules, configuration/display personal computers, and respective servers connectable
to each port, refer to the following manual.
BOX Data Logger User's Manual
FTP server
SNTP server
Mail server
For a connection via a hub
For a direct connection
Ethernet
CompactFlash card
(Required, Sold
separately)
CompactFlash card
(Required, Sold
separately)
High Speed Data Logger
Module
Display
High Speed Data Communication
Module
Display
Display personal computer
Display
GX LogViewer
BOX Data Logger
Data logger/Data communication and an Ethernet port of a personal computer can be connected with the following
communication route.
Item
Reference
Type of communication route
Page 23 For connection via hub
Page 23 For direct connection
Ethernet (twisted pair) cables (sold separately) that conform to the standard of IEEE802.3, 10BASE-T/100BASE-TX can be
used.
For details on Ethernet communication specifications, refer to the user's manual of Data logger/Data communication.
For details on the considerations when connecting to Data logger/Data communication using a USB or an
Ethernet, refer to the following section.
Page 24 Considerations for connection
22
2 SYSTEM CONFIGURATION
2.2 System Configuration
Connection from Ethernet port
■For connection via hub
Data logger/Data communication and a personal computer are connected through a local network via a hub.
When connecting via a hub, the IP address of Data logger/Data communication is required to be specified.
2
Ex.
Connecting via a hub using High Speed Data Logger Module
Twisted pair cable
Server personal computer
Ethernet
Hub
High Speed Data Logger Module
Configuration/display personal computer
■For direct connection
Data logger/Data communication and a configuration/display personal computer are directly connected on a 1:1 basis through
an Ethernet cable (crossing cable) without a hub.
The IP address of Data logger/Data communication does not need to be specified for communication when directly
connecting. (The broadcast is used for communication.)
A straight cable can be used for BOX Data Logger.
2 SYSTEM CONFIGURATION
2.2 System Configuration
23
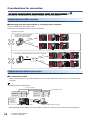
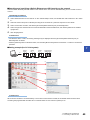
Considerations for connection
RCPU
QnUDVCPU
R Analog
High Speed Data Communication
High Speed Data Logger
Q Analog
LCPU
L Analog
BOX Data Logger
Others
The following are considerations for connecting to a module using a USB or an Ethernet.
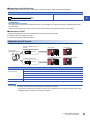
Considerations for USB connection
Pay attention to the following when connecting a personal computer and a module using a USB.
■Connecting more than one modules to a single personal computer
Only one module can be connected at a time.
Connection in the configurations below cannot be performed.
<Inapplicable configuration>
Connection to several programmable
controller CPUs from the personal
computer with several USB ports
USB
cable
USB
cab
RCPU
or QCPU
or LCPU
RCPU
or QCPU
or LCPU
le
Connection to several programmable controller CPUs via USB hub
USB c
USB
cable
USB
hub
US
able
Bc
abl
RCPU
or QCPU
or LCPU
RCPU
or QCPU
or LCPU
e
Considerations for Ethernet connection
Pay attention to the following when connecting a personal computer and a module using Ethernet.
■For connection via hub
• Set the network settings on a personal computer so that its network address is the same as the one of a module to be
connected.
Ex.
For High Speed Data Logger Module
Set the same values
Set the different values.
Network portion
Host portion
Network portion
Host portion
192.168. 3.
3
192.168. 3.
1
255.255.255.
0
255.255.255.
0
Factory setting
IP address :
192.168.3.3
Subnet mask :
255.255.255.0
Ethernet
Hub
High Speed Data Logger Module
Configuration/display personal computer
• Data logger/Data communication can be connected only using LAN. Connection via the Internet cannot be performed.
24
2 SYSTEM CONFIGURATION
2.2 System Configuration
■For direct connection
• Connections which are not direct connection
Direct connection setup cannot be performed in a configuration where a single Data logger/Data communication and a
single personal computer are connected to a hub as shown in the following figure.
Ex.
2
For High Speed Data Logger Module
Ethernet
Hub
High Speed Data Logger Module
Configuration/display personal computer
• Conditions where communication cannot be accomplished with direct connection
If the conditions below match, communications may not be performed with direct connection. If communications cannot be
performed, review the module and personal computer settings.
Ex.
When all the bits of the module-side IP address corresponding to the '0' parts of the personal computer-side subnetmask are
ON or OFF
• Module IP address: 64. 64. 255. 255
• Personal computer IP address: 64. 64. 1. 1
• Personal computer subnet mask: 255. 255. 0. 0
Ex.
When all the bits of the module-side IP address corresponding to the host address of each class for the personal computerside IP address are ON or OFF
• Module IP address: 64. 64. 255. 255
• Personal computer IP address: 192. 168. 0. 1
• Personal computer subnet mask: 255. 255. 0. 0
■IP addresses of each class are as follows:
• ClassA: 0. x. x. x to 127. x. x. x
• ClassB: 128. x. x. x to 191. x. x. x
• ClassC: 192. x. x. x to 223. x. x. x
■Host addresses of each class are the '0' parts below.
• ClassA: 255. 0. 0. 0
• ClassB: 255. 255. 0. 0
• ClassC: 255. 255. 255. 0
Ex.
When the Module-side IP address is automatically acquired from DHCP
• LAN line and connection
Do not perform communication with direct connection by connecting LAN line. Communication with direct connection
overloads the line, and affects any communication of other devices.
• Direct connection to BOX Data Logger
Connect the Ethernet cable to the Ethernet port (CH1) when connecting BOX Data Logger and a configuration/display
personal computer directly. Ethernet port (CH2) cannot be used to connect directly.
Connected to Ethernet port (CH1)
Ethernet
Twisted pair cable (crossing cable/straight cable)
BOX Data Logger
Configuration/display personal computer
2 SYSTEM CONFIGURATION
2.2 System Configuration
25
■When the Windows firewall setting is enabled
Disable the Windows firewall setting.
■When multiple IP addresses are enabled
Direct connection setup cannot be performed in a configuration where multiple IP addresses are enabled at the same time as
shown below.
• An IP address is assigned to each of multiple Ethernet ports (network devices) of a personal computer
• Aside from the Ethernet port of a personal computer, a wireless LAN setting is enabled
• Multiple IP addresses are assigned to one Ethernet port of a personal computer
Considerations for realtime monitor connection
Pay attention to the following when connecting a personal computer and a module.
■For connection including Ethernet in the communication route
The UDP connection is not available, except for the direct connection. Use the TCP connection.
26
2 SYSTEM CONFIGURATION
2.2 System Configuration
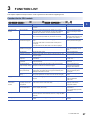
3
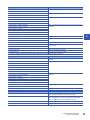
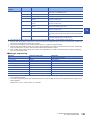
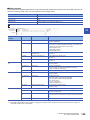
FUNCTION LIST
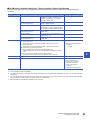
This chapter explains the major functions of GX LogViewer and the modules supporting those.
Function list for CPU module
RCPU
R Analog
QnUDVCPU
High Speed Data Logger
High Speed Data Communication
Q Analog
LCPU
L Analog
BOX Data Logger
Others
Item
Description
Reference
Assistant function
A function to guide users unfamiliar with the operation of GX
LogViewer.
Page 35 Assistant Screen
Direct connection
Connects a personal computer to CPU module on a 1:1 basis.
They can be easily connected without concerning the IP address
(available only for Ethernet connection and USB connection).
Page 46 Connecting to RCPU
Page 47 Connecting to QCPU/
LCPU
Searching modules
Searches for and connects to Built-in Ethernet port QnUDVCPU/
LCPU on the network (available only for Ethernet connection).
Page 49 Searching and
specifying a Built-in Ethernet port
CPU module on the network
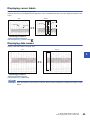
Displaying trend graph
(Historical trend graph)
Displays past data sampled by the data logging function on the trend
graph.
• For RCPU, data saved in Unicode text files or binary files is
displayed.
• For QnUDVCPU/LCPU, data saved in CSV files is displayed.
Page 60 Displaying logged
devices (Historical trend graph)
Displaying trend graph
(Realtime monitor graph)
Displays current data sampled by RCPU/LCPU on the trend graph.
Page 62 Displaying current
device status (Realtime monitor
graph)
Checking data
Checks data using cursors.
Page 73 Checking Data
Operating trend graph
Operates a trend graph (such as aligning, widening/narrowing, and
moving the graph).
Page 76 Operating Trend Graphs
Changing display item in
graph area
Changes display items in a graph area (such as multiple cursors and
cursor labels).
Page 94 Changing Display Items
in Graph Area
Changing graph
appearance
Changes graph appearance (such as color and type of the graph, and
graph line thickness).
Page 98 Changing Graph
Appearance
Registering/reflecting
graphical display settings
Registers the display setting information of the trend graph being
displayed, and reflects it to another trend graph.
Page 101 Registering and
Reflecting Graphical Display
Settings of Trend Windows
Reflecting graphical
display automatically
Stores the graphical display information being displayed by each data
logging setting, and reflects them to the graph automatically when
opening the trend window next time.
Page 103 Reflecting Graph
Display Automatically When
Opening File
Initializing graphical
display
Restores changed graphical display to the initial state (the state in
which graph appearance such as the color has not been changed).
Page 103 Initializing Graph
Display
A function to save logging files saved in a memory card to a personal
computer.
Page 123 SAVING LOGGING
FILES TO PERSONAL
COMPUTER
Adding/restoring
frequently-used window
configurations
Adds window layout and data of the trend window displayed frequently
to the menu in order to restore them easily.
Page 126 Adding/Restoring
Frequently-Used Window
Configuration to Menu
Redisplaying recentlyused windows/folders
Adds windows or folders recently used to the menu automatically in
order to redisplay those easily.
Page 127 Redisplaying RecentlyUsed Windows
Page 127 Redisplaying RecentlyUsed Folders
Displayed data save function
A function to save the data being displayed in the trend graph to a
personal computer as Unicode text file, CSV file, or image file (BMP/
JPG/PNG).
Page 128 Saving Displayed Data
Trend graph print function
A function to print the trend graph being displayed with the trend graph
function.
Page 148 PRINTING TREND
GRAPHS
Connection setup
function
Trend graph function
Logging file save function
Window/
folder restore
function
3 FUNCTION LIST
3
27
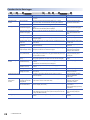
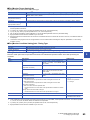
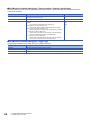
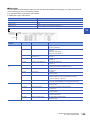
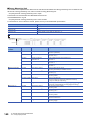
Function list for Data logger
RCPU
R Analog
High Speed Data Logger
High Speed Data Communication
Q Analog
LCPU
L Analog
BOX Data Logger
Others
Item
Description
Reference
Assistant function
A function to guide users unfamiliar with the operation of GX
LogViewer.
Page 35 Assistant Screen
Connects a personal computer to Data logger on a 1:1 basis.
They can be easily connected without concerning the IP address.
Page 50 Connecting to Data
logger/Data communication
Connection setup
function
Direct connection
Searching modules
Searches for and connects to Data logger on the network.
Trend graph function
Displaying trend graph
(Historical trend graph)
Displays past data sampled by the data logging function on the trend
graph.
Data saved in CSV files/binary files is displayed.
Page 60 Displaying logged
devices (Historical trend graph)
Displaying trend graph
(Realtime trend graph)
Displays current data sampled by Data logger on the trend graph.
Page 61 Displaying current
device status (Realtime trend
graph)
Checking data
Checks data using cursors.
Page 73 Checking Data
Operating trend graph
Operates a trend graph (such as aligning, widening/narrowing, and
moving the graph).
Page 76 Operating Trend Graphs
Changing display item in
graph area
Changes display items in a graph area (such as multiple cursors and
cursor labels).
Page 94 Changing Display Items
in Graph Area
Changing graph
appearance
Changes graph appearance (such as color and type of the graph, and
graph line thickness).
Page 98 Changing Graph
Appearance
Registering/reflecting
graphical display settings
Registers the display setting information of the trend graph being
displayed, and reflects it to another trend graph.
Page 101 Registering and
Reflecting Graphical Display
Settings of Trend Windows
Reflecting graphical
display automatically
Stores the graphical display information being displayed by each label
group setting, and reflects them to the graph automatically when open
the trend window next time.
Page 103 Reflecting Graph
Display Automatically When
Opening File
Initializing graphical
display
Restores changed graphical display to the initial state (the state in
which graph appearance such as the color has not been changed).
Page 103 Initializing Graph
Display
Displaying event list
(Historical event list)
Displays past events sampled by the event logging function in an
event list.
Event saved in CSV files/binary files is displayed.
Page 112 Displaying Event List
Displaying event list
(Realtime event list)
Displays ongoing events sampled by the event logging function in an
event list.
Operating event list
Operates an event list (such as sorting and filtering).
Page 114 Operating Event List
Changing display
settings of event list
Customizes the display settings of event list (such as font color and
display items).
Page 121 Changing Display
Settings of Event List
Logging file save function
A function to save logging files saved in the memory card to a
personal computer.
Page 123 SAVING LOGGING
FILES TO PERSONAL
COMPUTER
Window/
folder restore
function
Adding/restoring
frequently-used window
configurations
Adds window layout and data of the trend window displayed frequently
to the menu in order to restore them easily.
Page 126 Adding/Restoring
Frequently-Used Window
Configuration to Menu
Redisplaying recentlyused windows/folders
Adds windows or folders recently used to the menu automatically in
order to redisplay those easily.
Page 127 Redisplaying RecentlyUsed Windows
Page 127 Redisplaying RecentlyUsed Folders
Displayed data/event save function
A function to save the data being displayed in the trend graph and the
events displayed in the event list to a personal computer as CSV file
or image file (BMP/JPG/PNG).
Page 128 Saving Displayed Data
Page 145 Saving Displayed
Events
Trend graph print function
A function to print the trend graph being displayed with the trend graph
function.
Page 148 PRINTING TREND
GRAPHS
Event monitoring
function
28
QnUDVCPU
3 FUNCTION LIST
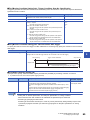
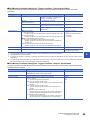
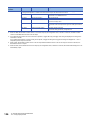
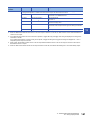
Function list for Data communication
RCPU
R Analog
QnUDVCPU
High Speed Data Logger
High Speed Data Communication
Q Analog
LCPU
L Analog
BOX Data Logger
Others
Item
Description
Reference
Assistant function
A function to guide users unfamiliar with the operation of GX
LogViewer.
Page 35 Assistant Screen
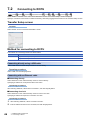
Page 50 Connecting to Data
logger/Data communication
Connection setup
function
Direct connection
Connects a personal computer to Data communication on a 1:1 basis.
They can be easily connected without concerning the IP address.
Searching modules
Searches for and connects to Data communication on the network.
Trend graph function
Displaying trend graph
(Historical trend graph)
Displays saved past data on the trend graph.
Only CSV files in which realtime trend data has been saved are
displayed.
Page 60 Displaying logged
devices (Historical trend graph)
Displaying trend graph
(Realtime trend graph)
Displays current data sampled by Data communication on the trend
graph.
Page 61 Displaying current
device status (Realtime trend
graph)
Checking data
Checks data using cursors.
Page 73 Checking Data
Operating trend graph
Operates a trend graph (such as aligning, widening/narrowing, and
moving the graph).
Page 76 Operating Trend Graphs
Changing display item in
graph area
Changes display items in a graph area (such as multiple cursors and
cursor labels).
Page 94 Changing Display Items
in Graph Area
Changing graph
appearance
Changes graph appearance (such as color and type of the graph, and
graph line thickness).
Page 98 Changing Graph
Appearance
Registering/reflecting
graphical display settings
Registers the display setting information of the trend graph being
displayed, and reflects it to another trend graph.
Page 101 Registering and
Reflecting Graphical Display
Settings of Trend Windows
Reflecting graphical
display automatically
Stores the graphical display information being displayed by each label
group setting, and reflects them to the graph automatically when open
the trend window next time.
Page 103 Reflecting Graph
Display Automatically When
Opening File
Initializing graphical
display
Restores changed graphical display to the initial state (the state in
which graph appearance such as the color has not been changed).
Page 103 Initializing Graph
Display
Adding/restoring
frequently-used window
configurations
Adds window layout and data of the trend window displayed frequently
to the menu in order to restore them easily.
Page 126 Adding/Restoring
Frequently-Used Window
Configuration to Menu
Redisplaying recentlyused windows/folders
Adds windows or folders recently used to the menu automatically in
order to redisplay those easily.
Page 127 Redisplaying RecentlyUsed Windows
Page 127 Redisplaying RecentlyUsed Folders
Displayed data save function
A function to save the data being displayed in the trend graph to a
personal computer as CSV file or image file (BMP/JPG/PNG).
Page 128 Saving Displayed Data
Trend graph print function
A function to print the trend graph being displayed with the trend graph
function.
Page 148 PRINTING TREND
GRAPHS
Window/
folder restore
function
3 FUNCTION LIST
3
29
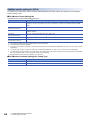
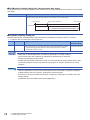
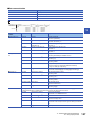
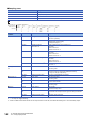
Function list for CSV file in GX LogViewer format
RCPU
R Analog
QnUDVCPU
High Speed Data Logger
Item
Q Analog
LCPU
L Analog
BOX Data Logger
Others
Description
Reference
Displays saved past data on the trend graph.
Page 60 Displaying logged
devices (Historical trend graph)
Checking data
Checks data using cursors.
Page 73 Checking Data
Operating trend graph
Operates a trend graph (such as aligning, widening/narrowing, and
moving the graph).
Page 76 Operating Trend Graphs
Changing display item in
graph area
Changes display items in a graph area (such as multiple cursors and
cursor labels).
Page 94 Changing Display Items
in Graph Area
Changing graph
appearance
Changes graph appearance (such as color and type of the graph, and
graph line thickness).
Page 98 Changing Graph
Appearance
Registering/reflecting
graphical display settings
Registers the display setting information of the trend graph being
displayed, and reflects it to another trend graph.
Page 101 Registering and
Reflecting Graphical Display
Settings of Trend Windows
Reflecting graphical
display automatically
Stores the graphical display information being displayed by each label
group setting, and reflects them to the graph automatically when open
the trend window next time.
Page 103 Reflecting Graph
Display Automatically When
Opening File
Initializing graphical
display
Restores changed graphical display to the initial state (the state in
which graph appearance such as the color has not been changed).
Page 103 Initializing Graph
Display
Adding/restoring
frequently-used window
configurations
Adds window layout and data of the trend window displayed frequently
to the menu in order to restore them easily.
Page 126 Adding/Restoring
Frequently-Used Window
Configuration to Menu
Redisplaying recentlyused windows/folders
Adds windows or folders recently used to the menu automatically in
order to redisplay those easily.
Page 127 Redisplaying RecentlyUsed Windows
Page 127 Redisplaying RecentlyUsed Folders
Displayed data save function
A function to save the data being displayed in the trend graph to a
personal computer as CSV file or image file (BMP/JPG/PNG).
Page 128 Saving Displayed Data
Trend graph print function
A function to print the trend graph being displayed with the trend graph
function.
Page 148 PRINTING TREND
GRAPHS
Trend graph function
Window/
folder restore
function
30
High Speed Data Communication
Displaying trend graph
(Historical trend graph)
3 FUNCTION LIST
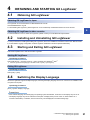
4
4.1
OBTAINING AND STARTING GX LogViewer
Obtaining GX LogViewer
Obtaining GX LogViewer in Japan
GX LogViewer can be downloaded from Mitsubishi Electric FA site.
www.MitsubishiElectric.co.jp/fa
For downloading GX LogViewer, please register for a free membership on Mitsubishi Electric FA site in advance.
4
Obtaining GX LogViewer in other countries
For the information on how to obtain GX LogViewer, please consult your local Mitsubishi representative.
4.2
Installing and Uninstalling GX LogViewer
For the procedures for installing/uninstalling GX LogViewer, refer to the installation instructions stored in the "Manual" folder.
CPU Module Logging Configuration Tool/GX LogViewer Installation Instructions (BCN-P5999-0506)
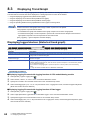
4.3
Starting and Exiting GX LogViewer
This section explains how to start and exit GX LogViewer.
Starting GX LogViewer
Operating procedure
Select [MELSOFT] [Logging Function] [GX LogViewer] from Windows Start*1.
*1
Start GX LogViewer from [All apps] on the Start screen or [Start] [All Programs].
Exiting GX LogViewer
Operating procedure
Select [File] [Exit].
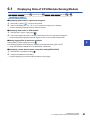
4.4
Switching the Display Language
Since GX LogViewer supports multiple languages, switching the display language such as on a menu bar is available on the
one personal computer.
Operating procedure
[View] [Switch Display Language]
Precautions
• If the selected language and the language of operating system are different, characters on the display may be cut off.
• The display language may not be switched in some parts of display items (such as "Host" or "Other station" for a
connection destination). In addition, window names may not be displayed in the selected language.
4 OBTAINING AND STARTING GX LogViewer
4.1 Obtaining GX LogViewer
31
MEMO
32
4 OBTAINING AND STARTING GX LogViewer
4.4 Switching the Display Language
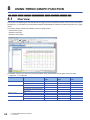
5
5.1
SCREEN CONFIGURATION
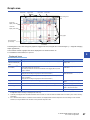
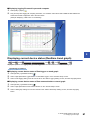
Main Window
The following figure shows the main window configuration of GX LogViewer.
Menu bar
Toolbar
Main window
5
Only one main window can be displayed on the desktop since multiple GX LogViewer cannot be activated.
5 SCREEN CONFIGURATION
5.1 Main Window
33
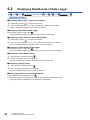
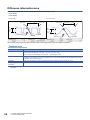
5.2
Child Windows
Child windows (trend windows/event windows) are displayed in the main window.
Multiple child windows can be displayed by each logging file and each logging data.
Event window
Trend window
Name of window
Function
Reference
Trend window
Trend graph function
Page 55 Trend window
Event window
Event monitoring function
Page 109 Event window
● The number of realtime monitor window that can be displayed simultaneously with multiple RCPUs/LCPUs
is only one window.
● The number of realtime trend window and/or realtime event window that can be displayed simultaneously
with a single Data logger or a single BOX Data logger is up to two windows.
● The number of realtime trend window and/or realtime event window that can be displayed simultaneously
with a single Data communication is shown below.
• For high speed sampling: up to two screens
• For general sampling: up to four screens (When two screens are used for high speed sampling, the number
of screen can be displayed for general sampling is up to two screens.)
● The maximum number of GX Logviewer accessible to a single module at the same time varies by module.
Operating procedure
■Tiling windows vertically/horizontally, or cascading windows
Select [Window] [Tile Vertically] (
)/ [Tile Horizontally] (
<Tile vertically>
<Tile horizontally>
)/ [Cascade] (
).
<Cascade>
■Bringing hidden window to front
Select a file name or data logging setting/event logging setting to bring the selected child window to the front.
• Select [Window] [(window name)].
34
5 SCREEN CONFIGURATION
5.2 Child Windows
5.3
Assistant Screen
Assistant screen is a screen to guide users unfamiliar with the operation of GX LogViewer.
By selecting the assistant menu, the major functions from graph display of logged device to save the graph can be used
easily.
5
To redisplay the screen has been closed once, select [View] [Show Assistant Dialog].
5 SCREEN CONFIGURATION
5.3 Assistant Screen
35
5.4
Menu Configuration
The following tables show the menu configuration of GX LogViewer.
[File]
Reference
[Open]
Page 61 Displaying logging file saved in personal computer
[Recent Folders] [(folder name)]
Page 127 Redisplaying Recently-Used Folders
[Close]
[Save As] [Save CSV File]
Page 128 SAVING DISPLAYED DATA/EVENTS
[Save As] [Save Unicode Text File]
[Save As] [Save Image File]
[Print]
Page 148 PRINTING TREND GRAPHS
[Import and Export]
Page 101 Registering and Reflecting Graphical Display Settings of
Trend Windows
Page 126 Adding/Restoring Frequently-Used Window Configuration to
Menu
[Exit]
[View]
Reference
[Toolbar] [Standard]
[Toolbar] [Online]
[Toolbar] [Graph Operation]
[Toolbar] [Graph View]
[Toolbar] [Event]
[Toolbar] [Window]
[Show Assistant Dialog]
Page 35 Assistant Screen
[Switch Display Language]
Page 31 Switching the Display Language
[Graph Operation]
Reference
[Graph Alignment]
Page 79 Aligning graphs
[Graph Superimpose]
Page 79 Superimposing graphs
[Jump Cursor]
Page 80 Moving cursor by specifying value/time/index
[Auto Adjust Upper/Lower Bound] [For Period on Display]
Page 84 Specifying upper/lower limit display value
[Auto Adjust Upper/Lower Bound] [For All Period]
[Edit Upper/Lower Bound]
[Edit Upper/Lower Bound in Batch]
[Adjust Scale] [Widen Graph]
Page 87 Widening/narrowing the display scale
[Adjust Scale] [Narrow Graph]
[Adjust Graph Location] [Move Up Graph]
Page 87 Moving graph up/down/left/right
[Adjust Graph Location] [Move Down Graph]
[Adjust Graph Location] [Move Graph to Left]
[Adjust Graph Location] [Move Graph to Right]
[Adjust Graph Location] [Horizontal Moving Quantity]
[Adjust Font Size of Graph Legends] [Expansion Font Size]
Page 56 Graph legend area
[Adjust Font Size of Graph Legends] [Reduction Font Size]
[Adjust Time Scale] [Expansion Time Scale]
Page 88 Expanding/reducing time scale
[Adjust Time Scale] [Reduction Time Scale]
[Show Previous Graph]
Page 89 Displaying consecutive previous/next trend graph
[Show Next Graph]
[Graph View]
36
Reference
[Multiple Cursor]
Page 94 Displaying multiple cursor
[Cursor Label]
Page 95 Displaying cursor labels
[Graph Highlight]
Page 100 Highlighting graph
[Bold Line]
Page 100 Thickening graph line
[Data Name]*1
Page 95 Displaying data names
5 SCREEN CONFIGURATION
5.4 Menu Configuration
[Graph View]
Reference
[Grid] [Vertical Line]
Page 96 Displaying grid
[Grid] [Horizontal Line]
[Plot Format] [Equidistance Plot]
Page 96 Switching graph plot format
[Plot Format] [Time Interval Plot]
[Time Label] [Time]
Page 97 Changing display of time scale labels
[Time Label] [Date]
[Time Label] [Date and Time]
[Time Label] [Index]
[Set Language] [Chinese Simplified]
[Set Language] [Chinese Traditional]
Page 116 Optimizing the display language of event logging names and
comments
[Set Language] [English]
[Set Language] [Japanese]
[Set Language] [Korean]
[Set Language] [Unicode (UTF-8)]
5
[Graph Legends]
Page 56 Graph legend area
[Show All Graphs]
Page 77 Displaying/hiding graphs
[Hide All Graphs]
[Change the Data to Draw Graphs]
Page 75 Adding/deleting data to/from graph legend area
[Register Graphical Display Settings]
Page 101 Registering and Reflecting Graphical Display Settings of
Trend Windows
[Operate Graphical Display Settings]
[Set Graph View by the Auto Reflect Function]
Page 103 Reflecting Graph Display Automatically When Opening File
[Initialize Graph View]
Page 103 Initializing Graph Display
[Graph Properties]
Page 98 Changing Graph Appearance
*1
When the realtime monitor window is activated, "Device/Label" is displayed instead of "Data Name".
[Event]
Reference
[Filter]
Page 114 Displaying only events that meet specific conditions
(Filtering)
[Sort by] [Date]
Page 115 Sorting events (Sorting)
[Sort by] [No.]
[Sort by] [Event Logging Name]
[Sort by] [Status]
[Sort by] [Comment]
[Sort by] [Monitoring Data]
[Set Language] [Chinese Simplified]
[Set Language] [Chinese Traditional]
Page 116 Optimizing the display language of event logging names and
comments
[Set Language] [English]
[Set Language] [Japanese]
[Set Language] [Korean]
[Set Language] [Unicode (UTF-8)]
[Show Previous Event]
Page 117 Displaying consecutive previous/next event
[Show Next Event]
[Event Properties]
Page 121 Changing Display Settings of Event List
[Online]
Reference
[Open Logging File]
Page 60 Displaying logged devices (Historical trend graph)
Page 112 Displaying logged events (Historical event list)
[Realtime Monitor]
Page 61 Displaying current device status (Realtime trend graph)
Page 62 Displaying current device status (Realtime monitor graph)
Page 113 Displaying ongoing events (Realtime event list)
[Recent Folders] [(folder name)]
Page 127 Redisplaying Recently-Used Folders
[Save Logging File to PC]
Page 123 SAVING LOGGING FILES TO PERSONAL COMPUTER
5 SCREEN CONFIGURATION
5.4 Menu Configuration
37
[Online]
Reference
[Begin Monitor]
Page 72 Operating Realtime trend graph/Realtime monitor graph
monitoring status
[End Monitor]
[Pause Monitor]
[Restart Monitor]
[Clear Graph]
[Tool]
Reference
[Start Logging Configuration Tool]
[Start High Speed Data Logger Module Configuration Tool]
[Start High Speed Data Communication Module Configuration Tool]
[Start BOX Data Logger Configuration Tool]
[Realtime Monitor Setting]
Page 62 Realtime monitor setting (for LCPU)
Page 66 Realtime monitor setting (for RCPU)
[Option] [Use an OpenGL and Draw Graphs]
Page 60 Displaying Trend Graph
[Window]
Reference
[Frequently-used Window Configuration] [Add To Frequently-used Window
Configuration]
Page 126 Adding/Restoring Frequently-Used Window Configuration to
Menu
[Recent Windows] [Historical Trend]
Page 127 Redisplaying Recently-Used Windows
[Recent Windows] [Realtime Trend]
[Recent Windows] [Historical Event]
[Recent Windows] [Realtime Event]
[Recent Windows] [Realtime Monitor]
[Tile Vertically]
Page 34 Child Windows
[Tile Horizontally]
[Cascade]
38
[Close All Windows]
[(name of child window)]
Page 34 Child Windows
[Help]
Reference
[Open Manual]
Page 150 Opening Manual
[Connection to MITSUBISHI ELECTRIC FA Global Website]
Page 150 Connecting to MITSUBISHI ELECTRIC FA Global Website
[About GX LogViewer]
Page 150 Version Information
5 SCREEN CONFIGURATION
5.4 Menu Configuration
6
OPERATION FLOWS
This chapter explains the operation flows to display data and events sampled by module, sampling trace data saved with GX
Works2, and a simulation result saved with FLEXIBLE HIGH-SPEED I/O CONTROL Module Configuration tool on GX
LogViewer.
Operation in module
Operation in tool
Saving data
Sampling logging data
in GX LogViewer format
Operation of GX LogViewer
Specifying connection destination
Select a module to be communicated with. (Clear the access restriction as necessary.)
When displaying logged
When displaying state of
When saving a logging file on a
When displaying a CSV file
data/event
devices/ongoing events
personal computer
in GX LogViewer format
Selecting a logging file
Configuring the display setting
Selecting a logging file
Opening a file
Select a logging file (a file in
Configure the setting for
Select and save a logging file
Select a '*.csv' file saved in GX
the memory card) of data or
data/event to be displayed.
in the memory card on the
LogViewer format.
event to be displayed.
6
module.
・Historical trend
・Historical trend
・Realtime trend
・Historical event
・Realtime event
・Realtime Monitor
Checking logging data
Saved logging file can be
checked on the
historical display or Excel®.
Checking displayed trend graph/event list
Trend graph/event list can be adjusted.
Saving a file
Save a trend graph/event list after adjustment in a file.
For methods of displaying each data, refer to the following sections.
Item
Reference
Displaying data of CPU module/Analog module
Page 41 Displaying Data of CPU Module/Analog Module
Displaying data/events of Data logger
Page 42 Displaying Data/Events of Data Logger
Displaying data of Data communication
Page 43 Displaying Data of Data Communication
Displaying CSV files in GX LogViewer format
Page 43 Displaying CSV Files in GX LogViewer Format
6 OPERATION FLOWS
39
Save target memory card type for data logged by Analog module
Data logged by Analog module is saved in a memory card inserted in a CPU module.
Therefore, select the logging file in the memory card inserted in the CPU module when displaying sampled data on GX
LogViewer.
Connection target CPU modules and types of save destination memory card when using Analog module are as follows:
Analog module to be logged
Connection target CPU module
Type of save destination memory
card
MELSEC-Q series analog module
QCPU (excluding QnUDVCPU)
ATA card
MELSEC iQ-R series analog module
RCPU
SD memory card
MELSEC-Q series analog module
QnUDVCPU
MELSEC-L series analog module
LCPU
Access restriction when connection destination is specified
When the access restriction is set to the module by remote password or access authentication, the connection target cannot
be specified with GX LogViewer.
Clear the access restriction on the "Enter remote password" screen or "Access Authentication" screen.
• For details on remote password, refer to the user's manual of CPU module.
• For details on access authentication, refer to the manual of Data logger/Data communication.
40
6 OPERATION FLOWS
6.1
RCPU
Displaying Data of CPU Module/Analog Module
R Analog
QnUDVCPU
High Speed Data Logger
High Speed Data Communication
Q Analog
LCPU
L Analog
BOX Data Logger
Others
Operating procedure
■Displaying data saved in a personal computer
1.
2.
Select [File] [Open] (
), or drag and drop the file.
Select a data logging file (*.txt, *.csv, or *.bin in a personal computer) to be displayed.
Page 61 Displaying logging file saved in personal computer
■Displaying data saved in CPU module
1.
2.
Select [Online] [Open Logging File] (
).
Select a data logging file (a file in a memory card inserted in the CPU module) to be displayed.
Page 60 Displaying logging file saved with logging function of CPU module/Analog module
■Saving logging files to personal computer
Select [Online] [Save Logging File to PC] (
6
).
The saved logging files can be checked by displaying as the Historical trend graph or Excel.
Page 123 SAVING LOGGING FILES TO PERSONAL COMPUTER
■Displaying current device status (only when using RCPU/LCPU)
1.
2.
Select [Online] [Realtime Monitor] (
).
Configure the realtime monitor setting.
Page 62 Displaying current device status (Realtime monitor graph)
6 OPERATION FLOWS
6.1 Displaying Data of CPU Module/Analog Module
41
6.2
RCPU
Displaying Data/Events of Data Logger
R Analog
QnUDVCPU
High Speed Data Logger
High Speed Data Communication
Q Analog
LCPU
L Analog
BOX Data Logger
Operating procedure
■Displaying data saved in a personal computer
1.
2.
Select [File] [Open] (
), or drag and drop the file.
Select a data logging file (*.csv or *.bin in the personal computer) to be displayed.
Page 61 Displaying logging file saved in personal computer
■Displaying data saved in Data logger
Select [Online] [Open Logging File] (
).
Page 60 Displaying logging file saved with logging function of Data logger
■Displaying events saved in a personal computer
1.
2.
Select [File] [Open] (
), or drag and drop the file.
Select an event logging file (*.csv or *.bin in the personal computer) to be displayed.
Page 112 Displaying Event logging files saved in a personal computer
■Displaying events saved in Data logger
Select [Online] [Open Logging File] (
).
Page 112 Displaying logging files saved with the event logging function of Data logger
■Displaying current device status
1.
2.
Select [Online] [Realtime Monitor] (
).
Select a data logging setting to be displayed.
Page 61 Displaying current device status of Data logger on trend graph
■Displaying ongoing events
1.
2.
Select [Online] [Realtime Monitor] (
).
Select an event logging setting to be displayed.
Page 113 Displaying ongoing events (Realtime event list)
■Saving logging files to a personal computer
Select [Online] [Save Logging File to PC] (
).
The saved logging files can be checked by displaying as the Historical trend graph or Excel.
Page 123 SAVING LOGGING FILES TO PERSONAL COMPUTER
42
6 OPERATION FLOWS
6.2 Displaying Data/Events of Data Logger
Others
6.3
RCPU
Displaying Data of Data Communication
R Analog
QnUDVCPU
High Speed Data Logger
High Speed Data Communication
Q Analog
LCPU
L Analog
BOX Data Logger
Others
Operating procedure
■Displaying data (only CSV files saved in the Realtime trend window) saved in a personal
computer
1.
2.
Select [File] [Open] (
), or drag and drop the file.
Select a data logging file (*.csv in a personal computer) to be displayed.
Page 61 Displaying logging file saved in personal computer
■Displaying current device status
1.
2.
Select [Online] [Realtime Monitor] (
).
Select a data logging setting to be displayed.
Page 61 Displaying current device status of Data communication on trend graph
6.4
RCPU
6
Displaying CSV Files in GX LogViewer Format
R Analog
QnUDVCPU
High Speed Data Logger
High Speed Data Communication
Q Analog
LCPU
L Analog
BOX Data Logger
Others
This section explains methods of displaying data saved with Energy Measuring Unit, sampling trace data saved with GX
Works2 and a simulation result saved with FLEXIBLE HIGH-SPEED I/O CONTROL Module Configuration tool.
Displaying Data Saved with Energy Measuring Unit
For methods of saving logging data in CSV file format, refer to manuals of Energy Measuring Unit.
• Acquiring manuals of Energy Measuring Unit in Japan
The Manuals of Energy Measuring Unit can be downloaded from Mitsubishi Electric FA site.
www.MitsubishiElectric.co.jp/fa
• Acquiring manuals of Energy Measuring Unit in other countries
For the acquisition of manuals, please consult your local Mitsubishi representative.
Operating procedure
1.
2.
Select [File] [Open] (
), or drag and drop the file.
Select a data logging file (*.csv in the personal computer) to be displayed.
Page 61 Displaying logging file saved in personal computer
6 OPERATION FLOWS
6.3 Displaying Data of Data Communication
43
Displaying Sampling Trace Data Saved with GX Works2
Display a sampling trace data in GX LogViewer format saved with GX Works2.
For methods of saving sampling trace data in GX LogViewer format, refer to the following manual.
GX Works2 Version 1 Operating Manual (Common)
Saving sampling trace data in GX LogViewer format is supported with Japanese version of GX Works2
Version 1.90U or later, English version of GX Works2 Version 1.91V or later, and Chinese version of GX
Works2 Version 1.91V or later.
Operating procedure
1.
2.
Select [File] [Open] (
), or drag and drop the file.
Select sampling trace data in GX LogViewer format (*.csv in a personal computer) to be displayed.
Page 61 Displaying logging file saved in personal computer
Displaying Data Saved with FLEXIBLE HIGH-SPEED I/O
CONTROL Module Configuration Tool
Display a simulation result in GX LogViewer format saved with FLEXIBLE HIGH-SPEED I/O CONTROL Module Configuration
tool.
Operating procedure
1.
2.
Select [File] [Open] (
), or drag and drop the file.
Select a simulation result saved in GX LogViewer format ('*.csv' in the personal computer) to be displayed.
Page 61 Displaying logging file saved in personal computer
44
6 OPERATION FLOWS
6.4 Displaying CSV Files in GX LogViewer Format
7
CONNECTING TO MODULE
To display or obtain logging data in module, the module to be connected is required to be selected.
This chapter explains the connection methods by respective modules.
7.1
RCPU
Selecting Connection Target
QnUDVCPU
R Analog
High Speed Data Logger
High Speed Data Communication
Q Analog
LCPU
L Analog
BOX Data Logger
Others
Select the equipment to be connected on the "Connection Destination" screen.
Window
Select any of the following menus.
• Select [Online] [Open Logging File] (
).
• Select [Online] [Save Logging File to PC] (
• Select [Online] [Realtime Monitor] (
).
).
7
Operating procedure
Select the equipment to be connected, and click the [OK] button.
Connection target and connection methods
For the methods of connecting to the equipment selected in the "Connection Destination" screen, refer to the following
sections.
Item
Reference
• RCPU
Page 46 Connecting to RCPU
• QCPU
Page 47 Connecting to QCPU/LCPU
• High Speed Data Logger Module
Page 50 Connecting to Data logger/Data communication
• High Speed Data Communication Module
• LCPU
Page 47 Connecting to QCPU/LCPU
• BOX Data Logger
Page 50 Connecting to Data logger/Data communication
●Access restriction when connection destination is specified
When the access restriction is set to the module by remote password or access authentication, the connection
target cannot be specified with GX LogViewer.
Cancel the access restriction on the "Enter remote password" screen or "Access Authentication" screen.
• For details on remote password, refer to the user's manual of CPU module.
• For details on access authentication, refer to the manual of Data logger/Data communication.
7 CONNECTING TO MODULE
7.1 Selecting Connection Target
45
7.2
RCPU
Connecting to RCPU
R Analog
QnUDVCPU
High Speed Data Logger
High Speed Data Communication
Q Analog
LCPU
L Analog
BOX Data Logger
Others
When "RCPU" is selected on the "Connection Destination" screen, the "Transfer Setup" screen is displayed.
Specify a connection route to RCPU in which the memory card saving logging files is inserted on the "Transfer Setup" screen.
Transfer Setup screen
Window
Select "RCPU" on the "Connection Destination" screen.
Method for connecting to RCPU
The methods for connecting to RCPU are shown below.
Item
Reference
Connection method
Page 46 Connecting directly using a USB cable
Page 46 Connecting with an Ethernet cable
Connecting directly using a USB cable
Select "USB" on the "Transfer Setup" screen to connect directly.
Operating procedure
Select "USB", and click the [OK] button.
Connecting with an Ethernet cable
■Connecting directly
Select "Ethernet" on the "Transfer Setup" screen to connect directly.
Specifying IP address is not required for direct connection.
Operating procedure
After selecting "Ethernet", select "Direct Connection", and click the [OK] button.
■Connecting via a hub
Select "Ethernet" on the "Transfer Setup" screen to connect via a hub.
Specifying IP address is required for connection via a hub.
Operating procedure
1.
2.
46
After selecting "Ethernet", select "Connection via hub".
Enter IP address of RCPU to be connected, and click the [OK] button.
7 CONNECTING TO MODULE
7.2 Connecting to RCPU
7.3
RCPU
Connecting to QCPU/LCPU
R Analog
QnUDVCPU
High Speed Data Logger
High Speed Data Communication
Q Analog
LCPU
L Analog
BOX Data Logger
Others
When "QCPU" or "LCPU" is selected on the "Connection Destination" screen, the "Transfer Setup" screen is displayed.
Specify a connection route to QCPU/RCPU in which the memory card saving logging files is inserted on the "Transfer Setup"
screen.
Transfer Setup screen
Window
Select "QCPU"/"LCPU" on the "Connection Destination" screen.
7
On the "Transfer Setup" screen, the detailed settings for the items with underline can be configured by double-clicking it.
In addition, the items with yellow icon indicate that they are already set.
Displayed items
Item
Other Station
Setting
Description
No Specification
Specify this to access the QCPU/LCPU directly connected to a personal computer.
Other Station [Single
Network]*1
Specify this to access the QCPU/LCPU on another station via only one kind of network (including a multi-tier
system) such as CC-Link only, C24 module only, or Ethernet only.
Other Station [Coexistence Network]*1
Specify this to access the CPU module on another station via CC-Link or serial communication module from the
QCPU/LCPU connected to a personal computer.
Network Communication Route
Select the network type, network number, station number, and start I/O number of the network that is routed for
accessing the programmable controller CPU on another station.
The setting items differ depending on the selected network type.
[Connection Channel List] button
A communication route can be selected with checking the route image displayed on the screen.
Set the network number, station number, and other settings depending on the access target.
*1
When the host station is specified, select "No Specification".
7 CONNECTING TO MODULE
7.3 Connecting to QCPU/LCPU
47
Method for connecting to QCPU/LCPU
The methods for connecting to QCPU/LCPU are shown below.
Item
Reference
Connection method
Page 48 Connecting directly using a USB/Ethernet cable
Page 48 Connecting via network
Connecting directly using a USB/Ethernet cable
Select "USB" or "Ethernet" on the "PLC Direct Coupled Setting" screen to connect directly.
Operating procedure
1.
2.
3.
Click the [PLC Direct Coupled Setting] button on the "Transfer Setup" screen.
Select "USB" or "Ethernet", and click the [Yes] button.
Click the [OK] button on the "Transfer Setup" screen.
Connecting via network
Configure the settings for connection via network on the "Transfer Setup" screen.
PC side I/F
PLC side I/F
Network
Communica
tion Route
Co-existence
Network Route
Operating procedure
1.
On the "Transfer Setup" screen, specify the connection interface of a personal computer to which GX LogViewer has
been installed for "PC side I/F".
2.
Specify the connection interface of the programmable controller CPU for "PLC side I/F".
When connecting to a Built-in Ethernet port CPU, the QCPU/LCPU on the network can be searched and specified.
(Page 49 Searching and specifying a Built-in Ethernet port CPU module on the network)
3.
4.
Specify whether or not any other station is present for "Other Station Setting".
Select the network type, network number, station number, and start I/O of the network routed for accessing the
programmable controller CPU on another station for "Network Communication Route" or "Co-existence Network Route",
and click the [OK] button.
48
7 CONNECTING TO MODULE
7.3 Connecting to QCPU/LCPU
■Searching and specifying a Built-in Ethernet port CPU module on the network
Search a Built-in Ethernet port CPU module on the network on the "PLC side I/F Detailed Setting of PLC module" screen to
connect.
Operating procedure
1.
Select "Ethernet board" for "PC side I/F" on the "Transfer Setup" screen, and double-click "CPU module" for "PLC side I/
F".
2.
3.
4.
Select the CPU mode (LCPU or QCPU (Q mode)) to be connected to a personal computer for "PLC Mode".
Select "Connection via HUB", and click the [Find CPU (Built-in Ethernet port) on Network] button.
Select a target CPU module form the connection destination CPU information list, and click the [Selection IP Address
Input] button.
5.
Click the [OK] button.
Precautions
• For Windows Vista or later, the warning message may be displayed when the [Find CPU (Built-in Ethernet port) on
Network] button is clicked.
• Click the [Unblock] button for Windows Vista, and click the [Allow access] button for Windows 7 or later to continue the
operation.
■Setting example (for CC-Link system)
Master
station
(1)
Station
No. 1
Station
No. 2
7
Request target
(Station No. 3)
(2)
(4)
CC-Link
(3)
(1)
(2)
(3)
(4)
Precautions
When the CPU module is connected directly or via a serial communication module, the accessible station numbers when
accessing the programmable controller CPU on another station via CC-Link are 0 (master) to 63.
7 CONNECTING TO MODULE
7.3 Connecting to QCPU/LCPU
49
7.4
RCPU
Connecting to Data logger/Data communication
R Analog
QnUDVCPU
High Speed Data Logger
High Speed Data Communication
Q Analog
LCPU
L Analog
BOX Data Logger
Others
When connecting to Data logger/Data communication, "High Speed Data Logger Module", "High Speed Data Communication
Module", or "BOX Data Logger" to be connected is required to be specified in the "Transfer Setup" screen.
Transfer setup screen
Window
Select "High Speed Data Logger Module", "High Speed Data Communication Module", or "BOX Data Logger" on the
"Connection Destination" screen.
Method for connecting to Data logger/Data communication
The methods for connecting to Data logger/Data communication are shown below.
Item
Reference
Connection method
Page 51 Connecting via a hub
Page 51 Connecting directly
50
7 CONNECTING TO MODULE
7.4 Connecting to Data logger/Data communication
Connecting via a hub
Connect to Data logger/Data communication via a hub.
When IP address is set to Data logger/Data communication, specify Data logger/Data communication to be connected by
either one of the following methods.
■Entering the IP address of Data logger/Data communication to be connected directly to
specify it
Operating procedure
1.
2.
Select "Connection via hub" on the "Transfer Setup" screen.
Enter the IP address of Data logger/Data communication to be connected in "IP address", and click the [OK] button.
Precautions
Communication with Data logger/Data communication cannot be performed when the guest account is used to log in the
operating system of a personal computer.
■Searching for Data logger/Data communication on the network to specify it
Operating procedure
1.
Click the [Search for module on network] button on the "Transfer Setup" screen.
7
The Data logger/Data communication information list is displayed.
2.
3.
Select the Data logger/Data communication to be connected from the information list, and click the [OK] button.
Click the [OK] button on the "Transfer Setup" screen.
Connecting directly
Connect Data logger/Data communication to an Ethernet port of a personal computer directly with a crossing cable.
Specifying IP address is not required for direct connection.
A straight cable can be used for BOX Data Logger.
Operating procedure
Select "Direct Connection" on the "Transfer Setup" screen, and click the [OK] button.
7 CONNECTING TO MODULE
7.4 Connecting to Data logger/Data communication
51
8
USING TREND GRAPH FUNCTION
RCPU
R Analog
8.1
QnUDVCPU
High Speed Data Logger
Q Analog
High Speed Data Communication
LCPU
L Analog
BOX Data Logger
Others
Overview
This function is for displaying the data sampled with the logging function of respective modules, a trace result of GX Works2
sampling trace, or a simulation result saved with FLEXIBLE HIGH-SPEED I/O CONTROL Module Configuration tool in graph
format.
The following display methods are available for the trend graph function.
• Historical trend graph
• Realtime trend graph
• Realtime monitor graph
Modules/files supporting the Historical trend graph/Realtime trend graph/Realtime monitor graph are shown below.
: supported, : not supported
Series
Supported module/file
Historical trend
graph
Realtime trend
graph
Realtime monitor
graph
MELSEC iQ-R series
RCPU
Analog module
MELSEC-Q series
MELSEC-L series
Others
52
QnUDVCPU
High Speed Data Logger Module
High Speed Data Communication Module
Analog module
LCPU
Analog module
BOX Data Logger
CSV file in GX LogViewer format
8 USING TREND GRAPH FUNCTION
8.1 Overview
Historical trend graph
RCPU
R Analog
QnUDVCPU
High Speed Data Logger
High Speed Data Communication
Q Analog
LCPU
L Analog
BOX Data Logger
Others
Display Data logging file saved in a memory card in a module and Data logging file data, sampling trace data, and a simulation
result in a personal computer.
Saved past data can be confirmed anytime.
■Displaying data sampled with logging function of CPU module/Analog module
Data logging file
SD memory card
ATA card(QCPU)
SD memory card
RCPU
QnUDVCPU
Save
data
LCPU
Save
MELSEC iQ-R series
analog module
SD memory card
data
MELSEC-Q series
analog module
Save
data
MELSEC-L series
analog module
Page 60 Displaying logging file saved with logging function of CPU module/Analog module
■Displaying data sampled by Data logger
Data logging file configuration
CF
CompactFlash card
8
High Speed Data
Logger Module
BOX Data Logger
Page 60 Displaying logging file saved with logging function of Data logger
■Displaying data saved in personal computer or in memory medium connected to personal
computer
Data logging file,
sampling trace data or
simulation result
Folder
SD memory card
ATA card
CompactFlash card
Page 61 Displaying logging file saved in personal computer
8 USING TREND GRAPH FUNCTION
8.1 Overview
53
Realtime trend graph
RCPU
R Analog
QnUDVCPU
High Speed Data Logger
High Speed Data Communication
Q Analog
LCPU
L Analog
BOX Data Logger
Others
Display the most recent data sampled by Data logger/Data communication.
Data are constantly updated so that the data history from the start of monitoring up to the present time can be checked.
To display the Realtime trend graph, a personal computer and a module need to be connected to each other online.
Samples data in real time, and displays them.
Logged data
BOX Data Logger
High Speed Data Logger Module
High Speed Data Communication Module
Page 61 Displaying current device status (Realtime trend graph)
Realtime monitor graph
RCPU
R Analog
QnUDVCPU
High Speed Data Logger
High Speed Data Communication
Q Analog
LCPU
L Analog
BOX Data Logger
Others
The most recent data sampled by RCPU/LCPU are displayed.
Data are constantly updated so that the data history from the start of monitoring up to the present time can be checked.
To display the Realtime monitor graph, a personal computer and a module need to be connected to each other online.
Sampled data
Samples data in real time, and displays them.
LCPU
RCPU
Page 62 Displaying current device status (Realtime monitor graph)
54
8 USING TREND GRAPH FUNCTION
8.1 Overview
8.2
Screen Configuration
This section explains the screen configuration of trend window.
Trend window
Title bar
Graph area
Graph legend
area
button
button
Difference information
area
Status bar
Displayed items
Item
Description
Reference
Title bar
• Historical trend graph: logging file name Historical Trend (module name)
"Sampling trace file name Historical Trend (sampling trace)" is displayed for sampling trace
data.
• Realtime trend graph: logging setting name Realtime Trend (module name) [monitoring
status]
• Realtime monitor graph: Realtime Monitor (module name) [monitoring status]
Graph legend
area
• Displays a list of data names and their values/status that can be displayed as graphs. (Up to
32 legends)
• "Device/Label" is displayed as a display item instead of "Data Name" on the realtime monitor
window.
Page 56 Graph legend area
Graph area
Displays data selected in the graph legend area.
Page 57 Graph area
[<<]
Displays the previous graph.
Page 90 Displaying previous graph
[>>]
Displays the next graph.
Page 92 Displaying next graph
Difference
information area
Displays difference information between two cursors when the Multiple cursor function is
activated.
Page 58 Difference information area
Status bar
Displays basic status of the selected data.
Page 59 Status bar
8 USING TREND GRAPH FUNCTION
8.2 Screen Configuration
8
55
Graph legend area
Data value/status at the cursor displayed as
a standard (vertical red cursor line)
Data names displayed in the list can be added/deleted. (Page 75 Adding/deleting data to/from graph legend area)
The background color, color and type of graph line, and font size can be changed.
• Select [Graph Operation] [Graph Legends] (
) to switch displaying/hiding the graph legend area.
• Select [Graph Operation] [Adjust Font Size of Graph Legends] [Expansion Font Size]/[Reduction Font Size] to change
the font size.
56
8 USING TREND GRAPH FUNCTION
8.2 Screen Configuration
Graph area
Data name
Trigger mark
Blue cursor
Red cursor
Data missing lines
Grid
Upper limit
display value
Lower limit
display value
Trend graphs
Time scale label
(X axis label)
Cursor label
The background color, color and type of graph line, trigger mark color, and grid color can be changed. (Page 98 Changing
Graph Appearance)
The maximum number of graphs that can be displayed in one trend window is 32.
For a realtime monitor window, it is up to 31.
8
Displayed items
Item
Description
Reference
Upper limit display
value/Lower limit display
value
Displays a maximum value/minimum value of the display range for each trend graph.
Page 84 Specifying upper/lower limit
display value
Time scale label*1,*3
(X axis label)
Displays labels for the time scale.
• Time*2/Date*2/Date and Time*2/Index
Since Analog module does not have time information in the logging data, only Index
display is available.
Page 97 Changing display of time
scale labels
Red cursor
A cursor that is displayed as a standard
(Displayed at the left edge of the graph area for the first activation.)
Page 73 Checking and comparing
data values/status
Blue cursor
A cursor that is displayed for comparison. It is displayed only when the Multiple cursor
function is activated.
(Displayed at the left edge of the graph area for the first activation.)
Trigger mark
A mark to indicate the point where a trigger condition (ON/OFF) is satisfied
Page 98 Changing color and type of
graph
Cursor label
Displays value/status at the point of intersection between a cursor and graphs.
Page 95 Displaying cursor labels
Data missing lines
Lines to indicate the point where data could not be sampled
Page 104 Graph Display for Missing
Data or Time Reversed Data
Grid
Vertical lines/horizontal lines to divide the graph drawing area
Page 96 Displaying grid
*1
*2
*3
A logging file, in which any of "year", "month", "day", "hour", "minute", or "second" of the data line output format (can be set with
Configuration tool) is missing, is displayed with Index only.
*(asterisk) is displayed when the date information does not exist, or when the date information does not contain "year, month, and day"
information.
For a realtime trend window or a realtime monitor window, the displayed date and time depend on the time setting for CPU module.
Therefore, it may be different from the time on the personal computer in use.
8 USING TREND GRAPH FUNCTION
8.2 Screen Configuration
57
Difference information area
The following display methods are available for the difference information area.
• Time display
• Index display
<For time display>
<For index display>
Blue cursor
Span (Blue
Red)
Red cursor
Value
difference
(Blue
Red)
Blue cursor
Span (Blue
Red)
Red cursor
Value
difference
(Blue
Red)
Time (Blue)
Value (Blue)
Index (Blue)
Value (Blue)
Since Analog module does not have time information in the logging data, only Index display is available.
Displayed items
Item
Description
Difference (Blue Red)
Displays difference information of value/status.
• When a graph is bit data (ON OFF, OFF ON, ON ON, OFF OFF)
• When a graph is word data (Value at the red cursor Value at the blue cursor)
Span (Blue Red)
Displays difference information of time/index. (Time/Index at the red cursor Time at the blue cursor/Index)
Time display: Data sampled by CPU module are displayed up to unit, and data sampled by Data logger/Data communication
are displayed up to a microsecond unit.
Value (Blue)
Displays the value/status at the point of intersection between the selected trend graph and the blue cursor.
Time (Blue)*1/
Index (Blue)*1
Displays time/index at the blue cursor.
*1
58
*(asterisk) is displayed when the date information does not exist, or when the date information does not contain "year, month, and day"
information.
8 USING TREND GRAPH FUNCTION
8.2 Screen Configuration
Status bar
< Example: When directly connected to High Speed Data Logger Module, and the index display is set for Realtime trend >
(1)
(2)
(3)
(4)
< Example: When connected to LCPU using Ethernet, and the time display is set for Historical trend >
(1)
(3)
(4)
Step number
Program name
Displayed items
Item
(1) Source to obtain data
Description
Displays the source of data being displayed with respective characters and colors.
Displayed characters
■Historical trend graph
Displays the source to obtain the Data logging file being displayed.
• Connecting to RCPU:
RCPU (connection channel):/file pass
• Connecting to QCPU or QnUDVCPU:
QCPU (connection channel):/file path
• Connecting to High Speed Data Logger Module:
High Speed Data Logger Module(IP address or "Direct Connection"):/file path
• Connecting to LCPU:
LCPU (connection channel):/file pass
• Connecting to BOX Data Logger:
BOX Data Logger (IP address or "Direct Connection"):/file pass
• A data is saved in a personal computer or a memory medium connected to it:
File path
■Realtime trend graph
Displays an IP address of Data logger/Data communication being communicated with, or "Direct Connection".
■Realtime monitor graph
• Connecting to RCPU:
RCPU (connection channel)
• Connecting to LCPU:
LCPU (connection channel)
8
Background color
Data Source
MELSEC iQ-R series CPU module
QnUDVCPU/QnUDPVCPU
Background color
Pale blue
MELSEC iQ-R series analog module
High Speed Data Logger Module
High Speed Data Communication Module
MELSEC-Q series analog module
Light yellow
MELSEC-L series CPU module
Rose
MELSEC-L series analog module
Simulation result saved with
Flexible High Speed I/O Control Module setting tool
Light green
Sampling trace data
Gold
BOX Data Logger
Energy Measuring Unit
Lime
(2) Communication status
Displays "Online" or "Offline". (For the Realtime trend graph/Realtime monitor graph only)
(3) Cursor value
Displays the value at the point of intersection between the selected trend graph and the red cursor.
• Program name*1 and step number*1 of the logging data
(4) Cursor time*2/Index
Displays time or index at the red cursor.
*1
*2
These are displayed only when data logged by CPU module is displayed.
*(asterisk) is displayed when the date information does not exist, or when the date information does not contain "year, month, and day"
information.
8 USING TREND GRAPH FUNCTION
8.2 Screen Configuration
59
8.3
Displaying Trend Graph
This section explains how to display logging data sampled by each module on a trend graph window.
The total number of records that can be displayed on a trend graph and in an event list is 1000001.
Page 60 Displaying logged devices (Historical trend graph)
Page 61 Displaying current device status (Realtime trend graph)
Page 62 Displaying current device status (Realtime monitor graph)
Page 72 Operating Realtime trend graph/Realtime monitor graph monitoring status
It takes more time to draw graphs when a large number of points are to be plotted.
Using OpenGL improves that as follows:
• For Realtime trend graph and Realtime monitor graph: Graphs can be drawn at high speed.
• For Historical trend graph: The time required to open the file can be shortened. Graphs can be drawn at
high speed in response to the scroll operation of the trend window.
[Tool] [Option] [Use an OpenGL and Draw Graphs]
Displaying logged devices (Historical trend graph)
RCPU
R Analog
QnUDVCPU
High Speed Data Logger
High Speed Data Communication
Q Analog
LCPU
L Analog
BOX Data Logger
Others
Display the specified file saved in a CPU module or a memory medium on the Historical trend graph.
Saved file
Description
Logging file in CPU module/Analog module
Display Data logging file saved in an ATA card/SD card in CPU module with the logging function of CPU module/
Analog module in a Historical trend graph.
Logging file saved with the data logging
function of Data logger
Display Data logging file saved in a CompactFlash card with the data logging function of Data logger in a
Historical trend graph.
Logging file saved in a personal computer
Display Data logging file, sampling trace data, or a simulation result saved with FLEXIBLE HIGH-SPEED I/O
CONTROL Module Configuration tool, which are saved in a personal computer or a connected memory medium
to it, in a Historical trend graph.
For the methods of saving logging file to a personal computer or a memory medium, refer to the following
section.
Page 123 SAVING LOGGING FILES TO PERSONAL COMPUTER
Operating procedure
■Displaying logging file saved with logging function of CPU module/Analog module
1.
2.
3.
4.
Select [Online] [Open Logging File] (
).
Select "RCPU", "QCPU", or "LCPU" on the "Connection Destination" screen.
Specify CPU module to be connected and its route on the "Transfer Setup" screen.
Select a Data logging file (*.txt, *.csv, or *.bin) from the list on the "Logging File" screen, and click the [Open File] button.
(More than one file cannot be selected.)
■Displaying logging file saved with logging function of Data logger
1.
2.
3.
4.
Select [Online] [Open Logging File] (
Select "High Speed Data Logger Module" or "BOX Data Logger" on the "Connection Destination" screen.
Specify Data logger to be connected and its route on the "Transfer Setup" screen.
Select a Data logging file (*.csv or *.bin) from the list on the "Logging File" screen, and click the [Open File] button. (More
than one file cannot be selected.)
60
).
8 USING TREND GRAPH FUNCTION
8.3 Displaying Trend Graph
■Displaying logging file saved in personal computer
1.
2.
Select [File] [Open] (
).
Drag and drop Data logging file, sampling trace data, or a simulation result saved with FLEXIBLE HIGH-SPEED I/O
CONTROL Module Configuration tool to the main widow.
(Example: Displaying "HSDL.CSV" on the desktop)
OK
OK
8
Displaying current device status (Realtime trend graph)
RCPU
R Analog
QnUDVCPU
High Speed Data Logger
High Speed Data Communication
Q Analog
LCPU
L Analog
BOX Data Logger
Others
Display the specified data logging settings of Data logger/Data communication on the Realtime trend graph.
Operating procedure
■Displaying current device status of Data logger on trend graph
1.
2.
3.
Select [Online] [Realtime Monitor] (
).
Select "High Speed Data Logger Module" or "BOX Data Logger" on the "Transfer Setup" screen.
Select a data logging setting to be set from the list on the "Select Logging Setting" screen, and click the [Open] button.
■Displaying current device status of Data communication on trend graph
1.
2.
3.
Select [Online] [Realtime Monitor] (
).
Select "High Speed Data Communication Module" on the "Transfer Setup" screen.
Select a label group setting to be set from the list on the "Select Label Group Setting" screen, and click the [Open]
button.
8 USING TREND GRAPH FUNCTION
8.3 Displaying Trend Graph
61
Displaying current device status (Realtime monitor graph)
RCPU
R Analog
QnUDVCPU
High Speed Data Logger
High Speed Data Communication
Q Analog
LCPU
L Analog
BOX Data Logger
Others
Display the device information configured with the realtime monitor setting on the Realtime monitor graph.
RnPCPU, RnSFCPU do not support the realtime monitor function.
Operating procedure
■Starting the realtime monitor function
1.
2.
3.
Select [Online] [Realtime Monitor] (
).
Select "RCPU" or "LCPU" on the "Connection Destination" screen.
For RCPU, specify the connection method on the "Transfer Setup" screen.
For LCPU, specify the connection method and its route on the "Transfer Setup" screen.
4.
Configure the monitoring setting on the "Realtime Monitor Setting" screen, and click the [Monitor Start] button. (Page
62 Realtime monitor setting (for LCPU))
■Configuring the realtime monitor setting offline
1.
2.
Select [Online] [Realtime Monitor] (
).
Select "RCPU" or "LCPU" on the "Connection Destination" screen, and select the "Execute the realtime monitor setting
in offline mode" checkbox.
3.
4.
Click the [OK] button.
Configure the monitoring setting on the "Realtime Monitor Setting" screen. (Page 62 Realtime monitor setting (for
LCPU))
5.
Click the [Save to Files] button to save the setting file to arbitrary folder.
By clicking the [Read from Files] button on the "Realtime Monitor Setting" screen and specifying the setting file, the realtime
monitor setting configured in advance can be displayed.
Realtime monitor setting (for LCPU)
The settings for Monitor Target, Monitor Condition, and Buffer Capacity are configured on the "Realtime Monitor Setting"
screen.
62
8 USING TREND GRAPH FUNCTION
8.3 Displaying Trend Graph
■The [Monitor Target Setting] tab
Specify the device to be monitored and its data type.
Type
Device*1,*7
Bit device
X, DX, Y, DY, M, L, F, SM, V, B, SB, T (contact)*2, T (coil)*3, ST (contact)*2, ST (coil)*3, C (contact)*2, C (coil)*3, FX, FY,
BL\S, J\X*6, J\Y*6, J\SB*6
Bit device
(Bit-specified word device )
D, SD, W, SW, R, ZR, FD, U\G*6, J\W*6, J\SW*6
Word device
T (current value), ST (current value), C (current value), D, SD, W, SW, R, ZR, Z*4, FD, U\G*6, J\W*6, J\SW*6
Word device
(Digit-specified bit device)*5
X, Y, M, L, F, SM, V, B, SB, BL\S, J\X*6, J\Y*6, J\SB*6
*1
*2
*3
*4
*5
*6
*7
Although index modification can be specified, indirect specification is not available to the above devices excluding FX, FY, FD, BL\S,
and bit-specified word device.
T (contact), ST (contact), and C (contact) are specified with TS, SS, and CS respectively.
T (coil), ST (coil), and C (coil) are specified with TC, SC, and CC respectively.
'ZZ' can be also specified for index modification. It can be specified regardless of the PLC parameter setting.
Digit specification for bit device is available only for K1 to K8.
Specifying devices for modules which do not exist or inaccessible devices of a module will not result in an error, but undefined value will
be displayed.
Local device of the program set in the "Program Name" can be monitored when selecting the "Step No. Specification" on the "Timing
Condition" screen.
■The [Monitor Condition Setting] tab - Timing Type
Item
Description
Each Scan
Monitors data at the timing of END processing for each scan.
Condition Specification
Monitors data at the timing of the specified condition.
■The [Monitor Condition Setting] tab - Timing Condition - Device Specification
8
Data at a certain point when the specified device status has satisfied the specified condition at the END processing are
monitored.
Item
Description
Device*1
Bit device
X, Y, M, L, F, SM, V, B, SB, T (contact)*2, ST
(contact)*2, C (contact)*2, FX, FY, BL\S, J\X,
J\Y, J\SB
Setting range
Bit device
(Bit-specified word device)
D, SD, W, SW, R, ZR, FD, U\G, J\W, J\SW
Word device
T (current value), ST (current value), C (current
value), D, SD, W, SW, R, ZR, Z, FD, U\G,
J\W, J\SW
Word device
(Digit-specified bit device)*3
X, Y, M, L, F, SM, V, B, SB, BL\S, J\X, J\Y,
J\SB
Condition Formula
■Bit device is specified
"": When bit device rises
Monitors data when the specified device status is changed from OFF to ON.
"": When bit device falls
Monitors data when the specified device status is changed from ON to OFF.
■Word device is specified
"=": When word device meets the specified value
Monitors data when the current value of the specified device satisfies the condition
value.
"Change": When word device data is changed
Monitors data when the current value of the specified device is changed.
Radix
Set a radix of the condition value when word device is specified.
Condition Value
Set a value to be compared with the device.
*1
*2
*3
• Bit device specification
"", ""
• Word device specification
"=", "Change"
Decimal/hexadecimal
• Decimal: -32768 to 32767
• Hexadecimal: 0H to FFFFH
Index modification can be specified to above devices excluding FX, FY, FD, BL\S, and bit-specified word device. The indirect-specified
T, C, ST, D, W, SW, R, ZR, U\G, J\W, and J\SW can be specified.
T (contact), ST (contact), and C (contact) are specified with TS, SS, and CS respectively.
Digit specification for bit device is available only for K1 to K4.
8 USING TREND GRAPH FUNCTION
8.3 Displaying Trend Graph
63
■The [Monitor Condition Setting] tab - Timing Condition - Step No. Specification
Data at a certain point when the status immediately before the execution of the specified step has satisfied the execution
condition are monitored.
Item
Description
Setting range
Program Name
Set a program name for the program to be monitored by satisfaction of
condition for the specified step No.
Up to 8 characters
Step No.
Set a step No. to monitor data by satisfaction of the condition.
0 to 266239
Execution Condition
Select the monitoring operation condition from the following:
"Always": Any time
Always monitors data at the specified step.
"ON": When the execution condition is ON
Monitors data while the operation of the specified step is satisfied.
"OFF": When the execution condition is OFF
Monitors data while the operation of the specified step is not satisfied.
"": When the execution condition rises
Monitors data at the timing when the operation of the specified step
turns into the satisfied state from the not-satisfied state.
"": When the execution condition falls
Monitors data at the timing when the operation of the specified step
turns into the not-satisfied state from the satisfied state.
"Always"
"ON"
"OFF"
""
""
■The [Monitor Condition Setting] tab - Trigger Type
A trigger mark is displayed on the graph area once a trigger is detected.
Item
Description
No Trigger
Monitors data without specifying a trigger condition.
1 Time
Stops monitoring once the specified number of records has been monitored since a trigger was detected.
Continuous
Keeps monitoring up to the monitoring stop operation, and detect triggers during the period.
■The [Monitor Condition Setting] tab - Trigger Condition -Device Specification
A trigger is generated and detected when the specified device status has satisfied the specified condition at the END
processing.
Item
Description
Device
Setting range
*2
Bit device
X, Y, M, L, F, SM, V, B, SB, T (contact) , ST
(contact)*2, C (contact)*2, FX, FY
Bit device
(Bit-specified word device)
D, SD, W, SW, R, ZR, FD
Word device
T (current value), ST (current value), C (current
value), D, SD, W, SW, R, ZR, FD
Condition Formula
■Bit device is specified
"": When bit device rises
Generates a trigger when the specified device status is changed from OFF to ON.
"": When bit device falls
Generates a trigger when the specified device status is changed from ON to OFF.
■Word device is specified
"=": When word device meets the specified value
Generates a trigger when the current value of the specified device satisfies the
condition value.
"Change": When word device data is changed
Generates a trigger when the current value of the specified device is changed.
Radix
Set a radix of the condition value when word device is specified.
Condition Value
Set a value to be compared with the device.
*1
*2
64
*1
The indirect-specified and index-modified devices cannot be specified.
T (contact), ST (contact), and C (contact) are specified with TS, SS, and CS respectively.
8 USING TREND GRAPH FUNCTION
8.3 Displaying Trend Graph
• Bit device specification
"", ""
• Word device specification
"=", "Change"
Decimal/hexadecimal
• Decimal: -32768 to 32767
• Hexadecimal: 0H to FFFFH
■The [Monitor Condition Setting] tab - Trigger Condition -Step No. Specification
A trigger is generated and detected when the status immediately before the execution of the specified step has satisfied the
specified execution condition.
Item
Description
Setting range
Program Name
Set a program name for the program in which a trigger is generated by
satisfaction of the condition for the specified step No.
Up to 8 characters
Step No.
Set a step No. to generate a trigger by satisfaction of the condition.
0 to 266239
Execution Condition
Select the trigger generation condition from the following:
"Always": Any time
Generates a trigger at the specified step.
"ON": When the execution condition is ON
Generates a trigger when the operation of the specified step has been
satisfied.
"OFF": When the execution condition is OFF
Generates a trigger when the operation of the specified step is not
satisfied.
"": When the execution condition rises
Generates a trigger at the timing when the operation of the specified
step has turned into the satisfied state from the not-satisfied state.
"": When the execution condition falls
Generates a trigger at the timing when the operation of the specified
step has turned into the not-satisfied state from the satisfied state.
"Always"
"ON"
"OFF"
""
""
■The [Monitor Condition Setting] tab - Record number after trigger
To specify the number of record from trigger condition satisfaction to monitoring stop, specify the number for "Record number
after trigger".
Item
Description
Record number after trigger
Set the number of records to be monitored after a trigger was detected.
(Dropped data occurred after trigger detection are not included in the record after trigger.)
Start monitoring
8
Stop monitoring
Trigger condition satisfaction
Sampled data
Record number after trigger (including the torigger)
Number of records can be monitored
■The [Buffer Capacity Setting] tab
Specify a buffer capacity. Insufficient buffer capacity increases the probability of processing overload*1 occurrence.
*1
QnUDVCPU/LCPU User's Manual (Data Logging Function)
Module
Capacity
Using in conjunction with other functions of CPU module
How to check the
free buffer capacity
LCPU
32 to 4832 KB
To use the realtime monitor function in conjunction with the data logging function, set the
capacity within the range that meets the following conditions.
• The total of data logging buffer capacities + Realtime monitor buffer capacity 5120
KB
The buffer capacity for the data logging function can be checked by reading the logging
setting from the CPU module with CPU Module Logging Configuration Tool.
QnUDVCPU/LCPU User's Manual (Data Logging Function)
Can be checked with the
special register, SD830.
• Setting both of "Device Specification" and "Step No. Specification" in "Timing Condition"
Data at the time when both conditions are satisfied at the specified step are monitored.
• Monitoring by specifying the time interval
Monitoring at the fixed time interval (0.5 to 1000 ms) can be performed by setting arbitrary steps to fixed
cycle interrupt program and fixed cycle execution type program for "Step No. Specification" in "Timing
Condition".
8 USING TREND GRAPH FUNCTION
8.3 Displaying Trend Graph
65
Realtime monitor setting (for RCPU)
The settings for monitor target, monitor conditions (start/stop/timing), and buffer capacity are configured on the "Realtime
Monitor Setting" screen.
■The [Monitor Target Setting] tab
Specify the device to be monitored and its data type.
Type
Device*1,*2
Bit device
X, DX, Y, DY, M, L, F, SM, V, B, SB, T (contact)*3, T (coil)*4, ST (contact)*3, ST (coil)*4, C (contact)*3, C (coil)*4, LT
(contact)*3, LT (coil)*4, LST (contact)*3, LST (coil)*4, LC (contact)*3, LC (coil)*4, FX, FY, BL\S, J\X, J\Y, J\SB,
J\B
Bit device
(Bit-specified word device)
D, SD, W, SW, RD, R, ZR, FD, U\G, J \W, J\SW, U3E\G, U3E\HG
Word device
T (current value)*5, ST (current value)*5, C (current value)*5, D, SD, W, SW, RD, R, ZR, Z, FD, U\G, J\W, J\SW,
U3E\G, U3E\HG
Word device
(Digit-specified bit device)*6
X, Y, M, L, F, SM, B, SB, BL\S, J\X, J\Y, J\SB, J\B
Double-word device
LT (current value)*5, LST (current value)*5, LC (current value)*5, LZ
Double-word device
(Digit-specified bit device)*6
X, Y, M, L, F, SM, B, SB, BL\S, J\X, J\Y, J\SB, J\B
*1
*2
*3
*4
*5
*6
The indirect-specified and index-modified devices cannot be specified.
The local devices cannot be specified.
T (contact), ST (contact), C (contact), LT (contact), LST (contact), and LC (contact) are specified with TS, STS, CS, LTS, LSTS, and LCS
respectively.
T (coil), ST (coil), C (coil), LT (coil), LST (coil) and LC (coil) are specified with TC, STC, CC, LTC, LSTC, and LCC respectively.
T (current value), ST (current value), C (current value), LT (current value), LST (current value), and LC (current value) can be specified
with T/TN, ST/STN, C/CN, LT/LTN, LST/LSTN, and LC/LCN respectively.
Digit specification for bit device is available only for K1 to K8.
■The [Monitor Condition Setting] tab -Timing Type
66
Item
Description
Each Scan
Monitors data at the timing of END processing for each scan.
Condition Specification
Monitors data at the timing of the specified condition.
8 USING TREND GRAPH FUNCTION
8.3 Displaying Trend Graph
■The [Monitor Condition Setting] tab - Timing Condition -Device Specification
Data at a certain point when the specified device status has satisfied the specified condition at the END processing are
monitored.
Item
Device
Description
*1,*2
Condition Formula
Setting range
*3
Bit device
X, Y, M, L, F, SM, V, B, SB, T (contact) , ST
(contact)*3, C (contact)*3, LT (contact)*3, LST
(contact)*3, LC (contact)*3, FX, FY, BL\S,
J\X, J\Y, J\SB, J\B
Bit device
(Bit-specified word device )
D, SD, W, SW, RD, R, ZR, FD, U\G, J\W,
J\SW, U3E\G, U3E\HG
Word device
T (current value)*4, ST (current value)*4, C
(current value)*4, D, SD, W, SW, RD, R, ZR, Z,
FD, U\G, J\W, J\SW, U3E\G, U3E\HG
Word device
(Digit-specified bit device)*5
X, Y, M, L, F, SM, B, SB, BL\S, J\X, J\Y,
J\SB, J\B
Double-word device
LT (current value)*4, LST (current value)*4, LC
(current value)*4, LZ
Double-word device
(Digit-specified bit device)*5
X, Y, M, L, F, SM, B, SB, BL\S, J\X, J\Y,
J\SB, J\B
■Bit device is specified
"": When bit device rises
Monitors data when the specified device status is changed from OFF to ON.
"": When bit device falls
Monitors data when the specified device status is changed from ON to OFF.
■Word device/double-word device is specified
"=": When word device/double-word device meets the specified value
Monitors data when the current value of the specified device satisfies the condition
value.
"Change": When word device/double-word device data is changed
Monitors data when the current value of the specified device is changed.
Radix
Set a radix of the condition value when word device/double-word device is specified.
Condition Value
Set a value to be compared with the device.
*1
*2
*3
*4
*5
• Bit device specification
"", ""
• Word device/double-word device
specification
"=", "Change"
8
Decimal/hexadecimal
• For a word device
Decimal: -32768 to 32767
Hexadecimal: 0H to FFFFH
• For a double-word device
Decimal: -2147483648 to
2147483647
Hexadecimal: 0H to FFFFFFFFH
The indirect-specified and index-modified devices cannot be specified.
The local devices cannot be specified.
T (contact), ST (contact), C (contact), LT (contact), LST (contact), and LC (contact) are specified with TS, STS, CS, LTS, LSTS, and LCS
respectively.
T (current value), ST (current value), C (current value), LT (current value), LST (current value), and LC (current value) can be specified
with T/TN, ST/STN, C/CN, LT/LTN, LST/LSTN, and LC/LCN respectively.
Digit specification for bit device is available only for K1 to K8.
8 USING TREND GRAPH FUNCTION
8.3 Displaying Trend Graph
67
■The [Monitor Condition Setting] tab - Timing Condition - Step No. Specification
Data at a certain point when the status immediately before the execution of the specified step has satisfied the execution
condition are monitored.
Item
Description
Setting range
Program Name
Set a program name for the program to be monitored by satisfaction of
condition for the specified step No.
Up to 60 characters
Step No.
Set a step No. to monitor data by satisfaction of the condition.
0 to 1228799
Execution Condition
Select the monitoring operation condition from the following:
"Always":
Any time Always monitors data at the specified step.
"ON": When the execution condition is ON
Monitors data while the operation of the specified step is satisfied.
"OFF": When the execution condition is OFF
Monitors data while the operation of the specified step is not satisfied.
"": When the execution condition rises
Monitors data at the timing when the operation of the specified step
turns into the satisfied state from the not-satisfied state.
"": When the execution condition falls
Monitors data at the timing when the operation of the specified step
turns into the not-satisfied state from the satisfied state.
"Always"
"ON"
"OFF"
""
""
■The [Monitor Condition Setting] tab - Trigger Type
A trigger mark is displayed on the graph area once a trigger is detected.
Item
68
Description
No Trigger
Monitors data without specifying a trigger condition.
1 Time
Stops monitoring once the specified number of records has been monitored since a trigger was detected.
Continuous
Keeps monitoring up to the monitoring stop operation, and detect triggers during the period.
8 USING TREND GRAPH FUNCTION
8.3 Displaying Trend Graph
■The [Monitor Condition Setting] tab - Trigger Condition - Device Specification
A trigger is generated and detected when the specified device status has satisfied the specified condition at the END
processing.
Item
Device
Description
*1,*2
Setting range
*3
Bit device
X, Y, M, L, F, SM, V, B, SB, T (contact) , ST
(contact)*3, C (contact)*3, LT (contact)*3, LST
(contact)*3, LC (contact)*3, FX, FY
Bit device
(Bit-specified word device)
D, SD, W, SW, RD, R, ZR, FD
Word device
T (current value)*4, ST (current value)*4, C
(current value)*4, D, SD, W, SW, RD, R, ZR, FD
Double-word device
LT (current value)*4, LST (current value)*4, LC
(current value)*4
Condition Formula
■Bit device is specified
"": When bit device rises
Generates a trigger when the specified device status is changed from OFF to ON.
"": When bit device falls
Generates a trigger when the specified device status is changed from ON to OFF.
■Word device/double-word device is specified
"=": When word device/double-word device meets the specified value
Generates a trigger when the current value of the specified device satisfies the
condition value.
"Change": When word device/double-word device data is changed
Generates a trigger when the current value of the specified device is changed.
Radix
Set a radix of the condition value when word device/double-word device is specified.
Condition Value
Set a value to be compared with the device.
*1
*2
*3
*4
• Bit device specification
"", ""
• Word device/double-word device
specification
"=", "Change"
Decimal/hexadecimal
• Decimal: -32768 to 32767
• Hexadecimal: 0H to FFFFH
The digit-specified bit devices, indirect-specified and index-modified devices cannot be specified.
The local devices cannot be specified.
T (contact), ST (contact), C (contact), LT (contact), LST (contact), and LC (contact) are specified with TS, STS, CS, LTS, LSTS, and LCS
respectively.
T (current value), ST (current value), C (current value), LT (current value), LST (current value), and LC (current value) can be specified
with T/TN, ST/STN, C/CN, LT/LTN, LST/LSTN, and LC/LCN respectively.
8
■The [Monitor Condition Setting] tab - Trigger Condition - Step No. Specification
A trigger is generated and detected when the status immediately before the execution of the specified step has satisfied the
specified execution condition.
Item
Description
Setting range
Program Name
Set a program name for the program in which a trigger is generated by
satisfaction of the condition for the specified step No.
Up to 60 characters
Step No.
Set a step No. to generate a trigger by satisfaction of the condition.
0 to 1228799
Execution Condition
Select the trigger generation condition from the following:
"Always": Any time
Generates a trigger at the specified step.
"ON": When the execution condition is ON
Generates a trigger when the operation of the specified step has been
satisfied.
"OFF": When the execution condition is OFF
Generates a trigger when the operation of the specified step is not
satisfied.
"": When the execution condition rises
Generates a trigger at the timing when the operation of the specified
step has turned into the satisfied state from the not-satisfied state.
"": When the execution condition falls
Generates a trigger at the timing when the operation of the specified
step has turned into the not-satisfied state from the satisfied state.
"Always"
"ON"
"OFF"
""
""
8 USING TREND GRAPH FUNCTION
8.3 Displaying Trend Graph
69
■The [Monitor Condition Setting] tab - Record number after trigger
To specify the number of record from trigger condition satisfaction to monitoring stop, specify the number for "Record number
after trigger".
Item
Description
Record number after trigger
Set the number of records to be monitored after a trigger was detected.
(Dropped data occurred after trigger detection are not included in the record after trigger.)
Start monitoring
Stop monitoring
Trigger condition satisfaction
Sampled data
Record number after trigger (including the torigger)
Number of records can be monitored
■The [Buffer Capacity Setting] tab
Specify a buffer capacity. Insufficient buffer capacity increases the probability of processing overload*1 occurrence.
*1
MELSEC iQ-R CPU Module User's Manual (Application)
Module
Capacity
Using in conjunction with other functions of CPU module
How to check the
free buffer capacity
RCPU
32 to 3008 KB
To use the realtime monitor function in conjunction with the data logging function and the
memory dump function, set the capacity within the range that meets the following conditions.
• The total of data logging buffer capacities + Memory dump buffer capacity + Realtime
monitor buffer capacity 3072 KB
Can be checked with the
special register, SD1484.
• Setting both of "Device Specification" and "Step No. Specification" in "Timing Condition"
Data at the time when both conditions are satisfied at the specified step are monitored.
• Monitoring by specifying the time interval
Monitoring at the fixed time interval (0.5 to 1000 ms) can be performed by setting arbitrary steps to fixed
cycle interrupt program and fixed cycle execution type program for "Step No. Specification" in "Timing
Condition".
• "Step No. Specification" cannot be set since the step No. cannot be checked in a program consisting of
multiple elements such as ST programs, FB programs, and SFC programs.
• Some devices cannot be monitored (accessed) in a multiple CPU configuration. For details, refer to the
following manual.
(MELSEC iQ-R CPU Module User's Manual (Application))
70
8 USING TREND GRAPH FUNCTION
8.3 Displaying Trend Graph
Considerations for setting "Step No. Specification" for "Timing Condition"
When a realtime monitor is performed, scan time is increased by the realtime monitor processing time.
Set the watchdog timer, and create the interrupt program (set the fixed cycle interval) in consideration of the realtime monitor
processing time.
Realtime monitor processing time
The time increase of the scan time when the realtime monitor function is performed can be calculated using the calculation
formula below:
■Time increase of scan time
Trm = KM1 + (KM2 N1) + (KM3 N2) [s]
Trm: Time increase of scan time when the realtime monitor function is performed
N1: Number of word device points
N2: Number of bit device points
KM1: Constant (Common processing time)
KM2: Constant (Word device processing time)
KM3: Constant (Bit device processing time)
• User device (X, Y, M, L, B, F, SB, V, T, ST, C, LT, LST, LC, D, W, SW, FX, FY, SM, FD, SD, BL\S)
Constant name
R04CPU
R08/16/32/120CPU
L26CPU/L26CPUBT
L06CPU
L02CPU
KM1
149.00
149.00
KM2
3.20
3.20
64.00
74.00
79.00
0.56
0.60
KM3
0.80
0.80
0.75
0.68
0.87
0.95
8
• File register (R, ZR)
Constant name
R04CPU
R08/16/32/120CPU
L26CPU/L26CPUBT
L06CPU
L02CPU
KM1
149.00
149.00
KM2
3.50
3.50
64.00
74.00
79.00
0.66
0.70
KM3
1.10
1.10
0.91
0.78
1.03
1.11
• Module access device (U\G, U3E\G, U3E\HG), link direct device (J\W, J\X, J\SW, J\Y, J\SB, J\B)
Constant name
R04CPU
R08/16/32/120CPU
L26CPU/L26CPUBT
L06CPU
KM1
156.00
KM2
11.60
KM3
8.90
L02CPU
156.00
112.00
125.12
128.10
11.60
12.00
14.20
14.50
8.90
13.50
15.00
15.06
8 USING TREND GRAPH FUNCTION
8.3 Displaying Trend Graph
71
Operating Realtime trend graph/Realtime monitor graph
monitoring status
RCPU
R Analog
QnUDVCPU
High Speed Data Logger
High Speed Data Communication
Q Analog
LCPU
L Analog
BOX Data Logger
Others
Change monitoring status and operate graphs on the Realtime trend graph/Realtime monitor graph.
Graph name
Supported module
Realtime trend graph
High Speed Data Logger Module, High Speed Data Communication Module, BOX Data Logger
Realtime monitor graph
RCPU, LCPU
Operating procedure
■Starting monitoring
• Select [Online] [Begin Monitor] (
).
This operation starts communication with a module, and turns the monitoring status from Stop to Run.
■Stopping monitoring
• Select [Online] [End Monitor] (
).
This operation disconnects the communication with a module, and stops a trend graph drawing.
■Pausing graph update
• Select [Online] [Pause Monitor] (
).
This operation suspends a trend graph drawing with communication continued. (Data sampling is continued.)
■Restarting graph update
• Select [Online] [Restart Monitor] (
).
This operation restarts the trend graph drawing from the monitoring paused status.
The data sampled while the monitoring had been paused is not displayed on the graph temporarily, but it is displayed on the
trend graph after the monitoring is restarted.
■Clearing graphs
• Select [Online] [Clear Graph] (
).
This operation clears trend graphs being drawn in the graph area.
Graph drawing for the data being sampled is restarted immediately after clearing.
72
8 USING TREND GRAPH FUNCTION
8.3 Displaying Trend Graph
8.4
RCPU
Checking Data
R Analog
QnUDVCPU
High Speed Data Logger
High Speed Data Communication
Q Analog
LCPU
L Analog
BOX Data Logger
Others
This section explains how to check data displayed on the trend window.
Page 73 Checking and comparing data values/status
Page 75 Adding/deleting data to/from graph legend area
Checking and comparing data values/status
Check and compare the data values/status on the trend graph.
Blue cursor
Red cursor
8
Precautions
• Stop or pause the monitoring when operating the cursors on the Realtime trend graph/Realtime monitor graph.
• The Multiple cursor function needs to be activated to display the blue cursor.
For details on the Multiple cursor function and the difference information area, refer to the following sections.
Page 94 Displaying multiple cursor
Page 58 Difference information area
Moving cursors
Operating procedure
■Moving red cursor or blue cursor
Drag the red cursor/blue cursor to the right/left using a mouse.
Or, press the + / keys.
■Moving red and blue cursor simultaneously
Drag the red cursor or the blue cursor while pressing the + keys.
Or, press the + + / keys.
■Moving graph only without moving cursors
Move the horizontal scroll bar right/left on the trend window.
Or, press the / keys (moving the scroll bar right/left), or press the / keys (moving the scroll bar to the
right/left periphery).
■Moving cursor by specifying value/time/index
The cursor can be moved to the specified position (value/time/index) by using the Jump cursor function.
For details on the Jump cursor function, refer to the following section.
Page 80 Moving cursor by specifying value/time/index
8 USING TREND GRAPH FUNCTION
8.4 Checking Data
73
Checking data value/status
Operating procedure
■Checking value/status using red cursor
1.
2.
Move the red cursor to the position where the value/status is checked.
Check the values displayed on the cursor value and the cursor time/index field on the status bar.
■Checking value/status using blue cursor
1.
2.
Move the blue cursor to the position where the value/status is checked.
Check the values displayed in "Value (Blue)" and "Time (Blue)/Index (Blue)" in the difference information area.
• Data value/status can also be displayed at the cursor label by selecting [Graph View] [Cursor Label] (
).
• The cursor may be moved to the intervening space of plots for an unselected file. In this case, the data
value at the cursor is displayed as an estimated value obtained by linear interpolation, and displayed in
parentheses.
Comparing data values/status
Operating procedure
1.
2.
Move the red cursor and the blue cursor to the two positions where data value/status are compared.
Compare the data values/status by the difference of the value displayed in "Difference (Blue Red)" and "Span (Blue
Red)" in the difference information area.
74
8 USING TREND GRAPH FUNCTION
8.4 Checking Data
Adding/deleting data to/from graph legend area
Add/delete the data to be displayed on the graph legend area.
Also, add/delete the logging data in another file to/from the graph legend area on the same trend window.
When adding the logging data of another file, in case the display format is set to the equidistance plot display format, it is
changed to the time interval plot display format.
For details on the time interval plot display format, refer to the following section.
Page 96 Switching graph plot format
Window
Select [Graph View] [Change the Data to Draw Graphs].
Data list
8
Adding/Deleting data
Operating procedure
■Adding data to graph legend area
Check the data to be displayed on the graph legend area, and click the [OK] button.
■Deleting data from graph legend area
Unselect the data to be deleted on the graph legend area, and click the [OK] button.
Adding/Deleting logging data in another file
Operating procedure
■Adding data stored in a personal computer to graph legend area
1.
2.
Click the [Add files in the personal computer to the list] button, and select the file to be added.
Check the data to be displayed on the graph legend area, and click the [OK] button.
■Adding data stored in target module to graph legend area
1.
Click the [Add online files to the list] button, and set the connection destination. (Page 45 CONNECTING TO
MODULE)
2.
3.
Select the file to be added on the "Logging File" screen, and click the [Open File] button.
Check the data to be displayed on the graph legend area, and click the [OK] button.
■Deleting added file
Select the file to be deleted on the data list, and click the [Delete the files from the list] button.
The file can be also added by dragging and dropping the logging file saved in a personal computer to the data
list.
8 USING TREND GRAPH FUNCTION
8.4 Checking Data
75
8.5
RCPU
Operating Trend Graphs
R Analog
QnUDVCPU
High Speed Data Logger
High Speed Data Communication
Q Analog
LCPU
L Analog
BOX Data Logger
Others
This section explains how to operate trend graphs to improve the efficiency of data check.
Page 77 Displaying/hiding graphs
Page 79 Aligning graphs
Page 79 Superimposing graphs
Page 80 Moving cursor by specifying value/time/index
Page 84 Specifying upper/lower limit display value
Page 87 Widening/narrowing the display scale
Page 87 Moving graph up/down/left/right
Page 88 Expanding/reducing time scale
Page 89 Displaying consecutive previous/next trend graph
• Graph display information can be named and registered to be reflected to other windows. (Page 101
Registering and Reflecting Graphical Display Settings of Trend Windows)
• Graph display can be set to be reflected automatically when opening the same data logging setting window
next time. (Page 103 Reflecting Graph Display Automatically When Opening File)
76
8 USING TREND GRAPH FUNCTION
8.5 Operating Trend Graphs
Displaying/hiding graphs
Display/hide trend graphs in the trend graph area.
Individual display/hide
Display/hide a trend graph in the graph area by selecting data individually from the graph legend area.
<Hide>
<Individual display>
Operating procedure
<Selecting the check box of graph legend>
To display : Select
To hide
: Unselect
8
<Double-clicking data on the graph legend area>
Switches display/hide setting by
double-clicking "Data Name" or "Value".
8 USING TREND GRAPH FUNCTION
8.5 Operating Trend Graphs
77
Batch display
Display the trend graphs of all the data listed in the graph legend area.
<Hide>
<Batch display>
Operating procedure
Select [Graph View] [Show All Graphs] (
).
Batch hide
Hide the trend graphs of all the data listed in the graph legend area.
<Display>
<Batch hide>
Operating procedure
Select [Graph View] [Hide All Graphs] (
78
8 USING TREND GRAPH FUNCTION
8.5 Operating Trend Graphs
).
Aligning graphs
Align all the trend graphs displayed in the graph area without overlapping.
Trend graphs are aligned in the order of data listed in the graph legend area.
<Before alignment>
<After alignment>
Graphs are aligned
in the order that
they are displayed
in the graph
legend area.
Operating procedure
Select [Graph Operation] [Graph Alignment] (
).
Superimposing graphs
8
Display all the trend graphs shown in the graph area with them superimposed.
<Before superimposing>
<After superimposing>
Analog data
Digital data
Operating procedure
Select [Graph Operation] [Graph Superimpose] (
).
8 USING TREND GRAPH FUNCTION
8.5 Operating Trend Graphs
79
Moving cursor by specifying value/time/index
Use the Jump Cursor function to check data value/status by moving the cursor to the specified value, time, or index position
on the trend graph.
Since Analog module does not have time information, the Jump Cursor function can be used only by specifying value or
index.
Jump to the position where the condition is satisfied.
[Value search]
Condition search
400
Value
300
400
200
3/31/2014,
14:50
11
3/31/2014,
15:06
27
[Index specification]
[Time specification]
Precautions
When performing the Jump Cursor function on the Realtime trend graph/Realtime monitor graph, stop or pause the
monitoring.
Window
Select [Graph Operation] [Jump Cursor] (
[Value]
).
[Time]
(Initial Display)
Switch with a tab.
80
8 USING TREND GRAPH FUNCTION
8.5 Operating Trend Graphs
[Index]
Jumping cursor by searching value
Search the value by specifying type in "Classification" to move the cursor to the position where the condition is satisfied.
The classification varies depending on the data type being selected.
Classification
When the data type is bit
When the data type is other
than bit
Description
UP
Jumps to the position where the selected data turned from OFF to ON for the first time.
Down
Jumps to the position where the selected data turned from ON to OFF for the first time.
Comparison
Compares the values of the selected data and the specified data, and jumps to the position where the
condition is satisfied. (Page 82 Comparison of values between data names)
Conditional
Searches the value by specifying the condition, and jumps to the position where the condition is
satisfied. (Page 81 Condition search)
Maximal
The cursor is moved to the position where the increased value of the selected data starts decreasing.
However, the positions where the increased value becomes flat are not considered as the position of
maximal value.
Example:
Minimal
The cursor is moved to the position where the decreased value of the selected data starts increasing.
However, the positions where the decreased value becomes flat are not considered as the position of
minimal values.
Example:
Comparison
8
Compares the values of the selected data and the specified data, and jumps to the position where the
condition is satisfied.
Page 82 Comparison of values between data names
■Condition search
Operating procedure
1.
2.
3.
Select "Conditional" from "Classification".
Specify a condition and a value.
Select the color of the cursor, and click the [Jump Previous]/[Jump Next] button.
The following shows the examples of specifying condition search range.
Condition search range
Example of specification
• When searching for a value in a range between 0 and 100, use both condition combo boxes.
• When searching for a value less than 1000, use the condition box on the right side only.
• When searching for a value -1000 or more, use the condition box on the left side only.
8 USING TREND GRAPH FUNCTION
8.5 Operating Trend Graphs
81
Condition search range
Example of specification
• When searching for a value 2500, use the condition box on either side.
• When searching for a value other than -15000, use the condition box on either side.
Precautions
• A rounding error occurs when searching for a floating-point value.
When a single-precision/double-precision floating-point is entered to the left/right side of the text box, the exponent is
normalized by rounding off to two decimal places. A single-precision real number is rounded to 7 significant digits. For data
values, single-precision and double-precision values are rounded to 7 and 15 significant digits respectively.
• A comparison with a value which exceeded the number of significant values cannot be performed.
When checking a match with a value which exceeded the number of significant values, compare the value with values
between the approximate values.
Ex.
Checking a match with 1.23456E+10
1.234E+010
1.23456E+010
1.235E+010
Check a match with values within this range. (Boundary values are not included.)
■Comparison of values between data names
Operating procedure
1.
Select "Comparison" from "Classification". (If data, whose data type is the same as the selected data, does not exist, no
item is displayed for "Classification".)
2.
3.
82
Specify a condition and a data name.
Select the color of the cursor, and click the [Jump Previous]/[Jump Next] button.
8 USING TREND GRAPH FUNCTION
8.5 Operating Trend Graphs
Jumping cursor by specifying time
Operating procedure
1.
2.
3.
Click the [Time] tab on the "Jump Cursor" screen.
Specify date and time for "Date and time to which the cursor jumps".
Select the color of the cursor, and click the [Jump Previous]/[Jump Next] button.
The following table shows the setting examples of time condition and their operation results.
Item
Second
Description
Example*1:
Result:
Specify '30' for the second only.
2014/06/30 19:36:30 previous 2014/06/30 19:37:30 next 2014/06/30 19:38:30
Minute
Example*1:
Result:
Specify '30' for the minute only.
2014/06/30 18:30:00 previous 2014/06/30 19:30:00 next 2014/06/30 20:30:00
Hour
Example*1:
Result:
Specify '00' for the hour only.
2014/06/30 00:00:00 previous 2014/07/01 00:00:00 next 2014/07/02 00:00:00
*1
The logging interval is set to 1 second.
Jumping cursor by specifying index
Operating procedure
1.
2.
3.
Click the [Index] tab on the "Jump Cursor" screen.
Specify the index for "Index to which the cursor jumps".
Select the color of the cursor, and click the [Jump Previous]/[Jump Next] button.
8 USING TREND GRAPH FUNCTION
8.5 Operating Trend Graphs
8
83
Specifying upper/lower limit display value
Display a graph by specifying the upper/lower limit display value of the trend graph selected in the graph area.
The upper/lower limit value can be adjusted automatically or manually.
Adjusting graph automatically
Operating procedure
■Adjusting graph within the displayed period
<Before adjustment>
<After adjustment>
Maximum value of displayed period
Minimum value of displayed period
Select [Graph Operation] [Auto Adjust Upper/Lower Bound] [For Period on Display] (
■Adjusting within the entire period
<Before adjustment>
<After adjustment>
Maximum value of displayed period
Minimum value of displayed period
Select [Graph Operation] [Auto Adjust Upper/Lower Bound] [For All Period] (
84
8 USING TREND GRAPH FUNCTION
8.5 Operating Trend Graphs
).
).
Adjusting graph manually
For adjusting a graph manually, enter the upper/lower limit display value in the text box directly.
Data higher than the upper limit value are displayed as the upper limit value, and data less than the lower limit value are
displayed as the lower limit value.
■Specifying the value on the graph directly
Specify the upper/lower limit display value directly on each graph.
<Before adjustment>
<After adjustment>
Upper value
Lower value
Specify a value in
the text box.
Operating procedure
8
Double-click the area of graph to be adjusted in the graph area.
Or, select [Graph Operation] [Edit Upper/Lower Bound].
The text box to specify the upper/lower limit display value is also displayed by pressing the key.
8 USING TREND GRAPH FUNCTION
8.5 Operating Trend Graphs
85
■Editing upper and lower limit display values in batch
Edit the upper/lower limit display value in batch.
Operating procedure
Select [Graph Operation] [Edit Upper/Lower Bound in Batch].
■Entering upper/lower limit display value
The following table shows the applicable ranges of characters, number of characters, and values that can be entered in the
text box for the upper/lower limit display value.
86
Item
Description
Applicable characters
Numerals (0 to 9), alphabets ('E', 'e'), signs ('-', '+', '.'), and decimal point (period) (.)
Note that the alphabets ('E', 'e') are for the exponent expression.
Entered values are handled as values in a decimal fixed floating-point expression or decimal exponent expression.
Example:
Entering '111' is not considered as a binary number but as '111' in decimal.
Entering '11E3' is not considered as a hexadecimal number but as '11000' in a decimal exponent expression.
Applicable number of
characters
Up to 11 characters
Applicable range of value
Exponent expression: -1.797E+308 to -2.225E-308, 0, and 2.225E-308 to 1.797E+308
Fixed floating-point expression: -9999999999 to 99999999999
Note that entering the value, which is the upper limit display value the lower limit display value, is not applicable.
8 USING TREND GRAPH FUNCTION
8.5 Operating Trend Graphs
Widening/narrowing the display scale
Widen/narrow the selected trend graph in the graph area to the direction of longitudinal axis.
<Scaling down>
<Standard>
<Scaling up>
Operating procedure
Select the upper end/lower end of a trend graph with a mouse, and drag it upward/downward.
Or, select [Graph Operation] [Adjust Scale] [Widen Graph] (
)/[Narrow Graph] (
).
The scale can be adjusted by scrolling the mouse wheel while pressing the key.
Scrolling the mouse wheel up widens the graph, and scrolling it down narrows the graph.
Moving graph up/down/left/right
Move a trend graph displayed in the graph area up/down/left/right.
When logging data of more than one file is displayed on the same graph area, the trend graph can be moved left or right by
setting the time unit to be moved.
8
For the methods of adding logging data, refer to the following section.
Page 75 Adding/deleting data to/from graph legend area
Moving up/down
<Move down>
<Standard>
<Move up>
Operating procedure
Select a trend graph with a mouse and drag it upward/downward.
Or, select [Graph Operation] [Adjust Graph Location] [Move Up Graph] (
)/[Move Down Graph] (
).
• The graph can be moved by scrolling the mouse wheel while pressing the and key.
Scrolling the mouse wheel up moves the graph upward, and scrolling it down moves the graph downward.
• When logging data of more than one file is displayed, all of the data in the same file can be moved up or
down by dragging a graph line upward or downward with the key pressed.
8 USING TREND GRAPH FUNCTION
8.5 Operating Trend Graphs
87
Moving left/right
When logging data of more than one file is displayed with the time interval plot display format, the graph can be moved left or
right.
<Move to left>
<Standard>
<Move to right>
Operating procedure
Select a trend graph with a mouse and drag it to the left or right.
Or, select [Graph Operation] [Adjust Graph Location] [Move Graph to Left] (
)/[Move Graph to Right] (
).
Setting the time unit to move to the left/right
Set the time unit to move a graph to the left or right.
Operating procedure
Select a phase from 24 phases between [1ms] and [12h] from the combo box in the tool bar.
Or, select [Graph Operation] [Adjust Graph Location] [Horizontal Moving Quantity], and select a phase from 24 phases
between [1ms] and [12h].
Expanding/reducing time scale
Expand/reduce the time scale in the graph area.
<Scaling down>
<Standard>
<Scaling up>
Operating procedure
Select [Graph Operation] [Adjust Time Scale] [Expansion Time Scale] (
)/[Reduction Time Scale] (
).
The time scale can be adjusted by scrolling the mouse wheel while pressing the key.
Scrolling the mouse wheel up expands the time scale, and scrolling it down reduces the time scale.
88
8 USING TREND GRAPH FUNCTION
8.5 Operating Trend Graphs
Displaying consecutive previous/next trend graph
Normally, one Data logging file is displayed on a historical trend window. However, data in the previous/next Data logging file
can be displayed simultaneously by using this function. (Unicode text files, CSV files, and binary files)
This enables the consecutive view of divided Data logging files.
The following data are not supported by this function.
• Data logged by Data communication
• Data logged by Analog module
• Data logged by Energy Measuring Unit
• Sampling trace data
• Simulation result of FLEXIBLE HIGH-SPEED I/O CONTROL Module Configuration tool
Precautions
Previous/next Data logging file may not be displayed if any of the operations below is performed using a Data logging file
saved in a personal computer.
If the previous/next Data logging file cannot be displayed, create the same folder configuration as the one under '/LOGGING'
in an SD memory card or a CompactFlash card before the operation.
• A name of a folder or a Data logging file under the data name has been changed.
• The previous/next Data logging file has been deleted.
• File names of Data logging file are not in series.
8
8 USING TREND GRAPH FUNCTION
8.5 Operating Trend Graphs
89
Displaying previous graph
<Operating from the normal status>
Time axis
Data logging file configuration
Trend window
/LOGGING
<Before operation>
/LOG01
(Earlier)
00000001
File displayed
before the
operation
Data in
00000103.csv
are displayed
00000001.CSV
Time
00000101.CSV
Perform 'Show Previous Graph'
00000102.CSV
Previous graph
00000002
<After operation>
00000103.CSV
00000255.CSV
Files to be
displayed after
the operation
Data in
00000102.csv
are displayed
Data in
00000103.csv
are displayed
(Later)
LOG01.CSV
/LOG02
90
8 USING TREND GRAPH FUNCTION
8.5 Operating Trend Graphs
File
sampling
current data
Up to two files can be displayed
<Operating from the status when the previous graph is already displayed>
Time axis
Data logging file configuration
Trend window
/LOGGING
<Before operation>
/LOG01
(Earlier)
00000001
File displayed
before the
operation
00000001.CSV
Data in
00000103.csv
are displayed
Previous graph
Time
00000101.CSV
Data in
00000102.csv
are displayed
Perform 'Show Previous Graph'
00000102.CSV
00000002
<After operation>
00000103.CSV
Data in
00000101.csv are
displayed
00000255.CSV
(Later)
LOG01.CSV
/LOG02
Data in
00000102.csv
are displayed
8
Files to be
displayed after
the operation
Up to two files can be displayed
File
sampling
current data
Operating procedure
1.
2.
Select [Graph Operation] [Show Previous Graph] (
).
Click the [<<] button.
The previous graph cannot be displayed to a Data logging file of which serial number assigned to the file name is the smallest
number.
8 USING TREND GRAPH FUNCTION
8.5 Operating Trend Graphs
91
Displaying next graph
<Operating from the normal status>
Time axis
Data logging file configuration
Trend window
/LOGGING
<Before operation>
/LOG01
(Earlier)
00000001
File displayed
before the
operation
Data in
00000101.csv
are displayed
00000001.CSV
Time
00000101.CSV
Perform 'Show Next Graph'
00000102.CSV
Next graph
00000002
<After operation>
00000103.CSV
00000255.CSV
Files to be
displayed after
the operation
Data in
00000101.csv
are displayed
Data in
00000102.csv
are displayed
(Later)
LOG01.CSV
/LOG02
92
8 USING TREND GRAPH FUNCTION
8.5 Operating Trend Graphs
File
sampling
current data
Up to two files can be displayed
<Operating from the status when the next graph is already displayed>
Time axis
Data logging file configuration
Trend window
/LOGGING
<Before operation>
/LOG01
(Earlier)
00000001
File displayed
before the
operation
Data in
00000101.csv
are displayed
00000101.CSV
Data in
00000101.csv
are displayed
Time
00000101.CSV
Perform 'Show Next Graph'
00000102.CSV
00000002
<After operation>
Next graph
00000103.CSV
Data in
00000102.csv
are displayed
00000255.CSV
(Later)
LOG01.CSV
/LOG02
Data in
00000103.csv
are displayed
8
Files to be
displayed after
the operation
Up to two files can be displayed
File
sampling
current data
Operating procedure
1.
2.
Select [Graph Operation] [Show Next Graph] (
).
Click the [>>] button.
The next graph cannot be displayed to a Data logging file (a file that is sampling the current data) of which serial number is not
assigned to the file name.
8 USING TREND GRAPH FUNCTION
8.5 Operating Trend Graphs
93
8.6
Changing Display Items in Graph Area
This section explains the methods of changing the display items in the graph area.
Data on trend graphs can easily be checked by changing the display items.
Page 94 Displaying multiple cursor
Page 95 Displaying cursor labels
Page 95 Displaying data names
Page 96 Displaying grid
Page 96 Switching graph plot format
Page 97 Changing display of time scale labels
Page 97 Optimizing the display language of data names
• Information of display items in a graph area (except for a language specified in the language selection
setting) can be named and registered for reflecting it to other windows. (Page 101 Registering and
Reflecting Graphical Display Settings of Trend Windows)
• Graph display can be set to be reflected automatically when opening a window with the same data logging
setting next time. (Page 103 Reflecting Graph Display Automatically When Opening File)
Displaying multiple cursor
Switch the number of cursors displayed on a graph area.
Only a red cursor is displayed for a standard display, and a red cursor and a blue cursor are displayed for the Multiple cursor
function.
When the Multiple cursor function is activated, the difference information area is displayed.
For details on cursor operations, refer to the following section.
Page 73 Moving cursors
<Standard display>
<Multiple cursor display>
Red cursor
Blue cursor
Red cursor
Difference information area
Operating procedure
Select [Graph View] [Multiple Cursor] (
).
Precautions
When activating the Multiple cursor function, stop or pause the monitoring.
94
8 USING TREND GRAPH FUNCTION
8.6 Changing Display Items in Graph Area
Displaying cursor labels
Display or hide cursor labels in the graph area.
Labels for the red cursor are displayed at the right of the cursor, and labels for the blue cursor are displayed at the left of the
cursor.
<Hide>
<Display>
Red cursor
Red cursor
Blue cursor
Cursor label
Cursor label
Blue cursor
Operating procedure
Select [Graph View] [Cursor Label] (
).
Displaying data names
Display or hide data names in the graph area.
<Hide>
<Display>
8
Operating procedure
Select [Graph View] [Data Name].
When the realtime monitor window is activated, "Device/Label" is displayed as a display item instead of "Data
Name".
8 USING TREND GRAPH FUNCTION
8.6 Changing Display Items in Graph Area
95
Displaying grid
Display or hide the grid (vertical lines/horizontal lines) in the graph area.
<Hide>
<Display>
Operating procedure
[Graph View] [Grid] [Vertical Line]/[Horizontal Line]
Switching graph plot format
Switch a display format displayed on a historical trend window to the equidistance plot display format or the time interval plot
display format.
The equidistance plot display format is a format which displays the sampled data in an equal interval regardless of time.
The time interval plot display format is a format which displays the graph in a fixed time interval.
When displaying logging data of more than one file on the same graph area, the time interval plot display format is applied.
Displaying data with fixed time interval allows easier comparison between multiple data.
For the methods of adding logging data, refer to the following section.
Page 75 Adding/deleting data to/from graph legend area
<Equidistance plot format>
<Time interval plot format>
Display the graph in an equal interval regardless of time.
Display the graph in a fixed time interval.
Operating procedure
Select [Equidistance Plot]/ [Time Interval Plot] from the combo box (
) in the toolbar.
Or, select [Graph View] [Plot Format] [Equidistance Plot]/[Time Interval Plot].
96
8 USING TREND GRAPH FUNCTION
8.6 Changing Display Items in Graph Area
Changing display of time scale labels
Change a display of time scale labels on the graph area between the time display, date display, date and time display, and
index display.
Since Analog modules do not have time information in the logging data, only index display is available.
<Time display>
<Date and Time display>
<Date display>
<Index display>
Operating procedure
Select [Graph View] [Time Label] [Time]/[Date]/[Date and Time]/[Index].
Precautions
A logging file, in which any of "year", "month", "day", "hour", "minute", or "second" of the data line output format (can be set
with Configuration tool) is missing, is displayed with Index only. For data of which all of units following the missing unit are to
8
be output even when any of "hour", "minute", or "second" is missing; however, the time display/date display/date and time
display are available by treating the missing unit as '0'.
Optimizing the display language of data names
Optimize a language of data names displayed on a historical trend window.
Data names are displayed in a language of the characters used in a read file when displaying a Data logging file.
If characters of codes which can be used in multiple languages or characters of inapplicable languages are used for data
names, those characters may be corrupted.
If characters are corrupted, optimize the display language.
Operating procedure
Select [Graph View] [Set Language] [Chinese Simplified]/[Chinese Traditional]/[English]/[Japanese]/[Korean]/[Unicode
(UTF-8)].
8 USING TREND GRAPH FUNCTION
8.6 Changing Display Items in Graph Area
97
8.7
Changing Graph Appearance
This section explains the methods of changing graph appearance.
Page 98 Changing color and type of graph
Page 100 Highlighting graph
Page 100 Thickening graph line
• Graph display information can be named and registered to be reflected to other windows. (Page 101
Registering and Reflecting Graphical Display Settings of Trend Windows)
• Graph display can be set to be reflected automatically when opening a window with the same data logging
setting next time. (Page 103 Reflecting Graph Display Automatically When Opening File)
Changing color and type of graph
Change the settings of graphs (such as color and type), background color, and graph area (grid color, trigger ON color, trigger
OFF color) displayed on the trend window.
The following figure shows the settings that can be changed. The settings are changed on the "Graph Properties" screen.
Since the settings of background color, grid color, trigger ON color and trigger OFF color are common to all trend window, any
change is reflected to all the trend windows being displayed.
Color and type of graph
Trigger ON color
Trigger OFF color
Background color
Grid color
• Color and type of graph can be specified per data.
• "Custom colors" can be used by the Graphic Properties and the Event Properties in common.
(Page 99 Displaying Graph Properties screen)(Page 122 Displaying the Event Properties screen)
98
8 USING TREND GRAPH FUNCTION
8.7 Changing Graph Appearance
Displaying Graph Properties screen
Window
Select [Graph View] [Graph Properties].
Color button
Graph
legend area
Color buttons
8
Operating procedure
■Changing graph color
1.
2.
3.
Select a data whose graph color to be changed from the list of graph legend area.
Click the color button for "Line Color".
Select a color from "Basic colors" or "Custom colors" on the "Color" screen, and click the [OK] button.
■Changing graph line type
1.
2.
Select a data whose graph line type to be changed from the list of the graph legend area.
Select a type from "Line Type", and click the [OK] button.
■Changing graph area style (background color, grid color, trigger ON color, and trigger OFF
color)
1.
2.
Click the color button for the setting to be changed.
Select a color from "Basic colors" or "Custom colors" on the "Color" screen, and click the [OK] button.
8 USING TREND GRAPH FUNCTION
8.7 Changing Graph Appearance
99
Highlighting graph
Highlight the display area of the selected trend graph.
The highlighted display is also reflected to a graph printed on paper.
<Without highlight>
<Highlighted>
Operating procedure
Select [Graph View] [Graph Highlight].
Thickening graph line
Thicken the line of the selected trend graph.
<Regular line>
Operating procedure
Select [Graph View] [Bold line].
100
8 USING TREND GRAPH FUNCTION
8.7 Changing Graph Appearance
<Bold line>
8.8
Registering and Reflecting Graphical Display
Settings of Trend Windows
By registering the display information of a graph being displayed (including graph line color/type, upper/lower limit display
value, display items in graph area*1, highlighted display, bold display, display status of graph legend area) as 'graphical
display settings', it can be reflected to other trend windows.
*1
The setting information in the language selection setting is excluded. For the target items of 'graphical display settings', refer to the Point
in the following sections.
Page 76 Operating Trend Graphs
Page 94 Changing Display Items in Graph Area
Page 98 Changing Graph Appearance
Registering graphical display settings
Window
Select [Graph View] [Register Graphical Display Settings].
8
Operating procedure
Enter a name for "Register Name" and click the [Register Settings] button.
A new folder can be created under a folder being selected on the "Register Graphical Display Settings"
screen. Select the folder name and click the [New Folder] button.
8 USING TREND GRAPH FUNCTION
8.8 Registering and Reflecting Graphical Display Settings of Trend Windows
101
Operating graphical display settings
Window
Select [Graph View] [Operate Graphical Display Settings].
Operating procedure
■Reflecting registered graphical display settings to another trend window
Select a display setting to be reflected, and click the [Reflect settings] button.
■Deleting or renaming registered graphical display settings
Select a display setting to be renamed/deleted, and click the [Rename] button or the [Delete] button.
Importing/Exporting graphical display settings
• Importing files: All information included in an export file is imported. The Import operation discards a current window setting,
and then imports a file.
• Exporting files: The folder hierarchy information is also saved in an export file.
Window
Select [File] [Import and Export].
Operating procedure
1.
2.
3.
102
Select "Import Graphical Display Settings"/ "Export Graphical Display Settings", and click the [Next] button.
Specify a file path and a file name of the data to be imported/exported, and click the [Next] button.
Click the [Finish] button.
8 USING TREND GRAPH FUNCTION
8.8 Registering and Reflecting Graphical Display Settings of Trend Windows
8.9
Reflecting Graph Display Automatically When
Opening File
The auto reflect function stores the display information of a graph being displayed (including graph line color/type, upper/lower
limit display value, display items in graph area*1, highlighted display, bold display, and display status of graph legend area) for
each data logging setting, and enables it to be reflected to a graph automatically when opening the trend window next time.
Using this function saves time to configure the setting each time when displaying a graph with the same data logging setting
as same as last time.
*1
The setting information in the language selection setting is excluded. For the target items of 'graphical display settings', refer to the Point
in the following sections.
Page 76 Operating Trend Graphs
Page 94 Changing Display Items in Graph Area
Page 98 Changing Graph Appearance
Operating procedure
Select [Graph View] [Set Graph View by the Auto Reflect Function].
To restore the settings to the initial settings, initialize the graph display first, then set the auto reflect function
again.
8.10
Initializing Graph Display
This section explains how to restore the changed graph display to the initial state (the state in which graph appearance such
as the color has not been changed).
Operating procedure
1.
2.
Select a trend window to be initialized. (Activate it.)
Select [Graph View] [Initialize View].
Even if initializing the graph display to which the auto reflect function has already been set, the graph display
set in the auto reflect function is applied when opening the trend window with the same data logging setting
next time.
8 USING TREND GRAPH FUNCTION
8.9 Reflecting Graph Display Automatically When Opening File
103
8
8.11
RCPU
R Analog
Graph Display for Missing Data or Time Reversed
Data
QnUDVCPU
High Speed Data Logger
High Speed Data Communication
Q Analog
LCPU
L Analog
BOX Data Logger
Others
This section explains the graph display when the data is missing, or the time information is reversed.
Graph display for missing data
The missing data is displayed as two vertical dashed-dotted lines.
The equidistance plot display format: the time scale label is displayed as "**:**:**".
The time interval plot display format: the missing period is displayed as gray.
For more details on missing data, refer to manuals for respective modules.
<When displaying with equidistance plot format>
<When displaying with time interval plot format>
■Displaying value in the graph legend area for missing data
When the cursor is placed between the two dashed-dotted lines for missing data, "---" is displayed for the value on the graph
legend area.
■Displaying cursor value and difference information for missing data
When the cursor is placed between the two dashed-dotted lines for missing data, the cursor value and the cursor time on the
status bar are displayed as follows.
• Cursor Value:--• Cursor Time:****/**/** **:**:**.***
For the Multiple cursor display, when the red cursor or blue cursor is placed at the missing data area, the difference and span
fields in the difference information area are displayed as follows.
• Difference:--• Span:**:**:**.***,*** (For CPU module) **:**:**.***.*** (For Data logger/Data communication)
Graph display for reversed data
When displaying a graph with the time interval plot display format, the reversed period is displayed as oblique stripe, in case
data time is reversed owing to the time change of a module.
104
8 USING TREND GRAPH FUNCTION
8.11 Graph Display for Missing Data or Time Reversed Data
8.12
RCPU
R Analog
Displaying Abnormal Graphs
QnUDVCPU
High Speed Data Logger
High Speed Data Communication
Q Analog
LCPU
L Analog
BOX Data Logger
Others
An abnormal graph is displayed when the value of data is a nonnumeric or infinite value.
When a float (single precision, double precision) is expressed as a numeric value, a bit string that is not recognized as a
numeric value is handled as a nonnumeric value.
By the scaling function of Data logger/Data communication, values of data may become plus infinite/minus infinite values.
Graph display on trend window
• The graph is not displayed while nonnumeric values continues.
• The cursor labels of the graph are not displayed while nonnumeric values continues.
• For the plus infinite value, the graph attaches to the upper limit display value.
• For the minus infinite value, the graph attaches to the lower limit display value.
8
Cursor values displayed in the graph legend area
• Nonnumeric value: NaN
• Plus infinite value: +Inf
• Minus infinite value: -Inf
Cursor value and difference information displayed on status bar of trend window
The cursor value on the status bar, and "Difference (Blue Red)" and "Value (Blue)" in the difference information area are
also displayed as follows:
• Nonnumeric value: NaN
• Plus infinite value: +Inf
• Minus infinite value: -Inf
8 USING TREND GRAPH FUNCTION
8.12 Displaying Abnormal Graphs
105
8.13
RCPU
Handling BCD Type Incorrect Values
R Analog
QnUDVCPU
High Speed Data Logger
High Speed Data Communication
Q Analog
LCPU
L Analog
BOX Data Logger
Others
When the values of 16 bit BCD type integer and 32 bit BCD type integer exceed the maximum value, they are handled as
incorrect values.
The following explains the expression of incorrect values on the trend window.
Graph display on the trend window
• The graph is not displayed while incorrect values continues.
• The cursor labels of the graph is not displayed while incorrect values continues.
• For the Multiple cursor display, the horizontal cursor that indicates the intersection with the graph is not displayed.
Cursor values displayed in the graph legend area
When the cursor is placed at the plot of incorrect values, "---" is displayed for values in the graph legend area.
Cursor value and difference information displayed on status bar of trend window
When the cursor is placed at the plot of incorrect values, "---" is displayed for the cursor value field on the status bar.
"---" is displayed for the cursor value field on the status bar for the blue cursor for the Multiple cursor display as well.
"---" is also displayed for the difference field when the red cursor/blue cursor is placed at the incorrect value.
106
8 USING TREND GRAPH FUNCTION
8.13 Handling BCD Type Incorrect Values
9
RCPU
USING EVENT MONITORING FUNCTION
QnUDVCPU
R Analog
9.1
High Speed Data Logger
High Speed Data Communication
Q Analog
LCPU
L Analog
BOX Data Logger
9
Others
Overview
This function is for displaying events sampled by the event logging function of Data logger in a list format.
The following display methods are available in the event monitoring function.
• Historical event list
• Realtime event list
Modules supporting the Historical event list/Realtime event list are shown below.
: Supported, : Not supported
Series
Supported module
Historical event list
Realtime event list
MELSEC iQ-R series
RCPU
Analog module
QnUDVCPU
Analog module
High Speed Data Logger Module
High Speed Data Communication Module
LCPU
Analog module
BOX Data Logger
MELSEC-Q series
MELSEC-L series
Others
9 USING EVENT MONITORING FUNCTION
9.1 Overview
107
Historical event list
RCPU
R Analog
QnUDVCPU
High Speed Data Logger
Q Analog
High Speed Data Communication
LCPU
L Analog
BOX Data Logger
Others
Event logging files saved in a CompactFlash card in Data logger are displayed.
Saved past events can be confirmed anytime.
■Displaying data sampled by Data logger
Data logging file
CF
CompactFlash card
BOX Data Logger
High Speed Data Logger Module
Page 112 Displaying logging files saved with the event logging function of Data logger
■Displaying data saved in a personal computer or in a memory medium connected to a
personal computer
Event logging file
Folder
CompactFlash card
Page 112 Displaying Event logging files saved in a personal computer
Realtime event list
RCPU
R Analog
QnUDVCPU
High Speed Data Logger
High Speed Data Communication
Q Analog
LCPU
L Analog
BOX Data Logger
Others
The most recent events sampled by the Data logger are displayed.
Events are constantly updated so that the event history from the start of monitoring up to the present time can be checked.
To display the Realtime event list, a personal computer and a Data logger need to be connected to each other online.
Event logging data
Samples events in real time, and displays them.
BOX Data Logger
High Speed Data Logger Module
Page 113 Displaying ongoing events (Realtime event list)
108
9 USING EVENT MONITORING FUNCTION
9.1 Overview
9.2
RCPU
Screen Configuration
R Analog
QnUDVCPU
High Speed Data Logger
High Speed Data Communication
9
Q Analog
LCPU
L Analog
BOX Data Logger
Others
This section explains the screen configuration of event windows.
Event window
Title bar
Event list
Status bar
Up to 2000 realtime events of data is displayed.
Displayed items
Item
Title bar
Description
Reference
• Historical event list: logging file names Historical Event (module name)
• Realtime event list: logging setting name Realtime Event (module name) [monitoring
status]
Event list
Displays a list of events occurred.
Page 110 Event list
Status bar
Displays a source from which an Event logging file is obtained and the communication status
with Data logger.
Page 111 Status bar
9 USING EVENT MONITORING FUNCTION
9.2 Screen Configuration
109
Event list
Filter row
Displayed items
Item
Description
Reference
Date*1
Displays the day and time of occurrence/restoration of an event.
No.
Event Logging Name
Displays an event logging name and its number set with High Speed Data Logger Module
Configuration Tool and BOX Data Logger Configuration Tool.
Status
Displays occurrence/restoration with the following values.
• 1: Occurrence
• 0: Restoration
Comment
Displays an occurrence comment/restoration comment.
Monitoring Data
Displays a name and value of monitoring data in the following format.
(Event logging name) = (Event value); (Event logging name) = (Event value); to (Event logging
name) = (Event value)
Filter row
Specify a filtering condition.
Page 114 Displaying only events that
meet specific conditions (Filtering)
*1
110
Since the date and time in the "Date" column depends on the time setting for CPU module, they may be different from the time on the
personal computer in use.
9 USING EVENT MONITORING FUNCTION
9.2 Screen Configuration
Status bar
9
<For Historical event (sorting)>
(1)
(2)
(4)
<For Realtime event>
(2)
(3)
(4)
Displayed items
Item
Description
(1) Sorting/filtering performance
status
Displays the performance status while the Sorting/Filtering function is performed.
(2) Source to obtain Event logging
file and file type
Displays the source and file type of the Event logging file being displayed with respective characters and colors.
Displayed characters
■Historical event list
Displays the source to obtain the Event logging file being displayed.
• Connecting to High Speed Data Logger Module:
High Speed Data Logger Module (IP address or "Direct Connection"):/file path
• Connecting to BOX Data Logger:
BOX Data Logger (IP address or "Direct Connection"):/file pass
• A data logging file is saved in a personal computer or a memory medium connected to it:
File path
■Realtime event list
Displays an IP address of Data logger being communicated with, or "Direct Connection".
Background color
Logging file type
Background color
High Speed Data Logger Module
Light yellow
BOX Data Logger
Lime
(3) Communication status
Displays "Online" or "Offline". (For the Realtime event list only)
(4) Number of items
Displays the number of events displayed in the event list in the following format.
Number of items: (number of items being displayed)/(total number of events)
9 USING EVENT MONITORING FUNCTION
9.2 Screen Configuration
111
9.3
Displaying Event List
This section explains how to display events sampled by Data logger in the event list.
The total number of records that can be displayed on a trend graph and in an event list is 1000001.
Page 112 Displaying logged events (Historical event list)
Page 113 Displaying ongoing events (Realtime event list)
Page 113 Operating Realtime event list monitoring status
Displaying logged events (Historical event list)
RCPU
R Analog
QnUDVCPU
High Speed Data Logger
High Speed Data Communication
Q Analog
LCPU
L Analog
BOX Data Logger
Others
Display the specified file saved in a module or a memory medium in the event list.
Saved file
Description
Logging file saved with the event logging
function of Data logger
Display the Event logging file saved in a CompactFlash card with the event logging function of Data logger
in the Historical event list.
Event logging files saved in a personal computer
Display Event logging file saved in a personal computer or a memory medium connected to it in the
Historical event list.
For the method of saving logging file to a personal computer or a memory medium, refer to the following
chapter.
Page 123 SAVING LOGGING FILES TO PERSONAL COMPUTER
Operating procedure
■Displaying logging files saved with the event logging function of Data logger
1.
2.
3.
4.
Select [Online] [Open Logging File] (
).
Select "High Speed Data Logger Module" or "BOX Data Logger" on the "Connection Destination" screen.
Specify the module to be connected and its route on the "Transfer Setup" screen.
Select an Event logging file (*.csv, or *.bin) from the list on the "File Browser" screen, and click the [Open File] button.
(More than one file cannot be selected.)
■Displaying Event logging files saved in a personal computer
1.
2.
Select [File] [Open] (
).
Drag and drop the Event logging file to the main widow.
(Example: Displaying "EVT02.CSV" on the desktop)
112
9 USING EVENT MONITORING FUNCTION
9.3 Displaying Event List
9
OK
OK
Displaying ongoing events (Realtime event list)
RCPU
R Analog
QnUDVCPU
High Speed Data Logger
High Speed Data Communication
Q Analog
LCPU
L Analog
BOX Data Logger
Others
Display the specified event logging settings of a module in the event list.
Operating procedure
1.
2.
3.
4.
Select [Online] [Realtime Monitor] (
).
Select "High Speed Data Logger Module" or "BOX Data Logger" on the "Transfer Setup" screen.
Click the [Event Logging] tab on the "Select Logging Setting" screen.
Select a event logging setting to be set from the list, and click the [Open] button.
Operating Realtime event list monitoring status
RCPU
R Analog
QnUDVCPU
High Speed Data Logger
High Speed Data Communication
Q Analog
LCPU
L Analog
BOX Data Logger
Others
Change the monitoring status on the Realtime event list.
Operating procedure
■Starting monitoring
• Select [Online] [Begin Monitor] (
).
This operation starts the communication with a module, and turns the monitoring status from Stop to Run.
■Stopping monitoring
• Select [Online] [End Monitor] (
).
This operation disconnects the communication with a module, and stops updating the event list.
9 USING EVENT MONITORING FUNCTION
9.3 Displaying Event List
113
9.4
RCPU
Operating Event List
R Analog
QnUDVCPU
High Speed Data Logger
High Speed Data Communication
Q Analog
LCPU
L Analog
BOX Data Logger
Others
The following functions are available to display the event list depending on the intended purpose.
Page 114 Displaying only events that meet specific conditions (Filtering)
Page 115 Sorting events (Sorting)
Page 116 Optimizing the display language of event logging names and comments
Page 117 Displaying consecutive previous/next event
Displaying only events that meet specific conditions (Filtering)
Display events displayed in the event list according to the specific conditions (filtering condition) by each column.
When multiple conditions are specified, only events that meet all of the conditions are displayed in the event list.
A new event which occurs after filtering is displayed in an event list only if it matches the filtering conditions.
Filtering is executed with not perfect match but partial match of a string specified in a cell of the filter row.
Ex.
Specifying 'Voltage error' as a filtering condition for the "Event Logging Name" column.
<Before filtering>
<After filtering>
Operating procedure
1.
2.
Select [Event] [Filter] (
).
Set a filtering condition to the filter row.
■Filtering by "Date"
1.
2.
*1
Select "Enable Filter" on the "Filter Period Settings" screen.
Select the dates for "Filtering Begin Date" and "Filtering End Date" *1, and click the [OK] button.
Without specifying "Filtering Begin Date", all of events older than date and time specified in "Filtering End Date" are displayed. Without
specifying "Filtering End Date", all of events newer than date and time specified in "Filtering Begin Date" are displayed.
■Filtering by an item selected from a list box
1.
2.
114
Click a cell in the filter row.
From the list box, select an item to filter events by. (List box selection is not available in the "Monitoring Data" column.)
9 USING EVENT MONITORING FUNCTION
9.4 Operating Event List
■Filtering by an item input directly
1.
2.
Click a cell in the filter row, and enter a filtering condition directly.
9
Press the key.
■Clearing filtering conditions
Perform any of the operations below:
• Select "Disable Filter" on the "Filter Period Settings" screen.
• Select "(Empty)" in a list box.
• Clear a cell of the filter row.
• Hide the filter row.
Sorting events (Sorting)
Sort events being displayed in the event list in ascending order () or descending order () by the value of each column.
Events which occurred after the sort are inserted to the list in a status maintaining the sorting order.
Ex.
Sorting "Event Logging Name" in ascending order ()
<Before sorting>
<After sorting>
Operating procedure
Select [Event] [Sort by] [Date]/[No.]/[Event Logging Name]/[Status]/[Comment]/[Monitoring Data].
Or, click the item name displayed on the top of each column.
9 USING EVENT MONITORING FUNCTION
9.4 Operating Event List
115
Optimizing the display language of event logging names and
comments
Optimize a language of event logging names and comments displayed on a historical event window.
Event logging names and comments are displayed in a language of the characters used in a read file when displaying an
Event logging file. If characters of codes which can be used in multiple languages or characters of inapplicable languages are
used for data names, those characters may be corrupted.
If characters are corrupted, optimize the display language.
Operating procedure
Select [Event] [Set Language] [Chinese Simplified]/[Chinese Traditional]/[English]/[Japanese]/[Korean]/[Unicode(UTF8)].
Precautions
The filtering needs to be disabled when switching the language.
Sorting is cleared when switching the language while events have been sorted.
116
9 USING EVENT MONITORING FUNCTION
9.4 Operating Event List
Displaying consecutive previous/next event
Normally, one Event logging file is displayed on a historical event window. However, data in the previous/next Event logging
file can be displayed simultaneously by using this function. (CSV files and binary files)
This function enables the consecutive view of divided Event logging files.
Precautions
Previous/next Event logging file may not be displayed if any of the operations below is performed using an Event logging file
saved in a personal computer.
If the previous/next Event logging file cannot be displayed, create the same folder configuration as the one under "/EVENT" in
a CompactFlash card before operating.
• A name of a folder or an Event logging file following the name has been changed.
• The previous/next Event logging file has been deleted.
• File names of Event logging files are not in series.
Displaying previous event
<Operating from the normal status>
Time axis
Event logging file configuration
Event window
/EVENT
/EVT01
<Before operation>
(Earlier)
0000001
File displayed
before the
operation
00000001.CSV
Events in
00000103.csv are
displayed
Time
00000101.CSV
Perform 'Show Previous Event'
00000102.CSV
Previous events
0000002
<After operation>
00000103.CSV
00000255.CSV
Files to be
displayed after
the operation
Events in
00000102.csv are
displayed
(Later)
Up to two files
can be
displayed
EVT01.CSV
File sampling
current events
Events in
00000103.csv are
displayed
/EVT02
9 USING EVENT MONITORING FUNCTION
9.4 Operating Event List
117
9
<Operating from the status when the previous event logging file is already displayed>
Time axis
Event logging file configuration
Event window
/EVENT
<Before operation>
/EVT01
(Earlier)
0000001
File displayed
before the
operation
Events in 00000102.csv
are displayed
00000001.CSV
Previous events
Events in 00000103.csv
are displayed
Time
00000101.CSV
00000102.CSV
Perform 'Show Previous Event'
0000002
<After operation>
00000103.CSV
Events in 00000101.csv
are displayed
00000255.CSV
(Later)
Files to be
displayed after
the operation
EVT01.CSV
Up to two files can
be displayed
File sampling
current events
/EVT02
Events in 00000102.csv
are displayed
Operating procedure
Select [Event] [Show Previous Event].
• The previous event cannot be displayed to an Event logging file of which serial number assigned to the file name is the
smallest number.
118
9 USING EVENT MONITORING FUNCTION
9.4 Operating Event List
Displaying next event
9
<Operating from the normal status>
Time axis
Event logging file configuration
Event window
/EVENT
/EVT01
<Before operation>
(Earlier)
0000000
File displayed
before the
operation
00000001.CSV
Events in
00000101.csv
are displayed
Time
00000101.CSV
Perform 'Show Next Event'
00000102.CSV
Next events
0000000
<After operation>
00000103.CSV
00000255.CSV
Files to be
displayed after
the operation
Events in
00000101.csv
are displayed
(Later)
Up to two files
can be
displayed
EVT01.CSV
/EVT02
File sampling
current events
Events in
00000102.csv
are displayed
9 USING EVENT MONITORING FUNCTION
9.4 Operating Event List
119
<Operating from the status when the next event logging file is already displayed>
Time axis
Event logging file configuration
Event window
/EVENT
<Before operation>
/EVT01
(Earlier)
0000000
File displayed
before the
operation
00000001.CSV
Events in
00000101.csv
are displayed
Events in
00000102.csv
are displayed
Time
00000101.CSV
00000102.CSV
0000000
Perform 'Show Next Event'
<After operation>
00000103.CSV
00000255.CSV
(Later)
EVT01.CSV
Next events
Files to be
displayed after
the operation
Events in
00000102.csv
are displayed
Up to two files
can be
displayed
File sampling
current events
/EVT02
Events in
00000103.csv
are displayed
Operating procedure
Select [Event] [Show next Event].
• The next event cannot be displayed to an Event logging file (a file that is sampling the current events) of which serial
number is not assigned to the file name.
• Sorting is cleared when the function to show previous/next event is performed while events have been sorted.
120
9 USING EVENT MONITORING FUNCTION
9.4 Operating Event List
9.5
RCPU
Changing Display Settings of Event List
QnUDVCPU
R Analog
High Speed Data Logger
High Speed Data Communication
Q Analog
LCPU
L Analog
BOX Data Logger
9
Others
This section explains how to customize font color, background color, and display items in the event list.
The following figure shows customizable settings in an event list. The settings are changed on the "Event Properties" screen.
Since the settings of the Event Properties are common to all event windows, any change is reflected to all the event windows
being displayed.
Occurrence color
Restoration color
Switching display/hide
Grid color
Background color
"Custom colors" can be used by the Event Properties and the Graphic Properties in common.
(Page 99 Displaying Graph Properties screen) (Page 122 Displaying the Event Properties screen)
9 USING EVENT MONITORING FUNCTION
9.5 Changing Display Settings of Event List
121
Displaying the Event Properties screen
Window
Select [Event] [Event Properties].
Color buttons
Operating procedure
■Changing color settings (occurrence color, restoration color, background color, grid color)
1.
2.
Click a color button of an item to be changed.
Select a color from "Basic colors" or "Custom colors" on the "Color" screen, and click the [OK] button.
■Changing display items settings (No., event logging name, status, comment, monitoring data)
Clear the item not to display in the event list in "Display Item Settings".
122
9 USING EVENT MONITORING FUNCTION
9.5 Changing Display Settings of Event List
10 SAVING LOGGING FILES TO PERSONAL
COMPUTER
RCPU
R Analog
QnUDVCPU
High Speed Data Logger
High Speed Data Communication
Q Analog
LCPU
L Analog
BOX Data Logger
10
Others
This chapter explains how to save logging files in a memory card inserted in a module to a personal computer.
The saved files can be checked by the Historical trend graph or the Historical event list.
Operating procedure
1.
2.
3.
Select [Online] [Save Logging File to PC] (
).
Select an equipment from which logging files are obtained on the "Connection Destination" screen.
Specify a module to be connected and the connection method on the screen shown below:
• RCPU, MELSEC iQ-R series analog module: "Transfer Setup" screen (Page 46 Connecting to RCPU)
• QnUDVCPU/LCPU, MELSEC-Q/L analog module: "Transfer Setup" screen (Page 47 Connecting to QCPU/LCPU)
• Data logger: "Transfer Setup" screen (Page 50 Connecting to Data logger/Data communication)
4.
Select the file to be saved from a list on the "Logging File" screen, and click the [Save to PC] button. (Multiple files can be
selected.)
5.
Specify the destination to save the file.
• Saving 1 file: Save the file by specifying the file name.
• Saving more than 1 file: Save multiple files by specifying the folder at once. The files cannot be saved in different folders.
The file name cannot be changed.
Precautions
The file format of a Unicode text file/CSV file saved with the Logging file save function explained in this chapter differs from
that of those files saved with the displayed data/event save function explained in the after-mentioned chapter, "Saving
displayed data/events". (Page 128 SAVING DISPLAYED DATA/EVENTS)
For more details on file formats of Unicode text file/CSV file obtained directly from a module and saved with the Logging file
save function, refer to manuals for respective modules.
Updating other monitoring data may be delayed in the following cases since saving Data logging file requires
time:
• Saving a Data logging file while the data logging function is being performed.
• Saving a large-volume Data logging file
10 SAVING LOGGING FILES TO PERSONAL COMPUTER
123
MEMO
124
10 SAVING LOGGING FILES TO PERSONAL COMPUTER
11 USING WINDOWS/FOLDERS DISPLAYED IN
PAST
RCPU
R Analog
11.1
QnUDVCPU
High Speed Data Logger
High Speed Data Communication
Q Analog
LCPU
L Analog
BOX Data Logger
Others
Overview
The window/folder information of the windows being displayed can be saved with the Frequently-used window configuration
11
function, the Resent windows function, or the Recent folders function to redisplay them easily next time.
Function name
Description
Frequently-used
Window Configuration
Names the information (listed in the right
column) of all the windows being displayed,
and adds them to the menu.
The added window can be redisplayed easily
from the menu.
• Window layout of each window
• Connection information with a module and
information of the logging file save
destination
• All of the data and events being displayed
• Displaying trend window*1
• Displaying event window*2
• Sorting status and filtering condition of an
event list
Page 126 Adding/Restoring
Frequently-Used Window
Configuration to Menu
Recent Windows
Adds all the windows being displayed to the
menu automatically.
The added window can be redisplayed easily
from the menu.
• Connection information with a module and
information of the logging file save
destination
• All of the data and events being displayed
• Displaying trend window*1
• Displaying event window*2
• Sorting status and filtering condition of an
event list
Page 127 Redisplaying RecentlyUsed Windows
Recent Folders
Adds a folder specified when opening or
saving a file to the menu automatically.
The added folder can be opened easily from
the menu to select a logging file.
Save destination of data and events being
displayed
• Directory path in a personal computer
• Directory path of a memory card inserted in
a module
Page 127 Redisplaying RecentlyUsed Folders
*1
*2
Target settings to be saved
Reference
Back ground color, grid color, and trigger ON/OFF color of trend window are excluded.
Background color, grid color, occurrence/restoration color, and display selection status of each column are excluded.
11 USING WINDOWS/FOLDERS DISPLAYED IN PAST
11.1 Overview
125
11.2
Adding/Restoring Frequently-Used Window
Configuration to Menu
Trend windows or event windows displayed frequently can be added to the menu as frequently-used window configurations,
and redisplayed easily.
Frequently-used window configurations can be exported and used for other logon users or a personal computer.
Operating procedure
■Adding a frequently-used window configuration to the menu
1.
2.
3.
Arrange a window configuration to be added as a frequently-used window configuration.
Select [Window] [Frequently-used Window Configuration] [Add to Frequently-used Window Configuration].
Enter a name for "Name" on the "Add to Frequently-used Window Configuration" screen, and click the [OK] button.
A new folder can be created under the folder being selected on the "Add to Frequently-used Window
Configuration" screen. Select a folder name and click the [New Folder] button.
■Restoring a frequently-used window configuration
Select [Window] [Frequently-used Window Configuration] [(name of a frequently-used window configuration)].
■Deleting, renaming, or sorting a frequently-used window configuration
Select [Window] [Frequently-used Window Configuration] [(name of a frequently-used window configuration)], and rightclick it. Then, select [Delete]/[Rename]/[Sort by Name] from the shortcut menu.
■Changing order of frequently-used window configurations in the menu
Select [Window] [Frequently-used Window Configuration] [(name of a frequently-used window configuration)], and drag
it to the desired position.
Importing/Exporting frequently-used window configurations
• Importing: All information included in an export file is imported.
The import operation discards all registered frequently-used window configurations, and then imports a file.
• Exporting: The folder hierarchy information is also saved in an export file.
Window
Select [File] [Import and Export].
Operating procedure
1.
Select "Import Frequently-used Window Configurations"/"Export Frequently-used Window Configurations", and click the
[Next] button.
2.
Specify a path of the file to be imported or a path and a name of the file to which exported data is written, and clock the
[Next] button.
3.
126
Click the [Finish] button.
11 USING WINDOWS/FOLDERS DISPLAYED IN PAST
11.2 Adding/Restoring Frequently-Used Window Configuration to Menu
11.3
Redisplaying Recently-Used Windows
Trend windows or event windows displayed recently can be added to the menu automatically as recent windows, and
redisplayed easily.
Up to nine recent windows can be saved by each of the window types. The chronologically oldest window setting is removed
from the menu when the tenth window is added. Only one realtime monitor window can be saved.
If data in a memory card is changed after the setting of a window being displayed has been saved, the window configuration
may not be restored with the Recent window function.
11
Operating procedure
Select [Window] [Recent Windows] [Historical Trend]/[Realtime Trend]/[Historical Event]/[Realtime Event]/[Realtime
Monitor].
11.4
Redisplaying Recently-Used Folders
Folders used recently can be added to the menu automatically as recent folders, and can be easily opened.
Up to nine recent folders can be saved. The chronologically oldest recent folder setting is removed from the menu when the
tenth recent folder is added.
Operating procedure
■Opening a logging file in a personal computer
Select [File] [Recent Folders].
■Opening a logging file in a memory card inserted in a module
Select [Online] [Recent Folders].
11 USING WINDOWS/FOLDERS DISPLAYED IN PAST
11.3 Redisplaying Recently-Used Windows
127
12 SAVING DISPLAYED DATA/EVENTS
RCPU
R Analog
QnUDVCPU
High Speed Data Logger
High Speed Data Communication
Q Analog
LCPU
L Analog
BOX Data Logger
Others
This function is for saving data being displayed in trend windows and events being displayed in event windows to a personal
computer as Unicode test file, CSV file, or image file (BMP/JPG/PNG).
The saved Unicode text file and CSV file can be displayed on the trend window and event window.
12.1
Save Target Data/Event
The data and event being displayed on the active trend window and event window can be saved.
The Realtime trend graph/Realtime monitor graph can be saved in CSV format/Unicode format only when the monitoring
process is stopped or the graph drawing is suspended.
When two Data logging files or two Event logging files are consecutively displayed, their data or events can be
saved to one file.
12.2
RCPU
R Analog
Saving Displayed Data
QnUDVCPU
High Speed Data Logger
High Speed Data Communication
Q Analog
LCPU
L Analog
BOX Data Logger
Others
This section explains how to save data being displayed on the active trend window to any of the following files.
File format
Reference
Unicode text file
Page 128 Saving displayed data to Unicode text file
CSV file
Page 132 Saving displayed data to CSV file
Image file
Page 144 Saving displayed trend graphs to image file
Saving displayed data to Unicode text file
RCPU
R Analog
QnUDVCPU
High Speed Data Logger
Q Analog
High Speed Data Communication
LCPU
L Analog
BOX Data Logger
Others
When using RCPU, save data being displayed in the graph area of active trend window to a Unicode text file.
The data to be saved are as shown below. Data removed from the graph area are not saved.
• Historical trend graph: Data of a Data logging file being displayed are saved.
• Realtime monitor graph: Data received from the start of monitoring to the pause/stop of graph drawing are saved.
Operating procedure
1.
2.
128
Select [File] [Save As] [Save Unicode Text File] (
Enter a file name, and click the [Save] button.
12 SAVING DISPLAYED DATA/EVENTS
12.1 Save Target Data/Event
).
Format specification of Unicode text file
■RCPU
The Unicode text file format explained in this section differs from the Unicode text file format obtained from RCPU. For details
on the Unicode text file format of RCPU, refer to the following manual.
MELSEC iQ-R CPU Module User's Manual (Application)
Item
Description
Delimiter
Tab
Linefeed code
CRLF (0x0D, 0x0A)
Character code
Unicode
Character encoding method
UTF-16 (little-endian)
Filed data
""(double quotes) without enclosure
Tab cannot be used for each data
Number of rows
For the data logging file: Up to 131005 rows (data rows + 5)
For realtime monitor graph: Up to 1000005 (data rows +4)
12
Ex.
When opening a logging file (*.txt) in Excel
File information row
Comment row
Data type information row
Data name row
Device comment row
Data row
Output data of rows/
columns
Column number
Column name
Output data
■File information row
1st column
File type
File type of output file
Fixed value: [LOGGING]
2nd column
Type information_file version
Version of output file
Fixed value:
• RCPU_1
3rd column
Number for data type
information row
Number indicating the data type information row
Fixed value:
• With comment row: 3
• Without comment row: 2
4th column
Number for data name row
Number indicating the data name row
Fixed value:
• With comment row: 4
• Without comment row: 3
5th column
Number for device comment
row
Number indicating the device comment row
Fixed value:
• With comment row: 5
• Without comment row: 4
6th column
Number for data starting rows
Starting number of data rows
Fixed value:
• With comment row: 6
• Without comment row: 5
7th column
Number for comment row*1
Number indicating the comment row
Fixed value: 2
12 SAVING DISPLAYED DATA/EVENTS
12.2 Saving Displayed Data
129
Output data of rows/
columns
Column number
Column name
Output data
■Data type information
row
1st column
Date and time column*2
Data type of date and time column
Fixed string: DATETIME[YYYY/MM/DD hh:mm:ss
2nd column
Millisecond column*2
Data type of millisecond column of date and time
Fixed string: ms]
3rd column
Data sampling interval column
Data type of data sampling interval column
Fixed string: INTERVAL
4th column
Execution step number column
Data type of execution step number column
Fixed string: STEP NO.
5th column
Execution program number
column
Data type of execution program number column
Fixed string: PROGRAM NO.
6th column
Execution program name
column
Data type of execution program name column
Fixed string: PROGRAM NAME
7th column
Index column
Index column
Fixed string: INDEX
8th column and later
Data column
Data type of sampled data
Output format: Data type output string [Additional information]
Page 144 Data type output string
Last column
Trigger information column
Fixed string regardless of continuous logging/trigger logging
Output format: TRIGGER[(trigger ON string)]*3
1st column
Date and time column*2
Title of the Date and time column
Fixed string: TIME
2nd column
Millisecond column*2
Title of millisecond column of date and time
Fixed string: msec
3rd column
Data sampling interval column
Title of the Data sampling interval column
Fixed string: INTERVAL[s]
4th column
Execution step number column
Title of execution step number column
Fixed string: STEP NO.
5th column
Execution program number
column
Title of execution program number column
Fixed string: PROGRAM NO.
6th column
Execution program name
column
Title of execution program name column
Fixed string: PROGRAM NAME
7th column
Index column
Title of the Index column
Fixed string: INDEX
8th column and later
Data column
Title of the Data column
Output format: Device number or device labels
Last column
Trigger information column
Title of the Trigger information column
Fixed string: Trigger
■Data name row
■Device comment row
130
1st column
Date and time column
Blank
2nd column
Millisecond column
Blank
3rd column
Data sampling interval column
Blank
4th column
Execution step number column
Blank
5th column
Execution program number
column
Blank
6th column
Execution program name
column
Blank
7th column
Index column
Blank
8th column and later
Data column
When "Display comments" is selected in the "data setting"
Output comments of the specified comment number
When "Display comments" is not selected in the "data setting", or for the
realtime monitor window
Blank
Last column
Trigger information column
Blank
12 SAVING DISPLAYED DATA/EVENTS
12.2 Saving Displayed Data
Output data of rows/
columns
Column number
Column name
Output data
■Data row
1st column
Date and time column*2
Date and time information
Output format: YYYY/MM/DD hh:mm:ss
2nd column
Millisecond column*2
Value of millisecond
3rd column
Data sampling interval column*4
Value of data sampling interval
4th column
Execution step number
column*4
Value of execution step number
Output format: Integer value
5th column
Execution program number
column*4
Value of execution program number
Output format: Integer value
6th column
Execution program name
column*4
Execution program name
Output format: STRING (program name)
7th column
Index column*5
Value of index
Output format: Integer value
8th column and later
Data column
Value of sampled device
Output format: Value corresponds to the type in the data type information
row
Last column
Trigger information column
Information at trigger generation
Output format: String specified by configuration tool
*1
*2
*3
*4
*5
12
This column is not output when the comment row is not output to the logging data, or for the realtime monitor window.
When the data, whose Date and time column is set not to output by the configuration tool, is saved to a Unicode text file, the Date and
time column and the Millisecond column are not output.
For the continuous logging, or for the realtime monitor window, "*" is output for "trigger ON string".
When the data, whose columns are set not to output by the configuration tool, is saved to a Unicode text file, the column corresponds to
those not-output items is not output, and only the tab character as the delimiter is output.
When the data, whose indexes are set not to output by the configuration tool, is saved to a Unicode text file, the indexes with starting
from 1 are automatically output.
■Data type output string
Data type
Data type output string
Output data
Bit
BIT
BIT[(ON string);(OFF string)]*1
Word [unsigned]
USHORT
USHORT[DEC.0]
Word [signed]
SHORT
SHORT[DEC.0]
Double word [unsigned]
ULONG
ULONG ULONG[DEC.0]
Double word [signed]
LONG
LONG LONG[DEC.0]
FLOAT (Single Precision)
FLOAT
FLOAT[DEC.7]*2
FLOAT (Double Precision)
DOUBLE
DOUBLE[DEC.14]*2
16bit BCD
BCD16
BCD16[DEC.0]
32bit BCD
BCD32
BCD32[DEC.0]
*1
*2
On a historical trend window on which a Unicode text file is opened, a trigger ON string and trigger OFF string are displayed according
to the information in the file.
The number of digits after decimal point indicates the maximum number of digits, therefore all of the specified number of digits are not
always displayed.
(Example) For 1.2345, '1.2345' is output, not '1.2345000'.
12 SAVING DISPLAYED DATA/EVENTS
12.2 Saving Displayed Data
131
Saving displayed data to CSV file
RCPU
R Analog
QnUDVCPU
High Speed Data Logger
High Speed Data Communication
Q Analog
LCPU
L Analog
BOX Data Logger
Others
Save data displayed in the graph legend area of active trend window to a CSV file.
When saving data displayed in the Historical trend graph, data names are saved in the language specified in the language
selection setting.
The data to saved are as follows. Data removed from the graph legend are not saved.
• Historical trend graph: Data of a Data logging file being displayed is saved.
• Realtime trend graph/Realtime monitor graph: Data received from the start of monitoring to the pause/stop of graph
drawing are saved.
Operating procedure
1.
2.
Select [File] [Save As] [Save CSV File] (
).
Enter a file name, and click the [Save] button.
Format specification of CSV file
CSV file format may differ depending on file types. For details on the format, refer to the following sections:
File type
Logging
Reference
QnUDVCPU/LCPU
Page 133 QnUDVCPU/LCPU
Data logger
Page 135 Data logger
Data communication
Page 137 Data communication
Analog module
Page 139 Analog module
Energy Measuring Unit
Page 140 Energy Measuring Unit
Sampling trace
Page 142 Sampling trace
Simulation result saved with FLEXIBLE HIGH-SPEED I/O CONTROL Module
Configuration tool
Page 143 Simulation result saved with FLEXIBLE HIGH-SPEED I/
O CONTROL Module Configuration tool
132
12 SAVING DISPLAYED DATA/EVENTS
12.2 Saving Displayed Data
■QnUDVCPU/LCPU
The CSV file format explained below differs from the CSV file format obtained from QnUDVCPU/LCPU. For details on the
CSV file format of QnUDVCPU/LCPU, refer to the following manual.
QnUDVCPU/LCPU User's Manual (Data Logging Function)
Item
Description
Delimiter
, (comma)
Linefeed code
CRLF (0x0D, 0x0A)
Character code
ASCII
Number of rows
Maximum number of rows: 131004 rows (data rows + 4)
For the realtime monitor graph: Up to 1000004 rows (data rows + 3)
Ex.
12
File information row
Comment row
Data type information row
Data name row
Data row
Output data of rows/
columns
Column number
Column name
Output data
■File information row
1st column
File type
File type of output file
Fixed value: [LOGGING]
2nd column
Type information_file version
Version of output file
Fixed value:
• QnUDVCPU:Q1
• LCPU:L1
3rd column
Number for data type
information row
Number indicating the data type information row
Fixed value:
• With comment row: 3
• Without comment row: 2
4th column
Number for data name row
Number indicating the data name row
Fixed value:
• With comment row: 4
• Without comment row: 3
5th column
Number for data starting rows
Starting number of data rows
Fixed value:
• With comment row: 5
• Without comment row: 4
6th column
Number for comment row*1
Number indicating the comment row
Fixed value: 2
1st column
Date and time column*2
Data type of date and time column
Fixed string: DATETIME[YYYY/MM/DD hh:mm:ss
2nd column
Millisecond column*2
Data type of millisecond column of date and time
Fixed string: ms]
3rd column
Data sampling interval column
Data type of data sampling interval column
Fixed string: INTERVAL
4th column
Execution step number column
Data type of execution step number column
Fixed string: STEP NO.
5th column
Execution program name
column
Data type of execution program name column
Fixed string: PROGRAM NAME
6th column
Index column
Index column
Fixed string: INDEX
7th column and later
Data column
Data type of sampled data
Output format: Data type output string [Additional information]
Page 144 Data type output string
Last column
Trigger information column
Fixed string regardless of continuous logging/trigger logging
Output format: TRIGGER[(trigger ON string)]*3
■Data type information
row
12 SAVING DISPLAYED DATA/EVENTS
12.2 Saving Displayed Data
133
Output data of rows/
columns
Column number
Column name
Output data
■Data name row
1st column
Date and time column*2
Title of the Date and time column
Fixed string: TIME
2nd column
Millisecond column*2
Title of millisecond column of date and time
Fixed string: msec
3rd column
Data sampling interval column
Title of the Data sampling interval column
Fixed string: INTERVAL[s]
4th column
Execution step number column
Title of execution step number column
Fixed string: STEP NO.
5th column
Execution program name
column
Title of execution program name column
Fixed string: PROGRAM NAME
6th column
Index column
Title of the Index column
Fixed string: INDEX
7th column and later
Data column
Title of the Data column
Output format: Device number or device comments
Last column
Trigger information column
Title of the Trigger information column
Fixed string: Trigger
1st column
Date and time column*2
Date and time information
Output format: YYYY/MM/DD hh:mm:ss
2nd column
Millisecond column*2
Value of millisecond
3rd column
Data sampling interval column*4
Value of data sampling interval
4th column
Execution step number
column*4
Value of execution step number
Output format: Integer value
5th column
Execution program name
column*4
Execution program name
Output format: STRING (program name)
6th column
Index column*5
Value of index
Output format: Integer value
7th column and later
Data column
Value of sampled device
Output format: Value corresponds to the type in the data type information
row
Last column
Trigger information column
Information at trigger generation
Output format: String specified by configuration tool
■Data row
*1
*2
*3
*4
*5
134
This column is not output when the comment row is not output to the logging data.
When the data, whose Date and time column is set not to output by the configuration tool, is saved to a CSV file, the Date and time
column and the Millisecond column are not output.
For the continuous logging, "*" is output for "trigger ON string".
When the data, whose columns are set not to output by the configuration tool, is saved to a CSV file, the data in the columns correspond
to those not-output items are not output, and only the delimiter "," (comma) is output.
When the data, whose indexes are set not to output by the configuration tool, is saved to a CSV file, the indexes with starting from 1 are
automatically output.
12 SAVING DISPLAYED DATA/EVENTS
12.2 Saving Displayed Data
■Data logger
The CSV file format explained below differs from the CSV file format obtained from Data logger. For details on the CSV file
format of Data logger, refer to the following manuals.
High Speed Data Logger Module User's Manual
BOX Data Logger User's Manual
Item
Description
Delimiter
, (comma)
Linefeed code
CRLF (0x0D, 0x0A)
Character code
ASCII
Number of rows
Maximum number of rows: 200003 rows (data rows + 3)
12
Ex.
File information row
Data type information row
Data name row
Data row
Output data of rows/
columns
Column number
Column name
Output data
■File information row
1st column
File type
File type of output file
Fixed value: [LOGGING]
2nd column
Type information_file version
Version of output file
Fixed value:
• High Speed Data Logger: 1
• BOX Data Logger: NZ2DL_2*1
3rd column
Number for data type
information row
Number indicating the data type information row
Fixed value: 2
4th column
Number for data name row
Number indicating the data name row
Fixed value: 3
5th column
Number for data starting rows
Starting number of data rows
Fixed value: 4
1st column
Date and time column*2
Data type of date and time column
Fixed string: DATETIME[YYYY/MM/DD hh:mm:ss
2nd column
Microsecond column*2
Data type of microsecond column of date and time
Fixed string: s]
3rd column
Index column
Index column
Fixed string: INDEX
4th column and later
Data column
Data type of sampled data
Output format: Data type output string [Additional information]
Page 144 Data type output string
Last column
Trigger information column
Fixed string regardless of continuous logging/trigger logging
Output format: TRIGGER[(trigger ON string);(trigger OFF string)]*3
1st column
Date and time column*2
Title of the Date and time column
Fixed string: TIME
2nd column
Microsecond column*2
Title of microsecond column of the data and time
Fixed string: sec*4
3rd column
Index column
Title of the Index column
Fixed string: INDEX
4th column and later
Data column
Title of the Data column
Output format: Data name
Last column
Trigger information column
Title of the Trigger information column
Fixed string: Trigger
■Data type information
row
■Data name row
12 SAVING DISPLAYED DATA/EVENTS
12.2 Saving Displayed Data
135
Output data of rows/
columns
Column number
■Data row
For saving data displayed in a historical trend window, data is output in the order that it was stored in a Data logging file.
For saving data displayed in a realtime trend window, data is output in the order that it was received.
*1
*2
*3
*4
*5
136
Column name
Output data
1st column
Date and time column*2
Date and time information
Output format: YYYY/MM/DD hh:mm:ss
2nd column
Microsecond column*2
Value of microsecond
3rd column
Index column*5
Value of index
Output format: Integer value
4th column and later
Data column
Value of sampled device
Output format: Value corresponds to the type in the data type information
row
Last column
Trigger information column
Information at trigger generation
Output format: String specified by configuration tool
(Product type)_(Version number) is displayed at the Type information_file version column.
When the data, whose Date and time column is set not to output by the configuration tool, is saved to a CSV file, the Date and time
column and the Microsecond column are not output.
On a historical trend window on which a CSV file is opened, a trigger ON string and trigger OFF string are displayed according to the
information in the file.
On a realtime trend window on which a binary file is opened, a trigger ON string and a trigger OFF string are displayed as "*" and "-"
respectively when output in a CSV file.
When a data, whose Date and time column is set to output and Microsecond column is set not to output, is saved to a CSV file, the
Microsecond column is output.
When the data, whose indexes are set not to output by the configuration tool, is saved to a CSV file, the indexes with starting from 1 are
automatically output.
12 SAVING DISPLAYED DATA/EVENTS
12.2 Saving Displayed Data
■Data communication
Item
Description
Delimiter
, (comma)
Linefeed code
CRLF (0x0D, 0x0A)
Character code
ASCII
Number of rows
Maximum number of rows: 100004 rows (data rows + 3)
Ex.
File information row
Data type information row
Data name row
12
Data row
Output data of rows/
columns
Column number
Column name
Output data
■File information row
1st column
File type
File type of output file
Fixed value: [LOGGING]
2nd column
Type information_file version
Version of output file
Fixed value: QJ71DC96_1*1
3rd column
Number for data type
information row
Number indicating the data type information row
Fixed value: 2
4th column
Number for data name row
Number indicating the data name row
Fixed value: 3
5th column
Number for data starting rows
Starting number of data rows
Fixed value: 4
1st column
Date and time column*2
Data type of date and time column
Fixed string: DATETIME[YYYY/MM/DD hh:mm:ss
2nd column
Microsecond column*2
Data type of microsecond column of date and time
Fixed string: s]
3rd column
Index column
Index column
Fixed string: INDEX
4th column and later
Data column
Data type of sampled data
Output format: Data type output string [Additional information]
Page 144 Data type output string
Last column
Trigger information column
Fixed string regardless of continuous logging/trigger logging
Output format: TRIGGER[(trigger ON string);(trigger OFF string)]*3
1st column
Date and time column*2
Title of the Date and time column
Fixed string: TIME
2nd column
Microsecond column*2
Title of microsecond column of the data and time
Fixed string: sec*4
3rd column
Index column
Title of the Index column
Fixed string: INDEX
4th column and later
Data column
Title of the Data column
Output format: Data name
Last column
Trigger information column
Title of the Trigger information column
Fixed string: Trigger
■Data type information
row
■Data name row
■Data row
For saving data displayed in a historical trend window, data is output in the order that it was stored in a Data logging file.
For saving data displayed in a realtime trend window, data is output in the order that it was received.
1st column
Date and time column*2
Date and time information
Output format: YYYY/MM/DD hh:mm:ss
2nd column
Microsecond column*2
Value of microsecond
*5
Value of index
Output format: Integer value
3rd column
Index column
4th column and later
Data column
Value of sampled device
Output format: Value corresponds to the type in the data type information
row
Last column
Trigger information column
(Blank)
12 SAVING DISPLAYED DATA/EVENTS
12.2 Saving Displayed Data
137
*1
*2
*3
*4
*5
138
(Product type)_(Version number) is displayed at the Type information_file version column.
When the data, whose Date and time column is set not to output by the configuration tool, is saved to a CSV file, the Date and time
column and the Microsecond column are not output.
On a historical trend window on which a CSV file is opened, a trigger ON string and trigger OFF string are displayed according to the
information in the file.
On a realtime trend window on which a binary file is opened, a trigger ON string and a trigger OFF string are displayed as "*" and "-"
respectively when output in a CSV file.
When a data, whose Date and time column is set to output and Microsecond column is set not to output, is saved to a CSV file, the
Microsecond column is output.
When the data, whose indexes are set not to output by the configuration tool, is saved to a CSV file, the indexes with starting from 1 are
automatically output.
12 SAVING DISPLAYED DATA/EVENTS
12.2 Saving Displayed Data
■Analog module
The CSV file format explained below differs from the CSV file format obtained from Analog module. For details of the CSV file
format of an Analog module, refer to the user's manual of each Analog module.
Item
Description
Delimiter
, (comma)
Linefeed code
CRLF (0x0D, 0x0A)
Character code
ASCII
Number of rows
Maximum number of rows: 10003 rows (data rows + 3)
Ex.
File information row
Data type information row
Data name row
12
Data row
Output data of rows/
columns
Column number
Column name
Output data
■File information row
1st column
File type
File type of output file
Fixed value: [LOGGING]
2nd column
Type information_file version
Version of output file
The file version of Analog module differs depending on the module type.
For details, refer to the user's manual of each module.
(Example) R60AD4: RAD_1
(Example) Q68CT: Q68CT_1
(Example) L60AD4: LAD1
3rd column
Number for data type
information row
Number indicating the data type information row
Fixed value: 2
4th column
Number for data name row
Number indicating the data name row
Fixed value: 3
5th column
Number for data starting rows
Starting number of data rows
Fixed value: 4
1st column
Index column
Index column
Fixed string: INDEX
2nd column and
later
Data column
Data type of sampled data
Output format: Data type output string [Additional information]
Page 144 Data type output string
Last column
Trigger information column
Fixed string: TRIGGER[(trigger ON string)]*1
1st column
Index column
Title of the Index column
Fixed string: INDEX
2nd column and
later
Data column
Title of the Data column
Output format: "DATE:" Hold trigger generated time
• "I/O:" XY address number to acquire logging data
• "CH:" Target channel
• "CYCLE:" Logging cycle
(Fixed string is displayed in " ")
Last column
Trigger information column
Title of the Trigger information column
Fixed string: Trigger
■Data type information
row
■Data name row
■Data row
*1
*2
For saving data displayed in a historical trend window, data is output in the order that it was stored in a Data logging file.
1st column
Index column*2
Value of index
Output format: Integer value
2nd column and
later
Data column
Value of sampled device
Output format: Value corresponds to the type in the data type information
row
Last column
Trigger information column
Information at trigger generation
"*" is output for 'trigger ON string'.
For Analog module, indexes are not output in a logging file. Therefore, when saving the data to a CSV file, the index is output with
continuous numbers from 1 automatically.
12 SAVING DISPLAYED DATA/EVENTS
12.2 Saving Displayed Data
139
■Energy Measuring Unit
The CSV file format explained below differs from the CSV file format obtained from Energy Measuring Unit. For details of CSV
file formats of Energy Measuring Unit, refer to manuals of Energy Measuring Unit.
• Acquiring manuals of Energy Measuring Unit in Japan
The Manuals can be downloaded from Mitsubishi Electric FA site.
www.MitsubishiElectric.co.jp/fa
• Acquiring manuals of Energy Measuring Unit in other countries
For information on how to obtain the manual, please consult your local Mitsubishi representative.
Item
Description
Delimiter
, (comma)
Linefeed code
CRLF (0x0D, 0x0A)
Character code
ASCII
Number of rows
Maximum number of rows: 3603 rows (data rows + 3)
Ex.
File information row
Data type information row
Data name row
Data row
Output data of rows/
columns
Column number
Column name
Output data
■File information row
1st column
File type
File type of output file
Fixed value: [LOGGING]
2nd column
Type information_file version
Version of output file
Fixed value: YM_1*1
3rd column
Number for data type
information row
Number indicating the data type information row
Fixed value: 2
4th column
Number for data name row
Number indicating the data name row
Fixed value: 3
5th column
Number for data starting rows
Starting number of data rows
Fixed value: 4
1st column
Date and time column*2
Data type of date and time column
Fixed string: DATETIME[YYYY/MM/DD hh:mm:ss
2nd column
Microsecond column*2
Data type of microsecond column of date and time
Fixed string: s]
3rd column
Index column
Index column
Fixed string: INDEX
4th column and later
Data column
Data type of sampled data
Output format: Data type output string [Additional information]
Page 144 Data type output string
Last column
Trigger information column
Fixed string regardless of continuous logging/trigger logging
Output format: TRIGGER[(trigger ON string);(trigger OFF string)]*3
1st column
Date and time column*2
Title of the Date and time column
Fixed string: TIME
2nd column
Microsecond column*2
Title of microsecond column of the data and time
Fixed string: sec*4
3rd column
Index column
Title of the Index column
Fixed string: INDEX
4th column and later
Data column
Title of the Data column
Output format: Data name
Last column
Trigger information column
Title of the Trigger information column
Fixed string: Trigger
■Data type information
row
■Data name row
140
12 SAVING DISPLAYED DATA/EVENTS
12.2 Saving Displayed Data
Output data of rows/
columns
Column number
■Data row
For saving data displayed in a historical trend window, data is output in the order that it was stored in a Data logging file.
For saving data displayed in a realtime trend window, data is output in the order that it was received.
*1
*2
*3
*4
*5
Column name
Output data
1st column
Date and time column*2
Date and time information
Output format: YYYY/MM/DD hh:mm:ss
2nd column
Microsecond column*2
Value of microsecond
Fixed value: 0
3rd column
Index column*5
Value of index
Output format: Integer value
4th column and later
Data column
Value of sampled device
Output format: Value corresponds to the type in the data type information
row
Last column
Trigger information column
(Blank)
(Product type)_(Version number) is displayed at the Type information_file version column.
When the data whose Date and time column is set not to output is saved to a CSV file, the Date and time column and the Millisecond
column are not output.
On a historical trend window on which a CSV file is opened, a trigger ON string and trigger OFF string are displayed according to the
information in the file.
On a realtime trend window on which a binary file is opened, a trigger ON string and a trigger OFF string are displayed as "*" and "-"
respectively when output in a CSV file.
When a data, whose Date and time column is set to output and Microsecond column is set not to output, is saved to a CSV file, the
Microsecond column is output.
When the data whose indexes are set not to output is saved to a CSV file, the indexes with starting from 1 are automatically output.
12 SAVING DISPLAYED DATA/EVENTS
12.2 Saving Displayed Data
12
141
■Sampling trace
Item
Description
Delimiter
, (comma)
Linefeed code
CRLF (0x0D, 0x0A)
Character code
ASCII
Number of rows
Maximum number of rows:8196 rows (data rows + 4)
Ex.
File information row
Data type information row
Data name row
Data row
Output data of rows/
columns
Column number
Column name
Output data
■File information row
1st column
File type
File type of output file
Fixed value: [LOGGING]
2nd column
Type information_file version
Version of output file
SamplingTrace_(Version number)
(Example) SamplingTrace_1
3rd column
Number for data type
information row
Number indicating the data type information row
Fixed value:
• With comment row: 3
• Without comment row: 2
4th column
Number for data name row
Number indicating the data name row
Fixed value:
• With comment row: 4
• Without comment row: 3
5th column
Number for data starting rows
Starting number of data rows
Fixed value:
• With comment row: 5
• Without comment row: 4
6th column
Number for comment row*1
Number indicating the comment row
Fixed value: 2
1st column
Index column
Index column
Fixed string: INDEX
2nd column and
later
Data column
Data type of sampled data
Output format: Data type output string [Additional information]
Page 144 Data type output string
Last column
Trigger information column
Fixed string: TRIGGER[(trigger ON string)]*2
1st column
Index column
Title of the Index column
Fixed string: INDEX
2nd column and
later
Data column
Title of the Data column
Device or device comment
Last column
Trigger information column
Title of the Trigger information column
Fixed string: Trigger
1st column
Index column*3
Value of index
Output format: Integer value
2nd column and
later
Data column
Value of sampled device
Output format: Value corresponds to the type in the data type information
row
Last column
Trigger information column
Information at trigger generation
■Data type information
row
■Data name row
■Data row
*1
*2
*3
142
This column is not output when the comment row is not output to the logging data.
"*" is output for 'trigger ON string'.
When the data whose indexes are set not to output is saved to a CSV file, the indexes with starting from 1 are automatically output.
12 SAVING DISPLAYED DATA/EVENTS
12.2 Saving Displayed Data
■Simulation result saved with FLEXIBLE HIGH-SPEED I/O CONTROL Module Configuration
tool
Item
Description
Delimiter
, (comma)
Linefeed code
CRLF (0x0D, 0x0A)
Character code
ASCII
Number of rows
Maximum number of rows: 2051 rows (data rows + 3)
Ex.
File information row
Data type information row
Data name row
12
Data row
Output data of
rows/columns
Column number
Column name
Output data
■File information row
1st column
File type
File type of output file
Fixed value: [LOGGING]
2nd column
Type information_file version
Version of output file
LD40PD01_(Version number)
(Example) LD40PD01_1
3rd column
Number for data type information
row
Number indicating the data type information row
Fixed value: 2
4th column
Number for data name row
Number indicating the data name row
Fixed value: 3
5th column
Number for data starting rows
Starting number of data rows
Fixed value: 4
1st column
Index column
Index column
Fixed string: INDEX
2nd column and later
Data column
Data type of sampled data
Output format: Data type output string [Additional information]
Page 144 Data type output string
Last column
Trigger information column
Fixed string: TRIGGER[(trigger ON string)]*1
1st column
Index column
Title of the Index column
Fixed string: INDEX
2nd column and later
Data column
Title of the Data column
Output format: Block name_Terminal name*2
Last column
Trigger information column
Title of the Trigger information column
Fixed string: Trigger
1st column
Index column*3
Value of index
Output format: Integer value
2nd column and later
Data column
Value of terminal
Output format: Value corresponds to the type in the data type
information row
Last column
Trigger information column
Information at trigger generation
■Data type information
row
■Data name row
■Data row
*1
*2
*3
"*" is output for 'trigger ON string'.
Only terminal name is displayed in some cases.
When the data whose indexes are not output is saved to a CSV file, the indexes with starting from 1 are automatically output.
12 SAVING DISPLAYED DATA/EVENTS
12.2 Saving Displayed Data
143
■Data type output string
Data type
Data type output string
Output data
Bit
BIT
BIT[(ON string);(OFF string)]*1
Word [unsigned]
USHORT
USHORT[DEC.0]
Word [signed]
SHORT
SHORT[DEC.0]
Double word [unsigned]
ULONG
ULONG ULONG[DEC.0]
Double word [signed]
LONG
LONG LONG[DEC.0]
FLOAT (Single Precision)
FLOAT
FLOAT[DEC.7]*2
FLOAT (Double Precision)
DOUBLE
DOUBLE[DEC.14]*2
16bit BCD
BCD16
BCD16[DEC.0]
32bit BCD
BCD32
BCD32[DEC.0]
*1
*2
On a historical trend window on which a CSV file is opened, a trigger ON string and trigger OFF string are displayed according to the
information in the file.
On a realtime trend window on which a binary file is opened, a trigger ON string and a trigger OFF string are displayed as "*" and "-"
respectively when output in a CSV file.
The number of digits after decimal point indicates the maximum number of digits, therefore all of the specified number of digits are not
always displayed.
(Example) For 1.2345, '1.2345' is output, not '1.2345000'.
Saving displayed trend graphs to image file
RCPU
R Analog
QnUDVCPU
High Speed Data Logger
High Speed Data Communication
Q Analog
LCPU
Save a captured image of the active trend window to a file.
Click the [Save] button to save the image of an active trend window.
Operating procedure
1.
2.
3.
144
Select [File] [Save As] [Save Image File] (
).
Select a file format (BMP/JPG/PNG) to be used from "Save as type".
Enter a file name and click the [Save] button.
12 SAVING DISPLAYED DATA/EVENTS
12.2 Saving Displayed Data
L Analog
BOX Data Logger
Others
12.3
RCPU
R Analog
Saving Displayed Events
QnUDVCPU
High Speed Data Logger
High Speed Data Communication
Q Analog
LCPU
L Analog
BOX Data Logger
Others
This section explains how to save events displayed on the active event window to either of the following file.
File format
Reference
CSV file
Page 145 Saving displayed events to CSV file
Image file
Page 147 Saving displayed events to image file
Saving displayed events to CSV file
12
RCPU
R Analog
QnUDVCPU
High Speed Data Logger
High Speed Data Communication
Q Analog
LCPU
L Analog
BOX Data Logger
Others
Save events being displayed in the event list of active event window to a CSV file.
When saving events displayed in the Historical event list, event logging names and comments are saved in the language
specified in the language selection setting.
The data to be saved is as follows:
• Historical event list: Events of an Event logging file being displayed are saved.
• Realtime event list: Events received from the start of monitoring to the click of the [Save] button are saved.
Operating procedure
1.
2.
Select [File] [Save As] [Save CSV File] (
).
Enter a file name, and click the [Save] button.
Format specification of CSV file
The CSV file format explained below differs from the CSV file format obtained from Data logger. For details on the CSV file
format of Data logger, refer to the following manuals.
High Speed Data Logger Module User's Manual
BOX Data Logger User's Manual
12 SAVING DISPLAYED DATA/EVENTS
12.3 Saving Displayed Events
145
■Data logger
Item
Description
Delimiter
, (comma)
Linefeed code
CRLF (0x0D, 0x0A)
Character code
ASCII
Number of rows
Maximum number of rows: 200003 rows (data rows + 3)
Ex.
File information row
Data type information row
Data name row
Data row
Output data of rows/
columns
Column number
Column name
Output data
■File information row
1st column
File type
File type of output file
Fixed value: [EVENT]
2nd column
Type information_file version
Version of type information/output file
Fixed value: 1
3rd column
Number for data type
information row
Number indicating the data type information row
Fixed value: 2
4th column
Number for data name row
Number indicating the data name row
Fixed value: 3
5th column
Number for data starting rows
Starting number of data rows
Fixed value: 4
1st column
Date and time column
Data type of date and time column
Fixed string: DATETIME[YYYY/MM/DD hh:mm:ss
2nd column
Microsecond column
Data type of microsecond column of date and time
Fixed string: s]
3rd column
Number column
Data type of number column
Fixed string: SHORT[DEC.0]
4th column
Event logging name column
Data type of event logging name column
Fixed string: STRING[64]*1
5th column
Occurrence type column
Data type of occurrence type column
Fixed string: SHORT[DEC.0]
6th column
Occurrence comment column
Data type of the occurrence comment column
Fixed string: STRING[64]*1
7th column
Occurrence condition value
column
Data type of occurrence condition value column
Fixed string: STRING[4623]*1
1st column
Date and time column
Title of the Date and time column
Fixed string: TIME
2nd column
Microsecond column
Title of microsecond column of the data and time
Fixed string: sec
3rd column
No. column
Title of the No. column
Fixed string: NUMBER
4th column
Event logging name column
Title of the Event logging name column
Fixed string: EVENT
5th column
Occurrence type column
Title of the Occurrence type column
Fixed string: STATUS
6th column
Occurrence comment column
Title of the Occurrence comment column
Fixed string: COMMENT
7th column
Occurrence condition value
column
Title of the Occurrence condition value column
Fixed string: VALUES
■Data type information
row
■Data name row
■Data row
*1
146
For saving data displayed in a historical event window, data is output in the order that it was stored in an Event logging file.
For saving data displayed in a realtime event window, data is output in the order that it was received.
A number enclosed with [ ] indicates the maximum number of characters (unit: byte).
12 SAVING DISPLAYED DATA/EVENTS
12.3 Saving Displayed Events
Saving displayed events to image file
RCPU
R Analog
QnUDVCPU
High Speed Data Logger
High Speed Data Communication
Q Analog
LCPU
L Analog
BOX Data Logger
Others
Save a captured image of the active event window to a file.
When the [Save] button is clicked, the image of an active event window is saved.
Operating procedure
1.
2.
3.
Select [File] [Save As] [Save Image File] (
).
Select a file format (BMP/JPG/PNG) to be used from "Save as type".
Enter a file name, and click the [Save] button.
12
12 SAVING DISPLAYED DATA/EVENTS
12.3 Saving Displayed Events
147
13 PRINTING TREND GRAPHS
RCPU
R Analog
QnUDVCPU
High Speed Data Logger
High Speed Data Communication
Q Analog
LCPU
L Analog
BOX Data Logger
Others
The trend graph print function is a function used to print the trend graph on the screen while a Historical trend graph, Realtime
trend graph, Realtime monitor graph is being displayed.
A graph area and a graph legend area displayed on an active trend window are printed.
Information such as connection target, data logging name, cursor time can also be printed in a header or footer.
13.1
Print Settings
This section explains the setting methods for printing.
Window
Select [File] [Print] (
).
Operating procedure
1.
2.
3.
Set the print color and margin.
Click the [Print Preview] button and check the print preview. (Page 149 Checking Print Preview)
Click the [OK] button.
■Setting printer
1.
2.
Click the [Print Setup] button.
Specify the number of copies and a printer to be used, and click the [OK] button.
■Setting header/footer
Click the [Header/Footer] tab to set the print header and footer.
■Setting graph legend output
Click the [Legends] tab to set the output contents of graph legends.
148
13 PRINTING TREND GRAPHS
13.1 Print Settings
13.2
Checking Print Preview
Click the [Print Preview] button on the "Print Preview" screen to check output images.
Header
information
Graph
legends
Graph area
13
Footer
information
Sampling start time
Plot display
Sampling end time
13 PRINTING TREND GRAPHS
13.2 Checking Print Preview
149
14 HELP MENU
14.1
Opening Manual
Open the operating manual of GX LogViewer.
Operating procedure
Select [Help] [Open Manual].
14.2
Connecting to MITSUBISHI ELECTRIC FA Global
Website
Display the MITSUBISHI ELECTRIC FA Global Website on a web browser.
Connect the personal computer to the Internet in advance.
Operating procedure
Select [Help] [Connection to MITSUBISHI ELECTRIC FA Global Website].
14.3
Version Information
This function displays the version information of GX LogViewer.
Operating procedure
Select [Help] [About GX LogViewer].
150
14 HELP MENU
14.1 Opening Manual
MEMO
14
14 HELP MENU
14.3 Version Information
151
15 TROUBLESHOOTING
This chapter explains the errors which may occur when using GX LogViewer, and corrective actions correspond to those
errors.
Symptom
Check point
Cannot communicate with the
module.
(Cannot operate online)
Is there a disconnection along the connection route?
Corrective action
• Connect the cables properly.
• Replace the cable with new one.
Is the IP address duplicated?
Correct the IP address.
Does a firewall or proxy server exist along the
connection route?
Ask your network administrator about the firewall and proxy
server settings.
Is Windows firewall enabled on the personal
computer?
Disable Windows firewall on the personal computer when
using the module search function or direct connection.
Is antivirus software blocking Ethernet
communications?
Is there any problem on the personal computer?
• Change the antivirus software settings to allow Ethernet
communications.
• Lower the antivirus software's security setting level.
• Stop the antivirus software.
Replace it with another personal computer.
Are the authorities of the user logged on to Windows
sufficient?
• For Windows XP, logon as a user with a "limited" or higher
user account.
• For Windows Vista or later, logon as a user with a
"standard" or higher user account.
Are multiple IP addresses enabled at the same time
on the personal computer side?
• For a direct connection, make sure multiple IP addresses
are not enabled at the same time on the personal computer.
• For a direct connection, disable the wireless LAN function.
Is "Direct Connection" specified on the "Transfer
Setup" screen for Data logger/Data communication?
For the direct connection, connect a Data logger/Data
communication and a personal computer on a 1:1 basis.
Page 25 For direct connection
An error message is displayed when
opening a logging file.
Is the logging file with only header line displayed?
After outputting the data, open the storage file.
Is the logging file corrupted?
Check the file.
A dashed-dotted line is displayed.
Has missing data occurred?
Page 104 Graph Display for Missing Data or Time
Reversed Data
Correct the data logging setting on the configuration tool to
prevent the occurrence of missing data.
A dashed-dotted line is displayed on
the realtime trend window.
Is logging of data displayed on the realtime trend
window stopped because the number of saved files
exceeded?
Delete the unnecessary saved files using the configuration
tool, and restart the data logging.
A process of "Open Logging File" or
"Save Logging File to PC" function is
slow.
Is Ethernet connected?
The TCP connection is recommended for the Ethernet
connection since a longer processing time is required for
"Open Logging File" or "Save Logging File to PC" function
when using the Ethernet direct connection or the UDP
connection.
When an abnormality exists in a module, functions of GX LogViewer may not operate normally. Refer to the user's manual of
each CPU and perform troubleshooting.
152
15 TROUBLESHOOTING
MEMO
15
15 TROUBLESHOOTING
153
APPENDIX
Appendix 1
USB Driver Installation
To communicate with a CPU module via USB, a USB driver needs to be installed.
The following explains the USB driver installation procedure.
If multiple MELSOFT products are installed previously, refer to the folder where the first MELSOFT product is installed.
Windows XP
Operating procedure
1.
2.
3.
Connect the personal computer and the CPU module with a USB cable, and power ON the programmable controller.
Select "Install from a list or specific location [Advanced]" on the "Found New Hardware Wizard" screen.
Select "Search for the best driver in these locations" on the next screen. Select "Include this location in the search" and
specify "MELSOFT\Easysocket\USBDrivers" in the folder where GX LogViewer has been installed.
Precautions
If the USB driver cannot be installed, check the following settings of Windows.
If "Block Never install unsigned driver software" is selected under [Control Panel] [System] [Hardware] [Driver
Signing], the USB driver may not be installed.
Select "Ignore Install the software anyway and don't ask for my approval", or "Warn Prompt me each time to choose an
action" in [Driver Signing], and install the USB driver.
Windows Vista
Operating procedure
1.
2.
3.
4.
Connect the personal computer and the CPU module with a USB cable, and power ON the programmable controller.
Select "Locate and install driver software (recommended)" on the "Found New Hardware" screen.
Select "Browse my computer for driver software (advanced)" on the "Found New Hardware" screen.
Select "Search for the best driver in these locations." on the next screen. Select "Include subfolders" and specify
"MELSOFT\Easysocket\USBDrivers" in the folder where GX LogViewer has been installed on the next screen.
Precautions
When the "Windows can't verify the publisher of this driver software screen" is displayed during the installation, select "Install
this driver software anyway".
Windows 7 or later
Operating procedure
1.
2.
Connect the personal computer and the CPU module with a USB cable, and power ON the programmable controller.
Select [Control Panel] [System and Security] [Administrative Tools] [Computer Management] [Device
Manager] from Windows Start*1. Right-click "Unknown device" and click "Update Driver Software".
3.
Select "Browse my computer for driver software" on the "Update Driver Software" screen. Specify
"MELSOFT\Easysocket\USBDrivers" in the folder where GX LogViewer has been installed on the next screen.
*1
154
Select [All apps] on the Start screen or [Start] [All Programs].
APPENDICES APPENDIX
Appendix 1 USB Driver Installation
Appendix 2
Added and Changed Functions
A
The following table shows the functions added and changed in GX LogViewer and the applicable software version.
SW1DNN-VIEWER-J (Japanese), SW1DNN-VIEWER-E (English) and SW1DNN-VIEWER-C (Chinese) are integrated into
SW1DNN-VIEWER-M (Multiple languages) Version 1.46Y.
• SW1DNN-VIEWER-M (Multiple languages)
Added/changed contents
Applicable software version
Switching the display language is supported.
1.46Y or later
Displaying the data saved with the following tool is supported.
• FLEXIBLE HIGH-SPEED I/O CONTROL Module Configuration tool
Displaying the data logged by the following modules is supported.
• RnENCPU (R04ENCPU, R08ENCPU, R16ENCPU, R32ENCPU, and R120ENCPU)
• RnSFCPU (R08SFCPU, R16SFCPU, R32SFCPU, and R120SFCPU)
1.49B or later
In the realtime monitor function of RCPU, specifying the step relay with a block specification (BL\S) to the device set on
the [Monitor Target Setting] tab and the device set on "Timing Condition" in the [Monitor Condition Setting] tab on the
"Realtime Monitor Setting" screen is supported.
• SW1DNN-VIEWER-J (Japanese)
Added/changed contents
Applicable software version
Windows 7 (32-bit version) is supported.
1.03D or later
Displaying the data which contains the following languages is supported.
• Chinese (Simplified)
• English
• Japanese
1.04E or later
Displaying the data which contains the following languages and character code is supported.
• Chinese (Traditional)
• Korean
• Unicode (UTF-8)
1.07H or later
The Jump Cursor function can be executed by searching value.
1.10L or later
Windows 7 (64-bit version) is supported.
Displaying the data logged by the following modules is supported.
• MELSEC-Q series High Speed Analog-Digital Converter Module (Q64ADH)
• MELSEC-L series Analog-Digital Converter Module (L60AD4)
1.15R or later
Displaying the date on a time scale label is supported.
The automatic reflection of the graphical display setting when displaying trend window is supported.
Initializing graphical display of the trend graph being displayed is supported.
Displaying the data logged by the following modules is supported.
• MELSEC-Q series Current Transformer Input Module (Q68CT)
1.18U or later
Expand the maximum display point of the trend graph on one screen from 65535 to 100000, and the maximum save
number of lines to the CSV file from 131073 to 200003 (data row+3).
1.20W or later
The plot format of the historical trend graph being displayed can be changed from equidistance plot format, which is
conventional display format, to time interval plot format.
When displaying with time interval plot format, logging data of another file can be added to the trend graph being
displayed.
When displaying logging data of multiple files on a trend graph, the graphs can be moved to left or right.
Displaying sampling trace data in GX LogViewer format saved with GX Works2 Version 1.90U or later is supported.
Displaying the data logged by the following modules is supported.
• QCPU (Q03UDVCPU, Q04UDVCPU, Q06UDVCPU, Q13UDVCPU and Q26UDVCPU)
• LCPU (L26CPU)
• MELSEC-L series Analog-Digital Converter Module (L60AD4-2GH)
1.25B or later
Displaying the data logged by the following modules is supported.
• LCPU (L06CPU)
1.26C or later
Displaying the data logged by the following modules is supported.
• QCPU (Q04UDPVCPU, Q06UDPVCPU, Q13UDPVCPU and Q26UDPVCPU)
• LCPU (L06CPU-P and L26CPU-P)
• MELSEC-L series Analog Input/Output Module (L60AD2DA2)
• Logging Unit for Energy Measuring Unit (EcoMonitorLight) (EMU4-LM)
1.30G or later
Windows 8 (32-bit version and 64-bit version) is supported.
Displaying the data logged by the following modules is supported.
• MELSEC-Q series High Speed Data Communication Module (QJ71DC96)
1.31H or later
APPENDICES APPENDIX
Appendix 2 Added and Changed Functions
155
Added/changed contents
Applicable software version
The transparent function of GOT2000 is supported.
1.33K or later
Displaying the data logged by the following modules is supported.
• BOX Data Logger (NZ2DL)
Displaying the data logged by the following modules is supported.
• RCPU (R04CPU, R08CPU, R16CPU, R32CPU, and R120CPU)
• MELSEC iQ-R series analog module (R60AD4, R60ADV8 and R60ADI8)
1.35M or later
Windows 8.1 (32-bit version and 64-bit version) is supported.
Realtime monitor display of data obtained by the following modules is supported.
• LCPU (L02CPU, L02CPU-P, L06CPU, L06CPU-P, L26CPU, L26CPU-P, L26CPU-BT, and L26CPU-PBT)
1.37P or later
Realtime monitor display of data obtained by the following modules is supported.
• RCPU (R04CPU, R08CPU, R16CPU, R32CPU, and R120CPU)
1.40S or later
The offline realtime monitor setting is supported.
Displaying a realtime monitor window as a frequently-used window configuration and a recent window is supported.
Displaying the data logged by the following modules is supported.
• RnPCPU (R08PCPU, R16PCPU, R32PCPU, and R120PCPU)
The font size in the graph legend area can be adjusted.
The upper and lower limit display values can be edited in batch.
Displaying/hiding grids can be switched. In addition, displaying the horizontal lines as the grid is supported.
Graph drawing using OpenGL is supported.
156
APPENDICES APPENDIX
Appendix 2 Added and Changed Functions
1.43V or later
• SW1DNN-VIEWER-E (English)
Added/changed contents
Applicable software version
Displaying the data which contains the following languages is supported.
• Chinese (Simplified)
• English
• Japanese
1.04E or later
A
The following operating systems are supported.
• Simplified Chinese version
• Traditional Chinese version
Windows 7 (32-bit version) is supported.
Displaying the data which contains the following languages and character code is supported.
• Chinese (Traditional)
• Korean
• Unicode (UTF-8)
1.07H or later
Korean version of operating system is supported.
The Jump Cursor function can be executed by searching value.
1.10L or later
Windows 7 (64-bit version) is supported.
Displaying the data logged by the following modules is supported.
• MELSEC-Q series High Speed Analog-Digital Converter Module (Q64ADH)
• MELSEC-Q series Current Transformer Input Module (Q68CT)
• MELSEC-L series Analog-Digital Converter Module (L60AD4)
1.18U or later
Displaying the date on a time scale label is supported.
The automatic reflection of the graphical display setting when displaying trend window is supported.
Initializing graphical display of the trend graph being displayed is supported.
Expand the maximum display point of the trend graph on one screen from 65535 to 100000, and the maximum save
number of lines to the CSV file from 131073 to 200003 (data row+3).
1.26C or later
The plot format of the historical trend graph being displayed can be changed from equidistance plot format, which is
conventional display format, to time interval plot format.
When displaying with time interval plot format, logging data of another file can be added to the trend graph being
displayed.
When displaying multiple file logging data on the trend graph, the graph can be moved to left or right.
Displaying sampling trace data in GX LogViewer format saved with GX Works2 Version 1.91V or later is supported.
Displaying the data logged by the following modules is supported.
• QCPU (Q03UDVCPU, Q04UDVCPU, Q06UDVCPU, Q13UDVCPU and Q26UDVCPU)
• LCPU (L06CPU and L26CPU)
• MELSEC-L series Analog-Digital Converter Module (L60AD4-2GH)
Windows 8 (32-bit version and 64-bit version) is supported.
1.32J or later
The transparent function of GOT2000 is supported.
Displaying the data logged by the following modules is supported.
• LCPU (L06CPU-P and L26CPU-P)
• MELSEC-L series Analog Input/Output Module (L60AD2DA2)
• MELSEC-Q series High Speed Data Communication Module (QJ71DC96)
• Logging Unit for Energy Measuring Unit (EcoMonitorLight) (EMU4-LM)
Displaying the data logged by the following module is supported.
• BOX Data Logger (NZ2DL)
1.34L or later
Displaying the data logged by the following modules is supported.
• RCPU (R04CPU, R08CPU, R16CPU, R32CPU, and R120CPU)
• MELSEC iQ-R series analog module (R60AD4, R60ADV8 and R60ADI8)
1.35M or later
Windows 8.1 (32-bit version and 64-bit version) is supported.
Realtime monitor display of data obtained by the following modules is supported.
• LCPU (L02CPU, L02CPU-P, L06CPU, L06CPU-P, L26CPU, L26CPU-P, L26CPU-BT, and L26CPU-PBT)
1.40S or later
The offline realtime monitor setting is supported.
• RCPU (R04CPU, R08CPU, R16CPU, R32CPU, and R120CPU)
Displaying a realtime monitor window as a frequently-used window configuration and a recent window is supported.
Displaying the data logged by the following modules is supported.
• RnPCPU (R08PCPU, R16PCPU, R32PCPU, and R120PCPU)
1.43V or later
The font size in the graph legend area can be adjusted.
The upper and lower limit display values can be edited in batch.
Displaying/hiding grids can be switched. In addition, displaying the horizontal lines as the grid is supported.
Graph drawing using OpenGL is supported.
APPENDICES APPENDIX
Appendix 2 Added and Changed Functions
157
• SW1DNN-VIEWER-C (Chinese)
Added/changed contents
Applicable software version
Displaying the data which contains the following language is supported.
• Chinese (Simplified)
• English
• Japanese
1.04E or later
The following operating systems are supported.
• Simplified Chinese version
• Traditional Chinese version
Windows 7 (32-bit version) is supported.
Displaying the data which contains the following language and character code is supported.
• Chinese (Traditional)
• Korean
• Unicode (UTF-8)
1.07H or later
The Jump Cursor function can be executed by searching value.
1.10L or later
Windows 7 (64-bit version) is supported.
Displaying the data logged by the following module is supported.
• MELSEC-Q series High Speed Analog-Digital Converter Module (Q64ADH)
• MELSEC-Q series Current Transformer Input Module (Q68CT)
• MELSEC-L series Analog-Digital Converter Module (L60AD4)
1.18U or later
Displaying the date on a time scale label is supported.
The automatic reflection of the graphical display setting when displaying trend window is supported.
Initializing graphical display of the trend graph being displayed is supported.
Expand the maximum display point of the trend graph on one screen from 65535 to 100000, and the maximum save
number of lines to the CSV file from 131073 to 200003 (data row+3).
The plot format of the historical trend graph being displayed can be changed from equidistance plot format, which is
conventional display format, to time interval plot format.
When displaying with time interval plot format, logging data of another file can be added to the trend graph being
displayed.
When displaying multiple file logging data on the trend graph, the graph can be moved to left or right.
Displaying sampling trace data in GX LogViewer format saved with GX Works2 Version 1.91V or later is supported.
Displaying the data logged by the following modules is supported.
• QCPU (Q03UDVCPU, Q04UDVCPU, Q06UDVCPU, Q13UDVCPU and Q26UDVCPU)
• LCPU (L06CPU and L26CPU)
• MELSEC-L series Analog-Digital Converter Module (L60AD4-2GH)
158
APPENDICES APPENDIX
Appendix 2 Added and Changed Functions
1.26C or later
Appendix 3
PING Test
A
The following is an example for checking the connection by issuing the PING command to the module from a target
equipment (personal computer) connected on the same Ethernet network (LAN).
(Example of checking the connection of Data logger/Data communication with a target equipment on the same network
address)
Operating procedure
1.
2.
Select [Run] from Windows Start, and enter 'cmd'. Then, click the [OK] button.
Enter the IP address of the Data logger/Data communication following 'ping' using the keyboard.
Example
3.
>ping 192.168.3.3
Check the output result.
• When the communication is successful
>ping 192.168.3.3
Pinging 192.168.3.3 with 32 bytes of data:
Reply from 192.168.3.3: bytes=32 time<1ms TTL=128
Reply from 192.168.3.3: bytes=32 time<1ms TTL=128
Reply from 192.168.3.3 bytes=32 time<1ms TTL=128
Reply from 192.168.3.3: bytes=32 time<1ms TTL=128
Ping statistics for 192.168.3.3:
Packets: Sent = 4, Received = 4, Lost = 0 (0% loss),
Approximate round trip times in milli-seconds:
Minimum = 0ms, Maximum = 0ms, Average = 0ms
• When the communication is unsuccessful
>ping 192.168.3.3
Pinging 192.168.3.3 with 32 bytes of data:
Request timed out.
Request timed out.
Request timed out.
Request timed out.
Ping statistics for 192.168.3.3:
Packets: Sent = 4, Received = 0, Lost = 4 (100% loss),
When the communication is unsuccessful, check the following items and perform the PING test again.
• Network settings for the Data logger/Data communication or the target equipment
• Cables, hub connection status, power status
Precautions
The PING test is only valid when the transfer setup method is "Connection via hub".
APPENDICES APPENDIX
Appendix 3 PING Test
159
MEMO
160
APPENDICES APPENDIX
Appendix 3 PING Test
INDEX
A
M
Access restriction . . . . . . . . . . . . . . . . . . . . . . . 40
B
Blue cursor . . . . . . . . . . . . . . . . . . . . . . . . . . . . 57
Missing data. . . . . . . . . . . . . . . . . . . . . . . . . . .104
Multiple cursor . . . . . . . . . . . . . . . . . . . . . . . . . .94
N
NaN . . . . . . . . . . . . . . . . . . . . . . . . . . . . . . . .105
Next event . . . . . . . . . . . . . . . . . . . . . . . . . . . .119
Next graph . . . . . . . . . . . . . . . . . . . . . . . . . . . . .92
C
Color . . . . . . . . . . .
Connection via hub .
CSV file . . . . . . . . .
Cursor . . . . . . . . . .
Cursor label . . . . . .
. . . . . . . . . . . . . . . . . . . . . 98
. . . . . . . . . 17,23,24,46,49,51
. . . . . . . . . . . . . . . . . . . . 132
. . . . . . . . . . . . . . . . . . . . . 73
. . . . . . . . . . . . . . . . . . . . . 95
P
PING . . . . . . . .
Previous event .
Previous graph .
Print . . . . . . . .
D
Difference information area . . . . . . . . . . . . . . 55,58
Direct connection . . . . . . . . . . . 17,23,25,46,48,51
R
Editing upper and lower limit display values in
batch . . . . . . . . . . . . . . . . . . . . . . . . . . . . . . . . 86
Equidistance plot . . . . . . . . . . . . . . . . . . . . 96,104
Event properties . . . . . . . . . . . . . . . . . . . . . . . 121
S
. . . . . . . . . . . . . . . . . . . . . . . .159
. . . . . . . . . . . . . . . . . . . . . . . .117
. . . . . . . . . . . . . . . . . . . . . . . . .90
. . . . . . . . . . . . . . . . . . . . . . . .148
Realtime event list . . . . . . . . . . . . . . . . . . 108,113
Realtime monitor graph . . . . . . . . . . . . . . . . . 52,62
Realtime trend graph. . . . . . . . . . . . . . . . . . . 52,61
E
Sampling trace . . . . . . . . . . . . . . . . . . . . . . . . .142
Sampling trace data . . . . . . . . . . . . . . . . . . . . . .44
Save . . . . . . . . . . . . . . . . . . . . . . . . . . . . 123,128
Serial port . . . . . . . . . . . . . . . . . . . . . . . . . . . . .20
Sort . . . . . . . . . . . . . . . . . . . . . . . . . . . . . . . . .115
Status bar . . . . . . . . . . . . . . . . . . . . . . . . . 55,111
Subnet mask . . . . . . . . . . . . . . . . . . . . . . . . . . .25
Switch Display Language . . . . . . . . . . . . . . . . . .31
F
Filter . . . . . . . . . . . . . . . . . . . . . . . . . . . . . . . 114
Firewall . . . . . . . . . . . . . . . . . . . . . . . . . . . . . . 26
G
Graph area . . . . . . . . . .
Graph legend area . . . .
Graph properties . . . . . .
Grid . . . . . . . . . . . . . . .
I
. . . . . . . . . . . . . 55,57,94
. . . . . . . . . . . . . . . . . . 55
. . . . . . . . . . . . . . . . 98,99
. . . . . . . . . . . . . . . . . . 96
T
Historical event list . . . . . . . . . . . . . . . . . . 108,112
Historical trend graph . . . . . . . . . . . . . . . . . . 52,60
Host address . . . . . . . . . . . . . . . . . . . . . . . . . . 25
U
Time interval plot . . .
Time scale label . . . .
Transfer setup . . . . .
Transparent function .
H
. . . . . . . . . . . . . . . . . 96,104
. . . . . . . . . . . . . . . . . . 57,97
. . . . . . . . . . . . . . . .46,47,50
. . . . . . . . . . . . . . . . . . . . .21
Unicode text file . . . . . . . . . . . . . . . . . . . . . . . .128
Upper/lower limit display value . . . . . . . . . . . . . . .84
I
I/F board .
Image file .
Index . . . .
Inf . . . . . .
IP address
. . . . . . . . . . . . . . . . . . . . . . . . . . . . 21
. . . . . . . . . . . . . . . . . . . . . . . . 144,147
. . . . . . . . . . . . . . . . . . . . . . . . . . 58,80
. . . . . . . . . . . . . . . . . . . . . . . . . . . 105
. . . . . . . . . . . . . . . . 17,23,25,46,49,51
J
Jump cursor . . . . . . . . . . . . . . . . . . . . . . . . . . . 80
L
Language . . . . . . . . . . . . . . . . . . . . . . . . . . 97,116
161
MEMO
162
REVISIONS
*The manual number is given on the bottom left of the back cover.
Revision date
*Manual number
Description
January 2010
to
September 2013
SH(NA)-080915ENG-A
to
SH(NA)-080915ENG-J
Due to the transition to the e-Manual, the details of revision have been deleted.
June 2014
SH(NA)-080915ENG-K
Complete revision (layout change)
October 2014
SH(NA)-080915ENG-L
■Added or modified parts
Chapter 3, Section 5.2, Section 5.4, Section 6.1, Section 8.1, Section 8.2, Section 8.3, Section 11.1,
Section 11.3, Section 12.2, Appendix 2
January 2015
SH(NA)-080915ENG-M
■Added or modified parts
TERMS, Section 5.4, Section 8.2, Section 8.3, Section 8.5, Section 8.6, Chapter 15, Appendix 2
June 2015
SH(NA)-080915ENG-N
■Added or modified parts
TERMS, Chapter 3, Section 4.4, Section 5.4, Section 6.4, Section 8.3, Section 8.6, Section 9.4,
Section 12.2, Appendix 2
August 2015
SH(NA)-080915ENG-O
■Added or modified parts
TERMS, Section 2.2, Section 5.2, Section 8.3, Appendix 2
Japanese manual number: SH-080887-S
This manual confers no industrial property rights of any other kind, nor does it confer any patent licenses. Mitsubishi Electric Corporation cannot be held
responsible for any problems involving industrial property rights which may occur as a result of using the contents noted in this manual.
2010 MITSUBISHI ELECTRIC CORPORATION
163
TRADEMARKS
Microsoft, Windows, Windows Vista, Windows XP, and Excel are registered trademarks or trademarks of Microsoft
Corporation in the United States, Japan, and other countries.
Intel and Pentium are either registered trademarks or trademarks of Intel Corporation in the United States and other countries.
Ethernet is a trademark of Xerox Corp.
OpenGL is a registered trademark of Silicon Graphics International Corporation.
CompactFlash and CF logo are trademarks or registered trademarks of SanDisk Corporation in the United States and other
countries.
SD logo and SDHC logo are trademarks or registered trademarks of SD-3C, LLC.
All other company names and product names used in this manual are trademarks or registered trademarks of their respective
companies.
164
SH(NA)-080915ENG-O(1508)
MODEL:SW1DNN-VIEWER-O-E
HEAD OFFICE : TOKYO BUILDING, 2-7-3 MARUNOUCHI, CHIYODA-KU, TOKYO 100-8310, JAPAN
NAGOYA WORKS : 1-14 , YADA-MINAMI 5-CHOME , HIGASHI-KU, NAGOYA , JAPAN
When exported from Japan, this manual does not require application to the
Ministry of Economy, Trade and Industry for service transaction permission.
Specifications subject to change without notice.