1
SAFETY PRECAUTIONS
(Read these precautions before using this product.)
Before using this product, please read this manual and the relevant manuals carefully and pay full attention
to safety to handle the product correctly.
In this manual, the safety precautions are classified into two levels: "
WARNING" and "
CAUTION".
WARNING
Indicates that incorrect handling may cause hazardous conditions,
resulting in death or severe injury.
CAUTION
Indicates that incorrect handling may cause hazardous conditions,
resulting in minor or moderate injury or property damage.
Under some circumstances, failure to observe the precautions given under "
CAUTION" may lead to
serious consequences.
Make sure that the end users read this manual and then keep the manual in a safe place for future
reference.
1
CONDITIONS OF USE FOR THE PRODUCT
(1) Mitsubishi programmable controller ("the PRODUCT") shall be used in conditions;
i) where any problem, fault or failure occurring in the PRODUCT, if any, shall not lead to any major
or serious accident; and
ii) where the backup and fail-safe function are systematically or automatically provided outside of
the PRODUCT for the case of any problem, fault or failure occurring in the PRODUCT.
(2) The PRODUCT has been designed and manufactured for the purpose of being used in general
industries.
MITSUBISHI SHALL HAVE NO RESPONSIBILITY OR LIABILITY (INCLUDING, BUT NOT
LIMITED TO ANY AND ALL RESPONSIBILITY OR LIABILITY BASED ON CONTRACT,
WARRANTY, TORT, PRODUCT LIABILITY) FOR ANY INJURY OR DEATH TO PERSONS OR
LOSS OR DAMAGE TO PROPERTY CAUSED BY the PRODUCT THAT ARE OPERATED OR
USED IN APPLICATION NOT INTENDED OR EXCLUDED BY INSTRUCTIONS, PRECAUTIONS,
OR WARNING CONTAINED IN MITSUBISHI'S USER, INSTRUCTION AND/OR SAFETY
MANUALS, TECHNICAL BULLETINS AND GUIDELINES FOR the PRODUCT.
("Prohibited Application")
Prohibited Applications include, but not limited to, the use of the PRODUCT in;
• Nuclear Power Plants and any other power plants operated by Power companies, and/or any
other cases in which the public could be affected if any problem or fault occurs in the PRODUCT.
• Railway companies or Public service purposes, and/or any other cases in which establishment of
a special quality assurance system is required by the Purchaser or End User.
• Aircraft or Aerospace, Medical applications, Train equipment, transport equipment such as
Elevator and Escalator, Incineration and Fuel devices, Vehicles, Manned transportation,
Equipment for Recreation and Amusement, and Safety devices, handling of Nuclear or
Hazardous Materials or Chemicals, Mining and Drilling, and/or other applications where there is a
significant risk of injury to the public or property.
Notwithstanding the above, restrictions Mitsubishi may in its sole discretion, authorize use of the
PRODUCT in one or more of the Prohibited Applications, provided that the usage of the PRODUCT
is limited only for the specific applications agreed to by Mitsubishi and provided further that no
special quality assurance or fail-safe, redundant or other safety features which exceed the general
specifications of the PRODUCTs are required. For details, please contact the Mitsubishi
representative in your region.
2
INTRODUCTION
Thank you for your patronage. We appreciate your purchase of the Mitsubishi integrated FA software, MELSOFT
series.
This manual is designed for users to understand operations of GX LogViewer.
Before using the product, thoroughly read this manual and related manuals to develop full familiarity with the functions
and performance of GX LogViewer and supported modules to ensure correct use.
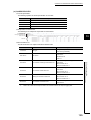
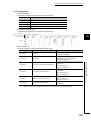
RELATED MANUALS
The manuals related to this product are shown below.
Refer to the following tables when ordering required manuals.
Manual name
< Manual number, model code >
Description
QCPU User's Manual
(Hardware Design, Maintenance and Inspection)
<SH-080483ENG, 13JR73>
Explains the specification of equipment such as CPU
module, power supply module, ATA card, and battery,
information required for system configuration, maintenance,
and troubleshooting.
MELSEC-L CPU Module User's Manual
(Hardware Design, Maintenance and Inspection)
<SH-080890ENG, 13JZ36>
Explains the specification of equipment such as CPU
module, power supply module, display module, SD memory
card, and battery, information required for system
configuration, maintenance, and troubleshooting.
QnUDVCPU/LCPU Module User's Manual
(Data Logging Function)
<SH-080893ENG, 13JZ39>
Explains the specifications of the QnUDVCPU/LCPU module
data logging function, and the method for using the
QnUDVCPU & LCPU logging configuration tool.
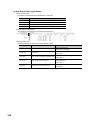
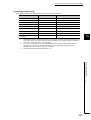
High Speed Data Logger Module User's Manual
Explains the specifications and operation methods of High
Speed Data Logger Module (QD81DL96), and setting
methods for sampling data/events.
<SH-080818ENG, 13JZ30>
High Speed Data Communication Module User's Manual
<SH-081162ENG, 13JZ86>
Explains the specifications and operation methods of High
Speed Data Communication Module (QJ71DC96), and
setting methods for sampling data.
MELSEC-Q High Speed Analog-Digital Converter Module
User's Manual
<SH-080987ENG,13JZ59>
Explains the specifications of MELSEC-Q High Speed
Analog-Digital Converter Module (Q64ADH) data logging
function.
MELSEC-Q Current Transformer Input Module User's
Manual
<SH-081033ENG,13JZ66>
Explains the specifications of MELSEC-Q Current
Transformer Input Module (Q68CT) data logging function.
MELSEC-L Analog-Digital Converter Module User's Manual
<SH-080899ENG, 13JZ42>
Explains the specifications of MELSEC-L Analog-Digital
Converter Module (L60AD4) data logging function.
MELSEC-L Analog Input/Output Module User's Manual
<SH-081167ENG, 13JZ87>
Explains the specifications of MELSEC-L Analog Input/
Output Module (L60AD2DA2) data logging function.
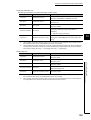
MELSEC-L Dual Channel Isolated High Resolution AnalogDigital Converter Module User's Manual
<SH-081103ENG, 13JZ72>
Explains the specifications of MELSEC-L Dual Channel Isolated High Resolution Analog-Digital Converter Module
(L60AD4-2GH) data logging function.
GX Works2 Version 1 Operating Manual (Common)
<SH-080779ENG, 13JU63>
Explains the system configuration of GX Works2 and the
functions common to Simple project and Structured project
such as parameter setting, operation method for the online
function.
Remark
Manuals in printed form are sold separately for single purchase. Order a manual by quoting the manual number (model
code) listed in the table above.
3
CONTENTS
CONTENTS
SAFETY PRECAUTIONS . . . . . . . . . . . . . . . . . . . . . . . . . . . . . . . . . . . . . . . . . . . . . . . . . . . . . . . . . . . . . 1
CONDITIONS OF USE FOR THE PRODUCT . . . . . . . . . . . . . . . . . . . . . . . . . . . . . . . . . . . . . . . . . . . . . 2
INTRODUCTION . . . . . . . . . . . . . . . . . . . . . . . . . . . . . . . . . . . . . . . . . . . . . . . . . . . . . . . . . . . . . . . . . . . . 3
RELATED MANUALS . . . . . . . . . . . . . . . . . . . . . . . . . . . . . . . . . . . . . . . . . . . . . . . . . . . . . . . . . . . . . . . . 3
HOW TO READ THIS MANUAL . . . . . . . . . . . . . . . . . . . . . . . . . . . . . . . . . . . . . . . . . . . . . . . . . . . . . . . . 9
TERMS . . . . . . . . . . . . . . . . . . . . . . . . . . . . . . . . . . . . . . . . . . . . . . . . . . . . . . . . . . . . . . . . . . . . . . . . . . 11
CHAPTER 1 OVERVIEW
13
1.1
Overview of GX LogViewer. . . . . . . . . . . . . . . . . . . . . . . . . . . . . . . . . . . . . . . . . . . . . . . . . . . . 13
1.2
Features . . . . . . . . . . . . . . . . . . . . . . . . . . . . . . . . . . . . . . . . . . . . . . . . . . . . . . . . . . . . . . . . . . 14
CHAPTER 2 SYSTEM CONFIGURATION
18
2.1
Operating Environment. . . . . . . . . . . . . . . . . . . . . . . . . . . . . . . . . . . . . . . . . . . . . . . . . . . . . . . 18
2.2
Displaying Data Logged by QnUDVCPU/LCPU . . . . . . . . . . . . . . . . . . . . . . . . . . . . . . . . . . . . 19
2.3
2.2.1
Details of system configuration . . . . . . . . . . . . . . . . . . . . . . . . . . . . . . . . . . . . . . . . . . . . . . . 19
2.2.2
Connection from USB/serial port . . . . . . . . . . . . . . . . . . . . . . . . . . . . . . . . . . . . . . . . . . . . . . 20
2.2.3
Connection from I/F boards . . . . . . . . . . . . . . . . . . . . . . . . . . . . . . . . . . . . . . . . . . . . . . . . . . 23
Displaying Data Logged by High Speed Data Logger Module/High Speed Data
Communication Module . . . . . . . . . . . . . . . . . . . . . . . . . . . . . . . . . . . . . . . . . . . . . . . . 24
2.4
2.5
2.3.1
Details of system configuration . . . . . . . . . . . . . . . . . . . . . . . . . . . . . . . . . . . . . . . . . . . . . . . 24
2.3.2
For a connection via a hub. . . . . . . . . . . . . . . . . . . . . . . . . . . . . . . . . . . . . . . . . . . . . . . . . . . 25
2.3.3
For a direct connection. . . . . . . . . . . . . . . . . . . . . . . . . . . . . . . . . . . . . . . . . . . . . . . . . . . . . . 25
Displaying Data Logged by Q/L Series Analog Module . . . . . . . . . . . . . . . . . . . . . . . . . . . . . . 27
2.4.1
Details of system configuration . . . . . . . . . . . . . . . . . . . . . . . . . . . . . . . . . . . . . . . . . . . . . . . 27
2.4.2
Connection from USB/Serial Port. . . . . . . . . . . . . . . . . . . . . . . . . . . . . . . . . . . . . . . . . . . . . . 28
2.4.3
Connection from I/F boards . . . . . . . . . . . . . . . . . . . . . . . . . . . . . . . . . . . . . . . . . . . . . . . . . . 28
Connection Precautions . . . . . . . . . . . . . . . . . . . . . . . . . . . . . . . . . . . . . . . . . . . . . . . . . . . . . . 28
CHAPTER 3 FUNCTION LIST
29
CHAPTER 4 ACQUIRING AND STARTING GX LogViewer
32
4.1
Acquiring GX LogViewer. . . . . . . . . . . . . . . . . . . . . . . . . . . . . . . . . . . . . . . . . . . . . . . . . . . . . . 32
4.2
Installation. . . . . . . . . . . . . . . . . . . . . . . . . . . . . . . . . . . . . . . . . . . . . . . . . . . . . . . . . . . . . . . . . 32
4.3
4.2.1
Installation procedure. . . . . . . . . . . . . . . . . . . . . . . . . . . . . . . . . . . . . . . . . . . . . . . . . . . . . . . 33
4.2.2
Uninstallation procedure . . . . . . . . . . . . . . . . . . . . . . . . . . . . . . . . . . . . . . . . . . . . . . . . . . . . 38
Starting GX LogViewer . . . . . . . . . . . . . . . . . . . . . . . . . . . . . . . . . . . . . . . . . . . . . . . . . . . . . . . 40
4.3.1
Starting from the Start menu . . . . . . . . . . . . . . . . . . . . . . . . . . . . . . . . . . . . . . . . . . . . . . . . . 40
4.3.2
Starting from the configuration tool . . . . . . . . . . . . . . . . . . . . . . . . . . . . . . . . . . . . . . . . . . . . 40
CHAPTER 5 OPERATION FLOWS
5.1
5.2
4
41
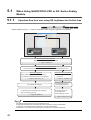
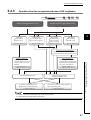
When Using QnUDVCPU/LCPU or Q/L Series Analog Module . . . . . . . . . . . . . . . . . . . . . . . . 42
5.1.1
Operation flow for a user using GX LogViewer for the first time . . . . . . . . . . . . . . . . . . . . . . 42
5.1.2
Operation flow for the basic operations of GX LogViewer . . . . . . . . . . . . . . . . . . . . . . . . . . . 43
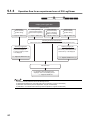
5.1.3
Operation flow for an experienced user of GX LogViewer . . . . . . . . . . . . . . . . . . . . . . . . . . . 44
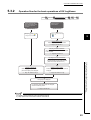
When Using High Speed Data Logger Module . . . . . . . . . . . . . . . . . . . . . . . . . . . . . . . . . . . . . 45
5.3
5.2.1
Operation flow for a user using GX LogViewer for the first time . . . . . . . . . . . . . . . . . . . . . . 45
5.2.2
Operation flow for the basic operations of GX LogViewer . . . . . . . . . . . . . . . . . . . . . . . . . . . 46
5.2.3
Operation flow for an experienced user of GX LogViewer . . . . . . . . . . . . . . . . . . . . . . . . . . . 47
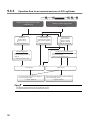
When Using High Speed Data Communication Module . . . . . . . . . . . . . . . . . . . . . . . . . . . . . . 48
5.3.1
Operation flow for a user using GX LogViewer for the first time . . . . . . . . . . . . . . . . . . . . . . 48
5.3.2
Operation flow for the basic operations of GX LogViewer . . . . . . . . . . . . . . . . . . . . . . . . . . . 49
5.3.3
Operation flow for an experienced user of GX LogViewer . . . . . . . . . . . . . . . . . . . . . . . . . . . 50
5.4
When Using Energy Measuring Unit. . . . . . . . . . . . . . . . . . . . . . . . . . . . . . . . . . . . . . . . . . . . . 51
5.5
Operation flow when displaying sampling trace data . . . . . . . . . . . . . . . . . . . . . . . . . . . . . . . . 51
5.6
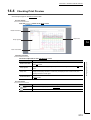
Operations while trend graphs are displayed . . . . . . . . . . . . . . . . . . . . . . . . . . . . . . . . . . . . . . 52
5.7
Operations while event list is displayed . . . . . . . . . . . . . . . . . . . . . . . . . . . . . . . . . . . . . . . . . . 52
CHAPTER 6 SCREEN CONFIGURATION
53
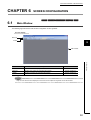
6.1
Main Window . . . . . . . . . . . . . . . . . . . . . . . . . . . . . . . . . . . . . . . . . . . . . . . . . . . . . . . . . . . . . . 53
6.2
Child Windows . . . . . . . . . . . . . . . . . . . . . . . . . . . . . . . . . . . . . . . . . . . . . . . . . . . . . . . . . . . . . 54
6.3
Menu Configuration . . . . . . . . . . . . . . . . . . . . . . . . . . . . . . . . . . . . . . . . . . . . . . . . . . . . . . . . . 56
6.4
Toolbars and Shortcut Keys . . . . . . . . . . . . . . . . . . . . . . . . . . . . . . . . . . . . . . . . . . . . . . . . . . . 61
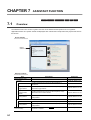
CHAPTER 7 ASSISTANT FUNCTION
7.1
7.2
64
Overview. . . . . . . . . . . . . . . . . . . . . . . . . . . . . . . . . . . . . . . . . . . . . . . . . . . . . . . . . . . . . . . . . . 64
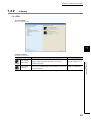
Screen Configuration . . . . . . . . . . . . . . . . . . . . . . . . . . . . . . . . . . . . . . . . . . . . . . . . . . . . . . . . 65
7.2.1
Q Series . . . . . . . . . . . . . . . . . . . . . . . . . . . . . . . . . . . . . . . . . . . . . . . . . . . . . . . . . . . . . . . . . 65
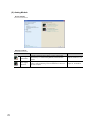
7.2.2
L Series . . . . . . . . . . . . . . . . . . . . . . . . . . . . . . . . . . . . . . . . . . . . . . . . . . . . . . . . . . . . . . . . . 69
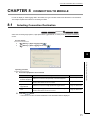
CHAPTER 8 CONNECTING TO MODULE
71
8.1
Selecting Connection Destination. . . . . . . . . . . . . . . . . . . . . . . . . . . . . . . . . . . . . . . . . . . . . . . 71
8.2
Connecting to QCPU/LCPU . . . . . . . . . . . . . . . . . . . . . . . . . . . . . . . . . . . . . . . . . . . . . . . . . . . 72
8.3
8.4
8.2.1
Transfer setup screen . . . . . . . . . . . . . . . . . . . . . . . . . . . . . . . . . . . . . . . . . . . . . . . . . . . . . . 72
8.2.2
Connecting directly using a USB/Ethernet cable . . . . . . . . . . . . . . . . . . . . . . . . . . . . . . . . . . 74
8.2.3
Connecting via network . . . . . . . . . . . . . . . . . . . . . . . . . . . . . . . . . . . . . . . . . . . . . . . . . . . . . 75
8.2.4
Communication test . . . . . . . . . . . . . . . . . . . . . . . . . . . . . . . . . . . . . . . . . . . . . . . . . . . . . . . . 78
8.2.5
Connection Channel List . . . . . . . . . . . . . . . . . . . . . . . . . . . . . . . . . . . . . . . . . . . . . . . . . . . . 78
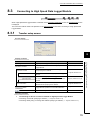
Connecting to High Speed Data Logger Module . . . . . . . . . . . . . . . . . . . . . . . . . . . . . . . . . . . 79
8.3.1
Transfer setup screen . . . . . . . . . . . . . . . . . . . . . . . . . . . . . . . . . . . . . . . . . . . . . . . . . . . . . . 79
8.3.2
Connecting via hub with specifying IP address . . . . . . . . . . . . . . . . . . . . . . . . . . . . . . . . . . . 80
8.3.3
Connecting directly using a crossing cable without specifying IP address . . . . . . . . . . . . . . 82
8.3.4
Communication test . . . . . . . . . . . . . . . . . . . . . . . . . . . . . . . . . . . . . . . . . . . . . . . . . . . . . . . . 82
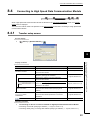
Connecting to High Speed Data Communication Module. . . . . . . . . . . . . . . . . . . . . . . . . . . . . 83
8.4.1
Transfer setup screen . . . . . . . . . . . . . . . . . . . . . . . . . . . . . . . . . . . . . . . . . . . . . . . . . . . . . . 83
8.4.2
Connecting via hub with specifying IP address . . . . . . . . . . . . . . . . . . . . . . . . . . . . . . . . . . . 84
8.4.3
Connecting directly using a crossing cable without specifying IP address . . . . . . . . . . . . . . 86
8.4.4
Communication test . . . . . . . . . . . . . . . . . . . . . . . . . . . . . . . . . . . . . . . . . . . . . . . . . . . . . . . . 86
5
CHAPTER 9 USING TREND GRAPH FUNCTION
9.1
Overview. . . . . . . . . . . . . . . . . . . . . . . . . . . . . . . . . . . . . . . . . . . . . . . . . . . . . . . . . . . . . . . . . . 87
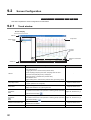
9.2
Screen Configuration . . . . . . . . . . . . . . . . . . . . . . . . . . . . . . . . . . . . . . . . . . . . . . . . . . . . . . . . 90
9.3
9.4
9.5
9.6
9.7
9.2.1
Trend window . . . . . . . . . . . . . . . . . . . . . . . . . . . . . . . . . . . . . . . . . . . . . . . . . . . . . . . . . . . . . 90
9.2.2
Graph legend area . . . . . . . . . . . . . . . . . . . . . . . . . . . . . . . . . . . . . . . . . . . . . . . . . . . . . . . . . 91
9.2.3
Graph area . . . . . . . . . . . . . . . . . . . . . . . . . . . . . . . . . . . . . . . . . . . . . . . . . . . . . . . . . . . . . . . 92
9.2.4
Difference information area . . . . . . . . . . . . . . . . . . . . . . . . . . . . . . . . . . . . . . . . . . . . . . . . . . 93
9.2.5
Status bar . . . . . . . . . . . . . . . . . . . . . . . . . . . . . . . . . . . . . . . . . . . . . . . . . . . . . . . . . . . . . . . . 95
Displaying Trend Graphs . . . . . . . . . . . . . . . . . . . . . . . . . . . . . . . . . . . . . . . . . . . . . . . . . . . . . 96
9.3.1
Displaying logged devices (Historical trend) . . . . . . . . . . . . . . . . . . . . . . . . . . . . . . . . . . . . . 96
9.3.2
Displaying current devices (Realtime trend) . . . . . . . . . . . . . . . . . . . . . . . . . . . . . . . . . . . . 101
9.3.3
Operating realtime trend monitoring status . . . . . . . . . . . . . . . . . . . . . . . . . . . . . . . . . . . . . 104
Checking Data . . . . . . . . . . . . . . . . . . . . . . . . . . . . . . . . . . . . . . . . . . . . . . . . . . . . . . . . . . . . 106
9.4.1
Checking and comparing data values/status . . . . . . . . . . . . . . . . . . . . . . . . . . . . . . . . . . . . 106
9.4.2
Adding/deleting data to/from graph legend area . . . . . . . . . . . . . . . . . . . . . . . . . . . . . . . . . 108
Adjusting Trend Graphs . . . . . . . . . . . . . . . . . . . . . . . . . . . . . . . . . . . . . . . . . . . . . . . . . . . . . 111
9.5.1
Displaying/hiding graphs . . . . . . . . . . . . . . . . . . . . . . . . . . . . . . . . . . . . . . . . . . . . . . . . . . . 111
9.5.2
Aligning graphs . . . . . . . . . . . . . . . . . . . . . . . . . . . . . . . . . . . . . . . . . . . . . . . . . . . . . . . . . . 114
9.5.3
Superimposing graphs . . . . . . . . . . . . . . . . . . . . . . . . . . . . . . . . . . . . . . . . . . . . . . . . . . . . . 115
9.5.4
Moving cursor by specifying value/time/index (Jump cursor). . . . . . . . . . . . . . . . . . . . . . . . 116
9.5.5
Specifying upper/lower limit display value . . . . . . . . . . . . . . . . . . . . . . . . . . . . . . . . . . . . . . 123
9.5.6
Moving graph up/down. . . . . . . . . . . . . . . . . . . . . . . . . . . . . . . . . . . . . . . . . . . . . . . . . . . . . 126
9.5.7
Moving graph up/down/left/right . . . . . . . . . . . . . . . . . . . . . . . . . . . . . . . . . . . . . . . . . . . . . . 127
9.5.8
Expanding/reducing time scale . . . . . . . . . . . . . . . . . . . . . . . . . . . . . . . . . . . . . . . . . . . . . . 129
9.5.9
Displaying consecutive previous/next trend graph. . . . . . . . . . . . . . . . . . . . . . . . . . . . . . . . 129
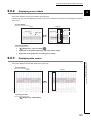
Changing Display Items in Graph Area . . . . . . . . . . . . . . . . . . . . . . . . . . . . . . . . . . . . . . . . . 134
9.6.1
Displaying multiple cursor . . . . . . . . . . . . . . . . . . . . . . . . . . . . . . . . . . . . . . . . . . . . . . . . . . 134
9.6.2
Displaying cursor labels . . . . . . . . . . . . . . . . . . . . . . . . . . . . . . . . . . . . . . . . . . . . . . . . . . . . 135
9.6.3
Displaying data names. . . . . . . . . . . . . . . . . . . . . . . . . . . . . . . . . . . . . . . . . . . . . . . . . . . . . 135
9.6.4
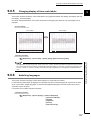
Switching graph plot format . . . . . . . . . . . . . . . . . . . . . . . . . . . . . . . . . . . . . . . . . . . . . . . . . 136
9.6.5
Changing display of time scale labels . . . . . . . . . . . . . . . . . . . . . . . . . . . . . . . . . . . . . . . . . 137
9.6.6
Switching languages . . . . . . . . . . . . . . . . . . . . . . . . . . . . . . . . . . . . . . . . . . . . . . . . . . . . . . 137
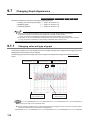
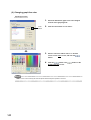
Changing Graph Appearance . . . . . . . . . . . . . . . . . . . . . . . . . . . . . . . . . . . . . . . . . . . . . . . . . 138
9.7.1
Changing color and type of graph . . . . . . . . . . . . . . . . . . . . . . . . . . . . . . . . . . . . . . . . . . . . 138
9.7.2
Highlighting graph . . . . . . . . . . . . . . . . . . . . . . . . . . . . . . . . . . . . . . . . . . . . . . . . . . . . . . . . 143
9.7.3
Thickening graph line . . . . . . . . . . . . . . . . . . . . . . . . . . . . . . . . . . . . . . . . . . . . . . . . . . . . . . 143
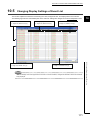
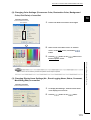
9.8
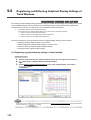
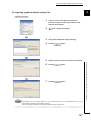
Registering and Reflecting Graphical Display Settings of Trend Windows . . . . . . . . . . . . . . 144
9.9
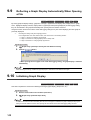
Reflecting a Graph Display Automatically When Opening a File . . . . . . . . . . . . . . . . . . . . . . 148
9.10
Initializing Graph Display . . . . . . . . . . . . . . . . . . . . . . . . . . . . . . . . . . . . . . . . . . . . . . . . . . . . 148
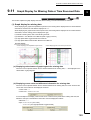
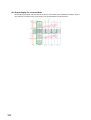
9.11
Graph Display for Missing Data or Time Reversed Data . . . . . . . . . . . . . . . . . . . . . . . . . . . . 149
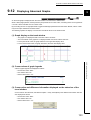
9.12
Displaying Abnormal Graphs . . . . . . . . . . . . . . . . . . . . . . . . . . . . . . . . . . . . . . . . . . . . . . . . . 151
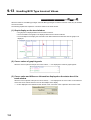
9.13
Handling BCD Type Incorrect Values . . . . . . . . . . . . . . . . . . . . . . . . . . . . . . . . . . . . . . . . . . . 152
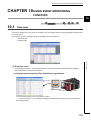
CHAPTER 10 USING EVENT MONITORING FUNCTION
10.1
6
87
153
Overview. . . . . . . . . . . . . . . . . . . . . . . . . . . . . . . . . . . . . . . . . . . . . . . . . . . . . . . . . . . . . . . . . 153
10.2
Screen Configuration . . . . . . . . . . . . . . . . . . . . . . . . . . . . . . . . . . . . . . . . . . . . . . . . . . . . . . . 155
10.2.1 Event window . . . . . . . . . . . . . . . . . . . . . . . . . . . . . . . . . . . . . . . . . . . . . . . . . . . . . . . . . . . . 155
10.2.2 Event list. . . . . . . . . . . . . . . . . . . . . . . . . . . . . . . . . . . . . . . . . . . . . . . . . . . . . . . . . . . . . . . . 156
10.2.3 Status bar . . . . . . . . . . . . . . . . . . . . . . . . . . . . . . . . . . . . . . . . . . . . . . . . . . . . . . . . . . . . . . . 157
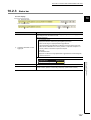
10.3
Displaying Event List . . . . . . . . . . . . . . . . . . . . . . . . . . . . . . . . . . . . . . . . . . . . . . . . . . . . . . . 158
10.3.1 Displaying logged events (Historical event) . . . . . . . . . . . . . . . . . . . . . . . . . . . . . . . . . . . . . 158
10.3.2 Displaying current events (Realtime event) . . . . . . . . . . . . . . . . . . . . . . . . . . . . . . . . . . . . . 161
10.3.3 Operating realtime event monitoring status . . . . . . . . . . . . . . . . . . . . . . . . . . . . . . . . . . . . . 162
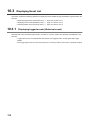
10.4
Operating Event List . . . . . . . . . . . . . . . . . . . . . . . . . . . . . . . . . . . . . . . . . . . . . . . . . . . . . . . . 163
10.4.1 Displaying only events that meet specific conditions (Filtering) . . . . . . . . . . . . . . . . . . . . . . 163
10.4.2 Sorting events . . . . . . . . . . . . . . . . . . . . . . . . . . . . . . . . . . . . . . . . . . . . . . . . . . . . . . . . . . . 165
10.4.3 Switching languages . . . . . . . . . . . . . . . . . . . . . . . . . . . . . . . . . . . . . . . . . . . . . . . . . . . . . . 166
10.4.4 Displaying consecutive previous/next event . . . . . . . . . . . . . . . . . . . . . . . . . . . . . . . . . . . . 166
10.5
Changing Display Settings of Event List. . . . . . . . . . . . . . . . . . . . . . . . . . . . . . . . . . . . . . . . . 171
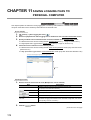
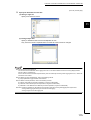
CHAPTER 11 SAVING LOGGING FILES TO PERSONAL COMPUTER
174
CHAPTER 12 USING WINDOWS/FOLDERS DISPLAYED IN PAST
176
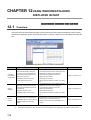
12.1
Overview. . . . . . . . . . . . . . . . . . . . . . . . . . . . . . . . . . . . . . . . . . . . . . . . . . . . . . . . . . . . . . . . . 176
12.2
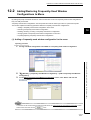
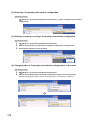
Adding/Restoring Frequently-Used Window Configurations to Menu. . . . . . . . . . . . . . . . . . . 177
12.3
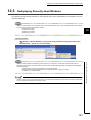
Redisplaying Recently-Used Windows . . . . . . . . . . . . . . . . . . . . . . . . . . . . . . . . . . . . . . . . . . 181
12.4
Redisplaying Recently-Used Folders . . . . . . . . . . . . . . . . . . . . . . . . . . . . . . . . . . . . . . . . . . . 182
CHAPTER 13 SAVING DISPLAYED DATA/EVENTS
13.1
13.2
183
Save Target. . . . . . . . . . . . . . . . . . . . . . . . . . . . . . . . . . . . . . . . . . . . . . . . . . . . . . . . . . . . . . . 183
Saving Displayed Data . . . . . . . . . . . . . . . . . . . . . . . . . . . . . . . . . . . . . . . . . . . . . . . . . . . . . . 184
13.2.1 Saving displayed data to CSV file . . . . . . . . . . . . . . . . . . . . . . . . . . . . . . . . . . . . . . . . . . . . 184
13.2.2 Saving displayed trend graphs to image file . . . . . . . . . . . . . . . . . . . . . . . . . . . . . . . . . . . . 202
13.3
Saving Displayed Events . . . . . . . . . . . . . . . . . . . . . . . . . . . . . . . . . . . . . . . . . . . . . . . . . . . . 203
13.3.1 Saving displayed events to CSV file . . . . . . . . . . . . . . . . . . . . . . . . . . . . . . . . . . . . . . . . . . 203
13.3.2 Saving displayed events to image file . . . . . . . . . . . . . . . . . . . . . . . . . . . . . . . . . . . . . . . . . 206
CHAPTER 14 PRINTING TREND GRAPHS
207
14.1
Overview. . . . . . . . . . . . . . . . . . . . . . . . . . . . . . . . . . . . . . . . . . . . . . . . . . . . . . . . . . . . . . . . . 207
14.2
Flow of Print . . . . . . . . . . . . . . . . . . . . . . . . . . . . . . . . . . . . . . . . . . . . . . . . . . . . . . . . . . . . . . 208
14.3
Setting Print Configuration . . . . . . . . . . . . . . . . . . . . . . . . . . . . . . . . . . . . . . . . . . . . . . . . . . . 208
14.3.1 Setting color and margin . . . . . . . . . . . . . . . . . . . . . . . . . . . . . . . . . . . . . . . . . . . . . . . . . . . 209
14.3.2 Setting printer. . . . . . . . . . . . . . . . . . . . . . . . . . . . . . . . . . . . . . . . . . . . . . . . . . . . . . . . . . . . 210
14.3.3 Setting header/footer . . . . . . . . . . . . . . . . . . . . . . . . . . . . . . . . . . . . . . . . . . . . . . . . . . . . . . 211
14.3.4 Setting graph legend output . . . . . . . . . . . . . . . . . . . . . . . . . . . . . . . . . . . . . . . . . . . . . . . . . 212
14.4
Checking Print Preview. . . . . . . . . . . . . . . . . . . . . . . . . . . . . . . . . . . . . . . . . . . . . . . . . . . . . . 213
CHAPTER 15 HELP MENU
15.1
214
Opening Manual . . . . . . . . . . . . . . . . . . . . . . . . . . . . . . . . . . . . . . . . . . . . . . . . . . . . . . . . . . . 214
7
15.2
Version Information. . . . . . . . . . . . . . . . . . . . . . . . . . . . . . . . . . . . . . . . . . . . . . . . . . . . . . . . . 214
CHAPTER 16 TROUBLESHOOTING
215
APPENDIX
216
Appendix 1 USB Driver Installation . . . . . . . . . . . . . . . . . . . . . . . . . . . . . . . . . . . . . . . . . . . . . . . . . 216
Appendix 2 Added and Changed Functions . . . . . . . . . . . . . . . . . . . . . . . . . . . . . . . . . . . . . . . . . . 225
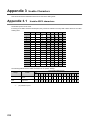
Appendix 3 Usable Characters . . . . . . . . . . . . . . . . . . . . . . . . . . . . . . . . . . . . . . . . . . . . . . . . . . . . 226
Appendix 3.1
Usable ASCII characters . . . . . . . . . . . . . . . . . . . . . . . . . . . . . . . . . . . . . 226
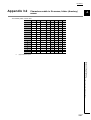
Appendix 3.2
Characters usable in file names, folder (directory) names . . . . . . . . . . . . . . . 227
Appendix 4 PING Test. . . . . . . . . . . . . . . . . . . . . . . . . . . . . . . . . . . . . . . . . . . . . . . . . . . . . . . . . . . 228
INDEX
229
REVISIONS . . . . . . . . . . . . . . . . . . . . . . . . . . . . . . . . . . . . . . . . . . . . . . . . . . . . . . . . . . . . . . . . . . . . . . 230
8
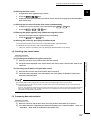
HOW TO READ THIS MANUAL
The following explains the page composition and symbols in this manual.
The contents of the example page used here are different from the actual contents for the intention of explaining how
to use this manual.
Indicates the chapter of
currently open page.
Screen display
Indicates the supported
modules.
describes the screen
displayed when the
function is used.
Supported modules
Symbols used in this
manual.
Setting screen
Describes the operating
screen when using the
function.
Symbols used in this manual
Indicates the section
of currently open page.
Operating procedure
describes the operating
procedure of the function.
Operating procedure
# indicates the menu
operation.
*indicates the
reference page.
indicates
the particular
attention.
$ indicates the
reference manual.
Remark indicates
the useful tip.
• Operating procedure
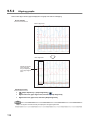
The following three types of procedure are found under Operating procedure .
1) When the operation is performed with a single step
[Graph View] B [Change the Data to Draw Graphs]
2) When the operation is performed with multiple steps
1.
2.
Move the blue cursor to the position where data are checked.
Check the values displayed in the "Value (Blue)" and "Time (Blue)"/"Index (Blue)" fields of the
difference information area.
3) When the operation can be performed by more than one method
•
•
[Graph Operation] B [Jump Cursor] (
)
Right-click on the graph legend area, and select [Jump Cursor].
9
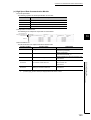
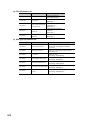
• Supported modules
The following table explains the module icons that indicate the function availability.
Icon
High Speed Data
QnUDVCPU
Logger Module
High Speed Data
Q Series
Communication
Analog
Module
Module
L Series
LCPU
Analog
Description
Module
These icons
indicate that the
explanation of the
QnUDVCPU
High Speed Data Logger
High Speed Data Communication
Q Analog
L CPU
L Analog
corresponding
module is written
in the section.
These icons
indicate that the
explanation of the
QnUDVCPU
High Speed Data Logger
High Speed Data Communication
Q Analog
L CPU
L Analog
corresponding
module is not
written in the
section.
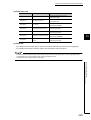
• Symbols used in this manual
The following shows the symbols used in this manual with descriptions and examples.
#
$
%
&
(
'
No.
Notation
[
]
(Underline)
<<
"
[File] B [Open]
(
<<Print Setup>> tab
"
Item name on screen
"Monochrome Print"
Button on screen
Keyboard key
'
)
Print screen
Tab name on screen
-
10
Screen name
Example
>>
-
Menu name on menu bar
Toolbar icon
Description
'
Function name
Button
Enter
key
'Print' function
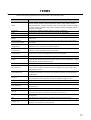
TERMS
This manual uses the terms listed in the following table unless otherwise noted.
Term
Description
Generic term for Q00J, Q00UJ, Q00, Q00U, Q01, Q01U, Q02, Q02H, Q02PH, Q02U,
Q03UD, Q03UDE, Q03UDV, Q04UDH, Q04UDEH, Q04UDV, Q06H, Q06PH, Q06UDH,
QCPU
Q06UDEH, Q06UDV, Q10UDH, Q10UDEH, Q12H, Q12PH, Q12PRH, Q13UDH, Q13UDEH,
Q13UDV, Q20UDH, Q20UDEH, Q25H, Q25PH, Q25PRH, Q26UDH, Q26UDEH, Q26UDV,
Q50UDEH, Q100UDEH
QnUDVCPU
Generic term for Q03UDV, Q04UDV, Q06UDV, Q13UDV, and Q26UDV
LCPU
Generic term for L02, L02-P, L06, L06-P, L26, L26-P, L26-BT, and L26-PBT
Programmable controller CPU
Generic term for QCPU and LCPU
High Speed Data Logger
Abbreviation for MELSEC-Q Series-compatible High Speed Data Logger Module
Module
(QD81DL96)
High Speed Data
Abbreviation for MELSEC-Q Series-compatible High Speed Data Communication Module
Communication Module
(QJ71DC96)
Q Series
Generic term for MELSEC-Q High Speed Analog-Digital Converter Module (Q64ADH) and
Analog Module
MELSEC-Q Current Transformer Input Module (Q68CT)
L Series
Generic term for MELSEC-L Analog-Digital Converter Module (L60AD4, L60AD4-2GH) and
Analog Module
MELSEC-L Analog Input/Output Module (L60AD2DA2)
Q/L Series
Analog Module
Energy Measuring Unit
Generic term for Q series Analog Module and L series Analog Module
Generic term for Logging Unit for Energy Measuring Unit (EcoMonitorLight) (EMU4-LM)
A module that can be connected to GX LogViewer. (QnUDVCPU/LCPU, High Speed Data
Module
Logger Module, High Speed Data Communication Module, Q Series Analog Module, L Series
Analog Module, and Energy Measuring Unit)
GX Works2
Generic product name for SWnDNC-GXW2-E ("n" indicates version.)
Secure Digital Memory Card is a memory device configured by the flash memory. This
SD memory card
memory card is required for the QnUDVCPU/LCPU logging function and L Series Analog
Module logging function
A storage card regulated by the 'CF+ and CompactFlash Specification' issued by the
CompactFlash card
CompactFlash Association. The memory card required for operating the High Speed Data
Logger Module
ATA card
Abbreviation for Q2MEM-8MBA, Q2MEM-16MBA, and Q2MEM-32MBA
This AT Attachment card is required for Q series Analog Module logging function.
Memory card
The general term for SD memory card, CompactFlash card, and ATA card
Data logging file
A file in which data sampled by the module are saved in the specified format
Event logging file
Logging file
CSV file
Binary file
Plot
Windows® XP
A file in which events sampled by the High Speed Data Logger Module are saved in the
specified format
The general term for the data logging file and event logging file
CSV is an abbreviation for Comma Separated Values.
A text file in which data are organized by separating it with commas (",")
A non-text file format which can be interpreted correctly only by the dedicated tools such as
GX LogViewer
Each single point of data sampled by the module displayed on the trend graph
Generic term for Microsoft® Windows® XP Professional Operating System and Microsoft®
Windows® XP Home Edition Operating System
11
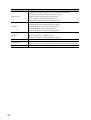
Term
Description
Generic term for Microsoft® Windows Vista® Home Basic Operating System,
Microsoft® Windows Vista® Home Premium Operating System,
Windows Vista®
Microsoft® Windows Vista® Business Operating System,
Microsoft® Windows Vista® Ultimate Operating System,
and Microsoft® Window Vista® Enterprise Operating System
Generic term for Microsoft® Windows® 7 Starter Operating System,
Microsoft® Windows® 7 Home Premium Operating System,
®
Windows 7
Microsoft® Windows® 7 Professional Operating System,
Microsoft® Windows® 7 Ultimate Operating System,
and Microsoft® Windows® 7 Enterprise Operating System
Generic term for Microsoft® Windows® 8 Operating System,
Windows® 8
Microsoft® Windows® 8 Pro Operating System,
and Microsoft® Windows® 8 Enterprise Operating System
Personal computer
Configuration tool
Logging configuration tool
12
Generic term for personal computers on which Windows® operates
Generic term for QnUDVCPU & LCPU logging configuration tool, High Speed Data Logger
Module configuration tool, and High Speed Data Communicaiton Module configuration tool
Abbreviation for QnUDVCPU & LCPU logging configuration tool
CHAPTER 1 OVERVIEW
CHAPTER 1
OVERVIEW
1
QnUDVCPU High Speed Data Logger High Speed Data Communication
1.1
Q Analog
LCPU
L Analog
Overview of GX LogViewer
GX LogViewer is a tool for displaying and analyzing large-volume data sampled by the various modules which feature
the logging function with a simple and easy-to-understand operation.
Display the logging results
with graphs and lists
Display events
:
:
-
Display data
Logging files or sampling
trace data saved to
a personal computer
QnUDVCPU
Q Series Analog Module
LCPU
L Series Analog Module
High Speed Data Communication Module
1.1 Overview of GX LogViewer
High Speed Data Logger Module
Energy Measuring Unit
The connection destination setting can be
executed with the same operation as the
configuration tool of modules and GX Works2,
and check the logging file easily.
13
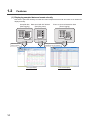
1.2
Features
(1) Displaying sampled data and events visually
Data check is performed efficiently since data and events sampled and saved with the module or GX Works2 are
displayed visually.
Sampled data Data saved with GX Works2
(Data logging)
(Sampling trace)
:
:
:
CSV format
Binary format
:
CSV format
(GX LogViewer format)
Open
CSV format
Open
Data shift can be
easily checked.
:
Binary format
Open
History of event occurrences/
restorations can be checked.
Trend graph display
14
Event occurrence/restoration data
(Event logging)
Event monitor display
CHAPTER 1 OVERVIEW
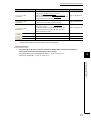
(2) Easy graph adjustment with automatic adjustment function and drag operation
1
Graphs are easily adjusted without manuals by using the automatic adjustment function and the drag operation.
Data can be checked instantly since graphs are adjusted intuitively and smoothly by only using a mouse.
1) Graph arrangement and superimpose ( Page 114, Section 9.5.2, Page 115, Section 9.5.3)
Click
a button
Click
a button
Graphs are easily viewable
by arranging them at equal
spaces.
Multiple data can be
compared by
superimposing graphs.
2) Automatic graph adjustment ( Page 123, Section 9.5.5)
Click
a button
Display size is automatically
adjusted according to the
maximum/minimum value of
data.
1.2 Features
3) Display size adjustment (Page 126, Section 9.5.6)
Drag with
a mouse
Enlarge the error location.
4) Move graph ( Page 127, Section 9.5.7)
Drag with
a mouse
Position graphs freely.
15
(3) Instant check for data changes with easy-to-understand operation
Data changes are instantly checked by using the two cursors (multiple cursor function).
Cursor A (red)
Cursor B (blue)
Data shift can be
viewed at a glance.
The shift in value and time
between the cursors can be
instantly checked.
For the multiple cursor function, refer to the following section.
Page 134, Section 9.6.1 Displaying multiple cursor
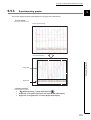
(4) Instant check for the target data
Data values are instantly checked by using Jump Cursor function to jump the cursor to the specified value/time/
index position on the trend graph.
Jump to the position where the condition is satisfied.
[Value search]
Condition search
Value 400
400
300
200
16/5/2011, 14:50
16/5/2011, 15:06
11
27
[Time specification]
[Index specification]
For Jump Cursor function, refer to the following section.
Page 116, Section 9.5.4 Moving cursor by specifying value/time/index (Jump cursor)
16
CHAPTER 1 OVERVIEW
1
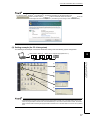
(5) Easy confirmation of logging data differences between multiple files
Display logging data stored in the multiple files on the same graph area, and the difference of each data can be
confirmed with the same time interval.
Furthermore, superimposing the graphs with simple operation enables the easier data comparison between
multiple files.
Data of File A
Data of File B
Display the logging data of multiple files
on the same graph area.
Data of File A
Data of File B
1.2 Features
The file can be moved on a per file basis
by dragging and dropping the graph to
upward/downward/left/right with the
ekey + mouse operation!
Superimposing the graphs enables
the easier data comparison!
The difference of each data can be confirmed
with the same time interval.
For operation of displaying logging data of multiple files, refer to the following section.
Page 108, Section 9.4.2 Adding/deleting data to/from graph legend area
Page 127, Section 9.5.7 Moving graph up/down/left/right
17
CHAPTER 2
SYSTEM CONFIGURATION
This chapter explains the operating environment and the system configuration of GX LogViewer.
Operating environment is described in the Section 2.1, and module configurations are described on the following
reference pages.
Module name
Reference page
QnUDVCPU/LCPU
Page 19, Section 2.2
High Speed Data Logger Module
Page 24, Section 2.3
High Speed Data Communication Module
Q/L Series Analog Module
2.1
Page 27, Section 2.4
Operating Environment
QnUDVCPU High Speed Data Logger High Speed Data Communication
Q Analog
LCPU
L Analog
For details of the GX LogViewer operating environment, refer to the document stored with the files of the installer.
[For English version software]
Operating Environment for GX LogViewer Version 1 (English Version) (BCN-P5879)
[For Chinese version software]
*;/RJ9LHZHU9HUVLRQㅔԧЁ᭛⠜䖤㸠⦃๗%&13
18
CHAPTER 2 SYSTEM CONFIGURATION
2.2
Displaying Data Logged by QnUDVCPU/LCPU
QnUDVCPU High Speed Data Logger High Speed Data Communication
Q Analog
L CPU
2
L Analog
When displaying data logged by QnUDVCPU/LCPU on GX LogViewer, connect to the various modules.
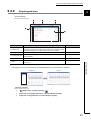
2.2.1
Details of system configuration
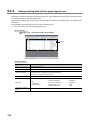
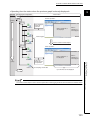
This section explains the system configuration when displaying data logged by QnUDVCPU/LCPU on GX LogViewer.
The possible connection route is the same as that of logging configuration tool.
The following figure shows the example of displaying logging data sampled by LCPU on GX LogViewer.
Connection from USB/serial port
Page 20, Section 2.2.2
Connection from I/F boards
Page 23, Section 2.2.3
USB/serial port
Connected to LCPU
to execute logging
via another station
QCPU.
CC-Link/Ethernet/CC-Link IE Field Network
LCPU
Display personal computer
GX LogViewer
Display
QCPU
Connection via network
Page 20, Section 2.2.2
2.2 Displaying Data Logged by QnUDVCPU/LCPU
2.2.1 Details of system configuration
SD memory card
Required, Sold
separately
CC-Link, C24
Display
LCPU
LCPU
SD memory card
Required, Sold
separately
SD memory card
Required, Sold
separately
LCPU
SD memory card
Required, Sold
separately
Remark
● GX LogViewer is supported by all QnUDVCPUs/LCPUs.
● Read the following precautions when connecting with QnUDVCPU/LCPU.
Page 28, Section 2.5 Connection Precautions
19
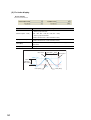
2.2.2
Connection from USB/serial port
The following shows the possible system configuration for connecting the LCPU using the USB/serial port of a
personal computer.
USB communication
USB cable
or
LCPU
QCPU
Serial port direct connection
QC30R2
Converter/Cable
or
LCPU
+RS-232 adaptor
QCPU
Serial communication link
GX LogViewer
(SW1DNN-VIEWER-J)
Via computer link
RS-232 cable
Converter/Cable
C24
or
LCPU
QCPU
USB port
or
serial port
CC-Link network
Via CC-Link (G4)
Converter/Cable
G4 module
G4-S3 module
Configuration/display
personal computer
or
LCPU
QCPU
Via modem
Cable attached to modem
Modem
Serial communication link
Cable attached to modem
modem
C24
or
LCPU
QCPU
Via GOT
Cable
GOT
or
QCPU
20
LCPU
CHAPTER 2 SYSTEM CONFIGURATION
(1) Connection using USB cable
The following table shows USB cables and USB adaptors whose operation have been confirmed by Mitsubishi
Electric.
Product name
Model name
USB cable
MR-J3USBCBL3M
(USB A type - USB miniB type)
2
Maker name
Mitsubishi Electric Corporation
Only one programmable controller CPU can be connected to a personal computer using a USB cable.
Connection to programmable controller CPUs is not applicable in the configuration examples below.
(Same as QCPU.)
<Inapplicable configuration>
Connection to several programmable controller CPUs from the personal
computer with several USB ports
LCPU
USB cable
USB
cab
le
LCPU
Connection to several programmable controller CPUs via USB hub
USB
hub
USB cable
USB
LCPU
cab
le
LCPU
● Using a USB cable for the first time
Install the USB driver. For the installation of the USB driver, refer to the following section.
Page 216, Appendix 1 USB Driver Installation
● Using a USB/RS-232 conversion cable
For checking the COM port number as connecting a personal computer to a programmable controller CPU using a USB/
RS-232 conversion cable etc., refer to the user's manual of each cable.
21
2.2 Displaying Data Logged by QnUDVCPU/LCPU
2.2.2 Connection from USB/serial port
USB
cable
(2) Connection using RS-232 cable
The following table shows the RS-232 cable whose operation have been confirmed by Mitsubishi Electric.
Model name
Maker name
QC30R2
(Personal computer connector: 9-pin D-sub connector)
Mitsubishi Electric Corporation
RS-232 cable
● High-speed communication
For high-speed communication (transmission speed: 115.2/57.6kbps), use a personal computer compatible with highspeed communication.
When a communication error occurs, retry the communication after reducing the transmission speed setting.
(3) Connection via GOT
The use of the transparent function of GOT enables the access to a programmable controller CPU via GOT. For
details, refer to the following manuals.
Connection Manual of GOT2000 Series
Connection Manual of GOT1000 Series
GOT-A900 Series User's Manual (Connection System Manual)
GOT-F900 SERIES GRAPHIC OPERATION TERMINAL HARDWARE Manual [Connection]
22
CHAPTER 2 SYSTEM CONFIGURATION
2.2.3
Connection from I/F boards
The following shows the system configuration for connecting to programmable controller CPUs using an I/F board
mounted on the personal computer.
2
For the applications and mounting method of I/F boards, and driver installation, refer to the manual of each I/F board.
CC-Link Ver.1 board
Driver
SW4DNF-CCLINK-B
A80BD-J61BT11
A80BD-J61BT13
QCPU
or
LCPU
CC-Link Ver.2 board
GX LogViewer
(SW1DNN-VIEWER-E)
Driver
SW1DNC-CCBD2-B
or
Q80BD-J61BT11N
QCPU
LCPU
Ethernet board
Ethernet board which is built in a personal
computer or commercially available
Driver
Driver supplied with
commercially available
Ethernet board
QCPU
or
LCPU
CC-Link IE Field Network board
Driver
SW1DNC-CCIEF-B
Q81BD-J71GF11-T2
QCPU
or
LCPU
CC-Link IE Controller Network board
Driver
SW1DNC-MNETG-B
QCPU
MELSECNET/H board
Driver
Driver supplied with
SW0DNC-MNETH-B
Q80BD-J71BR11 (Coaxial loop)
Q80BD-J71LP21-25 (Optical loop)
Q80BD-J71LP21G (Optical loop)
QCPU
Display personal computer
The TCP connection is recommended for the Ethernet connection.
A longer processing time is required for "Open Logging File" or "Save Logging File to PC" function when using the Ethernet
direct connection or the UDP connection.
23
2.2 Displaying Data Logged by QnUDVCPU/LCPU
2.2.3 Connection from I/F boards
Q80BD-J71GP21-SX (Optical loop)
Q80BD-J71GP21S-SX (Optical loop)
2.3
Displaying Data Logged by High Speed Data Logger
Module/High Speed Data Communication Module
QnUDVCPU High Speed Data Logger High Speed Data Communication
Q Analog
L CPU
L Analog
When displaying data logged by High Speed Data Logger Module/High Speed Data Communication Module on GX
LogViewer, connect to the various modules.
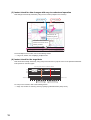
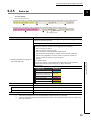
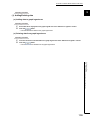
2.3.1
Details of system configuration
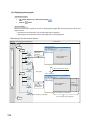
This section explains the system configuration when displaying data sampled by High Speed Data Logger Module/
High Speed Data Communication Module on GX LogViewer.
The possible connection route is the same as that of each module.
FTP server
SNTP server
Mail server
For a connection via a hub
Page 25, Section 2.3.2
For a direct connection
Page 25, Section 2.3.3
Ethernet
High Speed Data
Logger Module
CompactFlash card
Required, Sold separately
Display
Display personal computer
GX LogViewer
High Speed Data
Communication
Module
CompactFlash card
Required, Sold separately
Display
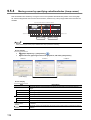
(1) Communication route
The following are the two types of communication route between a High Speed Data Logger Module/High Speed
Data Communication Module and a personal computer
• Connection via a hub: Specify an IP address, and communicate via hub ( Page 25, Section 2.3.2)
• Direct connection: Connect directly with the Ethernet cable (crossing cable) and communicate
( Page 25, Section 2.3.3)
● Read the following precautions when connecting to a High Speed Data Logger Module/High Speed Data Communication
Module.
Page 28, Section 2.5 Connection Precautions
● Ethernet (twisted pair) cables (Sold separately)
Ethernet cables that conform to the standard of IEEE802.3, 10BASE-T/100BASE-TX can be used.
For details of Ethernet communication specifications, refer to the following manual.
High Speed Data Logger Module User's Manual
High Speed Data Communication Module User's Manual
24
CHAPTER 2 SYSTEM CONFIGURATION
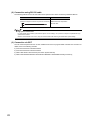
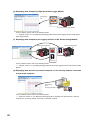
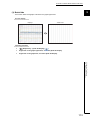
2.3.2
For a connection via a hub
In this method, the High Speed Data Logger Module/the High Speed Data Communication Module and a personal
computer are connected through a local area network via a hub.
2
The IP address of each module must be specified when connecting via a hub.
High Speed Data Logger Module/
High Speed Data Communication Module
Twisted pair cable
Ethernet
Hub
Server personal computer
Twisted pair cable
Configuration/display personal computer
● For the network setting of the personal computer, set the same network address as that of the High Speed Data Logger
Module/the High Speed Data Communication Module,
Set the same values.
Set the different values.
Network portion
Host portion
Network portion
Host portion
192.168. 3.
3
192.168. 3.
1
255.255.255.
0
255.255.255.
0
High Speed Data Logger Module/
High Speed Data Communication Module
Configuration/display personal computer
● The High Speed Data Logger Module/the High Speed Data Communication Module can be only connected over a LAN
connection.
The module cannot be connected over the Internet.
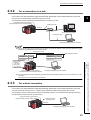
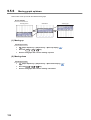
2.3.3
For a direct connection
In this method, the High Speed Data Logger Module/the High Speed Data Communication Module and a personal
computer are directly connected on a 1:1 basis through an Ethernet cable (crossing cable) without a hub.
The IP address of each module does not need to be specified to perform communication when directly connecting.
(The broadcast is used to perform communication.)
High Speed Data Logger Module/
High Speed Data Communication Module
Twisted pair cable
(crossing cable)
Ethernet
Configuration/display personal computer
25
2.3 Displaying Data Logged by High Speed Data Logger Module/High Speed Data Communication
Module
2.3.2 For a connection via a hub
Factory setting
IP address :
192.168.3.3
Subnet mask :
255.255.255.0
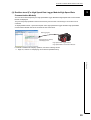
(1) Precautions for direct connection
This section explains precautions when directly connecting a personal computer to the High Speed Data Logger
Module/the High Speed Data Communication Module.
(a) Connecting to a LAN line
Do not connect to a LAN line and communicate over a direct connection.
By communicating over a direct connection, a load is placed on the line and it can affect the communication of
other devices.
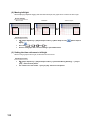
(b) Connections which are not direct connections
Direct connection setup cannot be performed in a configuration where a single High Speed Data Logger
Module/High Speed Data Communication Module and a single personal computer are connected to a hub as
shown in the following figure.
High Speed Data Logger Module/
High Speed Data Communication Module
Ethernet
Hub
Configuration/display personal computer
(c) Conditions where communication cannot be accomplished with a direct connection
If the conditions below match, communications cannot be performed with a direct connection.
If communications cannot be performed, review the High Speed Data Logger Module/the High Speed Data
Communication Module or personal computer settings.
• When for each bit of the High Speed Data Logger Module's IP address/the High Speed Data
Communication Module's IP address, the bit corresponding to the personal computer's subnet mask 0
portion are all ON or OFF.
Example)
Module IP address
: 64. 64.255.255
Personal computer IP address
: 64. 64. 1. 1
Personal computer subnet mask
: 255.255. 0. 0
• When for each bit of the High Speed Data Logger Module's IP address/the High Speed Data Communication
Module's IP address, the bits that correspond to the host address of each class for the personal computer's
IP address are all ON or OFF
Example)
Module IP address
Personal computer IP address
Personal computer subnet mask
: 64. 64.255.255
: 192.168. 0. 1
: 255.255. 0. 0
Remark
● The IP address of each class is listed below.
Class A: 0.x.x.x to 127.x.x.x
Class B: 128.x.x.x to 191.x.x.x
Class C: 192.x.x.x to 223.x.x.x
● The host address of each class is the 0 portion below.
Class A: 255. 0. 0. 0
Class B: 255.255. 0. 0
Class C: 255.255.255. 0
26
CHAPTER 2 SYSTEM CONFIGURATION
2.4
Displaying Data Logged by Q/L Series Analog Module
QnUDVCPU
High Speed Data Logger High Speed Data Communication Q Analog L CPU
2
L Analog
The logging data sampled by Q/L Series Analog Module is saved in an ATA card or an SD memory card. Therefore,
connect to QCPU/LCPU when displaying sampled data on GX LogViewer.
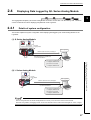
2.4.1
Details of system configuration
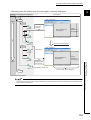
This section explains the system configuration when displaying data logged by Q/L Series Analog Module on GX
LogViewer.
(1) Q Series Analog Module
SD memory card
(QnUDVCPU)
Required, Sold separately
ATA card
Q Series
Analog Module
GX LogViewer
e
Sav
Obtain the data from QCPU, and display it.
data
USB/serial port/CC-Link IE Controller Network/
MELSECNET/H(10)/CC-Link/Ethernet/
CC-Link IE Field Network
QCPU
Connection from USB/serial port
Display personal
computer
2.4 Displaying Data Logged by Q/L Series Analog Module
2.4.1 Details of system configuration
Page 20, Section 2.2.2
Connection from I/F boards
Page 23, Section 2.2.3
(2) L Series Analog Module
SD memory card
Required, Sold
separately
L Series
Analog Module
GX LogViewer
Obtain the data from LCPU, and display it.
ta
e da
Sav
USB/serial port/CC-Link/Ethernet/
CC-Link IE Field Network
LCPU
Connection from USB/serial port
Page 20, Section 2.2.2
Display personal
computer
Connection from I/F boards
Page 23, Section 2.2.3
● For saving data from Q/L Series Analog Module to a memory card, refer to the manual of each module.
● When using L60AD4, the logging function can be executed with a serial number whose first digits are '13041' or higher.
27
2.4.2
Connection from USB/Serial Port
The system configuration for connecting to a programmable controller CPU using the USB/serial port of a personal
computer is the same as displaying data logged by QnUDVCPU/LCPU logging function.
For details, refer to the following section.
Page 20, Section 2.2.2 Connection from USB/serial port
2.4.3
Connection from I/F boards
The system configuration for connecting to a programmable controller CPU using an I/F board mounted on the
personal computer is the same as displaying data logged by QnUDVCPU/LCPU logging function.
For details, refer to the following section.
Page 23, Section 2.2.3 Connection from I/F boards
2.5
Connection Precautions
QnUDVCPU High Speed Data Logger High Speed Data Communication
Q Analog
LCPU
L Analog
The following are precautions when connecting a personal computer to a module using Ethernet.
(1) When the Windows firewall is ON
When connecting to High Speed Data Logger Module/High Speed Data Communication Module, disable the
Windows firewall.
(2) When multiple IP addresses are enabled
Direct connection setup cannot be performed in a configuration where multiple IP addresses are enabled at the
same time as shown below.
• An IP address is assigned to each of multiple Ethernet ports (network devices) of a personal computer.
• Aside from the Ethernet port of a personal computer, a wireless LAN setting is enabled.
• Multiple IP addresses are assigned to one Ethernet port of a personal computer.
28
CHAPTER 3 FUNCTION LIST
CHAPTER 3
FUNCTION LIST
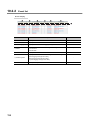
The following table shows the list of major functions of GX LogViewer.
For details on the functions, check the reference.
3
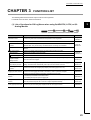
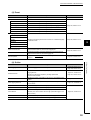
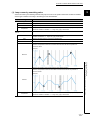
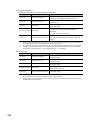
(1) List of functions for GX LogViewer when using QnUDVCPU, LCPU, or Q/L
Analog Module
QnUDVCPU High Speed Data Logger High Speed Data Communication
Item
Q Analog
L CPU
Description
Assistant function
A function to guide users unfamiliar with the operation of GX LogViewer.
Connection setup
A function to setup a connection with a QCPU or an LCPU.
Direct connection
A function to connect a personal computer to a QCPU or an LCPU on a 1:1 basis using an
function
Ethernet cable. They can be easily connected without concerning the IP address.
Module search function
Trend graph function
Historical trend
CSV file display
Register/reflect
graphical display
setting function
A function to search for and connect to a Built-in Ethernet port CPU or an LCPU on the
L Analog
Reference
Page 64,
CHAPTER 7
Page 72,
Section 8.2
network.
A function to display data sampled by the data logging function as a graph.
Displays the past data on the trend graph.
Displays data saved in CSV files.
Page 87,
CHAPTER 9
A function to register the display setting information of the trend graph being displayed, and
Page 144,
reflect to another trend graph.
Section 9.8
Automatic reflection of
A function to store the graph display information being displayed by each data logging
Page 148,
graph display function
setting, and reflect them automatically when open the trend window next time.
Section 9.9
Restore graph display
function
Logging file save function
Redisplay window/folder
function
A function to restore the changed graph display information (graph color, etc.).
A function to save logging files saved in the memory card to a personal computer.
A function to save the following information and redisplay them easily.
• Window layout and data of the trend window.
• The folder path input to open the logging file.
Displayed data save
A function to save the data displayed in the trend graph and the events displayed in the event
function
list to the personal computer as a CSV file or image file (BMP/JPG/PNG).
Trend graph print function
A function to print the trend graph displayed with the trend graph function.
Page 148,
Section 9.10
Page 174,
CHAPTER 11
Page 176,
CHAPTER 12
Page 184,
Section 13.2
Page 207,
CHAPTER 14
29
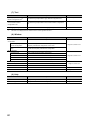
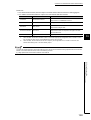
(2) List of functions for GX LogViewer when using High Speed Data Logger
Module
QnUDVCPU High Speed Data Logger High Speed Data Communication
Item
Q Analog
L CPU
Description
Assistant function
A function to guide users unfamiliar with the operation of GX LogViewer.
Connection setup
A function to setup a connection with a High Speed Data Logger Module.
A function to connect a personal computer to a High Speed Data Logger Module on a 1:1
Direct connection function
basis using an Ethernet cable. They can be easily connected without concerning the IP
Module search function
A function to search for and connect to a High Speed Data Logger Module on the network.
address.
Trend graph function
Historical trend
Reference
Page 64,
CHAPTER 7
Page 79,
Section 8.3
A function to display data sampled by the data logging function as a graph.
Displays the past data on the trend graph.
Binary file display
Displays data saved in binary files.
CSV file display
Displays data saved in CSV files.
Realtime trend
L Analog
A function to display current data on the trend graph.
Binary file display
Displays data saved in binary files.
CSV file display
Displays data saved in CSV files.
Page 87,
CHAPTER 9
Register/reflect graphical
A function to register the display setting information of the trend graph being displayed,
Page 144,
display setting function
and reflect to other trend graph.
Section 9.8
Automatic reflection of
A function to store the graph display information being displayed by each data logging
Page 148,
graph display function
setting, and reflect them automatically when open the trend window next time.
Section 9.9
Initialize graph display
function
Event monitoring function
Historical event
A function to display past events on the trend graph.
Displays events saved in binary files.
CSV file display
Displays events saved in CSV files.
A function to display current events on the trend graph.
Binary file display
Displays events saved in binary files.
CSV file display
Displays events saved in CSV files.
Logging file save function
Redisplay window/folder
function
Displayed data save function
Trend graph print function
Page 148,
Section 9.10
A function to display events sampled by the event logging function as a list.
Binary file display
Realtime event
30
A function to initialize the changed graph display information (graph color, etc.).
A function to save logging files saved in the memory card to a personal computer.
A function to save the following information and redisplay them easily.
• Window layout and data of the trend window and the event window.
• The folder path input to open the logging file.
A function to save the data displayed in the trend graph and the events displayed in the
event list to the personal computer as a CSV file or image file (BMP/JPG/PNG).
A function to print the trend graph displayed with the trend graph function.
Page 153,
CHAPTER 10
Page 174,
CHAPTER 11
Page 176,
CHAPTER 12
Page 183,
CHAPTER 13
Page 207,
CHAPTER 14
CHAPTER 3 FUNCTION LIST
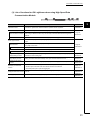
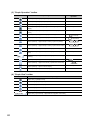
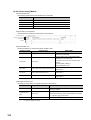
(3) List of functions for GX LogViewer when using High Speed Data
Communication Module
QnUDVCPU High Speed Data Logger High Speed Data Communication
Item
Q Analog
L CPU
Description
Assistant function
A function to guide users unfamiliar with the operation of GX LogViewer.
Connection setup
A function to setup a connection with a High Speed Data Logger Module.
A function to connect a personal computer to a High Speed Data Logger Module on a 1:1
Direct connection function
basis using an Ethernet cable. They can be easily connected without concerning the IP
address.
Module search function
Trend graph function
Historical trend
CSV file display
Realtime trend
CSV file display
L Analog
Reference
Page 64,
CHAPTER 7
Page 83,
Section 8.4
A function to search for and connect to a High Speed Data Logger Module on the network.
A function to display data sampled by High Speed Data Communication Module as a
graph.
Displays data on the trend graph by selecting the CSV file saved with the realtime trend
from [File] on the menu.
Displays data saved in CSV files.
Page 87,
CHAPTER 9
A function to display current data on the trend graph.
Displays data saved in CSV files.
Register/reflect graphical
A function to register the display setting information of the trend graph being displayed,
Page 144,
display setting function
and reflect to other trend graph.
Section 9.8
Automatic reflection of
A function to store the graph display information being displayed by each label gruop
Page 148,
graph display function
setting, and reflect them automatically when open the trend window next time.
Section 9.9
Initialize graph display
function
Redisplay window/folder
function
Displayed data save function
Trend graph print function
A function to initialize the changed graph display information (graph color, etc.).
A function to save the following information and redisplay them easily.
• Window layout and data of the trend window and the event window.
• The folder path input to open the logging file.
A function to save the data displayed in the trend graph to the personal computer as a
CSV file.
A function to print the trend graph displayed with the trend graph function.
Page 148,
Section 9.10
Page 176,
CHAPTER 12
Page 183,
CHAPTER 13
Page 207,
CHAPTER 14
31
3
CHAPTER 4
ACQUIRING AND STARTING
GX LogViewer
QnUDVCPU High Speed Data Logger High Speed Data Communication
4.1
Q Analog
LCPU
L Analog
Acquiring GX LogViewer
For the acquisition of GX LogViewer, contact your local Mitsubishi representative.
4.2
Installation
This section explains the installation and uninstallation procedure of GX LogViewer.
● For Windows®8, .NET Framework 3.5 is required to be installed.
Select ".NET Framework 3.5 (includes .NET 2.0 and 3.0) in "Turn Window features on or off" on the Control Panel.
● Before installing GX LogViewer, close any other applications running on Windows®.
● The installer may not work normally because of the operating system's or other companies' update programs, such as
Windows® Update or the Java update program, start automatically. Install GX LogViewer after configuring those update
programs not to start automatically.
● When installing GX LogViewer, log on as a user with the Administrator authority.
● For the required personal computer operating environment to install GX LogViewer, refer to the following section.
Page 18, Section 2.1 Operating Environment
32
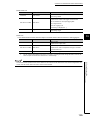
CHAPTER 4 ACQUIRING AND STARTING GX LogViewer
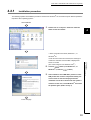
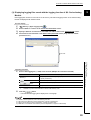
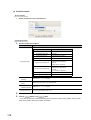
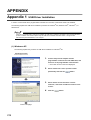
4.2.1
Installation procedure
The following explains the installation procedure. Screens from Windows® XP are used except for different operations
required in other operating systems.
Start installation
1.
Double click on "setup.exe" inside the extracted
4
folder to start the installer.
< When using Windows Vista®, Windows® 7, or
Windows® 8>
If User Account Control is turned ON, the message to
confirm the activation of the installer is displayed as
(The screen image is from Windows Vista®.)
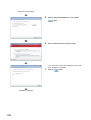
2.
Click the
button. (For Windows® 7, or
Windows® 8, click the
3.
button.)
If the installation of the MELSOFT product or other
S/W product has not been completed normally, the
screen shown on the left is displayed and the
installation cannot be continued until the system is
restarted. In this case, restart Windows® and install
the product again. (Return to step 1)
To the next page
33
4.2 Installation
4.2.1 Installation procedure
shown on the left.
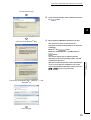
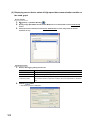
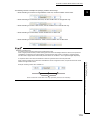
From the previous page
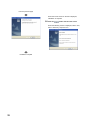
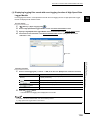
4.
Check any other applications are not running, and
click the
button. (If any other applications
are running, terminate them)
5.
Click the
6.
Enter the user information and click the
button.
button.
7.
Select the installation target folder and click the
button.
To the next page
34
CHAPTER 4 ACQUIRING AND STARTING GX LogViewer
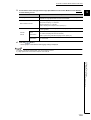
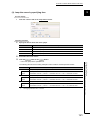
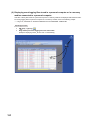
From the previous page
8.
Verify "Current Settings" of the installation and click
the
button.
4
[The screen of Windows® XP]
9.
When installing a MELSOFT product for the first
time, the screen shown on the left may be
displayed. Click the following button to continue the
installation.
Windows® XP:
Windows®
button
Vista, Windows® 7, and Windows® 8:
button
(The screen display may be different partially
depending on the used operating system. This will
not affect the operation.)
no error occurs after the installation. This screen
may be displayed behind another screen. Press the
Alt
+
Tab
keys to bring it forward.)
[The screen of Windows Vista®, Windows® 7, and
Windows® 8]
To the next page
35
4.2 Installation
4.2.1 Installation procedure
(We have checked the operation and confirmed that
From the previous page
When the screen shown on the left is displayed,
installation is complete.
10. Click the
button and close the screen.
When the following screen is displayed, select "Yes, I
want to restart my computer now.".
Installation complete
36
CHAPTER 4 ACQUIRING AND STARTING GX LogViewer
● Program Compatibility Assistant screen
When using Windows Vista®, Windows® 7, or Windows® 8, the Program Compatibility Assistant screen may be displayed
after the installation completion. Follow the procedure to finish the installation. (The following screen images are from
Windows Vista®.)
1. Select "This program installed correctly".
2. Restart the Windows® operating system.
4
If "Reinstall using recommended settings" is selected by mistake, the 'Windows XP SP2 compatibility mode' is
automatically set. Disable the 'Windows XP SP2 compatibility mode' by following the procedure described below, and
install the product again.
Uncheck the check box.
1. Right-click on the setup.exe icon of the installation
target in the Windows explorer, and open the setup
Properties screen.
2. Select the <<Compatibility>> tab and click the
button.
mode for:" check box of compatibility mode in the
<<Compatibility for all users>> tab, and click the
button.
4. Click the
button on the setup Properties
screen.
5. Install the product again. ( Page 33, Section 4.2.1)
Remark
For the installation of the USB driver, refer to the following section.
Page 216, Appendix 1 USB Driver Installation
37
4.2 Installation
4.2.1 Installation procedure
3. Uncheck the "Run this program in compatibility
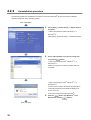
4.2.2
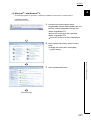
Uninstallation procedure
The following explains the uninstallation procedure. Screens from Windows® XP are used except for different
operations required in other operating systems.
Start uninstallation
1.
Select [Start] B [Control Panel] B "Add or Remove
Programs".
< When using Windows Vista®, Windows® 7, or
Windows® 8>
Select [Start] B [Control Panel] B "Uninstall a program".
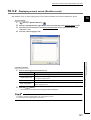
2.
Select "GX LogViewer" from the list of programs
and click the
button.
< When using Windows Vista®, Windows® 7, or
Windows® 8 >
Select "GX LogViewer" from the programs and click
"Uninstall".
< When using Windows Vista®, Windows® 7, or
Windows® 8 >
If User Account Control is turned ON, the message to
confirm the activation of the installer is displayed as
shown on the left.
(The screen image is from Windows Vista®.)
3.
Click the
button. (For Windows® 7 and
Windows® 8, click the
To the next page
38
button.)
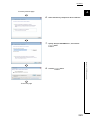
CHAPTER 4 ACQUIRING AND STARTING GX LogViewer
From the previous page
4.
Click the
button.
When the screen shown on the left is displayed,
uninstall is complete.
5.
Click the
4
button and close the screen.
Uninstallation complete
4.2 Installation
4.2.2 Uninstallation procedure
39
4.3
Starting GX LogViewer
This section explains the method for starting GX LogViewer. The following are the two starting methods.
• Starting from the Start menu
• Starting from the configuration tool.
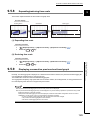
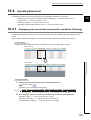
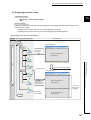
4.3.1
Starting from the Start menu
After installing GX LogViewer, it can be started with the operation below.
Operating procedure
Select [start] B [All Programs] B [MELSOFT Application]
B [Logging Function] B [GX LogViewer].
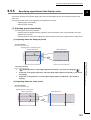
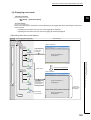
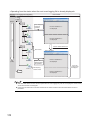
4.3.2
Starting from the configuration tool
After installing GX LogViewer, it can be started from the logging configuration tool or High Speed Data Logger Module
configuration tool with the operation below.
Operating procedure
1.
2.
40
Start the logging configuration tool or High Speed Data Logger Module configuration tool.
Select [Tool] B [Start GX LogViewer].
CHAPTER 5 OPERATION FLOWS
CHAPTER 5
OPERATION FLOWS
This section explains the operation flows to display data and events sampled by module or sampling trace data saved
with GX Works2 on GX LogViewer.
Item
Reference
When using QnUDVCPU/LCPU or Q/L Series Analog Module
Operation flow for a user using GX LogViewer for the first time
Page 42, Section 5.1.1
Operation flow for the basic operations of GX LogViewer
Page 43, Section 5.1.2
Operation flow for an experienced user of GX LogViewer
Page 44, Section 5.1.3
When using High Speed Data Logger Module
Operation flow for a user using GX LogViewer for the first time
Page 45, Section 5.2.1
Operation flow for the basic operations of GX LogViewer
Page 46, Section 5.2.2
Operation flow for an experienced user of GX LogViewer
Page 47, Section 5.2.3
5
When using High Speed Data Communication Module
Operation flow for a user using GX LogViewer for the first time
Page 48, Section 5.3.1
Operation flow for the basic operations of GX LogViewer
Page 49, Section 5.3.2
Operation flow for an experienced user of GX LogViewer
Page 50, Section 5.3.3
When Using Energy Measuring Unit
Page 51, Section 5.4
Operations flow When displaying sampling trace data
Page 51, Section 5.5
Operations while trend graphs are displayed
Page 52, Section 5.6
Operations while event list is displayed.
Page 52, Section 5.7
The sampled logging data is saved in a memory card installed on a module.
Therefore, select the logging file in the memory card installed on the module when displaying sampled data on GX
LogViewer.
The save destination memory card type for each module is shown below.
CPU module
QCPU (excluding QnUDVCPU)
QnUDVCPU
LCPU
Save destination memory card type
ATA card
SD memory card
High Speed Data Logger Module
CompactFlash Card
Energy Measuring Unit
SD memory card
41
5.1
5.1.1
When Using QnUDVCPU/LCPU or Q/L Series Analog
Module
Operation flow for a user using GX LogViewer for the first time
QnUDVCPU High Speed Data Logger High Speed Data Communication Q Analog L CPU
Use the assistant function ( Page 64, CHAPTER 7) when using GX LogViewer for the first time.
Assistant function
Show Logged
Save Logging
Device Status
Files to PC
(Historical trend)
Selecting connection destination
Specify a QCPU/LCPU to be communicated.
Page 72, Section 8.2
Canceling the access authentication
Cancel the access restriction for QCPU/LCPU. (When the remote password is set.)
Selecting a logging file
Selecting and saving a logging file
Select a data logging file (a file in the memory
Select a logging file
card installed on the QCPU/LCPU) to be displayed.
and save it.
Page 97, Section 9.3.1 (1)
Page 174, CHAPTER 11
The logging file is saved
Trend graphs are displayed.
in the specified directory.
For operations while trend graphs are displayed,
Saved logging files can
refer to the following section.
be checked on the
Page 52, Section 5.6
historical display or Excel.
Page 100, Section 9.3.1 (4)
For details of remote password, refer to the following manual.
Qn(H)/QnPH/QnPRHCPU User's Manual(Function Explanation, Program Fundamentals)
QnUCPU User's Manual (Function Explanation, Program Fundamentals)
MELSEC-L CPU Module User's Manual (Function Explanation, Program Fundamentals)
42
L Analog
CHAPTER 5 OPERATION FLOWS
5.1.2
Operation flow for the basic operations of GX LogViewer
QnUDVCPU High Speed Data Logger High Speed Data Communication Q Analog L CPU
Display data
saved in the
QCPU/LCPU
Display data
saved in
the personal
computer
L Analog
Save logging
files to personal
computer
(Historical trend)
Select [File]
[Open] (
Select [Online]
), or
Select [Online]
[Open Logging
drag and drop the file
File] (
)
[Save Logging
File to PC] (
5
)
Specifying the module
Select the equipment to be connected.
Page 71, Section 8.1
Selecting connection destination
Set a QCPU/LCPU to be accessed.
Page 72, Section 8.2
Canceling the access authentication
Cancel the access restriction for QCPU/LCPU.
(When the remote password is set.)
Page 100, Section 9.3.1 (4)
Selecting a logging file
Select a data logging file (a file in the
memory card installed on the
QCPU/LCPU) to be displayed.
Selecting and saving a logging file
Select a logging file and
save it.
Page 97, Section 9.3.1 (1)
Page 174, CHAPTER 11
Trend graphs are displayed.
For operations while trend graphs are displayed,
refer to the following section.
Page 52, Section 5.6
5.1 When Using QnUDVCPU/LCPU or Q/L Series Analog Module
5.1.2 Operation flow for the basic operations of GX LogViewer
Selecting a logging file
Select a logging file (a file in a
personal computer or a memory
medium) of data to be displayed.
The logging file is saved
in the specified directory.
Saved logging files can
be checked on the
historical display or
Excel.
Page 100, Section 9.3.1 (4)
For details of remote password, refer to the following manual.
Qn(H)/QnPH/QnPRHCPU User's Manual(Function Explanation, Program Fundamentals)
QnUCPU User's Manual (Function Explanation, Program Fundamentals)
MELSEC-L CPU Module User's Manual (Function Explanation, Program Fundamentals)
43
5.1.3
Operation flow for an experienced user of GX LogViewer
QnUDVCPU High Speed Data Logger High Speed Data Communication Q Analog L CPU
L Analog
Display past logged data
(Historical trend)
Select [File]
[Recent Folders]
[(Folder name)]
Page 182, Section 12.4
Select [Window]
[Frequently-used Window Configuration]
[(Name of window configuration)]
Page 177, Section 12.2
Select [Window]
[Recent Windows]
[(Type of window)]
[(Name of window)]
Page 181, Section 12.3
Select [Online]
[Recent Folders]
[(Folder name)]
Page 182, Section 12.4
Canceling the access authentication
Cancel the access restriction for QCPU/LCPU. (When the remote password is set.)
Selecting a logging file
Selecting a logging file
Select a logging file (a file in
a personal computer or
a memory medium) of data
to be displayed.
Select a data logging file (a file in
the memory card installed on the
QCPU/LCPU) to be displayed.
Page 100, Section 9.3.1 (4)
Page 97, Section 9.3.1 (1)
Historical trend
For operations while trend graphs are
displayed, refer to the following section.
Page 52, Section 5.6
For details of remote password, refer to the following manual.
Qn(H)/QnPH/QnPRHCPU User's Manual(Function Explanation, Program Fundamentals)
QnUCPU User's Manual (Function Explanation, Program Fundamentals)
MELSEC-L CPU Module User's Manual (Function Explanation, Program Fundamentals)
44
CHAPTER 5 OPERATION FLOWS
5.2
When Using High Speed Data Logger Module
When displaying the sampled data on GX LogViewer, select a logging file in a memory card or a logging setting being
executed.
5.2.1
Operation flow for a user using GX LogViewer for the first time
QnUDVCPU High Speed Data Logger High Speed Data Communication
Q Analog
L CPU
L Analog
Use the assistant function ( Page 64, CHAPTER 7) when using GX LogViewer for the first time.
Assistant function
5
Show Logged
Device Status
(Historical trend)
Show Logged
Events
(Historical event)
Show Current
Device Status
(Realtime trend)
Show Ongoing
Events
Save Logging
Files to PC
(Realtime event)
Selecting connection destination
Set a High Speed Data Logger Module to be accessed.
5.2 When Using High Speed Data Logger Module
5.2.1 Operation flow for a user using GX LogViewer for the first time
Page 79, Section 8.3
Canceling the access authentication
Cancel the access restriction of the High Speed Data Logger Module. (When the access restriction is set.)
Selecting a logging file
Select a logging file (a file in the
CompactFlash card installed on the
High Speed Data Logger Module) of
data or event to be displayed.
Page 98, Section 9.3.1 (2)
Page 159, Section 10.3.1 (1)
Trend graphs are displayed.
For operations while trend graphs are displayed,
refer to the following section.
Page 52, Section 5.6
Selecting a logging setting
Select a logging setting of data
or event to be displayed.
Selecting and saving a logging file
Select a logging file
and save it.
Page 101, Section 9.3.2
Page 161, Section 10.3.2
Page 174, CHAPTER 11
The event list is displayed.
For operations while the event list is displayed,
refer to the following section.
Page 52, Section 5.7
The logging file is
saved in the specified
directory.
Saved logging files can
be checked on the
historical display or
Excel.
Page 100, Section 9.3.1 (4)
For details of the access authentication, refer to the following manual.
High Speed Data Logger Module User's Manual
45
5.2.2
Operation flow for the basic operations of GX LogViewer
QnUDVCPU High Speed Data Logger High Speed Data Communication
Display data
saved in the
High Speed Data
Logger Module
Display data
saved in the
personal
computer
Display events
saved in the
personal
computer
Display events
saved in the
High Speed Data
Logger Module
(Historical trend)
Display current
device status
Select [Online]
[Open] (
),
or drag and drop
Select [File]
[Open Logging
File] (
Display ongoing
events
L CPU
L Analog
Save logging
files to
the personal
computer
(Realtime trend)
(Historical event)
Select [File]
Q Analog
[Open] (
)
or drag and drop
the file
(Realtime event)
Select [Online]
),
[Open Logging
File] (
)
Select [Online]
Select [Online]
Select [Online]
[Realtime Monitor]
[Realtime Monitor]
[Save Logging
(
(
File to PC] (
)
)
)
the file
Specifying the module
Select the equipment to be connected.
Specifying the module
Select the equipment to be connected.
Page 71, Section 8.1
Page 71, Section 8.1
Selecting connection destination
Set a High Speed Data Logger Module to be accessed.
Page 79, Section 8.3
Canceling the access authentication
Cancel the access restriction of the High Speed Data Logger Module. (When the access restriction is set.)
Selecting a logging file
Select a logging file (a file in a
personal computer or a memory
medium) of data or event to be
displayed.
Page 100, Section 9.3.1 (4)
Page 160, Section 10.3.1 (2)
Selecting a logging file
Select a logging file (a file in the
CompactFlash card installed on the
High Speed Data Logger Module) of
data or event to be displayed.
Page 98, Section 9.3.1 (2)
Page 159, Section 10.3.1 (1)
Trend graphs are displayed.
For operations while trend graphs are displayed,
refer to the following section.
Page 52, Section 5.6
Selecting a logging setting
Select a logging setting of
data or event to be
displayed.
Page 101, Section 9.3.2
Page 161, Section 10.3.2
The event list is displayed
For operations while the event list is displayed,
refer to the following section.
Page 52, Section 5.7
Selecting and saving a logging file
Select a logging file
and save it.
Page 174, CHAPTER 11
The logging file is
saved in the specified
directory.
Saved logging files can
be checked on
the historical display or
Excel.
Page 100, Section 9.3.1 (4)
For details of the access authentication, refer to the following manual.
High Speed Data Logger Module User's Manual
46
CHAPTER 5 OPERATION FLOWS
5.2.3
Operation flow for an experienced user of GX LogViewer
QnUDVCPU High Speed Data Logger High Speed Data Communication
Display past logged data or event
Select [Window]
[Frequently-used Window Configuration]
[(Name of window configuration)]
Page 182, Section 12.4
Page 177, Section 12.2
L CPU
L Analog
Display currently logging data or event
(Historical trend/Historical event)
Select [File]
[Recent Folders]
[(Folder name)]
Q Analog
(Realtime trend/Realtime event)
5
Select [Online]
[Recent Folders]
[(Folder name)]
Select [Window]
[Recent Windows]
[(Type of window)]
[(Name of window)]
Page 181, Section 12.3
Page 182, Section 12.4
Canceling the access authentication
Cancel the access restriction of the High Speed Data
Logger Module. (When the access restriction is set.)
Selecting a logging file
Select a logging file (a file in a
personal computer or a memory
medium) of data or event to be
displayed.
Page 98, Section 9.3.1 (2)
Page 159, Section 10.3.1 (1)
Page 100, Section 9.3.1 (4)
Page 160, Section 10.3.1 (2)
Historical trend/Historical event
For operations while trend graphs are
displayed, refer to the following section.
Page 52, Section 5.6
5.2 When Using High Speed Data Logger Module
5.2.3 Operation flow for an experienced user of GX LogViewer
Selecting a logging file
Select a logging file (a file in the
CompactFlash card installed on the
High Speed Data Logger Module) of
data or event to be displayed.
Historical trend/Historical event
Realtime trend/Realtime event
For operations while the event list is displayed,
refer to the following section.
Page 52, Section 5.7
For details of the access authentication, refer to the following manual.
High Speed Data Logger Module User's Manual
47
5.3
When Using High Speed Data Communication Module
When displaying the sampled data on GX LogViewer, select a logging setting being executed.
5.3.1
Operation flow for a user using GX LogViewer for the first time
QnUDVCPU High Speed Data Logger High Speed Data Communication
Q Analog
L CPU
Use the assistant function ( Page 64, CHAPTER 7) when using GX LogViewer for the first time.
Assistant function
Show Current
Device Status
(Realtime trend)
Selecting connection destination
Set a High Speed Data Communication Module to be accessed.
Page 83, Section 8.4
Canceling the access authentication
Cancel the access restriction of the High Speed Data Communication Module. (When the access restriction is set.)
Selecting a logging file
Select a logging file to be displayed.
Page 102, Section 9.3.2 (2)
Trend graphs are displayed.
For operations while trend graphs are displayed,
refer to the following section.
Page 52, Section 5.6
For details of remote password, refer to the following manual.
High Speed Data Communication Module User's Manual
48
L Analog
CHAPTER 5 OPERATION FLOWS
5.3.2
Operation flow for the basic operations of GX LogViewer
QnUDVCPU High Speed Data Logger High Speed Data Communication
L Analog
(Realtime trend)
(Historical trend)
[Open] (
L CPU
Display current
device status
Display data (CSV file
saved with realtime trend)
saved in the personal
computer
Select [File]
Q Analog
[Online]
),
(
or drag and drop the file
[Realtime Monitor]
)
5
Specifying the module
Select the equipment to be connected.
Page 83, Section 8.4.1
Selecting connection destination
Set a High Speed Data Communication Module
to be accessed.
Page 84, Section 8.4.2
Canceling the access authentication
5.3 When Using High Speed Data Communication Module
5.3.2 Operation flow for the basic operations of GX LogViewer
Cancel the access restriction of the
High Speed Data Communication Module.
(When the access restriction is set.)
Selecting a logging setting
Selecting a logging file
Select a logging file (a file in the
personal computer) to be displayed.
Page 102, Section 9.3.2 (2)
Select a logging setting of data or event to be
displayed.
Page 102, Section 9.3.2 (2)
Trend graphs are displayed.
For operations while trend graphs are displayed,
refer to the following section.
Page 52, Section 5.6
For details of remote password, refer to the following manual.
High Speed Data Communication Module User's Manual
49
5.3.3
Operation flow for an experienced user of GX LogViewer
QnUDVCPU High Speed Data Logger High Speed Data Communication
Display the logging data saved with
Select [Window]
[Frequently-used Window Configuration]
[(Name of window configuration)]
Page 177, Section 12.2
Selecting a logging file
Select a logging file (a file in a
personal computer) of data to be
displayed.
Select [Window]
[Recent Windows]
[(Type of window)]
[(Name of window)]
Page 181, Section 12.3
Canceling the access authentication
Cancel the access restriction of the High Speed Data
Communication Module.
(When the access restriction is set.)
Page 102, Section 9.3.2 (2)
Historical trend
For operations while trend graphs are displayed,
refer to the following section.
Realtime trend
For operations while the realtime monitor is displayed,
refer to the following section.
Page 52, Section 5.6
For details of remote password, refer to the following manual.
High Speed Data Communication Module User's Manual
50
L Analog
(Realtime trend)
Historical trend
Page 182, Section 12.4
L CPU
Display currently logging data
realtime trend
Select [File]
[Recent Folders]
[(Folder name)]
Q Analog
Page 52, Section 5.7
CHAPTER 5 OPERATION FLOWS
5.4
When Using Energy Measuring Unit
When displaying a sampled data on GX LogViewer, select the logging file saved in a personal computer or an SD
memory card installed on a personal computer.
For the saving methods of logging data in CSV file format, refer to the manual of Energy Measuring Unit.
Display logging data
saved with Energy Measuring Unit
[File]
[Open] (
), or drag and drop a file.
Select the logging file to be displayed.
5
A logging data is displayed on the trend graph.
For operations while trend graph is displayed,
refer to the following section.
Page 52, Section 5.6
5.5
Operation flow when displaying sampling trace data
5.4 When Using Energy Measuring Unit
Displaying sampling trace data in GX LogViewer format saved with GX Works2.
For operations saving sampling trace data in GX LogViewer format, refer to the following manual.
GX Works2 Version 1 Operating Manual (Common)
Display sampling trace data
saved with GX Works2
[File]
[Open] (
), or drag and drop a file.
Select the GX LogViewer format sampling trace data.
A sampling trace data is displayed.
For operations while sampling trace data is displayed,
refer to the following section.
Page 52, Section 5.6
Saving sampling trace data in GX LogViewer format is applicable when using GX Works2 Version 1.91V or later.
51
5.6
Operations while trend graphs are displayed
QnUDVCPU High Speed Data Logger High Speed Data Communication
Checking data using a
cursor.
Page 106, Section 9.4.1
Adjusting trend graphs.
(Moving, zooming in/out,
arranging, etc.)
Page 111, Section 9.5
Q Analog
LCPU
L Analog
L CPU
L Analog
Changing display items in
graph area.
(Multiple cursor, cursor
labels, etc.)
Page 134, Section 9.6
Changing graph
appearance.
(Color, line type, line
thickness, etc.)
Registering the
configuration of frequentlyused window to the menu.
Saving displayed data in
the CSV format or the
image format.
Page 138, Section 9.7
Page 177, Section 12.2
Page 184, Section 13.2
Printing trend graphs.
Page 207, CHAPTER 14
5.7
Operations while event list is displayed
QnUDVCPU High Speed Data Logger High Speed Data Communication
Changing display settings
of event list.
(Text color, display item, etc.)
Operating an event list.
(Sorting, filtering, etc.)
Saving displayed events in
the CSV format or the
image format.
Page 171, Section 10.5
Page 163, Section 10.4
Page 203, Section 13.3
Registering the
configuration of frequentlyused window to the menu.
Page 177, Section 12.2
52
Q Analog
CHAPTER 6 SCREEN CONFIGURATION
CHAPTER 6
SCREEN CONFIGURATION
QnUDVCPU High Speed Data Logger High Speed Data Communication
6.1
Q Analog
LCPU
L Analog
Main Window
The following figure shows the main window configuration of GX LogViewer.
Screen display
Menu bar
Toolbar
6
Main window
Main window
Description
Reference
An entire screen that displays a menu bar, a toolbar and child windows.
-
Menu bar
Displays menu options for executing each function.
Page 56, Section 6.3
Toolbar
Displays tool buttons for executing each function.
Page 61, Section 6.4
6.1 Main Window
Item
Remark
Only one main window can be displayed on the screen since multiple GX LogViewer cannot be activated.
53
6.2
Child Windows
Child windows (trend windows and/or event windows) are displayed in the main window.
Child windows can be displayed on a per-logging-setting basis or a per-logging-file basis.
Screen display
Event window
Trend window
For details of trend window and event window displayed in the main window, refer to the following chapters.
Name
Function
Reference
Trend window
Trend graph function
Page 87, CHAPTER 9
Event window
Event monitoring function
Page 153, CHAPTER 10
(1) Tiling windows vertically/horizontally, or cascading windows
All displayed child windows can be tiled vertically/horizontally, or cascaded by the following operation.
Operating procedure
[Window] B [Tile Vertically](
[Tile vertically]
54
) / [Tile Horizontally](
[Tile horizontally]
) / [Cascade](
[Cascade]
)
CHAPTER 6 SCREEN CONFIGURATION
(2) Bringing hidden window to front
Select a file name, data logging setting or event logging setting by the following operation to bring the selected
child window to the front.
Operating procedure
[Window] B [(window name)]
● The maximum of two screens can be displayed simultaneously when executing realtime monitor (realtime trend and
realtime event) with a single High Speed Data Logger Module.
● The number of realtime monitor (realtime trend) which can be displayed simultaneously with a single High Speed Data
Communication Module is shown below.
• High speed sampling: maximum of two screens
• General sampling: maximum of four screens (when using two screens for high speed sampling, the total of two
screens can be displayed for general sampling)
6
Remark
The maximum number of simultaneous access for a single module differs depending on the module.
6.2 Child Windows
55
6.3
Menu Configuration
The following tables show the menu configuration of GX LogViewer.
(1) File
Item
Description
Open
Opens a file saved in a personal computer.
Recent Folders
Opens a folder used recently in a personal computer.
Close
Closes an active window in the main window.
Save As
Reference
Page 100, Section 9.3.1 (4)
Page 160, Section 10.3.1 (2)
Page 182, Section 12.4
-
-
Save CSV File
Save Image File
Print
Saves data or events displayed on a trend window or event window in
the CSV file format.
Page 183, CHAPTER 13
Saves graphic image displayed on a trend window or event window in
the image file format.
Prints trend graphs.
Import and Export
Exit
Page 207, CHAPTER 14
Reads/writes files to utilize the settings between other users or
Page 144, Section 9.8
personal computers.
Page 177, Section 12.2
Exits GX LogViewer.
-
(2) View
Item
Description
Toolbar
-
Reference
Page 61, Section 6.4
Standard
Display/hides the "Standard" toolbar.
Page 61, Section 6.4 (1)
Online
Display/hides the "Online" toolbar.
Page 61, Section 6.4 (2)
Graph Operation
Display/hides the "Graph Operation" toolbar.
Page 62, Section 6.4 (3)
Graph View
Display/hides the "Graph View" toolbar.
Page 62, Section 6.4 (4)
Event
Display/hides the "Event" toolbar.
Page 63, Section 6.4 (5)
Window
Display/hides the "Window" toolbar.
Page 63, Section 6.4 (6)
Show Assistant Dialog
Displays the Assistant screen to guide a user according to the purpose.
Page 64, CHAPTER 7
(3) Graph Operation
Item
Graph Alignment
Description
Aligns and displays trend graphs displayed in a graph area not to
superimpose.
Reference
Page 114, Section 9.5.2
Graph Superimpose
Superimposes and displays trend graphs displayed in a graph area.
Page 115, Section 9.5.3
Jump Cursor
Displays the Jump Cursor screen.
Page 116, Section 9.5.4
Auto Adjust Upper/Lower Bound
Automatically sets the upper/lower limit display value of the trend graph
For Period on Display
by the upper/lower limit value of the graph displayed within the screen
frame.
For All Period
Edit Upper/Lower Bound
Automatically sets the upper/lower limit display value of the trend graph
Page 123, Section 9.5.5
by the upper/lower limit value of the entire graph.
Displays a text box to specify the upper/lower limit display value of the
trend graph.
(To the next page)
56
CHAPTER 6 SCREEN CONFIGURATION
(From the previous page)
Item
Description
Reference
-
-
Adjust Scale
Widen Graph
Scales up the selected trend graph in a vertical direction.
Narrow Graph
Scales down the selected trend graph in a vertical direction.
Adjust Graph Location
Move Up Graph
Moves the selected trend graph upward.
Move Down Graph
Moves the selected trend graph downward.
Move Graph to Left
Moves the selected trend graph to left.
Move Graph to Right
Moves the selected trend graph to right.
Horizontal Moving Quantity
Reduction Time Scale
Show Previous Graph
Show Next Graph
Page 127, Section 9.5.7
When moving the selected trend graph to left or right, set the time unit to
be moved.
Adjust Time Scale
Expansion Time Scale
Page 126, Section 9.5.6
Expands the time scale of the graph area.
Page 129, Section 9.5.8
Reduces the time scale of the graph area.
Consecutively displays the trend graphs displayed on the historical
window and the trend graphs of previous data logging file.
Consecutively displays the trend graphs displayed on the historical
Page 129, Section 9.5.9
6
window and the trend graphs of next data logging file.
(4) Graph View
Item
Multiple Cursor
Description
Reference
Displays/hides the second cursor.
Page 134, Section 9.6.1
Cursor Label
Displays/hides cursor labels.
Page 135, Section 9.6.2
Graph Highlight
Displays/hides graph highlight.
Page 143, Section 9.7.2
Thickens a line of the selected trend graph.
Page 143, Section 9.7.3
Data Name
Displays/hides the data names.
Page 135, Section 9.6.3
Plot Format
Equidistance Plot
Time Interval Plot
Switch the graph format displaying on a historical trend window to
equidistance plot format.
Page 135, Section 9.6.3
Switch the graph format displaying on a historical trend window to time
interval plot.
Time Label
-
Time
Displays the time on the time scale.
Date
Displays the date on the time scale.
Date and Time
Displays the date and time on the time scale.
Index
Displays the index on the time scale.
Page 137, Section 9.6.5
Set Language
Chinese Simplified
Chinese Traditional
English
Displays data names in a selected language or character code.
Page 137, Section 9.6.6
Graph Legends
Displays/hides the graph legend area.
Page 91, Section 9.2.2
Show All Graphs
Displays trend graphs of all data in the graph legend area.
Hide All Graphs
Hides trend graphs of all data in the graph legend area.
Change the Data to Draw Graphs
Displays a screen for adding/deleting data to be drawn.
Japanese
Korean
Unicode (UTF-8)
Page 111, Section 9.5.1
Page 108, Section 9.4.2
57
6.3 Menu Configuration
Bold Line
Item
Register Graphical Display
Settings
Operate Graphical Display
Settings
Set Graph View by the Auto
Reflect Function
Initialize Graph View
Graph Properties
58
Description
Reference
Registers the display settings of data in the trend graphs.
Page 144, Section 9.8
Reflects the display settings of registered data to the trend window.
Stores the graph display information being displayed by each data
logging setting, and reflect them automatically when open the trend
Page 148, Section 9.9
window next time.
Initializes changed graph display information(graph color, etc.).
Displays the Graph Properties screen for setting the trend graph
functions.
Page 148, Section 9.10
Page 138, Section 9.7.1
CHAPTER 6 SCREEN CONFIGURATION
(5) Event
Item
Filter
Description
Displays/hides the filtered lines.
Sort by
Reference
Page 163, Section 10.4.1
-
Date
Switches the ascending/descending order by date.
No.
Switches the ascending/descending order by number.
Event Logging Name
Switches the ascending/descending order by event logging name.
Status
Switches the ascending/descending order by status.
Comment
Switches the ascending/descending order by comment.
Monitoring Data
Switches the ascending/descending order by monitoring data.
Page 165, Section 10.4.2
Set Language
Chinese Simplified
Chinese Traditional
English
Japanese
Displays event logging names and comments in a selected language
or character code.
Page 166, Section 10.4.3
6
Korean
Unicode (UTF-8)
Show Previous Event
Show Next Event
Event Properties
Consecutively displays the events displayed on the historical event
window and the events of previous event logging file.
Consecutively displays the events displayed on the historical event
Page 166, Section 10.4.4
window and the events of next event logging file.
Displays the Event Properties screen for setting the event monitor
functions.
Page 171, Section 10.5
Item
Open Logging File
Description
Opens the logging files in the memory card installed on the module.
Reference
Page 96, Section 9.3.1
Page 158, Section 10.3.1
Displays the data or events being sampled by the High Speed Data
Realtime Monitor
Logging Module.
Page 101, Section 9.3.2
Displays the data being sampled by the High Speed Data
Page 161, Section 10.3.2
Communication Module.
Recent Folders
Save Logging File to PC
Displays the recently used folder in the memory card installed on the
module.
Saves logging files to a personal computer in the memory card installed
on the module.
Begin Monitor
Starts monitoring the realtime trend graphs/realtime event monitor.
End Monitor
Stops monitoring the realtime trend graphs/realtime event monitor.
Page 182, Section 12.4
Page 174, CHAPTER 11
Pauses the drawing of the realtime trend graphs.
Pause Monitor
(However, the communication with the high speed data logger is not
Page 104, Section 9.3.3
disconnected.)
Restart Monitor
Restart the drawing of the paused realtime trend graphs.
Clear Graph
Clears the graphs and restarts the drawing of the graphs.
59
6.3 Menu Configuration
(6) Online
(7) Tool
Item
Start High Speed Data Logger
Module Configuration Tool*1
Start High Speed Data
Communication Module
Configuration Tool
Start Logging Configuration Tool
*1 :
Description
Activates the High Speed Data Logger Module configuration tool.
Activates the High Speed Data Communication Module configuration
tool.
Activates the QnUDVCPU & LCPU logging configuration tool.
Reference
-
-
This item is not displayed in the Chinese version of GX LogViewer Version 1.
(8) Window
Item
Description
Frequently-used Window
Reference
-
Configuration
Add To Frequently-used
Names the configuration of the window being displayed and adds as
Window Configuration
'frequently-used window configuration' on the menu.
(List of Often-Used Window
Displays a list of 'frequently-used window configuration' and recovers
Sets)
the selected "frequently-used window configuration".
Recent Windows
Page 177, Section 12.2
-
Historical Trend
Opens a historical trend window used recently.
Realtime Trend
Opens a realtime trend window used recently.
Historical Event
Opens a historical event window used recently.
Realtime Event
Opens a realtime event window used recently.
Tile Vertically
Tiles a trend window and event window vertically in the main window.
Tile Horizontally
Tiles a trend window and event window horizontally in the main window.
Cascade
Cascades trend windows and event windows in the main window.
Close All Windows
Closes all windows.
(Name of child window)
Activates the selected window.
Page 181, Section 12.3
Page 54, Section 6.2
Page 54, Section 6.2
(9) Help
Item
Description
Reference
Open Manual
Displays GX LogViewer Version 1 Operating Manual.
Page 214, Section 15.1
About GX LogViewer
Displays version information of GX LogViewer.
Page 214, Section 15.2
60
CHAPTER 6 SCREEN CONFIGURATION
6.4
Toolbars and Shortcut Keys
This section explains the toolbar configuration of GX LogViewer and the corresponding shortcut keys and menus.
(1) "Standard" toolbar
Toolbar icon
Corresponding menu
[File] B [Open]
[File] B [Save As] B [Save CSV File]
[File] B [Save As] B [Save Image File]
[File] B [Print]
(2) "Online" toolbar
Toolbar icon
6
Corresponding menu
[Online] B [Open Logging File]
[Online] B [Realtime Monitor]
[Online] B [Save Logging File to PC]
[Online] B [Begin Monitor]
[Online] B [End Monitor]
[Online] B [Pause Monitor]
6.4 Toolbars and Shortcut Keys
[Online] B [Restart Monitor]
[Online] B [Clear Graph]
61
(3) "Graph Operation" toolbar
Toolbar icon
Corresponding menu
Mouse scroll wheel
operation
[Graph Operation] B [Graph Alignment]
-
[Graph Operation] B [Graph Superimpose]
-
[Graph Operation] B [Jump Cursor]
-
[Graph Operation] B [Auto Adjust Upper/Lower Bound] B [For Period on
-
Display]
[Graph Operation] B [Auto Adjust Upper/Lower Bound] B [For All
-
Period]
[Graph Operation] B [Adjust Scale] B [Widen Graph]
[Graph Operation] B [Adjust Scale] B [Narrow Graph]
+ Scroll down
Alt
+ Alt
+ Scroll up
[Graph Operation] B [Adjust Graph Location] B [Move Up Graph]
Shift
[Graph Operation] B [Adjust Graph Location] B [Move Down Graph]
Shift
+ Alt
+ Scroll down
[Graph Operation] B [Adjust Graph Location] B [Move Graph to Left]
-
[Graph Operation] B [Adjust Graph Location] B [Move Graph to
-
Right]
[Graph Operation] B [Adjust Graph Location] B [Horizontal Moving
-
Quantity]
[Graph Operation] B [Adjust Time Scale] B [Expansion Time Scale]
[Graph Operation] B [Adjust Time Scale] B [Reduction Time Scale]
Ctrl
+ Scroll up
Ctrl
+ Scroll down
[Graph Operation] B [Show Previous Graph]
-
[Graph Operation] B [Show Next Graph]
-
(4) "Graph View" toolbar
Toolbar icon
Corresponding menu
[Graph View] B [Multiple Cursor]
[Graph View] B [Graph Legends]
[Graph View] B [Show All Graphs]
[Graph View] B [Hide All Graphs]
[Graph View] B [Cursor Label]
[Graph View] B [Plot Format] B [Equidistance Plot]/[Time Interval Plot]
62
+ Scroll up
Alt
CHAPTER 6 SCREEN CONFIGURATION
(5) "Event" toolbar
Toolbar icon
Corresponding menu
[Event] B [Filter]
(6) "Window" toolbar
Toolbar icon
Corresponding menu
[Window] B [Tile Vertically]
[Window] B [Tile Horizontally]
[Window] B [Cascade]
(7) Other shortcut keys
Shortcut key
Corresponding menu
Ctrl
+
Moves the red cursor one plot to the right.
Ctrl
+
Moves the red cursor one plot to the left.
Shift
+
Moves the blue cursor one plot to the right.
Shift
+
Moves the blue cursor one plot to the left.
Ctrl
+
Shift
+
Moves the red cursor and the blue cursor one plot to the right.
Ctrl
+
Shift
+
Moves the red cursor and the blue cursor one plot to the left.
Moves the scroll bar in the graph area to the left.
PageDown
Moves the scroll bar in the graph area to the right.
Moves the scroll bar in the graph area to the left edge.
Home
Moves the scroll bar in the graph area to the right edge.
End
Select one data above in the graph legend area.
Select one data below in the graph legend area.
Displays a text box to specify the upper/lower limit display value of the selected trend graph.
F12
Alt
+
F4
Exits GX LogViewer.
63
6.4 Toolbars and Shortcut Keys
PageUp
6
CHAPTER 7
ASSISTANT FUNCTION
QnUDVCPU High Speed Data Logger High Speed Data Communication
7.1
Q Analog
LCPU
L Analog
Overview
The assistant function is a function to guide a user who is not familiar with the operations of GX LogViewer.
Applicable functions for a specific module are displayed. Click a button that corresponds to the purpose and execute
the function.
Screen display
Module
selection area
Display contents
Item
Description
Module selection area
-
Q Series
QnUDVCPU
A guide to operations of functions for data sampled by a
QnUDVCPU.
A guide to operations of functions for data sampled by a High
Logger Module
Speed Data Logger Module.
Communication
Module
Analog Module
A guide to operations of functions for data sampled by a High
Speed Data Communication Module.
A guide to operations of functions for data sampled by a Q Series
Analog Module.
L Series
LCPU
Analog Module
Show at Startup
64
Page 65, Section 7.2.1
High Speed Data
High Speed Data
Reference
Page 65, Section 7.2.1 (1)
Page 66, Section 7.2.1 (2)
Page 67, Section 7.2.1 (3)
Page 68, Section 7.2.1 (4)
Page 69, Section 7.2.2
A guide to operations of functions for data sampled by an LCPU.
A guide to operations of functions for data sampled by an L Series
Analog Module.
Switches the display/hide of the Assistant screen when GX
LogViewer is activated.
Page 69, Section 7.2.2 (1)
Page 70, Section 7.2.2 (2)
-
CHAPTER 7 ASSISTANT FUNCTION
7.2
Screen Configuration
The Assistant screen is set to be displayed automatically when GX LogViewer is activated.
To redisplay the Assistant screen that is closed,
7.2.1
select [View] B [Show Assistant Dialog].
Q Series
(1) QnUDVCPU
Screen display
7
Name
Description
Show Logged
A guide to display the device status, on which a logging was
Device Status
performed by a QnUDVCPU, as historical trend graphs.
Save Logging
Files to PC
Reference
Page 97, Section 9.3.1 (1)
A guide to operations of saving a data logging file on an SD memory
card (root directory) which is installed on a QnUDVCPU to a personal
Page 174, CHAPTER 11
computer.
65
7.2 Screen Configuration
7.2.1 Q Series
Display contents
(2) High Speed Data Logger Module
Screen display
Display contents
Name
Show Logged
Device Status
66
Description
Reference
A guide to display the device status, on which a consecutive logging
or trigger logging was performed by a High Speed Data Logger
Page 98, Section 9.3.1 (2)
Module, as historical trend graphs.
Show Current
A guide to display the current device status sampled by a High
Device Status
Speed Data Logger Module as realtime trend graphs.
Show Logged
A guide to display events logged by a High Speed Data Logger
Events
Module as historical events.
Show Ongoing
A guide to display events monitored by a High Speed Data Logger
Events
Module as realtime events.
Save Logging
A guide to save data logging files and event logging files in a High
Files to PC
Speed Data Logger Module to a personal computer.
Page 101, Section 9.3.2
Page 159, Section 10.3.1 (1)
Page 161, Section 10.3.2
Page 174, CHAPTER 11
CHAPTER 7 ASSISTANT FUNCTION
(3) High Speed Data Communication Module
Screen display
7
Display contents
Name
Description
Show Current
A guide to display the current device status sampled by a High
Device Status
Speed Data Communication Module as realtime trend graphs.
Reference
Page 102, Section 9.3.2 (2)
7.2 Screen Configuration
7.2.1 Q Series
67
(4) Analog Module
Screen display
Display contents
Name
Show Logged
A guide to display the device status, on which a logging was
Device Status
performed by a Q Series Analog Module, as historical trend graphs.
Save Logging
Files to PC
68
Description
Reference
Page 99, Section 9.3.1 (3)
A guide to operations of saving a data logging file on an ATA card
(root directory)/SD memory card (LOGGING folder) which is
installed on a QCPU to a personal computer.
Page 174, CHAPTER 11
CHAPTER 7 ASSISTANT FUNCTION
7.2.2
L Series
(1) LCPU
Screen display
7
Display contents
Name
Show Logged
Save Logging
Files to PC
Reference
A guide to display the device status, on which a consecutive
logging or trigger logging was performed by an LCPU, as
Page 97, Section 9.3.1 (1)
historical trend graphs.
A guide to operations of saving a data logging file on an SD
memory card (LOGGING folder) which is installed on an LCPU to
Page 174, CHAPTER 11
a personal computer.
69
7.2 Screen Configuration
7.2.2 L Series
Device Status
Description
(2) Analog Module
Screen display
Display contents
Name
Show Logged
Device Status
Save Logging
Files to PC
70
Description
Reference
A guide to display the device status, on which a logging was
performed by an L Series Analog Module, as historical trend
Page 99, Section 9.3.1 (3)
graphs.
A guide to operations of saving a data logging file on an SD
memory card (root directory) which is installed on an LCPU to a
personal computer.
Page 174, CHAPTER 11
CHAPTER 8 CONNECTING TO MODULE
CHAPTER 8
CONNECTING TO MODULE
In order to display or obtain logging data in the module, the type of module needs to be selected for communication.
This chapter explains the method for connecting a module.
8.1
Selecting Connection Destination
QnUDVCPU High Speed Data Logger High Speed Data Communication
Q Analog
LCPU
L Analog
Select the connecting target (QCPU, High Speed Data Logger Module, or LCPU) on the Connection Destination
screen.
Screen display
•
•
[Online] B [Open Logging File] (
)
[Online] B [Save Logging File to PC] (
)
8
8.1 Selecting Connection Destination
Operating procedure
1.
Select the equipment to be connected.
Item
Description
The previously
connected equipment
QCPU
High Speed Data
Logger Module
LCPU
2.
Click the
Select this to connect to the previously connected equipment.
When using the logging function of QnUDVCPU or Q Series Analog
Module, select this to connect to a QCPU.
Select this to connect to a High Speed Data Logger Module.
When using the logging function of LCPU or L Series Analog
Module, select this to connect to an LCPU.
Reference
Page 72, Section 8.2
Page 79, Section 8.3
Page 72, Section 8.2
button.
→ The screen to set the connection destination of the selected module is displayed.
71
8.2
Connecting to QCPU/LCPU
QnUDVCPU High Speed Data Logger High Speed Data Communication Q Analog L CPU
L Analog
When "QCPU" or "LCPU" is selected on the Connection Destination screen, the Transfer Setup screen is displayed.
Specify a connection destination to the memory card installed on a QCPU/LCPU where the logging file is saved on the
Connection Destination screen.
8.2.1
Transfer setup screen
Screen display
Display contents
Item
PC side I/F
PLC side I/F
Other Station Setting
No Specification
Other Station [Single
Network]
Other Station [Co-existence
Network]
Description
Set the interface of the personal computer.
Set the interface of the LCPU connected to the personal
computer.
Specify this to access the LCPU directly connected to the
personal computer
Reference
-
Specify this to access the LCPU on another station via only
one kind of network (including a multi-tier system) such as
-
CC-Link only, C24 module only or Ethernet only.
Specify this to access the LCPU on another station via CCLink or serial communication from the Q series programmable
-
controller connected to the personal computer.
Select the network type, network number, station number, and
Network Communication Route
start I/O number of the network that is routed for accessing the
LCPU on another station. The setting items depend on the
selected network type.
72
-
CHAPTER 8 CONNECTING TO MODULE
Item
Description
Reference
Connection destinations can be set by checking network
routes on the Connection Channel List screen.
button
Since the route selected in the Connection Channel List
Page 78, Section 8.2.5
screen is set automatically on the Transfer Setup screen, the
setting is easy even for a complex system.
button
Set the connection destination to connect a programmable
controller CPU and a personal computer directly.
Page 74, Section 8.2.2
Tests if the target LCPU set on the Transfer Setup screen can
be accessed normally.
button
If accessed normally, the model type of the target LCPU
Page 78, Section 8.2.4
module is displayed in the "PLC Type" field, one of the
detailed setting display fields.
button
Displays a set connection channel in an illustration.
-
button
Confirms the connection settings and closes the screen.
-
button
Cancels the connection settings and closes the screen.
-
On the setting screen, the items with underline can be set. Double-click the item for a detailed setting.
The items with yellow icon indicate that the items are already set.
Operating procedure
•
The following are the two connection methods for QCPU/LCPU. Perform the operation by
following the instruction described on the reference page.
• Connecting directly using a USB/Ethernet cable (Page 74, Section 8.2.2)
8
• Connecting via network (Page 75, Section 8.2.3)
8.2 Connecting to QCPU/LCPU
8.2.1 Transfer setup screen
73
8.2.2
Connecting directly using a USB/Ethernet cable
Screen display
•
Click the
button on the Transfer Setup screen (Page 72, Section 8.2.1).
Operating procedure
1.
Select "USB" or "Ethernet" on the PLC Direct Connection Setting screen and click the
button.
2.
74
Click the
button on the Transfer Setup screen (Page 72, Section 8.2.1).
CHAPTER 8 CONNECTING TO MODULE
8.2.3
Connecting via network
The Transfer Setup screen is used to set the connection.(Page 72, Section 8.2.1)
PC side I/F
PLC side I/F
Network
Communication
Route
Co-existence
Network Route
8
Operating procedure
1.
In "PC side I/F", specify the connection interface of the personal computer to which GX LogViewer
2.
In "PLC side I/F", specify the connection interface of the programmable controller CPU.
When connecting to a Built-in Ethernet port CPU, the programmable controller CPU can be searched on
the network and specified.
Page 76, (1) in this section Search and specify Built-in Ethernet port CPU module on network
3.
4.
In "Other Station Setting", specify the existence of other stations.
In "Network Communication Route", select the network type, network number, station number,
and start I/O number of the network that is routed for accessing the programmable controller CPU
on another station. The setting items depend on the selected network type.
5.
Click the
button.
75
8.2 Connecting to QCPU/LCPU
8.2.3 Connecting via network
is installed.
(1) Search and specify Built-in Ethernet port CPU module on network
Screen display
1.
2.
Select "Ethernet Board" in "PC side I/F" on the Transfer Setup screen.
Double-click "PLC Module" in "PLC side I/F".
Connection
destination
CPU list
Operating procedure
1.
Select the CPU mode (LCPU or QCPU (Q mode)) to connect with a personal computer in "PLC
Mode".
2.
Select "Connection via hub".
Item
Ethernet Port Direct Connection
Connection via HUB
3.
Description
Select this to connect directly to the Ethernet port of programmable controller
CPU using a USB cable.
Select this to connect to the programmable controller CPU by specifying the IP
address.
IP Address
Specify the IP address of the programmable controller CPU.
Host Name
Specify the host name of the programmable controller CPU.
Click the
button.
→ The information of the Built-in Ethernet port CPU on the network is displayed on the connection
destination CPU list.
Item
Connection destination CPU list
Response Wait Time
4.
Description
Displays IP address, CPU type, Label, and Comment of the detected
programmable controller CPU.
Displays a response wait time when searching for programmable controller
CPUs. (1 to 99 seconds).
Select a target CPU module from the connection destination programmable controller CPU list,
and click the
button.
→ The IP address of the selected programmable controller CPU in the connection destination CPU list is
reflected to "IP Address".
5.
Click the
button.
→ The information of the specified programmable controller CPU is reflected to the Transfer Setup
screen.
76
CHAPTER 8 CONNECTING TO MODULE
For Windows Vista®, Windows® 7, and Windows® 8, the following message may be displayed when the
button is clicked. Click the
button for Windows Vista®, and click the
button for
®
Windows 7 to disable the blockage and continue the operation. (The following screen image is from Windows Vista®.)
(2) Setting example (for CC-Link system)
The following is the example of connection destination setting under the following system configuration.
8
Master station Station No. 1 Station No. 2 Request target (Station No. 3)
#
$
&
CC-Link
%
8.2 Connecting to QCPU/LCPU
8.2.3 Connecting via network
#
$
%
&
• Accessible station numbers when accessing the programmable controller CPU on another station via CC-Link
When the programmable controller CPU is connected directly or via a serial communication module, accessible
station numbers when accessing the programmable controller CPU on another station via CC-Link are 0 (master)
to 63.
77
8.2.4
Communication test
This function tests if the connection route set on the Transfer Setup screen can be accessed normally.
Operating procedure
Set the route on the Transfer setup screen, and click the
button.
→ The following message is displayed when the connection is normal.
Ex:When connecting to an L26CPU-BT
8.2.5
Connection Channel List
A routes can be selected from the list while checking the route visually on the Connection Channel List screen. The
route selected on the Connection Channel List screen is set to the Transfer setup screen. Set the network number,
station number, and other settings depending on the access target.
Setting screen
List mode
Display All Routes
Display Selected
Routes
Displays all routes supported in GX LogViewer.
Displays only accessible routes for "Other Station Setting" and "Network Communication
Route" setting. Specify the interfaces for "PC side I/F" and "PLC side I/F" on the Transfer Setup
screen and select "Display Selected Routes" to display the routes.
button
button
button
78
Description
Applies the route selected from the connection channel list to the Transfer setup screen.
Applies the route selected from the connection channel list to the Transfer setup screen, and
closes the screen.
Without applying the route selected from the connection channel list to the Transfer setup
screen, closes the screen.
CHAPTER 8 CONNECTING TO MODULE
8.3
Connecting to High Speed Data Logger Module
QnUDVCPU High Speed Data Logger High Speed Data Communication
Q Analog
L CPU
L Analog
When "High Speed Data Logger Module" is selected on the Connection Destination screen, the Transfer Setup screen
is displayed.
The connection method needs to be specified on the Transfer Setup screen when connecting to a High Speed Data
Logger Module.
8.3.1
Transfer setup screen
Screen display
8
Display contents
Module Type
Description
Reference
"High-speed data logger module" is displayed.
Connection Condition
Connection via hub
IP address
-
Select the connection condition of a High Speed Data
-
Logger Module.
Select this to connect a High Speed Data Logger Module
by specifying the IP address.
Specify the IP address of the High Speed Data Logger
Page 80, Section 8.3.2
Module.
Opens the Find High Speed Data Logger Module screen
for searching High Speed Data Logger Modules on the
button
Page 81, Section 8.3.2 (2)
network.
Direct Connection
button
button
Connects a directly-connected High Speed Data Logger
Module without specifying the IP address.
Checks the communication with the High Speed Data
Logger Module specified as a connection destination.
Page 82, Section 8.3.3
Page 82, Section 8.3.4
Applies the settings and closes the screen.
-
Operating procedure
•
The following are the two connection methods for High Speed Data Logger Module.
• Connecting via hub with specifying IP address (Page 80, Section 8.3.2)
• Connecting directly using a crossing cable without specifying IP address (Page 82, Section 8.3.3)
79
8.3 Connecting to High Speed Data Logger Module
8.3.1 Transfer setup screen
Item
8.3.2
Connecting via hub with specifying IP address
When connecting via hub, specify the High Speed Data Logger Module to be connected by either following method.
• Directly entering the IP address of the High Speed Data Logger Module to be connected
• Searching for High Speed Data Logger Modules on the network
(1) Directly entering the IP address of the High Speed Data Logger Module to be
connected
Operating procedure
1.
2.
3.
Select "Connection via hub" on the Transfer Setup screen.(Page 79, Section 8.3.1)
Enter the IP address of the High Speed Data Logger Module to be connected to "IP address".
Click the
button.
Remark
When the guest account is used to login the operating system of a personal computer, it cannot communicate with a High
Speed Data Logger Module.
80
CHAPTER 8 CONNECTING TO MODULE
(2) Searching for High Speed Data Logger Modules on the network
Screen display
•
Click the
button on the Transfer Setup screen (Page 79, Section
8.3.1).
High Speed Data
Logger Module
information
Operating procedure
1.
Select a High Speed Data Logger Module to be connected from the list on the Find High Speed
Data Logger Module screen.
Item
High Speed Data Logger
Module information
*1
maximum of 64 modules are displayed.
High Speed Data Logger Module.
Comment*1
Displays logging file comment written to the detected High Speed Data Logger Module.
Displayed items can be sorted by double-clicking the column title.
Click the
button.
→ The IP address of the selected row is reflected to the Transfer Setup screen.
3.
Click the
button on the Transfer Setup screen.
Display contents
Item
Response waiting time
button
button
Description
Displays the response wait time when searching for modules. (1 to 99 seconds)
Flashes the "RUN" LED on the front of the module for 10 seconds to check the
selected High Speed Data Logger Module.
Searches for High Speed Data Logger Modules again, and updates the list.
81
8.3 Connecting to High Speed Data Logger Module
8.3.2 Connecting via hub with specifying IP address
Displays host name (a host name registered in the network setting) of the detected
Host name*1
2.
Displays a search result of High Speed Data Logger Modules exist on the network. A
Displays IP address of the detected High Speed Data Logger Module.
IP address
*1 :
8
Description
8.3.3
Connecting directly using a crossing cable without specifying
IP address
Operating procedure
1.
2.
8.3.4
Select "Direct Connection" on the Transfer Setup screen (Page 79, Section 8.3.1).
Click the
button.
Communication test
This function tests if the equipment communicates normally with the connection route set on the Transfer Setup
screen.
Operating procedure
Select a High Speed Data Logger Module to be connected on the Transfer Setup screen, click the
button.
→ The following message is displayed when the connection is normal.
82
CHAPTER 8 CONNECTING TO MODULE
8.4
Connecting to High Speed Data Communication Module
QnUDVCPU High Speed Data Logger High Speed Data Communication
Q Analog
L CPU
L Analog
When "High Speed Data Communication Module" is selected on the Connection Destination screen, the Transfer
Setup screen is displayed.
The connection method needs to be specified on the Transfer Setup screen when connecting to a High Speed Data
Communication Module.
8.4.1
Transfer setup screen
Screen display
•
[Online] B [Realtime Monitor] (
)
8
Item
Module Type
Description
"High-speed data communication module" is displayed.
Connection Condition
Connection via hub
IP address
Select the connection condition of a High Speed Data
Communication Module.
Reference
-
Select this to connect a High Speed Data Communication
Module by specifying the IP address.
Specify the IP address of the High Speed Data
Page 84, Section 8.4.2
Communication Module.
Opens the Find High Speed Data Communication Module
screen for searching High Speed Data Communication
button
Page 85, Section 8.4.2 (2)
Modules on the network.
Connects a directly-connected High Speed Data
Direct Connection
Communication Module without specifying the IP
Page 86, Section 8.4.3
address.
Checks the communication with the High Speed Data
button
Communication Module specified as a connection
Page 86, Section 8.4.4
destination.
button
Applies the settings and closes the screen.
-
Operating procedure
•
The following are the two connection methods for High Speed Data Communication Module.
• Connecting via hub with specifying IP address (Page 84, Section 8.4.2)
• Connecting directly using a crossing cable without specifying IP address (Page 86, Section 8.4.3)
83
8.4 Connecting to High Speed Data Communication Module
8.4.1 Transfer setup screen
Display contents
8.4.2
Connecting via hub with specifying IP address
When connecting via hub, specify the High Speed Data Communication Module to be connected by either following
method.
• Directly entering the IP address of the High Speed Data Communication Module to be connected
• Searching for High Speed Data Communication Modules on the network
(1) Directly entering the IP address of the High Speed Data Communication
Module to be connected
Operating procedure
1.
2.
Select "Connection via hub" on the Transfer Setup screen.(Page 83, Section 8.4.1)
Enter the IP address of the High Speed Data Communication Module to be connected to "IP
address".
3.
Click the
button.
Remark
When the guest account is used to login the operating system of a personal computer, it cannot communicate with a High
Speed Data Communication Module.
84
CHAPTER 8 CONNECTING TO MODULE
(2) Searching for High Speed Data Communication Modules on the network
Screen display
•
Click the
button on the Transfer Setup screen (Page 83, Section
8.4.1).
High Speed Data
Communication Module
information
Operating procedure
1.
Select a High Speed Data Communication Module to be connected from the list on the Find High
Speed Data Communication Module screen.
Item
High Speed Data
Communication Module
information
network. A maximum of 64 modules are displayed.
Displays IP address of the detected High Speed Data Communication Module.
Displays host name (a host name registered in the network setting) of the detected
Host name*1
High Speed Data Communication Module.
Displays the comment written to the detected High Speed Data Communication
Comment*1
2.
Displays a search result of High Speed Data Communication Modules exist on the
8.4 Connecting to High Speed Data Communication Module
8.4.2 Connecting via hub with specifying IP address
IP address*1
*1 :
8
Description
Module.
Displayed items can be sorted by double-clicking the column title.
Click the
button.
→ The IP address of the selected row is reflected to the Transfer Setup screen.
3.
Click the
button on the Transfer Setup screen.
Display contents
Item
Response waiting time
button
button
Description
Displays the response wait time when searching for modules. (1 to 99 seconds)
Flashes the "RUN" LED on the front of the module for 10 seconds to check the
selected High Speed Data Communication Module.
Searches for High Speed Data Communication Modules again, and updates the
list.
85
8.4.3
Connecting directly using a crossing cable without specifying
IP address
Operating procedure
1.
2.
8.4.4
Select "Direct Connection" on the Transfer Setup screen (Page 83, Section 8.4.1).
Click the
button.
Communication test
This function tests if the equipment communicates normally with the connection route set on the Transfer Setup
screen.
Operating procedure
Select a High Speed Data Communication Module to be connected on the Transfer Setup screen,
click the
button.
→ The following message is displayed when the connection is normal.
86
CHAPTER 9 USING TREND GRAPH FUNCTION
CHAPTER 9
9.1
USING TREND GRAPH FUNCTION
9
Overview
QnUDVCPU High Speed Data Logger High Speed Data Communication
Q Analog
LCPU
L Analog
This function displays data in graph format sampled by the logging function of a module or sampling trace of GX
Works2.
The following two types of display method are available for trend graphs.
• Historical trend
• Realtime trend (For High Speed Data Logger Module/High Speed Data Communication Module)
Data logging files stored in the memory card on the module, data logging file in a personal computer, or sampling
trace data are displayed.
Stored past data can be confirmed anytime.
(a) Displaying data sampled by the logging function of QnUDVCPU/LCPU
Data logging
file
SD memory
card
LCPU
For the operation method, refer to the following section.
Page 97, Section 9.3.1 (1) Displaying logging files saved with the logging function of QnUDVCPU/LCPU
87
9.1 Overview
(1) Historical trend
(b) Displaying data sampled by High Speed Data Logger Module
Data logging
file
CompactFlash
card
High Speed Data Logger Module
For the operation method, refer to the following section.
Page 98, Section 9.3.1 (2) Displaying data logging files saved with the logging function of High Speed
Data Logger Module
(c) Displaying data sampled by the logging function of Q/L Series Analog Module
L Series Analog Module
Q Series Analog Module
Data logging file
ATA card
QCPU
SD memory
card
LCPU
SD memory
card
(QnUDVCPU)
For the operation method, refer to the following section.
Page 99, Section 9.3.1 (3) Displaying logging files saved with the logging function of Q/L Series Analog
Module
(d) Displaying data stored in a personal computer, or in a memory medium connected
to a personal computer
Data logging
file or
sampling trace data
For the operation method, refer to the following section.
Page 100, Section 9.3.1 (4) Displaying data logging files or sampling trace data stored in a personal
computer or in a memory medium connected to a personal computer
88
CHAPTER 9 USING TREND GRAPH FUNCTION
9
(2) Realtime trend (For High Speed Data Logger Module/High Speed Data
Communication Module)
The most recent data sampled by the High Speed Data Logger Module/the High Speed Data Communication
Module are displayed.
They are always kept updated so that the event history from the start of monitoring to current time can be
confirmed.
To display Realtime trend, a personal computer and a High Speed Data Logger Module/a High Speed Data
Communication Module need to be connected to each other online.
Data logging file
Samples data in realtime,
and displays them.
High Speed Data Logger Module/
High Speed Data Communication Module
For details of realtime trend display operation, refer to the following section.
Page 101, Section 9.3.2 Displaying current devices (Realtime trend)
9.1 Overview
89
9.2
Screen Configuration
QnUDVCPU High Speed Data Logger High Speed Data Communication
Q Analog
LCPU
L Analog
This section explains the screen configuration of trend window.
9.2.1
Trend window
Screen display
Title bar
Graph area
Graph legend
area
button
button
Difference information
area
Status bar
Item
Description
Reference
Displays the following data.
• For Historical trend
Logging file names - historical trend (module name)
Title bar
When displaying sampling trace data, "Sampling trace file name Historical trend (Sampling trace)" is displayed.
-
Logging file names - historical trend (module name)
• For Realtime trend
Logging setting name - realtime trend (module name) [monitoring status]
Graph legend area
Graph area
Displays a list of data names and their values/status that can be displayed
as graphs. (Maximum of 32 legends)
Displays trend graphs.
Displays data selected in the graph legend area.
Page 91, Section 9.2.2
Page 92, Section 9.2.3
Displays the previous graph.
button
This operation is the same as the operation of selecting [Graph Operation]
B [Show Previous Graph] (
Page 130, Section 9.5.9 (1)
).
Displays the next graph.
button
This operation is the same as the operation of selecting [Graph Operation]
B [Show Next Graph] (
Difference information area
Status bar
90
Page 132, Section 9.5.9 (2)
).
Displays difference information between two cursors when the multiple
cursor function is activated.
Displays basic status of the selected data.
Page 93, Section 9.2.4
Page 95, Section 9.2.5
CHAPTER 9 USING TREND GRAPH FUNCTION
9.2.2
Graph legend area
9
Screen display
Item
Description
Reference
Displays a list of data names and their values/status. The background color
Display area
and the text color can be changed. When the text color is changed, the color
-
of the graph displayed in the graph drawing area is also changed.
Display selection
Type of graph line
Data Name
Select to display a graph.
Page 111, Section 9.5.1
Indicates the type of graph line displayed in the graph area. The type of line
-
can be changed.
Displays data name. Data can be added to/deleted from the list.
Page 108, Section 9.4.2
Displays data value/status at the cursor displayed as a standard (vertical red
cursor line).
-
9.2 Screen Configuration
9.2.2 Graph legend area
Value
Graph legend area in a trend window can be displayed/hidden by any of the following operations.
< Display >
< Hide >
Operating procedure
•
•
•
[Graph View] B [Graph Legends] (
)
Right-click on the graph legend area, and select [Graph Legends].
Right-click on the graph area, and select [Graph Legends].
91
9.2.3
Graph area
Screen display
Item
Description
Graph drawing area
An area to display trend graphs. The background color can be changed.
Upper limit display value
A maximum value of display for each graph.
Lower limit display value
A minimum value of display for each graph.
Reference
Page 138, Section 9.7
Page 123, Section 9.5.5
Labels for the time scale. They are displayed in either following format.
Time scale
label*2
• Time*1/Date*1/Date and Time*1/Index
Q/L Series Analog Module does not have time information in the logging data,
(X axis label)
Page 137, Section 9.6.5
therefore only Index can be displayed.
Data name
Name of data.
Trend graphs
Lines that indicate data transitions. Their colors and types can be changed.
Page 138, Section 9.7
A cursor that is displayed as a standard.
Red cursor
(Displayed at the left edge of the graph area for the first activation.)
A cursor that is displayed for comparison. It is displayed only when the multiple
Blue cursor
Page 106, Section 9.4.1
cursor function is activated.
(Displayed at the left edge of the graph area for the first activation.)
Cursor label
Values/status at the intersecting points of trend graphs with the cursor.
A mark to display the point where the trigger condition (ON/OFF) is satisfied. Its
Trigger mark
color can be changed.
Data missing lines
Lines that are displayed at the point where data could not be sampled.
Lines that divide the graph drawing area in ten. The color of grid can be
Grid line
changed.
*1 :
*2 :
Page 138, Section 9.7.1
Page 149, Section 9.11
Page 138, Section 9.7
*
(asterisk) is displayed when the date information does not exist, or when the date information does not contain 'year,
month, day' information.
The logging files, in which any of 'year', 'month', 'day', 'hour', 'minute', 'second' of the data line output format (which can
be set by the configuration tool) is missing, are displayed as the index display only.
Remark
A maximum number of graphs that can be displayed in one trend window is 32.
92
Page 135, Section 9.6.2
CHAPTER 9 USING TREND GRAPH FUNCTION
9.2.4
Difference information area
9
The following two types of display method are available for difference information area.
Q/L Series Analog Module does not have time information in the logging data, therefore only Index can be displayed.
• Time Display
• Index Display
(1) For time display
Screen display
Item
Description
Displays difference information of value/status.
• When a graph is bit data
Difference (Blue → Red)
(ON → OFF, OFF → ON, ON → ON, OFF → OFF)
• When a graph is word data
(Value at the red cursor - Value at the blue cursor)
Displays difference information of time.
(Time at the red cursor - Time at the blue cursor)
Span (Blue → Red)
Data sampled by QnUDVCPU/LCPU are displayed up to µs unit, and data
sampled by High Speed Data Logger Module are displayed up to ms unit.
*1
Time (Blue)
*1 :
Displays a value/status at the intersecting point of the trend graph with the
blue cursor.
Displays time at the blue cursor.
* (asterisk) is displayed when the date information does not exist, or when the date information does not contain 'year,
month, day' information.
Span (Blue
Blue cursor
Red)
Red cursor
Value
difference
(Blue Red)
Time (Blue)
Value (Blue)
93
9.2 Screen Configuration
9.2.4 Difference information area
Value (Blue)
(2) For index display
Screen display
Item
Description
Displays difference information of value/status.
• When a graph is bit data
Difference (Blue → Red)
(ON → OFF, OFF → ON, ON → ON, OFF → OFF)
• When a graph is word data
(Value at the red cursor - Value at the blue cursor)
Span (Blue → Red)
Displays difference information of index.
(Index at the red cursor - Index at the blue cursor)
Displays a value/status at the intersecting point of the trend graph with the
Value (Blue)
blue cursor.
Index (Blue)
Displays index at the blue cursor.
Blue cursor
Span (Blue
Red)
Red cursor
Value
difference
(Blue Red)
Index (Blue)
94
Value (Blue)
CHAPTER 9 USING TREND GRAPH FUNCTION
9.2.5
Status bar
9
Screen display
< Example: When directly connected to High Speed Data Logger Module, and the index display is set for Realtime trend >
< Example: When connected to LCPU using Ethernet, and the time display is set for Historical trend >
Step number
Program name
Item
Description
Displays the acquisition destination and the logging file type of the data logging file being
displayed with characters and color.
Displayed characters
< For Historical trend >
Displays the acquisition destination of data logging file being displayed.
• When connecting to a QCPU
QCPU (connection channel):/File path
• When connecting to a High Speed Data Logger Module
High Speed Data Logger Module (IP address or direct connection):/File path
• When the save destination is a memory medium in a personal computer or a
memory medium connected to a personal computer
Acquisition destination and logging file
9.2 Screen Configuration
9.2.5 Status bar
type of data logging file
File path
< For Realtime trend >
Displays an IP address of a High Speed Data Logger Module/a High Speed Data
Communication Module communicating with, or "Direct Connection".
Background color
Logging file type
Background color
QnUDVCPU
Pale blue
High Speed Data Logger Module
High Speed Data Communication Module Light yellow
Q Series Analog Input Module
LCPU
Rose
L Series Analog Module
Light green
Sampling trace data
Gold
Energy Measuring Unit
Lime
Communication status
Displays "Online" or "Offline". (For Realtime trend only)
Cursor Value
Displays a value/status at the intersecting point of the trend graph with the red cursor.
*1
Program name
Displays an execution program name of the logging data.
Step number*1
Displays a step number of the logging data.
Cursor Time*2/Index
Displays time or index at the red cursor.
*1 :
These items are displayed only when the data logged by QnUDVCPU/LCPU are displayed.
*2 :
*(asterisk)
is displayed when the date information does not exist, or when the date information does not contain 'year,
month, day' information.
95
9.3
Displaying Trend Graphs
Data sampled by the LCPU module or High Speed Data Logger Module are displayed as trend graphs.
• Displaying logged devices (Historical trend)( Page 96, Section 9.3.1)
• Displaying current devices (Realtime trend) ( Page 101, Section 9.3.2)
• Operating realtime trend monitoring status ( Page 104, Section 9.3.3)
9.3.1
Displaying logged devices (Historical trend)
QnUDVCPU High Speed Data Logger High Speed Data Communication
Q Analog
LCPU
L Analog
With Historical trend, the following files stored in a module or a memory medium are specified, and displayed on the
trend graph.
• Logging files stored in an SD memory card with the logging function of QnUDVCPU/LCPU
• Logging files stored in a CompactFlash card with the data logging function of High Speed Data Logger
Module
• Logging files stored in an ATA card or an SD memory card with the data logging function of Q/L Series
Analog Module
• Data logging files, sampling trace data, or logging data sampled by Energy measuring Unit stored in a
personal computer or in a memory medium connected to a personal computer
96
CHAPTER 9 USING TREND GRAPH FUNCTION
(1) Displaying logging files saved with the logging function of QnUDVCPU/LCPU
9
Data logging files stored in an SD memory card installed on QnUDVCPU/LCPU with the logging function of
QnUDVCPU/LCPU are displayed with Historical trend.
Screen display
1.
2.
3.
4.
[Online] B [Open Logging File] (
)
Select "QCPU" or "LCPU" on the Connection Destination screen.
Specify QnUDVCPU/LCPU to be connected with and its route on the Transfer Setup screen.
Cancel the access restriction on the Enter remote password screen. (Only when the remote
password is set.)
File view
9.3 Displaying Trend Graphs
9.3.1 Displaying logged devices (Historical trend)
Operating procedure
1.
Select a data logging file (***.CSV) in the file view. (Multiple files cannot be selected.)
Item
Description
Displays a path of the directory being displayed in the file view.
Directory
Or, specify the directory.
Moves to the specified directory.
button
button
Moves up to the directory one layer above.
button
Updates the contents displayed in the file view.
File view
2.
Click the
Displays a list of folders and files in the path specified for "Directory".
button.
→ The selected data logging file is displayed as a trend graph.
For details of remote password, refer to the following manual.
QnUCPU User's Manual (Function Explanation, Program Fundamentals)
MELSEC-L CPU Module User's Manual (Function Explanation, Program Fundamentals)
97
(2) Displaying data logging files saved with the logging function of High Speed
Data Logger Module
Data logging files stored in a CompactFlash card with the data logging function of High Speed Data Logger
Module are displayed with Historical trend.
Screen display
1.
2.
3.
4.
[Online] B [Open Logging File] (
)
Select "High Speed Data Logger Module" on the Connection Destination screen.
Specify a High Speed Data Logger Module to be connected with on the Transfer Setup screen.
Cancel the access restriction on the Access Authentication screen. (Only when the access
restriction is set.)
File view
Operating procedure
1.
Select a data logging file (***.CSV or ***.BIN) in the file view. (Multiple files cannot be selected.)
Item
Description
Displays a path of the directory being displayed in the file view.
Directory
Or, specify the directory.
Moves to the specified directory.
button
button
Moves up to the directory one layer above.
button
Updates the contents displayed in the file view.
File view
2.
Click the
Displays a list of folders and files in the path specified for "Directory".
button.
→ The selected data logging file is displayed as a trend graph.
(An event list is displayed when the event logging file is selected.)
For details of the access authentication, refer to the following manual.
High Speed Data Logger Module User's Manual
98
CHAPTER 9 USING TREND GRAPH FUNCTION
(3) Displaying logging files saved with the logging function of Q/L Series Analog
Module
9
Data logging files stored in an ATA card or an SD memory card with the logging function of Q/L Series Analog
Module are displayed with Historical trend.
Screen display
1.
2.
3.
4.
[Online] B [Open Logging File] (
)
Select "QCPU" or "LCPU" on the Connection Destination screen.
Specify a QCPU or an LCPU to be connected with and its route on the Transfer Setup screen.
Cancel the access restriction on the Enter remote password screen. (Only when the remote
password is set.)
File view
9.3 Displaying Trend Graphs
9.3.1 Displaying logged devices (Historical trend)
Operating procedure
1.
Select a data logging file (***.CSV) in the file view. (Multiple files cannot be selected.)
Item
Description
Displays a path of the directory being displayed in the file view.
Directory *1
button
Or, specify the directory.
*1
Moves to the specified directory.
button
File view
*1 :
2.
Updates the contents displayed in the file view.
Displays a list of folders and files in the path specified for "Directory".
Available only when save destination is set for an SD memory card.
Click the
button.
→ The selected data logging file is displayed as a trend graph.
For details of remote password, refer to the following manuals.
QnUCPU User's Manual (Function Explanation, Program Fundamentals)
QCPU User's Manual (Function Explanation, Program Fundamentals)
MELSEC-L CPU Module User's Manual (Function Explanation, Program Fundamentals)
99
(4) Displaying data logging files or sampling trace data stored in a personal
computer or in a memory medium connected to a personal computer
CSV files or binary files stored in a personal computer or a memory medium are displayed with Historical trend.
For saving logging files to a personal computer or to a memory medium, refer to the following chapter.
Page 174, CHAPTER 11 SAVING LOGGING FILES TO PERSONAL COMPUTER
Operating procedure
•
•
[File] B [Open] (
)
Drag and drop the data logging file or the sampling trace data to the main widow.
(Example: Displaying "HSDL.CSV" on the desktop)
OK
OK
100
CHAPTER 9 USING TREND GRAPH FUNCTION
9.3.2
Displaying current devices (Realtime trend)
QnUDVCPU High Speed Data Logger High Speed Data Communication
9
Q Analog
L CPU
L Analog
With Realtime trend, a data logging setting of the module is specified, and data are displayed on the trend graph.
(1) Displaying current device status of High speed data logger module on the
trend graph
Screen display
1.
2.
3.
[Online] B [Realtime Monitor] (
)
Specify a High Speed Data Logger Module to be connected with on the Transfer Setup screen.
Cancel the access restriction on the Access Authentication screen. (Only when the access
restriction is set.)
9.3 Displaying Trend Graphs
9.3.2 Displaying current devices (Realtime trend)
Operating procedure
1.
Select a data logging setting from the list.
Item
Description
<<Data Logging>> tab
<<Event Logging>> tab
No.
Click the
Displays the list of event logging settings.
Page 161, Section 10.3.2
Displays the number of a data logging setting.
Data Logging Name
2.
Displays the list of data logging settings.
Displays a name of a data logging setting specified in the High Speed Data Logger
Module configuration tool
button.
→ Trend graphs of the selected data logging setting is displayed.
For details of the access authentication, refer to the following manual.
High Speed Data Logger Module User's Manual
101
(2) Displaying current device status of High speed data communication module on
the trend graph
Screen display
1.
2.
[Online] B [Realtime Monitor] (
)
Specify a High Speed Data Communication Module to be connected with on the Transfer Setup
screen.
3.
Cancel the access restriction on the Access Authentication screen. (Only when the access
restriction is set.)
Operating procedure
1.
Select a data logging setting from the list.
Item
Description
<<Label Group>> tab
Displays the list of label group settings.
No.
Displays the label group setting.
Displays a name of a label group setting specified in the High Speed Data
Label Group Name
Communication Module configuration tool (When the access authentication is allowed to
read)
2.
Click the
button.
→ The following screen is displayed.
102
CHAPTER 9 USING TREND GRAPH FUNCTION
3.
Set the data transfer settings between High Speed Data Communication Module on the Realtime
Transfer Setting screen.
Item
9
Description
Displays the sampling method (high speed sampling/general sampling)
Sampling Method
acquired from High Speed Data Communication Module.
Specify the logging data sampling interval.
Data Collection Interval
High speed sampling: 1 to 32767ms
General sampling: 0.1 to 32767s
(When sampling each sequence scan, specify '0'.)
When sampling method is "High Speed Sampling", specify the transfer interval
to GX LogViewer.
4.
Transfer
Cycle
Interval
Specification
Click the
Transfers the data with every specified cycle.
2 to 100ms (sampling interval is the shortest)
(When synchronizing with data sampling interval, specify '0'.)
Record Number
Transfers the specified record number of data.
Specification
1 to 100 records
button.
→ Trend graphs of the selected data logging setting is displayed.
For details of the access authentication, refer to the following manual.
High Speed Data Communication Module User's Manual
9.3 Displaying Trend Graphs
9.3.2 Displaying current devices (Realtime trend)
103
9.3.3
Operating realtime trend monitoring status
QnUDVCPU High Speed Data Logger High Speed Data Communication
Q Analog
L CPU
L Analog
In Realtime trend, the following operations are used to change the monitoring status and control graphs.
• Starting monitoring
• Stopping monitoring
• Pausing graph update
• Restarting graph update
• Clearing graphs
(1) Starting monitoring
This operation starts the communication with a High Speed Data Logger Module/a High Speed Data
Communication Module and turns the monitoring status from Stop to Run.
Operating procedure
[Online] B [Begin Monitor] (
)
The status of the tool buttons changes as shown below when monitoring.
<Monitoring: Stop>
<Monitoring: Run>
Start monitoring
(2) Stopping monitoring
This operation disconnects the communication with a High Speed Data Logger Module/a High Speed Data
Communication Module and stops drawings of trend graphs.
Operating procedure
[Online] B [End Monitor] (
)
The status of the tool buttons changes as shown below when monitoring is stopped.
<Monitoring: Run>
<Monitoring: Stop>
Stop monitoring
104
CHAPTER 9 USING TREND GRAPH FUNCTION
9
(3) Pausing graph update
This operation pauses the drawings of trend graphs while the communication with a High Speed Data Logger
Module/a High Speed Data Communication Module is continued. (Data sampling is continued.)
Operating procedure
[Online] B [Pause Monitor] (
)
The status of the tool buttons changes as shown below when monitoring is paused.
<Monitoring: Run>
<Monitoring: Pause>
Pause monitoring
(4) Restarting graph update
This operation restarts the drawings of trend graphs from the paused status of the monitoring.
Data sampled while the monitoring is paused are not displayed on the graph temporarily, but after the monitoring
is restarted, they are displayed on the trend graphs.
Operating procedure
[Online] B [Restart Monitor] (
)
The status of the tool buttons changes as shown below when monitoring is restarted.
<Monitoring: Pause>
<Monitoring: Run>
Restart monitoring
9.3 Displaying Trend Graphs
9.3.3 Operating realtime trend monitoring status
(5) Clearing graphs
This operation clears trend graphs drawn in the graph area.
The drawings of graphs from the sampled data are restarted immediately after clearing the graphs.
Operating procedure
[Online] B [Clear Graph] (
)
105
9.4
Checking Data
QnUDVCPU High Speed Data Logger High Speed Data Communication
Q Analog
LCPU
L Analog
This section explains the following operations for checking data displayed on a trend window.
• Checking and comparing data values/status ( Page 106, Section 9.4.1)
• Adding/deleting data to/from graph legend area ( Page 108, Section 9.4.2)
9.4.1
Checking and comparing data values/status
Data values/status on a trend graph are checked or compared by the following operations.
• Moving cursors
• Checking data values/status
• Comparing data values/status
Remark
• When operating the cursors in Realtime trend, stop or pause the monitoring.
• In order to display the blue cursor, the multiple cursor function needs to be activated. For details of the multiple
cursor function and difference information area, refer to the following sections.
Page 134, Section 9.6.1 Displaying multiple cursor
Page 93, Section 9.2.4 Difference information area
(1) Moving cursors
Operating procedure
Blue cursor
Red cursor
(a) Moving the red cursor
•
•
•
Drag the red cursor right/left using a mouse.
Press the
Ctrl
+
keys.
Right-click at the desired position (to which the cursor moves) on the graph area, and select [Move
Red Cursor Here].
106
/
CHAPTER 9 USING TREND GRAPH FUNCTION
(b) Moving the blue cursor
•
•
•
9
Drag the blue cursor right/left using a mouse.
Press the
Shift
+
/
keys.
Right-click at the desired position (to which the cursor moves) on the graph area, and select [Move
Blue Cursor Here].
(c) Moving the red cursor and the blue cursor simultaneously
•
•
Drag the red cursor or the blue cursor while pressing the
Press the
Shift
+
Ctrl
+
/
Shift
+
Ctrl
keys.
keys.
(d) Moving the graph right/left only without moving the cursors
•
•
Move the horizontal scroll bar right/left on the trend window.
Press the
PageUp
key or
PageDown
key.
(e) Moving the cursor by specifying value/time/index
The cursor jump function moves the cursor to a specified position (value/time/index).
For details of the cursor function, refer to the following section.
Page 116, Section 9.5.4 Moving cursor by specifying value/time/index (Jump cursor)
(2) Checking data values/status
Operating procedure
(a) Checking values/status using the red cursor
Move the red cursor to the position where data are checked.
Check the values displayed in the "Cursor Value" and "Cursor Time"/"Cursor Index" fields on the
status bar.
(b) Checking values/status using the blue cursor
1.
2.
Move the blue cursor to the position where data are checked.
Check the values displayed in the "Value (Blue)" and "Time (Blue)"/"Index (Blue)" fields of the
difference information area.
● The data value can also be displayed at the cursor label by selecting [Graph View] B [Cursor Label].
● The cursor can be moved to the plot position (the observation point) of the selected file, but can not be moved to the
position between the plot.
However, when displaying multiple files on the same trend window, the cursor may be moved to the file between the plot
which is not selected. In this case, the data value at the cursor is displayed as an estimated value obtained by linear
interpolation, and displayed in parentheses.
(3) Comparing data values/status
Operating procedure
1.
2.
Move the red cursor and the blue cursor to the two positions where data are compared.
The values/status are compared by the differences displayed in the "Difference (Blue → Red)" and
"Span (Blue → Red)" fields of the difference information area.
107
9.4 Checking Data
9.4.1 Checking and comparing data values/status
1.
2.
9.4.2
Adding/deleting data to/from graph legend area
Add/Delete the data to be displayed on the graph legend area. Also, add/delete the logging data in another file to/from
the graph legend area on the same trend window.
When adding the logging data of another file, in case the display format is set to equidistance plot, it is changed to time
interval plot.
For the details of time interval plot format, refer to the following section.
Page 136, Section 9.6.4 Switching graph plot format
Screen display
[Graph View] B [Change the Data to Draw Graphs]
Data list
Display contents
Item
Description
No.
Displays a data number.
Data Name
Displays the file name and the path.
Displays the status of the graph legend area.
Add to the Legends
The selected data is displayed on the graph legend area.
The maximum of 32 data can be selected.
Size
Displays the data size. (unit: byte)
Displays the data type.
Data Type
• Bit
• Word[signed]
• Word[unsigned]
The amount of drawing
graphs
108
• Double word[signed]
• 16bit BCD
• Double word [unsigned]
• 32bit BCD
• Single-precision real
• String
• Double-precision real
• Raw
The number of data which is selected on "Add to the Legends".
CHAPTER 9 USING TREND GRAPH FUNCTION
9
Operating procedure
(1) Adding/Deleting data
(a) Adding data to graph legend area
Operating procedure
1.
2.
Select data to be displayed on the graph legend area from "Add to the Legends" column.
Click the
button.
→ The selected data is added to the graph legend area.
(a) Deleting data from graph legend area
Operating procedure
1.
2.
Clear the check box to be deleted on the graph legend area from "Add to the Legends" column.
Click the
button.
→ The selected data is deleted from the graph legend area.
9.4 Checking Data
9.4.2 Adding/deleting data to/from graph legend area
109
(2) Adding/Deleting logging data in another file
(a) Adding the data stored in a personal computer to graph legend area
Operating procedure
1.
Click the
button, and select the file to be added.
→ The selected file is added to the data list, and displayed the data name.
When display format is set to equidistance plot, it is changed to time interval plot.
2.
3.
Select the data to be displayed on the graph legend area from "Add to the Legends".
Click the
button.
→ The selected data is added to the graph legend area.
(b) Adding the data stored in a transfer destination module to graph legend area
Operating procedure
1.
Click the
button.
→ The Connection Destination screen is displayed.
2.
3.
Set the transfer destination.Page 71, CHAPTER 8
Select the file to be added on the Logging File screen.
(Display example : F Direct connection)
4.
Click the
button.
→ The selected file is added to the data list, and displayed the data name.
When display format is set to equidistance plot format, it is changed to time interval plot format.
5.
6.
Select the data to be displayed on the data list from "Add to the Legends".
Click the
button.
→ The selected data is added to the graph legend area.
● The file can also be added by dragging and dropping the logging the file stored in a personal computer to the data list.
(c) Deleting added file
Operating procedure
•
Select the file to be deleted on the data list, and click the
→ The selected file is deleted.
110
button.
CHAPTER 9 USING TREND GRAPH FUNCTION
9.5
Adjusting Trend Graphs
9
QnUDVCPU High Speed Data Logger High Speed Data Communication
Q Analog
LCPU
L Analog
This section explains the method for adjusting trend graphs.
The efficiency of data check can be improved by adjusting trend graphs.
• Displaying/hiding graphs ( Page 111, Section 9.5.1)
• Aligning graphs ( Page 114, Section 9.5.2)
• Superimposing graphs ( Page 115, Section 9.5.3)
• Moving cursor by specifying value/time/index (Jump cursor) ( Page 116, Section 9.5.4)
• Specifying upper/lower limit display value ( Page 123, Section 9.5.5)
• Scaling graph up/down ( Page 126, Section 9.5.6)
• Moving graph (up/down/left/right) ( Page 126, Section 9.5.6)
• Expanding/reducing time scale ( Page 129, Section 9.5.8)
• Displaying consecutive previous/next trend graph ( Page 129, Section 9.5.9)
● Upper/lower limit display value, scaling graph up/down, and expanding/reducing time scale
Graph display information can be named and registered to be reflected to other windows.
Page 144, Section 9.8 Registering and Reflecting Graphical Display Settings of Trend Windows
Graph display can be set to be reflected automatically when opening the same data logging setting window next time.
Page 148, Section 9.9 Reflecting a Graph Display Automatically When Opening a File
9.5.1
Displaying/hiding graphs
9.5 Adjusting Trend Graphs
9.5.1 Displaying/hiding graphs
This function displays/hides trend graphs in the trend graph area by the following operations.
• Individual display/hide
• Batch display
• Batch hide
(1) Individual display/hide
This function displays/hides graphs of data that are selected individually from the graph legend area.
Screen display
<Hide>
<Individual display>
111
Operating procedure
The following shows the operation for the individual display.
<Checking the check box of graph legend>
To display: Check
To hide: Uncheck
<Double-clicking data on the graph legend area>
Switches display/hide setting by
double-clicking "Data Name" or "Value".
(2) Batch display
This function displays trend graphs of all data in the graph legend area.
Screen display
<Hide>
<Batch display>
Operating procedure
•
•
•
112
[Graph View] B [Show All Graphs] (
)
Right-click on the graph legend area, and select [Show All Graphs].
Right-click on the graph area, and select [Show All Graphs].
CHAPTER 9 USING TREND GRAPH FUNCTION
9
(3) Batch hide
This function hides trend graphs of all data in the graph legend area.
Screen display
<Display>
<Batch hide>
Operating procedure
•
•
•
[Graph View] B [Hide All Graphs] (
)
Right-click on the graph legend area, and select [Hide All Graphs].
Right-click on the graph area, and select [Hide All Graphs].
9.5 Adjusting Trend Graphs
9.5.1 Displaying/hiding graphs
113
9.5.2
Aligning graphs
This function aligns all trend graphs displayed in the graph area without overlapping.
Screen display
<Before alignment>
<After alignment>
Graphs are aligned
in the order that
they are displayed
in the graph legend
area.
Operating procedure
•
•
•
[Graph Operation] B [Graph Alignment] (
)
Right-click on the graph legend area, and select [Graph Alignment].
Right-click on the graph area, and select [Graph Alignment].
Remark
Graphs are aligned in the order that they are displayed in the graph legend area.
114
CHAPTER 9 USING TREND GRAPH FUNCTION
9.5.3
Superimposing graphs
9
This function displays all trend graphs displayed in the graph area superimposed.
Screen display
<Before superimposing>
<After superimposing>
9.5 Adjusting Trend Graphs
9.5.3 Superimposing graphs
Analog data
Digital data
Operating procedure
•
•
•
[Graph Operation] B [Graph Superimpose] (
)
Right-click on the graph legend area, and select [Graph Superimpose].
Right-click on the graph area, and select [Graph Superimpose].
115
9.5.4
Moving cursor by specifying value/time/index (Jump cursor)
Data values/status are checked by moving the cursor to the specified value/time/index position on the trend graph.
Q/L Series Analog Module does not have time information, therefore only cursor jump specified value and index are
available.
Jump to the position where the condition is satisfied.
[Value search]
Condition search
Value 400
400
300
200
16/5/2011, 14:50
16/5/2011, 15:06
11
27
[Time specification]
[Index specification]
When performing the cursor jump in realtime trend, stop or pause the monitoring.
Screen display
•
•
[Graph Operation] B [Jump Cursor] (
)
Right-click on the graph legend area or the graph area, and select [Jump Cursor].
<<Value>>
<<Time>>
<<Index>>
(Initial Display)
Switch with a tab.
Screen display
Item
Description
The displayed items and the operating procedures are described on the following reference
Tab
pages.
Value
Page 117, (1) in this section
Time
Page 121, (2) in this section
Index
Page 122, (3) in this section
Select a cursor that jumps
Red Cursor
Select this to jump the red cursor.
Blue Cursor
Select this to jump the blue cursor.
button
button
116
-
Moves the cursor to the position before the current cursor position where the specified condition
is satisfied.
Moves the cursor to the position after the current cursor position where the specified condition is
satisfied.
CHAPTER 9 USING TREND GRAPH FUNCTION
9
(1) Jump cursor by searching value
Search the value by the following methods and jump the cursor to the position where the condition is satisfied.
Search type is different according to the data type of the selected data.
Search Type
Description
When the data type is bit
-
UP
Jumps to the position where the selected data turned from OFF to ON for the first time.
Down
Jumps to the position where the selected data turned from ON to OFF for the first time.
Comparison
Compares the values of the selected data and the specified data, and jumps to the position
where the condition is satisfied. Page 120, (1)(b) in this section
When the data type is other
-
than bit
Conditional
Searches the value by specifying the condition, and jumps to the position where the
condition is satisfied. Page 118, (1)(a) in this section
Max
Jumps to the first maximum value of the selected data.
Min
Jumps to the first minimum value of the selected data.
Jumps to the position where the increased value starts decreasing.
However, the positions where the increased value becomes flat are not positions of
maximum values.
Example:
Maximal
However, the positions where the decreased value becomes flat are not positions of
minimum values.
Example:
Minimal
Comparison
Compares the values of the selected data and the specified data, and jumps to the position
where the condition is satisfied. Page 120, (1)(b) in this section
117
9.5 Adjusting Trend Graphs
9.5.4 Moving cursor by specifying value/time/index (Jump cursor)
Jumps to the position where the decreased value starts increasing.
(a) Condition search
Screen display
•
Select "Conditional" from "Classification".
Operating procedure
1.
Specify conditions and values.
Item
Description
Enter a value for the condition within the following range.
Data type of the selected data
16-bit integer with sign
16-bit integer without sign
32-bit integer with sign
32-bit integer without sign
(Left side value)
(Left side condition
operator)
(Selected data
0 to 65535
-2147483648 to 2147483647
0 to 4294967295
Single-precision floating-point
Real number
-9999999999 to 99999999999
Exponent
-3.402E+038 to 3.402E+038
Double-precision floating-point
Real number
-9999999999 to 99999999999
Exponent
-1.797E+308 to 1.797E+308
BCD type 16-bit integer
0 to 9999
BCD type 32-bit integer
0 to 99999999
Select from "< , <=, =, <>, None".
Displays the data name of the selected data.
name)
(Right side
condition operator)
(Right side value)
2.
3.
Range
-32768 to 32767
Select from "< , <=, =, <>, None".
Enter a value for the condition.
(For the entering range, refer to .)
Select the color of the cursor.
Click the
button or the
button.
→ The value is searched toward the specified direction from the current cursor position, and the cursor
jumps to the position where the condition is satisfied.
118
CHAPTER 9 USING TREND GRAPH FUNCTION
The following shows the examples of specifying condition search range.
9
• When searching for a value in a range between 0 and 100, use both condition combo boxes.
• When searching for a value less than 1000, use the condition box on the right side only.
• When searching for a value -1000 or more, use the condition box on the left side only.
• When searching for a value 2500, use the condition box on either side.
• When searching for a value other than -15000, use the condition box on either side.
● Notes on floating-point
A rounding error occurs when searching for a floating-point value.
When a single-precision/double-precision floating-point is entered to the left/right side of the text box, the exponent is
normalized by rounding off to two decimal places. A single-precision real number is rounded to 7 significant digits.
For data values, single-precision and double-precision values are rounded to 7 and 15 significant digits respectively.
Example: Checking a match with 1.23456E+10
1.234E+010
1.23456E+010
1.235E+010
Check a match with values within this range. (Boundary values are not included.)
119
9.5 Adjusting Trend Graphs
9.5.4 Moving cursor by specifying value/time/index (Jump cursor)
A comparison with a value which exceeded the number of significant values cannot be performed.
When checking a match with a value which exceeded the number of significant values, compare the value with values
between the approximate values.
(b) Comparison of values between data names
Screen display
•
Select "Comparison" from "Classification".
(If data whose data type is the same as the selected data does not exist, the item is not displayed for
"Classification".)
#
$
%
Operating procedure
1.
Specify a condition and a data name.
Item
Description
(Selected data
Displays a selected data name.
name)
< When the data type is bit >
(Condition
Select from "= , <>".
operator)
< When the data type is other than bit >
Select from "< , <=, >, >=, =, <>".
Select a comparison target data name.
(Comparison
target data name)
2.
3.
Displays a data name whose data type is the same as the selected data name in the combo
box.
Select the color of the cursor.
Click the
button or the
button.
→ The value is searched toward the specified direction from the current cursor position, and the cursor
jumps to the position where the condition is satisfied.
120
CHAPTER 9 USING TREND GRAPH FUNCTION
9
(2) Jump the cursor by specifying time
Screen display
•
Click the <<Time>> tab on the Jump Cursor screen.
Operating procedure
1.
Specify the time to which the cursor jumps.
Item
2.
3.
Description
Date
Select this to specify "Date" as a condition.
Hour
Select this to specify "Hour" as a condition.
Minute
Select this to specify "Minute" as a condition.
Second
Select this to specify "Second" as a condition.
Select the color of the cursor.
Click the
button or the
button.
9.5 Adjusting Trend Graphs
9.5.4 Moving cursor by specifying value/time/index (Jump cursor)
→ The cursor jumps to the specified time.
The following table shows the setting examples of time condition and their operation results.
Item
Operation result
Second
Jumps to the specified second per minute.
Example*1:
Specify "30" for the second only.
Result:
10/09/2009 19:36:30 ← previous ← 10/09/2009 19:37:30 → next → 10/09/2009 19:38:30
Minute
Jumps to the specified minute per hour.
*1:
Example
Specify "30" for the minute only.
Result:
10/09/2009 18:30:00 ← previous ← 10/09/2009 19:30:00 → next → 10/09/2009 20:30:00
Hour
Jumps to the specified hour per day.
Example*1:
Specify "00" for the hour only.
Result:
10/09/2009 00:00:00 ← previous ← 10/10/2009 00:00:00 → next → 10/11/2009 00:00:00
*1 :
The logging interval is set to 1 second.
121
(3) Jump the cursor by specifying index
Screen display
•
Click the <<Time>> tab on the Jump Cursor screen.
Operating procedure
1.
Specify the index to which the cursor jumps.
Item
Index to which the
cursor jumps
2.
3.
Description
Select the index to which the cursor jumps.
Select the color of the cursor.
Click the
button or the
button.
→ The cursor jumps to the specified index.
122
CHAPTER 9 USING TREND GRAPH FUNCTION
9.5.5
Specifying upper/lower limit display value
9
This function specifies the upper limit display value and lower limit display value of the trend graph selected in the
graph area.
The upper/lower limit value can be adjusted by the following two methods.
• Adjusting graph automatically
• Adjusting graph manually
(1) Adjusting graph automatically
The following two methods are available.
• Adjusting within the displayed period: Adjusts the maximum/minimum value of the graph within the range
displayed on the screen.
• Adjusting within the entire period: Adjusts the maximum/minimum value of the graph within the entire period.
(a) Adjusting within the displayed period
Screen display
Adjusting within the displayed period
<Before adjustment>
<After adjustment>
Maximum value of displayed period
Minimum value of displayed period
•
•
[Graph Operation] B [Auto Adjust Upper/Lower Bound] B [For Period on Display] (
)
Right-click on the graph legend area, and select [Auto Adjust Upper/Lower Bound] B [For Period
on Display].
•
Right-click on the graph area, and select [Auto Adjust Upper/Lower Bound] B [For Period on
Display].
(b) Adjusting within the entire period
Screen display
Adjusting within the entire period
<Before adjustment>
<After adjustment>
Maximum value of entire period
Minimum value of entire period
123
9.5 Adjusting Trend Graphs
9.5.5 Specifying upper/lower limit display value
Operating procedure
Operating procedure
•
•
[Graph Operation] B [Auto Adjust Upper/Lower Bound] B [For All Period] (
)
Right-click on the graph legend area, and select [Auto Adjust Upper/Lower Bound] B [For All
Period].
•
Right-click on the graph area, and select [Auto Adjust Upper/Lower Bound] B [For All Period].
(2) Adjusting graph manually
For adjusting a graph manually, enter a value in the text box directly.
Data higher than the maximum value are displayed as the maximum value, and data less than the minimum value
are displayed as the minimum value.
Screen display
< Before adjustment >
< After adjustment >
Upper value
Lower value
Specify a value in
the text box.
Operating procedure
Display the text box by any of the following operations, and enter the upper/lower limit display value.
•
•
•
Double-click the area of graph to be adjusted in the graph area.
[Graph Operation] B [Edit Upper/Lower Bound].
After selecting the trend graph to be adjusted in the graph area, right-click and select [Edit Upper/
Lower Bound].
124
CHAPTER 9 USING TREND GRAPH FUNCTION
(a) Entering upper/lower limit display value
The following table shows the applicable ranges of values and data that can be entered in the text box of the
9
upper/lower limit display value.
Item
Description
Numerals (0 to 9), alphabets ("E", "e"), signs ("-", "+", ".")
Note that the alphabets ("E", "e") are for the exponent expression.
Applicable
characters
Entered values are handled as values in a decimal fixed floating-point expression or decimal exponent
expression.
Example: "111" is not a binary number. It is "111" in decimal.
"11E3" is not a hexadecimal number. It is "11000" in a decimal exponent expression.
Applicable
number of
A maximum of 11 characters
characters
Exponent expression: -1.797E+308 to -2.225E-308, 0, and 2.225E-308 to 1.797E+308
Applicable range
Fixed floating-point expression: -9999999999 to 99999999999
Note that the value condition, in which the upper limit display value is lower than or equal to the lower limit
display value, is not applicable.
9.5 Adjusting Trend Graphs
9.5.5 Specifying upper/lower limit display value
125
9.5.6
Moving graph up/down
This function moves up or down the selected trend graph.
Screen display
<Moving down>
<Standard>
<Moving up>
(1) Moving up
Operating procedure
•
•
•
[Graph Operation] B [Adjust Scale] B [Move Up Graph] (
Press the
Shift
+
Alt
+
)
key
Select a trend graph with a mouse and drag it upward.
(2) Moving down
Operating procedure
•
•
•
126
[Graph Operation] B [Adjust Scale] B [Move Down Graph] (
Press the
Shift
+
Alt
+
key
Select a trend graph with a mouse and drag it downward.
)
CHAPTER 9 USING TREND GRAPH FUNCTION
9.5.7
Moving graph up/down/left/right
9
This function moves up or down the trend graph displayed on the graph area.
When multiple file logging data is displayed on the same graph area, the trend graph can also be moved left or right by
setting the time unit to be moved.
For operation adding logging data, refer to the following section.
Page 108, Section 9.4.2 Adding/deleting data to/from graph legend area
(1) Moving up/down
Setting screen
<Scaling down>
<Standard>
<Scaling up>
Operating procedure
•
[Graph Operation] B [Adjust Graph Location] B [Move Up Graph] (
(
)
Press the
Shift
+
Alt
+
key/
key
Select a trend graph with a mouse and drag it upward/downward.
● When displaying multiple file logging data, all the data in the same file can be moved up or down by dragging a graph line
upward or downward while pressing
Ctrl
key.
127
9.5 Adjusting Trend Graphs
9.5.7 Moving graph up/down/left/right
•
•
)/[Move Down Graph]
(2) Moving left/right
When displaying multiple file logging data with time interval plot, the graph can be moved to the left or right.
Screen display
<Move to left>
<Standard>
<Move to right>
Operating procedure
•
•
•
[Graph Operation] B [Adjust Graph Location] B [Move Graph to Left] (
Right] (
)
Press the
Shift
+
Alt
+
key/
)/[Move Graph to
key.
Select a trend graph with a mouse and drag it upward/downward.
(3) Setting the time unit move to left/right
When moving a graph to left or right, set the time unit to be moved.
Operating procedure
•
[Graph Operation] B [Adjust Graph Location] B [Horizontal Moving Quantity] B [1ms] to
[12h] : Select from 24 phases.
•
128
The combo box of the toolbar B [1ms] to [12h] : Select from 24 phases.
CHAPTER 9 USING TREND GRAPH FUNCTION
9.5.8
Expanding/reducing time scale
9
This function expands/reduces the time scale in the graph area.
Screen display
<Scaling down>
<Standard>
<Scaling up>
(1) Expanding time scale
Operating procedure
•
•
[Graph Operation] B [Adjust Time Scale] B [Expansion Time Scale] (
Press the
Ctrl
+
)
key
(2) Reducing time scale
Operating procedure
9.5.9
[Graph Operation] B [Adjust Time Scale] B [Reduction Time Scale] (
Press the
Ctrl
+
)
key
Displaying consecutive previous/next trend graph
Normally, one data logging file is displayed on a historical trend window. However, the previous/next data logging file
can be displayed simultaneously by using this function.
This enables the consecutive view of divided data logging files.
The logging data sampled by High speed data communication module, Q/L Analog Module, or Energy Measurement
Unit and sampling trace data are not supported by this function.
● The previous/next data logging file in CSV or binary format can be displayed.
● The previous/next data logging file may not be displayed if any of the following operations is performed using a data
logging file stored in a personal computer.
If the previous/next data logging file cannot be displayed, create the same folder configuration as the one under '/
LOGGING' in an SD memory card or a CompactFlash card before operating.
• A name of a folder or data logging file under the data name has been changed.
• The previous/next data logging file has been deleted.
• File names of data logging files are not in series.
129
9.5 Adjusting Trend Graphs
9.5.8 Expanding/reducing time scale
•
•
(1) Displaying previous graph
Operating procedure
•
•
[Graph Operation] B [Show Previous Graph] (
Click the
)
button.
Screen display
Either of the following two operations is used for displaying data logging files when performing the "Show
Previous Graph" function.
• Operating from the status when only one data logging file is displayed.
• Operating from the status when the previous data logging file is already displayed.
<Operating from the normal status>
Time axis Data logging file configuration
Trend window
/LOGGING
<Before operation>
/LOG01
(Earlier)
00000001
File displayed
before the
operation
00000001.CSV
Data in 00000103.csv
are displayed
Time
00000101.CSV
Perform "Show Previous Graph"
00000102.CSV
Previous graph
00000002
<After operation>
00000103.CSV
00000255.CSV
Files to be
displayed after
the operation
Data in 00000102.csv
are displayed
Data in
00000103.csv
are displayed
(Later)
LOG01.CSV
/LOG02
130
File sampling current data
Up to two files can be displayed
CHAPTER 9 USING TREND GRAPH FUNCTION
9
<Operating from the status when the previous graph is already displayed>
Time axis
Data logging file configuration
Trend window
/LOGGING
<Before operation>
/LOG01
(Earlier)
00000001
00000001.CSV
Data in 00000102.csv
are displayed
Data in
00000103.csv
are displayed
Previous graph
Time
00000101.CSV
Files displayed
before the
operation
Perform "Show Previous Graph"
00000102.CSV
00000002
<After operation>
00000103.CSV
Data in 00000101.csv
are displayed
00000255.CSV
LOG01.CSV
/LOG02
Files to be
displayed after
the operation
File sampling current data
Up to two files can be displayed
The "Show Previous Graph" function cannot be performed to a data logging file whose serial number is the smallest number.
131
9.5 Adjusting Trend Graphs
9.5.9 Displaying consecutive previous/next trend graph
(Later)
Data in
00000102.csv
are displayed
(2) Displaying next graph
Operating procedure
•
•
[Graph Operation] B [Show Next Graph] (
Click the
)
button.
Screen display
Either of the following two operations is used for displaying data logging files when performing the "Show Next
Graph" function.
• Operating from the status when only one data logging file is displayed.
• Operating from the status when the next data logging file is already displayed.
<Operating from the normal status>
Time axis
Data logging file configuration
Trend window
/LOGGING
<Before operation>
/LOG01
(Earlier)
00000001
File displayed
before the
operation
00000001.CSV
Data in 00000101.csv
are displayed
Time
00000101.CSV
Perform "Show Next Graph"
00000102.CSV
Next graph
00000002
<After operation>
00000103.CSV
00000255.CSV
Files to be
displayed after
the operation
Data in 00000101.csv
are displayed
Data in
00000102.csv
are displayed
(Later)
LOG01.CSV
File sampling current data
Up to two files can be displayed
/LOG02
132
CHAPTER 9 USING TREND GRAPH FUNCTION
9
<Operating from the status when the next graph is already displayed>
Time axis
Data logging file configuration
Trend window
/LOGGING
<Before operation>
/LOG01
(Earlier)
00000001
Files displayed
before the
operation
00000001.CSV
Data in 00000101.csv
are displayed
Data in
00000102.csv
are displayed
Time
00000101.CSV
Perform "Show Next Graph"
00000102.CSV
00000002
<After operation>
Next graph
00000103.CSV
Data in 00000102.csv
are displayed
00000255.CSV
LOG01.CSV
Files to be
displayed after
the operation
File sampling current data
Up to two files can be displayed
/LOG02
The "Show Next Graph" function cannot be performed to a data logging file (a file that is sampling the current data) whose
serial number is not assigned.
133
9.5 Adjusting Trend Graphs
9.5.9 Displaying consecutive previous/next trend graph
(Later)
Data in
00000103.csv
are displayed
9.6
Changing Display Items in Graph Area
QnUDVCPU High Speed Data Logger High Speed Data Communication
Q Analog
LCPU
L Analog
This section explains the method for changing display items in the graph area.
Data on trend graphs can easily be checked by changing the display items.
• Multiple cursor
( Page 134, Section 9.6.1)
• Cursor labels
( Page 135, Section 9.6.2)
• Data names
( Page 135, Section 9.6.3)
• Plot format
(Page 136, Section 9.6.4)
• Time scale labels ( Page 137, Section 9.6.5)
• Languages
( Page 137, Section 9.6.6)
● The information of the displayed items in the graph area.(Except for Languages.)
Graph display information can be named and registered to be reflected to other windows.
Page 144, Section 9.8 Registering and Reflecting Graphical Display Settings of Trend Windows
Graph display can be set to be reflected automatically when open the same data logging setting window next time.
Page 148, Section 9.9 Reflecting a Graph Display Automatically When Opening a File
9.6.1
Displaying multiple cursor
This function switches the number of cursors displayed on the graph area.
Only the red cursor is displayed for a standard display, and the red cursor and blue cursor are displayed for the
multiple cursor function.
When the multiple cursor function is activated, the difference information area is displayed.
Screen display
<Standard display>
<Multiple cursor display>
Red cursor
Blue cursor
Red cursor
Difference information area
Operating procedure
•
•
•
[Graph View] B [Multiple Cursor] (
)
Right-click on the graph legend area, and select [Multiple Cursor].
Right-click on the graph area, and select [Multiple Cursor].
For details of the cursor operation, refer to the following section.
Page 106, Section 9.4.1 (1) Moving cursors
When activating the multiple cursor function, stop or pause the monitoring.
134
CHAPTER 9 USING TREND GRAPH FUNCTION
9.6.2
Displaying cursor labels
9
This function displays or hides cursor labels in the graph area.
Labels for the red cursor are displayed at the right of the cursor, and labels for the blue cursor are displayed at the left
of the cursor.
Screen display
<Hide>
Red cursor
<Display>
Blue cursor
Red cursor
Blue cursor
Cursor label
Cursor label
Operating procedure
•
•
•
9.6.3
[Graph View] B [Cursor Label] (
)
Right-click on the graph legend area, and select [Cursor Label].
Right-click on the graph area, and select [Cursor Label].
Displaying data names
9.6 Changing Display Items in Graph Area
9.6.2 Displaying cursor labels
This function displays or hides data names in the graph area.
Screen display
<Hide>
<Display>
Operating procedure
[Graph View] B [Data Name]
135
9.6.4
Switching graph plot format
Switch the graph plot format displayed on the historical trend window to equidistance plot format or time interval plot
format.
Equidistance plot format is the format which displays the sampled data in an equal interval regardless of time.
Time interval plot format is the format which displays the graph in a fixed time interval.
When displaying multiple file logging data on the same graph area, the graph plot format is changed to time interval
plot format. Displaying data with fixed time interval allows easier comparison between multiple data.
For operation adding logging data, refer to the following section.
Page 108, Section 9.4.2 Adding/deleting data to/from graph legend area
Screen display
<Equidistance plot format>
Display the graph in an equal interval
regardless of time.
<Time interval plot format>
Display the graph in a fixed time interval.
Operating procedure
•
•
136
[Graph View] B [Plot Format] B [Equidistance Plot] / [Time Interval Plot]
Select [Equidistance Plot] / [Time Interval Plot] from the tool bar.
CHAPTER 9 USING TREND GRAPH FUNCTION
9.6.5
Changing display of time scale labels
9
This function switches the display of time scale labels on the graph area between time display, date display, date and
time display, and index display.
Q/L Series Analog Module does not have time information in the logging data, therefore only index display can be
displayed.
Screen display
<Time display>
<Index display>
Operating procedure
[Graph View] B [Time Label] B [Time] / [Date] / [Date and Time] / [Index]
9.6.6
Switching languages
This function switches a language of data names displayed on a historical trend window.
In Historical trend, data names are displayed in a language used in the read data logging file. If characters of codes
which can be used in multiple languages or characters of inapplicable languages are used for data names, those
characters may be corrupted.
If characters are corrupted, change the language.
Operating procedure
[Graph View] B [Set Language] B [Chinese Simplified]
/ [Chinese Traditional]
/ [English]
/ [Japanese]
/ [Korean]
/ [Unicode (UTF-8)]
137
9.6 Changing Display Items in Graph Area
9.6.5 Changing display of time scale labels
The logging files, in which any of 'year', 'month', 'day', 'hour', 'minute', 'second' of the data line output format (which can be
set by the configuration tool) is missing, are displayed as the index display only. However, in case the time information such
as "hour", "minute", or "second" is missing, the missing data may be regarded as "0" and displayed Time/Date/Date and
Time.
9.7
Changing Graph Appearance
QnUDVCPU High Speed Data Logger High Speed Data Communication
Q Analog
LCPU
L Analog
This section explains the method for changing the graph appearance.
• Changing color and line type of graph ( Page 138, Section 9.7.1)
• Highlighting graph
( Page 143, Section 9.7.2)
• Thickening graph line
( Page 143, Section 9.7.3)
● The graph color (except for background color and grid color), line type, highlight display, and bold lines.
Graph display information can be named and registered to be reflected to other windows.
Page 144, Section 9.8 Registering and Reflecting Graphical Display Settings of Trend Windows
Graph display can be set to be reflected automatically when open the same data logging setting window next time.
Page 148, Section 9.9 Reflecting a Graph Display Automatically When Opening a File
9.7.1
Changing color and type of graph
The settings of graphs (color, type), background color, and graph area (grid color, trigger ON color, trigger OFF color)
displayed on the trend window can be changed.
The following figure shows the settings that can be changed. The settings are changed on the Graph Properties
screen.
Color and type of graph
Page 140, Section 9.7.1 (2), (3)
Trigger ON color
Page 142, Section 9.7.1 (4)
Background color
Page 142, Section 9.7.1 (4)
Trigger OFF color
Page 142, Section 9.7.1 (4)
Grid color
Page 142, Section 9.7.1 (4)
Remark
● Color and type of graph can be specified per data.
● Since the settings of background color, grid color, trigger ON color and trigger OFF color are common to all trend graphs,
changes are reflected to all the event windows being displayed.
138
CHAPTER 9 USING TREND GRAPH FUNCTION
9
(1) Displaying Graph Properties screen
Screen display
•
•
•
[Graph View] B [Graph Properties]
Right-click on the graph legend area, and select [Graph Properties].
Right-click on the graph area, and select [Graph Properties].
Graph
legend
area
9.7 Changing Graph Appearance
9.7.1 Changing color and type of graph
Display contents
Item
Description
Graph Line Style
-
Graph legends
-
Line Type
Displays graph line types of each data.
Data Name
Displays names of each data.
Color and Type
-
Line Color
Specify the graph line color of the selected data in the graph legend area.
Line Type
Specify the graph line type of the selected data in the graph legend area.
Graph Area Style
-
Background Color
Specify the background color of the graph legend area and graph area on the trend window.
Grid Color
Specify the grid color in the graph area.
Trigger ON Color
Specify a color for "ON" displayed in the graph area when a trigger is occurred.
Trigger OFF Color
Specify a color for "OFF" displayed in the graph area when a trigger is cancelled.
button
Fixes the settings and closes the screen.
button
Cancels the settings and closes the screen.
button
Applies the settings to the graphs. (The screen is not closed.)
139
(2) Changing graph line color
Operating procedure
1.
Select the data whose graph color to be changed
from the list of graph legends.
Color
button
2.
Click the color button of "Line Color".
3.
Select a color from "Basic colors" or "Custom
colors" on the Color screen, and click the
button.
4.
Click the
button or the
Graph Properties screen.
Remark
"Custom colors" can be used by the Event Properties and the Graphic Properties in common.
140
button on the
CHAPTER 9 USING TREND GRAPH FUNCTION
9
(3) Changing graph line type
Operating procedure
1.
Select the data whose graph line type to be changed
from the list of graph legends.
2.
Select a type from "Line Type".
3.
Click the
button or the
button.
The following table shows the example of graph line
types.
Line type
Example
Solid Line
9.7 Changing Graph Appearance
9.7.1 Changing color and type of graph
Dash Line
Dot Line
141
(4) Changing Graph Area Style (Background Color, Grid Color, Trigger ON Color,
and Trigger OFF Color)
Operating procedure
1.
Click the color button for the setting to be changed.
2.
Select a color from "Basic colors" or "Custom
Color
buttons
colors" on the Color screen, and click the
button.
3.
Click the
button or the
Graph Properties screen.
Remark
"Custom colors" can be used by the Event Properties and the Graphic Properties in common.
142
button on the
CHAPTER 9 USING TREND GRAPH FUNCTION
9.7.2
Highlighting graph
9
This function highlights the display area of the selected trend graph.
The highlighted display is also reflected to a graph printed on paper.
Screen display
<Without highlight>
<Highlighted>
Operating procedure
[Graph View] B [Graph Highlight]
9.7.3
Thickening graph line
This function thickens the line of the selected trend graph.
<Regular line>
9.7 Changing Graph Appearance
9.7.2 Highlighting graph
Screen display
<Bold line>
Operating procedure
[Graph View] B [Bold Line]
143
9.8
Registering and Reflecting Graphical Display Settings of
Trend Windows
QnUDVCPU High Speed Data Logger High Speed Data Communication
Q Analog
LCPU
L Analog
By registering 'graphical display settings' (graph line color/type, upper/lower limit display value, display items in graph
area*1, highlighted display, bold line, display status of graph legend area) of trend windows being displayed and
naming the setting data as a user setting, they can be reflected to other trend windows.
*1 :
Excluding the setting of the [Set Language] function.
For the target items of 'graphical display settings', refer to the Point in the following sections.
Page 111, Section 9.5 Adjusting Trend Graphs
Page 134, Section 9.6 Changing Display Items in Graph Area
Page 138, Section 9.7 Changing Graph Appearance
This section explains the following operations related to 'graphical display settings' of trend windows.
• Registering 'graphical display settings' of trend window
• Reflecting registered 'graphical display settings' to another window
• Deleting or renaming registered 'graphical display settings'
• Importing/exporting 'graphical display settings'
(1) Registering 'graphical display settings' of trend window
Operating procedure
1.
2.
3.
Select a trend window whose 'graphical display settings' are to be registered. (Activate it.)
[Graph View] B [Register Graphical Display Settings]
On the Register Graphical Display Settings screen, enter "Register Name" and click the
button.
Remark
A new folder can be created under a folder being selected on the Register Graphical Display Settings screen. Select a folder
name and click the
button.
144
CHAPTER 9 USING TREND GRAPH FUNCTION
9
(2) Reflecting registered 'graphical display settings' to another trend window
Operating procedure
1.
2.
3.
Select a trend window to which settings are to be reflected. (Activate it.)
[Graph View] B [Operate Graphical Display Settings]
On the Operate Graphical Display Settings screen, select a display setting to be reflected, and
click the
button.
(3) Deleting or renaming registered 'graphical display settings'
1.
2.
[Graph View] B [Operate Graphical Display Settings]
On the Operate Graphical Display Settings screen, select a desired "Graphical Display Setting"
and click the
button or the
button.
145
9.8 Registering and Reflecting Graphical Display Settings of Trend Windows
Operating procedure
(4) Exporting 'graphical display settings' to the file
Operating procedure
1.
[File] B [Import and Export]
2.
Select [Export Graphical Display Settings].
3.
Click the
4.
Specify a destination directory path and file name to
button.
save export data.
(An extension '.mvs' is added automatically.)
5.
Click the
button.
6.
Click the
button.
Remark
The folder hierarchy information is also saved in an export file.
146
CHAPTER 9 USING TREND GRAPH FUNCTION
9
(5) Importing 'graphical display settings' file
Operating procedure
1.
Logon as a user to the operating system of a
personal computer to which export data are read,
and start GX LogViewer.
2.
[File] B [Import and Export]
3.
Select [Import Graphical Display Settings].
4.
Click the
5.
Specify a path and a name of the file to be imported.
6.
Click the
button.
7.
Click the
button.
button.
9.8 Registering and Reflecting Graphical Display Settings of Trend Windows
Remark
• All information included in an export file is imported.
• The import operation discards a current window setting, and then imports a file.
147
9.9
Reflecting a Graph Display Automatically When Opening
a File
QnUDVCPU High Speed Data Logger High Speed Data Communication
Q Analog
LCPU
L Analog
By storing 'graphical display settings' (graph line color/type, upper/lower limit display value, display items in graph
area*1, highlighted display, bold line, display status of graph legend area) being displayed per data logging setting,
they can be reflected to the graph automatically when opening the trend window next time.
Using this function saves time to set the same data logging settings every time when displaying the same graph as
previously displayed.
*1 :
Excluding the setting of the [Set Language] function.
For the target items of the auto reflect function, refer to the Point in the following sections.
Page 111, Section 9.5 Adjusting Trend Graphs
Page 134, Section 9.6 Changing Display Items in Graph Area
Page 138, Section 9.7 Changing Graph Appearance
Operating procedure
1.
2.
[Graph View]B[Set Graph View by the Auto Reflect Function]
Click the
button.
→ When opening the trend graph of the same data logging setting, the graph display is reflected
automatically.
When initializing the settings, initialize the graph display first, then set the auto reflect function again.
9.10
Initializing Graph Display
QnUDVCPU High Speed Data Logger High Speed Data Communication
Q Analog
LCPU
L Analog
This section explains the method for initializing the changed graph display. (Graph color, etc.)
Operating procedure
1.
2.
Select a trend window to be initialized. (Activate it.)
[Graph View]B[Initialize Graph View]
In case the auto reflect function has already been set, even if the graph is initialized, the graph is displayed obeying the
setting in automatic reflection function when opening the trend window of the same data logging setting next time.
148
CHAPTER 9 USING TREND GRAPH FUNCTION
9.11
Graph Display for Missing Data or Time Reversed Data
QnUDVCPU High Speed Data Logger High Speed Data Communication Q Analog
L CPU
9
L Analog
This section explains the graph display when the data is missing, or the time information is reversed.
(1) Graph display for missing data
When displaying the graph with equidistance plot format, the missing data is displayed as two vertical dasheddotted lines, and the time scale label is displayed as "***".
When displaying the graph with time interval plot format, the missing data is displayed as two vertical dasheddotted lines, and the missing period is displayed as gray.
For details of missing data, refer to the following manuals.
MELSEC-L CPU Module User's Manual (Data Logging Function)
High Speed Data Logger Module User's Manual
High Speed Data Communication Module User's Manual
Screen display
<When displaying with equidistance plot format>
<When displaying with time interval plot format>
When the cursor is placed between the two dashed-dotted lines for missing data, "---" are displayed for the
values/status of graph legends.
(b) Displaying cursor value and difference information for missing data
When the cursor is placed between the two dashed-dotted lines for missing data, the cursor value and the
cursor time on the status bar are displayed as follows.
• Cursor Value: "---"
• Cursor Time : "x/x/xxxx xx:xx:xx.xxx"
For the multiple cursor display, when the red cursor or blue cursor is placed at the missing data area, the
difference and span in the difference information area are displayed as follows.
• Difference: "---"
• Span: "xx:xx:xx.xxx,xxx" (For LCPU)
: "xx:xx:xx.xxx" (For High Speed Data Logger Module)
149
9.11 Graph Display for Missing Data or Time Reversed Data
(a) Displaying values/status of graph legends for missing data
(2) Graph display for reversed data
When displaying the graph with time interval plot format, the reversed period is displayed as oblique stripe, in
case data time is reversed owing to the change of the programmable controller CPU time.
150
CHAPTER 9 USING TREND GRAPH FUNCTION
9.12
Displaying Abnormal Graphs
QnUDVCPU High Speed Data Logger High Speed Data Communication Q Analog
9
L CPU
L Analog
An abnormal graph is displayed when the value of data is a nonnumeric or infinite value.
When a float (single precision, double precision) is expressed as a numeric value, a bit string that is not recognized as
a numeric value is handled as a nonnumeric value.
By the scaling function of High Speed Data Logger Module/High Speed Data Communication Module, values of data
may become plus infinite/minus infinite values.
The following explains the display of nonnumeric and infinite values on the trend window.
(1) Graph display on the trend window
• The graph is not displayed while nonnumeric values continues.
• The cursor labels of the graph are not displayed while nonnumeric values continues.
• For the plus infinite value, the graph attaches to the upper limit display value.
• For the minus infinite value, the graph attaches to the lower limit display value.
9.12 Displaying Abnormal Graphs
(2) Cursor values of graph legends
Values of graph legends are displayed as follows.
• Nonnumeric value: "NaN"
• Plus infinite value: "Inf"
• Minus infinite value: "-Inf"
(3) Cursor value and difference information displayed on the status bar of the
trend window
Cursor Value on the status bar, and Difference (Blue → Red), Value (Blue) in the difference information area are
also displayed as follows.
• Nonnumeric value: "NaN"
• Plus infinite value: "Inf"
• Minus infinite value: "-Inf"
151
9.13
Handling BCD Type Incorrect Values
QnUDVCPU High Speed Data Logger High Speed Data Communication Q Analog
L CPU
L Analog
When the values of 16 bit BCD type integer and 32 bit BCD type integer exceed the maximum value, they are handled
as incorrect values.
The following explains the expression of incorrect values on the trend window.
(1) Graph display on the trend window
• The graph is not displayed while incorrect values continues.
• The cursor labels of the graph is not displayed while incorrect values continues.
• For the multiple cursor display, the horizontal cursor that indicates the intersection with the graph is not
displayed.
(2) Cursor values of graph legends
When the cursor is placed at the plot of incorrect values, "---" are displayed for values of graph legends.
(3) Cursor value and difference information displayed on the status bar of the
trend window
When the cursor is placed at the plot of incorrect values, "---" are displayed for the cursor value on the status bar
and for the cursor value of the blue cursor for the multiple cursor display.
"---" is also displayed for the Difference when the red cursor or the blue cursor is placed at the incorrect value.
152
CHAPTER 10 USING EVENT MONITORING FUNCTION
CHAPTER 10 USING EVENT MONITORING
FUNCTION
10
QnUDVCPU High Speed Data Logger High Speed Data Communication
10.1
Q Analog
L CPU
L Analog
Overview
This function displays the events which are sampled by the event logging function of High Speed Data Logger Module
in the view format.
The following two types of display method are available in the event monitoring.
• Historical event
• Realtime event
Event logging files stored in the CompactFlash card on the High Speed Data Logger Module are displayed.
Stored past events can be confirmed anytime.
(a) Displaying data sampled by High Speed Data Logger Module
Event logging
file
CompactFlash
card
High Speed Data Logger Module
For the operation method, refer to the following section.
Page 159, Section 10.3.1 (1) Displaying logging files saved with event logging function of High Speed
Data Logger Module
153
10.1 Overview
(1) Historical event
(b) Displaying data stored in a personal computer, or in a memory medium connected
to a personal computer
Event logging
file
For the operation method, refer to the following section.
Page 160, Section 10.3.1 (2) Displaying event logging files stored in a personal computer or in a memory
medium connected to a personal computer
(2) Realtime event
The most recent events sampled by the High Speed Data Logger Module are displayed.
They are always kept updated so that the event history from the start of monitoring to current time can be
confirmed.
To display Realtime event, a personal computer and a High Speed Data Logger Module need to be connected to
each other online.
Event logging data
Samples events in realtime,
and displays them.
High Speed Data Logger Module
For details of realtime event display operation, refer to the following section.
Page 161, Section 10.3.2 Displaying current events (Realtime event)
154
CHAPTER 10 USING EVENT MONITORING FUNCTION
10.2
Screen Configuration
This section explains the screen configuration of event windows.
10.2.1
10
Event window
Screen display
Title bar
Event list
10.2 Screen Configuration
10.2.1 Event window
Status bar
Item
Description
Reference
Displays the following data.
• For Historical event
Title bar
Logging file names - historical event (module name)
-
• For Realtime event
Logging setting name - realtime event (module name) [monitoring status]
Event list
Status bar
Displays a list of occurred events.
Displays a source path from which an event logging file is obtained and
the communication status with a High Speed Data Logger Module.
Page 156, Section 10.2.2
Page 157, Section 10.2.3
Remark
A maximum number of realtime event data to be displayed is 2000.
155
10.2.2
Event list
Screen display
Item
Description
Reference
Date
Displays date and time of an event occurrence.
-
No.
Displays the event number.
-
Event Logging Name
Displays a name of an event logging setting.
-
Displays Occurrence/Restoration using the following values.
Status
1: Occurrence
-
0: Restoration
Comment
Displays an occurrence comment or restoration comment.
-
Displays a name and value of monitoring data in the following format.
Monitoring Data
(Event logging name)=(Event value);
(Event logging name)=(Event value);
-
•••(Event logging name)=(Event value)
Filter row
156
Specify a filtering condition.
Page 163, Section 10.4.1
CHAPTER 10 USING EVENT MONITORING FUNCTION
10.2.3
Status bar
Screen display
10
< For Historical event >
< For Realtime event >
Item
Description
Displays the acquisition destination and the logging file type of the data logging file
being displayed with characters and color.
Displayed characters
<For Historical event>
Displays the execution status during sorting/filtering execution.
• When connecting to a High Speed Data Logger Module
High Speed Data Logger Module (IP address or direct connection):/File path
Acquisition destination of event
logging file
• When the save destination is a memory medium in a personal computer or a
memory medium connected to a personal computer
File path
<For Realtime event>
Displays an IP address of a High Speed Data Logger Module communicating with,
or "Direct Connection".
Background color
Communication status
Number of items
Background color
High Speed Data Logger Module
Light yellow
Displays 'Online' or 'Offline'. (For Realtime event only)
Displays the number of events displayed in an event list using the following format.
Number of items: (Number of items being displayed) / (Total number of items)
157
10.2 Screen Configuration
10.2.3 Status bar
Logging file type
10.3
Displaying Event List
This section explains the following operations for displaying events sampled by High Speed Data Logger Module in the
event list.
• Displaying logged events (Historical event) ( Page 158, Section 10.3.1)
• Displaying current events (Realtime event) ( Page 161, Section 10.3.2)
• Operating realtime event monitoring status ( Page 162, Section 10.3.3)
10.3.1
Displaying logged events (Historical event)
With Historical event, the following files stored in a module or a memory medium are specified, and displayed on the
event list.
• Logging files stored in a CompactFlash card with the event logging function of High Speed data Logger
Module
• Event logging files stored in a personal computer or in a memory medium connected to a personal computer
158
CHAPTER 10 USING EVENT MONITORING FUNCTION
(1) Displaying logging files saved with event logging function of High Speed Data
Logger Module
Event logging files stored in a CompactFlash card with the event logging function of High Speed Data Logger
Module are displayed with Historical event.
10
Screen display
1.
2.
3.
4.
[Online] B [Open Logging File] (
)
Select "High Speed Data Logger Module" on the Connection Destination screen.
Specify a High Speed Data Logger Module to be connected with on the Transfer Setup screen.
Cancel the access restriction on the Access Authentication screen. (Only when the access
restriction is set.)
File view
1.
Select a event logging file (***.CSV or ***.BIN) in the file view. (Multiple files cannot be selected.)
Item
Description
Displays a path of the directory being displayed in the file view.
Directory
Or, specify the directory.
Moves to the specified directory.
button
button
Moves up to the directory one layer above.
button
Updates the contents displayed in the file view.
File view
2.
Click the
Displays a list of folders and files in the path specified for "Directory".
button.
→ The selected event logging file is displayed as a event list.
For details of the access authentication, refer to the following manual.
High Speed Data Logger Module User's Manual
159
10.3 Displaying Event List
10.3.1 Displaying logged events (Historical event)
Operating procedure
(2) Displaying event logging files stored in a personal computer or in a memory
medium connected to a personal computer
CSV files or binary files stored in a personal computer or a memory medium are displayed with Historical event.
For saving logging files to a personal computer or to a memory medium, refer to the following chapter.
Page 174, CHAPTER 11 SAVING LOGGING FILES TO PERSONAL COMPUTER
Operating procedure
•
•
[File] B [Open] (
)
Drag and drop the event logging file to the main widow.
(Example: Displaying "HSDL_EVT01.CSV" on the desktop)
OK
OK
160
CHAPTER 10 USING EVENT MONITORING FUNCTION
10.3.2
Displaying current events (Realtime event)
With Realtime event, an event logging setting of the module is specified, and events are displayed on the list.
10
Screen display
1.
2.
3.
[Online] B [Realtime Monitor] (
)
Specify a High Speed Data Logger Module to be connected with on the Transfer Setup screen.
Cancel the access restriction on the Access Authentication screen. (Only when the access
restriction is set.)
4.
Click the <<Event Logging>> tab.
1.
Select a event logging setting from the list.
Item
Description
<<Event Logging>> tab
<<Data Logging>> tab
No.
Click the
Displays the list of data logging settings.
Page 101, Section 9.3.2
Displays the number of a event logging setting.
Event Logging Name
2.
Displays the list of event logging settings.
Displays a name of a event logging setting specified in the High Speed Data Logger
Module configuration tool
button.
→ An event list of the selected event logging setting is displayed.
For details of the access authentication, refer to the following manual.
High Speed Data Logger Module User's Manual
161
10.3 Displaying Event List
10.3.2 Displaying current events (Realtime event)
Operating procedure
10.3.3
Operating realtime event monitoring status
In Realtime event, the following operations are used to change the monitoring status and control graphs.
• Starting monitoring
• Stopping monitoring
(1) Starting monitoring
This operation starts the communication with a High Speed Data Logger Module and turns the monitoring status
from Stop to Run.
Operating procedure
[Online] B [Begin Monitor] (
)
The status of the tool buttons changes as shown below when monitoring.
<Monitoring: Stop>
<Monitoring: Run>
Start monitoring
(2) Stopping monitoring
This operation disconnects the communication with a High Speed Data Logger Module and stops updating the
event list.
Operating procedure
[Online] B [End Monitor] (
)
The status of the tool buttons changes as shown below when monitoring is stopped.
<Monitoring: Run>
<Monitoring: Stop>
Stop monitoring
162
CHAPTER 10 USING EVENT MONITORING FUNCTION
10.4
Operating Event List
The following operations are used for arranging an event list display according to the purpose.
10
• Displaying only events that meet specific conditions (Filtering) ( Page 163, Section 10.4.1)
• Sorting events ( Page 165, Section 10.4.2)
• Selecting language ( Page 166, Section 10.4.3)
• Displaying consecutive previous/next event ( Page 166, Section 10.4.4)
10.4.1
Displaying only events that meet specific conditions (Filtering)
Events being displayed in the event list can be limited according to specific conditions (filtering conditions) of each
column.
When multiple conditions are specified, only events that meet all conditions are displayed in the event list.
Screen display
Example: Specifying 'QD81DL96 Start' as a condition for the "Event Logging Name" column.
<Before filtering>
10.4 Operating Event List
10.4.1 Displaying only events that meet specific conditions (Filtering)
<After filtering>
Operating procedure
1.
Perform any of the following operations to display the filter row.
•
[Event] B [Filter] (
)
• Right-click on the event list, and select [Filter].
Filter row
2.
Set a filtering condition to the filter row. The following are the three setting methods.
• Filtering by "Date" ( Page 164, Section 10.4.1 (2)(a))
• Filtering by other items ( Page 164, Section 10.4.1 (2)(b), (c))
• Clearing filtering conditions ( Page 164, Section 10.4.1 (2)(d))
163
(a) Filtering by "Date"
Operating procedure
1.
2.
3.
4.
*1 :
Click the filter row in the "Date" column.
Select "Enable Filter".
Select "Filtering Begin Date" and "Filtering End Date" on the Filter Period Settings screen.*1
Click the
button.
Without specifying "Filtering Begin Date", all of events older than date and time specified in "Filtering End Date" are
displayed. Without specifying "Filtering End Date", all of events newer than date and time specified in "Filtering Begin
Date" are displayed.
(b) Filtering by an item selected from a list box
Operating procedure
1.
2.
*2 :
Click a cell in the filter row.
From the list box, select an item to filter events by.*2
List box selection is not available in the "Monitoring Data" column.
(c) Filtering by an item input directly
Operating procedure
1.
2.
Directly enter a filtering condition in a cell of the filter row.
Press the
Enter
key.
(d) Clearing filter conditions
Operating procedure
•
•
•
•
164
Select "Disable Filter" on the Filter Period Settings screen.
Select '(Empty)' in a list box.
Clear a cell of the filter row.
Hide the filter row.
CHAPTER 10 USING EVENT MONITORING FUNCTION
Remark
• A new event occurs after filtering is displayed in an event list only if it matches the filter conditions.
• Filtering is executed with not perfect match but partial match of a string specified in a cell of the filter row.
10.4.2
10
Sorting events
This function sorts events being displayed in the event list in ascending order (
) or descending order (
) by the
value of each column.
Screen display
Example: Sorting "Event Logging Name" in ascending order (
)
<Before sorting>
<After sorting>
10.4 Operating Event List
10.4.2 Sorting events
Operating procedure
•
[Event] B [Sort by] B [Date] / [No.] / [Event Logging Name] / [Status] / [Comment]
/ [Monitoring Data].
•
Click the item name displayed on the top of each column.
After sorting events,
(ascending order)/
(descending order) is displayed on the right side of the item name.
Remark
Events which occurred after the sort are inserted to the list in a status maintaining the sorting order.
165
10.4.3
Switching languages
This function switches a language of event logging names and comments displayed on a historical event window.
In Historical event, event logging names and comments are displayed in a language used in the read event logging file.
If characters of codes which can be used in multiple languages or characters of inapplicable languages are used for
data names, those characters may be corrupted.
If characters are corrupted, change the language.
Operating procedure
[Event] B [Set Language] B [Chinese Simplified]
/ [Chinese Traditional]
/ [English]
/ [Japanese]
/ [Korean]
/ [Unicode (UTF-8)]
Filtering needs to be disabled when performing the [Set Language] function.
Sorting is reset when the [Set Language] function is performed while data are being sorted.
10.4.4
Displaying consecutive previous/next event
Normally, one event logging file is displayed on a historical event window. However, the previous/next event logging file
can be displayed simultaneously by using this function.
This function enables the consecutive view of divided event logging files.
● The previous/next data logging file in CSV or binary format can be displayed.
● The previous/next event logging file may not be displayed if any of the following operations is performed using an event
logging file stored in a personal computer.
If the previous/next event logging file cannot be displayed, create the same folder configuration as the one under
'/EVENT' in a CompactFlash card before operating.
• A name of a folder or event logging file under the event logging name has been changed.
• The previous/next event logging file has been deleted.
• File names of event logging files are not in series.
166
CHAPTER 10 USING EVENT MONITORING FUNCTION
(1) Displaying previous events
Operating procedure
10
[Event] B [Show Previous Event]
Screen display
Either of the following two operations is used for displaying event logging files when performing the "Show
Previous Event" function.
• Operating from the status when only one event logging file is displayed.
• Operating from the status when the previous event logging file is already displayed.
<Operating from the normal status>
Time axis Event logging file configuration
Event window
/EVENT
/EVT01
<Before operation>
(Earlier)
0000001
00000001.CSV
File displayed
before the
operation
Events in 00000103.csv
are displayed
Time
Perform 'Show Previous Event'
00000102.CSV
Previous events
0000002
<After operation>
00000103.CSV
00000255.CSV
Files to be
displayed after
the operation
Events in 00000102.csv
are displayed
(Later)
Up to two
files can be
displayed
EVT01.CSV
File sampling
current events
Events in 00000103.csv
are displayed
/EVT02
167
10.4 Operating Event List
10.4.4 Displaying consecutive previous/next event
00000101.CSV
<Operating from the status when the previous event logging file is already displayed>
Time axis Event logging file configuration
Event window
<Before operation>
/EVENT
/EVT01
(Earlier)
0000001
00000001.CSV
Previous events
Time
00000101.CSV
Files displayed
before the
operation
Events in 00000102.csv
are displayed
Events in 00000103.csv
are displayed
00000102.CSV
Perform 'Show Previous Event'
0000002
<After operation>
00000103.CSV
00000255.CSV
(Later)
Files to be
displayed after
the operation
EVT01.CSV
/EVT02
Events in 00000101.csv
are displayed
Up to two
files can be
displayed
File sampling
current events
Events in 00000102.csv
are displayed
The "Show Previous Event" function cannot be performed to an event logging file whose serial number is the smallest
number.
168
CHAPTER 10 USING EVENT MONITORING FUNCTION
(2) Displaying next events
Operating procedure
10
[Event] B [Show Next Event]
Screen display
Either of the following two operations is used for displaying event logging files when performing the "Show Next
Event" function.
• Operating from the status when only one event logging file is displayed.
• Operating from the status when the next event logging file is already displayed.
<Operating from the normal status>
Time axis Event logging file configuration
Event window
/EVENT
/EVT01
<Before operation>
(Earlier)
0000000
File displayed
before the
operation
00000001.CSV
Events in 00000101.csv
are displayed
Time
Perform 'Show Next Event'
00000102.CSV
Next events
0000000
<After operation>
00000103.CSV
00000255.CSV
Files to be
displayed after
the operation
Events in 00000101.csv
are displayed
(Later)
Up to two
files can be
displayed
EVT01.CSV
File sampling
current events
Events in 00000102.csv
are displayed
/EVT02
169
10.4 Operating Event List
10.4.4 Displaying consecutive previous/next event
00000101.CSV
<Operating from the status when the next event logging file is already displayed>
Time axis Event logging file configuration
Event window
<Before operation>
/EVENT
/EVT01
(Earlier)
0000000
00000001.CSV
Files displayed
before the
operation
00000101.CSV
Events in 00000101.csv
are displayed
Time
Events in 00000102.csv
are displayed
00000102.CSV
0000000
Perform 'Show Next Event'
Next events
<After operation>
00000103.CSV
00000255.CSV
(Later)
EVT01.CSV
/EVT02
Files to be
displayed after
the operation
Events in 00000102.csv
are displayed
Up to two
files can be
displayed
File sampling
current events
Events in 00000103.csv
are displayed
● The "Show Next Event" function cannot be performed to an event logging file (a file that is sampling the current events)
whose serial number is not assigned.
● Sorting may be reset when an event list is sorted and the "Show Previous Event"/"Show Next Event" function is
performed.
170
CHAPTER 10 USING EVENT MONITORING FUNCTION
10.5
Changing Display Settings of Event List
This section explains the method for customizing font color, background color, and display items in the event list.
The following figure shows customizable parts in the event list. Settings are changed on the Event Properties screen.
Occurrence color
Page 173, Section 10.5 (2)
Grid color
Page 173, Section 10.5 (2)
Background color
Page 173, Section 10.5 (2)
Remark
Since the settings of the event properties are common to all event windows, changes are reflected to all the event windows
being displayed.
171
10.5 Changing Display Settings of Event List
Restoration color
Page 173, Section 10.5 (2)
Switching display/hide
Page 173, Section 10.5 (3)
10
(1) Event properties screen
Operating procedure
•
•
[Event] B [Event Properties]
Right-click on the event list, and select [Event Properties].
Setting screen
Item
Color Settings
-
Occurrence Color
Specify the font color in lines displaying event occurrences.
Restoration Color
Specify the font color in lines displaying event restorations.
Background Color
Specify the background color of the event list.
Grid Color
Specify the grid color of the event list.
Display Items Settings
172
Description
-
No.
Uncheck this item to hide the "No." column.
Event Logging Name
Uncheck this item to hide the "Event Logging Name" column.
Status
Uncheck this item to hide the "Status" column.
Comment
Uncheck this item to hide the "Comment" column.
Monitoring Data
Uncheck this item to hide the "Monitoring Data" column.
button
Fixes the settings and closes the screen.
button
Cancels the settings and closes the screen.
button
Applies the settings to the event list. (The screen is not closed.)
CHAPTER 10 USING EVENT MONITORING FUNCTION
(2) Changing Color Settings (Occurrence Color, Restoration Color, Background
Color, Grid Color) of event list
10
Operating procedure
Color buttons
1.
Click a color button of an item to be changed.
2.
Select a color from "Basic colors" or "Custom
colors" on the Color screen, and click the
button.
3.
Click the
button or the
button on the
Event Properties screen.
"Custom colors" can be shared by the Event Properties and the Graph Properties
(3) Changing Display Items Settings (No., Event Logging Name, Status, Comment,
Monitoring Data) in event list
Operating procedure
1.
In "Display Item Settings", uncheck column items
not to display in an event list.
2.
Click the
button or the
button.
173
10.5 Changing Display Settings of Event List
Remark
CHAPTER 11 SAVING LOGGING FILES TO
PERSONAL COMPUTER
QnUDVCPU High Speed Data Logger High Speed Data Communication
Q Analog
LCPU
L Analog
This chapter explains the method for saving logging files in a memory card installed on a module to a personal
computer. Saved files can be checked by Historical trend or Historical event.
Screen display
1.
2.
3.
[Online] B [Save Logging File to PC (
)
Select an equipment from which logging files are obtained on the Connection Destination screen.
Specify a module to be connected and the connection method on the Transfer Setup screen.
•For QnUDVCPU/LCPU and Q/L Analog Module: Transfer setup screen (Page 72, Section 8.2.1)
•For High Speed Data Logger Module: Transfer setup screen (Page 72, Section 8.2.1)
4.
Cancel the access restriction on the following screen.
•For QnUDVCPU/LCPU and Q/L Analog Module: Enter remote password screen (Only when the remote
password is set.)
•For High Speed Data Logger Module: Access Authentication screen (Only when the access restriction is set.)
(Example of screen display for High Speed Data Logger Module)
File view
Operating procedure
1.
Select a file to be saved in the file view. (Multiple files can be selected.)
Item
Description
Displays a path of a directory being displayed in the file view.
Or, specify a move destination directory.
Directory *1
button *1
Moves to the specified destination directory.
button *1
Moves up one directory level.
button
Updates contents displayed in the file view.
Displays a list of files and folders contained in the path specified in "Directory".
(For details of logging file destination folder and folder configuration, refer to the
corresponding manuals of modules.)
File view
*1 :
2.
These items can be operated when saving destination is a CompactFlash card or an SD memory card.
Click the
button.
(Continued on the next page)
174
CHAPTER 11 SAVING LOGGING FILES TO PERSONAL COMPUTER
(From the previous page)
3.
Specify the destination to save files.
(a) Saving a single file
Specify a file name and save it.
11
(b) Saving multiple files
Specify a destination folder and save multiple files at once.
They cannot be saved to separate folders and their file names cannot be changed.
● CSV file format of the logging file
The CSV file format saved with "Save Logging File to PC" in this section differs from that of "Saving displayed data/
events" written in CHAPTER 13.
For the CSV file format of the data acquired directly from the module by executing "Save Logging File to PC", refer to the
manuals of each module.
● For details of access authentication, refer to the following manual.
High Speed Data Logger Module User's Manual
● For details of remote password, refer to the following manuals.
QCPU User's Manual (Function Explanation, Program Fundamentals)
QnUCPU User's Manual (Function Explanation, Program Fundamentals)
MELSEC-L CPU Module User's Manual (Function Explanation, Program Fundamentals)
● Other monitoring updates may be delayed in the following cases since saving data logging files requires time.
• Saving a data logging file during the execution of data logging
• Saving a large-volume data logging file
175
CHAPTER 12 USING WINDOWS/FOLDERS
DISPLAYED IN PAST
QnUDVCPU High Speed Data Logger High Speed Data Communication
12.1
Q Analog
LCPU
L Analog
Overview
This function saves window and folder information of the trend window and event window being displayed using 'Frequentlyused Window Configuration' function, 'Recent Windows' function, or 'Recent Folders' function and redisplay them easily next
time.
Item
Description
Target settings to be saved
Reference
• Window layout of each window
Names the information explains on
the right of every trend window and
Frequentlyused Window
Configuration
• Connection information with a module and save
destination information of the logging file
event window being displayed, and
• All the data being displayed and event
adds them to the menu.
• Displaying trend window *1
The added window can be redis-
• Displaying event window *2
played easily from the menu
• Sorting status and filtering condition of an event
Page 177, Section 12.2
list
• Connection information with a module and save
Adds every trend window and event
Recent
Windows
destination information of the logging file
window being displayed to the menu
• All the data being displayed and event
automatically.
• Displaying trend window *1
The added window can be
• Displaying event window *2
redisplayed easily from the menu.
• Sorting status and filtering condition of an event
Page 181, Section 12.3
list
Adds a specified folder when opening
or saving to the menu automatically.
Recent
The added folder can be opened and
Folders
selected logging file in the menu
easily.
*1 :
*2 :
176
Save destination of data and events being displayed
• Directory path in a personal computer
• Directory path of a memory card installed on a
Page 182, Section 12.4
module
Excluding the background color, grid color, and trigger ON/OFF color.
Excluding the background color, grid color, occurrence/restoration color, and display check status of each column.
CHAPTER 12 USING WINDOWS/FOLDERS DISPLAYED IN PAST
12.2
Adding/Restoring Frequently-Used Window
Configurations to Menu
By adding frequently-used trend windows or event windows to the menu as 'frequently-used window configurations',
they can easily be restored.
'frequently-used window configurations' can be exported and used for other logon users or a personal computer.
This section explains the following operations related to 'frequently-used window configurations'.
• Adding a 'frequently-used window configuration' to the menu
• Restoring a 'frequently-used window configuration'
12
• Deleting, renaming or sorting a 'frequently-used window configuration'
• Changing order of 'frequently-used window configurations' in the menu
• Importing/exporting 'frequently-used window configurations'
(1) Adding a 'frequently-used window configuration' to the menu
Operating procedure
1.
Arrange a window configuration to be added as a 'frequently-used window configuration'.
[Window] B [Frequently-used Window Configuration] B [Add to Frequently-used Window
Configuration]
3.
On the Add to Frequently-used Window Configuration screen, enter "Name" and click the
button.
Remark
A new folder can be created under the folder being selected on the Add to Frequently-used Window Configuration screen.
Select a folder name and click the
button.
177
12.2 Adding/Restoring Frequently-Used Window Configurations to Menu
2.
(2) Restoring a 'frequently-used window configuration'
Operating procedure
[Window] B [Frequently-used Window Configuration] B [(name of a frequently-used window
configuration)]
(3) Deleting, renaming or sorting a 'frequently-used window configuration'
Operating procedure
1.
2.
3.
[Window] B [Frequently-used Window Configuration]
Select a desired [(name of a frequently-used window configuration)], and right-click it.
Select [Delete], [Rename] or [Sort by Name].
(4) Changing order of 'frequently-used window configurations' in the menu
Operating procedure
1.
2.
[Window] B [Frequently-used Window Configuration]
Select a desired [(frequently-used window configuration)], drag it to the desired position.
(Example: Dragging and dropping 'Sensor monitoring window' over 'Monitoring comparison')
178
CHAPTER 12 USING WINDOWS/FOLDERS DISPLAYED IN PAST
(5) Exporting 'frequently-used window configurations'
Operating procedure
1.
[File] B [Import and Export]
12
2.
Select [Export Frequently-used Window
Configurations].
3.
Click the
4.
Specify a destination directory path and file name to
button.
12.2 Adding/Restoring Frequently-Used Window Configurations to Menu
save export data.
(An extension '.mws' is added automatically. )
5.
Click the
button.
6.
Click the
button.
Remark
The folder hierarchy information is also saved in an export file.
179
(6) Importing 'frequently-used window configurations'
Operating procedure
1.
Logon as a user to the operating system of a
personal computer to which export data are read,
and start GX LogViewer.
2.
3.
[File] B [Import and Export]
Select [Import Frequently-used Window
Configurations].
4.
Click the
5.
Specify a path and a name of the file to be imported.
6.
Click the
button.
7.
Click the
button.
button.
Remark
• All information included in an export file is imported.
• The import operation discards a current window setting, and then imports a file.
180
CHAPTER 12 USING WINDOWS/FOLDERS DISPLAYED IN PAST
12.3
Redisplaying Recently-Used Windows
By registering recently-used trend windows or event windows to the menu automatically as 'recent windows', they can
easily be redisplayed.
Remark
Up to nine 'recent windows' can be stored by each of the following window types. The chronologically oldest 'recent window'
is removed when the tenth 'recent window' is stored.
• Historical trend window
• Realtime trend window
• Historical event window
• Realtime event window
12
Operating procedure
[Window] B [Recent Windows] B [Historical Trend] / [Realtime Trend] / [Historical Event] /
[Realtime Event] B [(name of a recent window)]
Any of the following tooltips is displayed by placing a mouse on a name of a 'recent window' and it enables users to
distinguish 'recent windows' of the same name from each other. Tooltips differ depending on the target of the data logging
and the event logging.
• Directory path of a memory card installed on a connected module
• Directory path of a data logging file and event logging file stored in a personal computer
• IP address of a connected module
If data in a memory card is changed after the setting of a window being displayed has been stored, the window configuration
may not be restored using the 'recent window' function.
181
12.3 Redisplaying Recently-Used Windows
Remark
12.4
Redisplaying Recently-Used Folders
By registering recently-used folders to the menu automatically as 'recent folders', they can easily be redisplayed.
Remark
Up to nine 'recent folders' can be stored. The chronologically oldest 'recent folder' is removed when the tenth 'recent folder'
is stored.
Operating procedure
(a) Opening a logging file in a personal computer
[File] B [Recent Folders]
(b) Opening a logging file in a memory card installed on a module
[Online] B [Recent Folders]
182
CHAPTER 13 SAVING DISPLAYED DATA/EVENTS
CHAPTER 13 SAVING DISPLAYED DATA/EVENTS
QnUDVCPU High Speed Data Logger High Speed Data Communication
Q Analog
LCPU
L Analog
This function saves data being displayed in trend windows and events being displayed in event windows to a CSV file
or image file (BMP/JPG/PNG) in a personal computer.
Saved CSV files can be displayed on trend windows and event windows.
13.1
Save Target
13
The data and event being displayed on the active window (historical window, realtime window) can be saved.
• Realtime trend data can be saved in CSV format only when the monitoring process is stopped or the graph
drawing is paused.
• When two data logging files or two event logging files are consecutively displayed, their data or events can be
saved to one file.
Remark
For High speed data communication module, only the data being displayed on the active realtime trend window can be
saved.
13.1 Save Target
183
13.2
Saving Displayed Data
Data displayed on the active historical trend window and realtime trend window are saved to either following file.
• CSV file
• Image file
13.2.1
Saving displayed data to CSV file
Data displayed in the graph legend area of active trend window are saved to a CSV file.
When saving historical trend data, data names are saved in a selected language.
Operating procedure
1.
2.
[File] B [Save As] B [Save CSV File] (
Enter a file name, and click the
)
button.
(1) Data to be saved
(a) For Historical trend
Data of a data logging file(s) being displayed are saved.
(b) For Realtime trend
Data received from the start of monitoring to the pause of graph drawing are saved.
Remark
Data removed from the graph legend area are not included in the save target.
(2) Format specification of CSV file
CSV file formats may differ depending on the logging file type. For details of the format, refer to the following
table.
Logging file type
184
Reference
QnUDVCPU/LCPU
Page 185, (2)(a) in this section
High Speed Data Logger Module
Page 188, (2)(b) in this section
High Speed Data Communication Module
Page 191, (2)(c) in this section
Q/L Series Analog Module
Page 194, (2)(d) in this section
Energy Measuring Unit
Page 196, (2)(e) in this section
Sampling trace
Page 199, (2)(f) in this section
CHAPTER 13 SAVING DISPLAYED DATA/EVENTS
(a) QnUDVCPU/LCPU
Format specification
The following explains the format specification of CSV files.
Item
Description
Delimiter
, (comma)
Linefeed code
CRLF(0x0D,0x0A)
Character code
ASCII
Number of rows
Maximum number of rows:131074 rows (data rows +4)
Output data of rows/columns
The following is an example of output data of rows/columns.
File information row
Comment row
Data type information row
Data name row
13
Data row
File information row
The file information row outputs information related to files.
Column number
1st column
Column name
File Type
Output data
File type of output file
Fixed value: [LOGGING]
Version of output file
2nd column
File version
Fixed value:
QnUDVCPU:Q1
LCPU:L1
Number indicating the data type information row
Row number of data type information row
13.2 Saving Displayed Data
13.2.1 Saving displayed data to CSV file
3rd column
Fixed value:
With comment row: 3
Without comment row: 2
Number indicating the data name row
4th column
Row number of data name row
Fixed value:
With comment row: 4
Without comment row: 3
Starting number of data rows
5th column
Starting row number of data rows
With comment row: 5
Without comment row: 4
6th column
*1 :
Row number of comment row*1
Number indicating the comment row
Fixed value: 2
Data in this column are not output if data in the comment row are not output to logging data.
185
Data type information row
The data type information row outputs data types of each column.
Column number
Column name
1st column
Date and time column*1
2nd column
Millisecond column*1
3rd column
Data sampling interval column
4th column
Execution step number column
5th column
6th column
Output data
Data type of date and time
Fixed string: DATETIME[YYYY/MM/DD hh:mm:ss]
Data type of millisecond of date and time
Fixed string: ms]
Data type of data sampling interval column
Fixed string: INTERVAL
Data type of execution step number
Fixed string: STEP NO.
Execution program name
Data type of execution program name
column
Fixed string: PROGRAM NAME
Index column
Index column
Fixed string: INDEX
Data type of sampled data
7th column and later
Data column
Output format: Data type output string [Additional
information]
Page 201, (2)(g) in this section
Fixed string regardless of continuous logging/trigger
Last column
Trigger ON information column
logging
Output format: TRIGGER[(trigger ON string);]*2
*1 :
*2 :
When the data, whose Date and time column is set not to output by the configuration tool, is saved to a CSV
file, the Date and time column and the Millisecond column are not output.
For the continuous logging, '*' is output for 'trigger ON string'.
Data name row
Column number
Output data
Title of date and time column
Fixed string: TIME
1st column
Date and time column*1
2nd column
Millisecond column*1
3rd column
Data sampling interval column
Title of Data sampling interval column
Fixed string: INTERVAL[us]
4th column
Execution step number column
Title of execution step number
Fixed string: STEP NO,
5th column
Execution program name
column
Title of execution program name
Fixed string: PROGRAM NAME
6th column
Index column
Title of index column
Fixed string: INDEX
7th column and later
Data column
Title of data column
Output format: Device No. or device comments
Last column
Trigger ON information column
Title of trigger column
Fixed string: Trigger
*1 :
186
Column name
Title of millisecond of date and time
Fixed string: msec
When the data, whose Date and time column is set not to output by the configuration tool, is saved to a CSV
file, the Date and time column and the Millisecond column are not output.
CHAPTER 13 SAVING DISPLAYED DATA/EVENTS
Data row
For a historical trend window, data are output in the order that the data are stored to a data logging file.
Column number
Column name
Output data
Date and time information
1st column
Date and time column*1
2nd column
Millisecond column*1
Value of millisecond
3rd column
Data sampling interval column*2
Value of data sampling interval
4th column
Execution step number column*2
5th column
Execution program name column*2
6th column
Index column*3
Output format: YYYY/MM/DD hh:mm:ss
Value of execution step number
Output format: Integer value
Execution program name
Output format: STRING (program name)
Value of index
Output format: Integer value
13
Value of sampled device
7th column and later
Data column
Output format: Value corresponds to the type in the
data type information row
Last column
*1 :
*2 :
*3 :
Trigger ON information column
Information at trigger occurrence
Output format: String specified by configuration tool
When the data, whose Date and time column is set not to output by the configuration tool, is saved to a CSV
file, the Date and time column and the Millisecond column are not output.
When the data, whose columns are set not to output by the configuration tool, is saved to a CSV file, the data in
columns correspond to those not-output items are not output, and only the delimiter ',' (comma) is output.
When the data, whose indexes are set not to output by the configuration tool, is saved to a CSV file, the
indexes with starting from 1 are automatically output.
187
13.2 Saving Displayed Data
13.2.1 Saving displayed data to CSV file
The CSV file format explained in this section differs from the CSV file format obtained from QnUDVCPU/LCPU. For module
CSV file format, refer to the following manuals.
QnUDVCPU/LCPU User's Manual (Data Logging Function)
(b) High Speed Data Logger Module
Format specification
The following explains the format specification of CSV files.
Item
Description
Delimiter
, (comma)
Linefeed code
CRLF(0x0D,0x0A)
Character code
ASCII
Number of rows
Maximum number of rows: 200003 rows (data rows +3)
Output data of rows/columns
The following is an example of output data of rows/columns.
File information row
Data type information row
Data name row
Data row
File information row
The file information row outputs information related to files.
Column number
Column name
1st column
File Type
2nd column
File version
3rd column
Row number of data type information row
4th column
Row number of data name row
Output data
File type of output file
Fixed value: [LOGGING]
Version of output file
Fixed value: 1
Number indicating the data type information row
Fixed value: 2
Starting number of data rows
With comment row:
Fixed value: 3
5th column
188
Starting row number of data rows
Starting number of data rows
Fixed value: 4
CHAPTER 13 SAVING DISPLAYED DATA/EVENTS
Data type information row
The data type information row outputs data types of each column.
Column number
Column name
1st column
Date and time column*1
2nd column
Microsecond column*1
3rd column
Index column
Output data
Data type of date and time
Fixed string: DATETIME[YYYY/MM/DD hh:mm:ss]
Data type of microsecond of date and time
Fixed string: us]
Index column
Fixed string: INDEX
Data type of sampled data
4th column and later
Data column
Output format: Data type output string [Additional
information]
Page 201, (2)(g) in this section
Fixed string regardless of continuous logging/trigger logging
Last column
Trigger ON information column
Output format: TRIGGER[(trigger ON string); (trigger OFF
13
string)]*2
*1 :
*2 :
When the data, whose Date and time column is set not to output by the configuration tool, is saved to a CSV
file, the Date and time column and the Millisecond column are not output.
On a historical trend window opened with a CSV file, a trigger ON string and trigger OFF string are displayed
according to the information in the file. On a historical trend window opened with a binary file and a realtime
trend window, a trigger ON string = '*' and a trigger OFF string = '-' are displayed.
Data name row
Column number
Column name
Output data
Title of date and time column
Fixed string: TIME
1st column
Date and time column*1
2nd column
Microsecond column*1
3rd column
Index column
Title of index column
Fixed string: INDEX
4th column and later
Data column
Title of data column
Output format: Data name
Last column
Trigger ON information column
Title of trigger column
Fixed string: Trigger
*2 :
Fixed string: usec*2
When the data, whose Date and time column is set not to output by the configuration tool, is saved to a CSV
file, the Date and time column and the Millisecond column are not output.
When the data, whose Date and time column is set not to output and Microsecond column is set to output by
the configuration tool, is saved to a CSV file, the Microsecond column is output.
189
13.2 Saving Displayed Data
13.2.1 Saving displayed data to CSV file
*1 :
Title of microsecond column
Data row
For a historical trend window, data are output in the order that the data are stored to a data logging file.
For a realtime trend window, data are output in the order that the data are received.
Column number
Column name
1st column
Date and time column*1
2nd column
Microsecond column*1
3rd column
Index column*2
4th column and later
Data column
Output data
Date and time information
Output format: YYYY/MM/DD hh:mm:ss
Data type of data sampling interval column
Index value
Output format: Integer value
Value of sampled device
Output format: Value corresponds to the type in the data
type information row
Last column
*1 :
*2 :
Trigger ON information column
Information at trigger occurrence
Output format: String specified by configuration tool
When the data, whose Date and time column is set not to output by the configuration tool, is saved to a CSV
file, the Date and time column and the Millisecond column are not output.
When the data, whose indexes are set not to output by the configuration tool, is saved to a CSV file, the
indexes with starting from 1 are automatically output.
The CSV file format explained in this section differs from the CSV file format obtained from High Speed Data Logger Module.
For module CSV file format, refer to the following manuals.
High Speed Data Logger Module User's Manual
190
CHAPTER 13 SAVING DISPLAYED DATA/EVENTS
(c) High Speed Data Communication Module
Format specification
The following explains the format specification of CSV files.
Item
Description
Delimiter
, (comma)
Linefeed code
CRLF(0x0D,0x0A)
Character code
ASCII
Number of rows
Maximum number of rows: 100004 rows (data rows +3)
Output data of rows/columns
The following is an example of output data of rows/columns.
File information row
Data type information row
Data name row
13
Data row
File information row
The file information row outputs information related to files.
Column number
Column name
1st column
File Type
2nd column
File version
3rd column
Row number of data type information row
4th column
Row number of data name row
Output data
File type of output file
Fixed value: [LOGGING]
Version of output file
Fixed value: QJ71DC96_1*1
Number indicating the data type information row
Fixed value: 2
Starting number of data rows
13.2 Saving Displayed Data
13.2.1 Saving displayed data to CSV file
With comment row:
Fixed value: 3
5th column
*1 :
Starting row number of data rows
Starting number of data rows
Fixed value: 4
(Product type)_(Version number) is displayed at the File version column.
191
Data type information row
The data type information row outputs data types of each column.
Column number
Column name
1st column
Date and time column*1
2nd column
Microsecond column*1
3rd column
Index column
Output data
Data type of date and time
Fixed string: DATETIME[YYYY/MM/DD hh:mm:ss]
Data type of microsecond of date and time
Fixed string: us]
Index column
Fixed string: INDEX
Data type of sampled data
4th column and later
Data column
Output format: Data type output string [Additional
information]
Page 201, (2)(g) in this section
Fixed string regardless of continuous logging/trigger logging
Last column
Trigger ON information column
Output format: TRIGGER[(trigger ON string); (trigger OFF
string)]*2
*1 :
*2 :
When the data, whose Date and time column is set not to output by the configuration tool, is saved to a CSV
file, the Date and time column and the Millisecond column are not output.
On a historical trend window opened with a CSV file, a trigger ON string and trigger OFF string are displayed
according to the information in the file. On a historical trend window opened with a binary file and a realtime
trend window, a trigger ON string = '*' and a trigger OFF string = '-' are displayed.
Date name row
Column number
Output data
Title of date and time column
Fixed string: TIME
1st column
Date and time column*1
2nd column
Microsecond column*1
3rd column
Index column
Title of index column
Fixed string: INDEX
4th column and later
Data column
Title of data column
Output format: Data name
Last column
Trigger ON information column
Title of trigger column
Fixed string: Trigger
*1 :
*2 :
192
Column name
Title of microsecond column
Fixed string: usec*2
When the data, whose Date and time column is set not to output by the configuration tool, is saved to a CSV
file, the Date and time column and the Millisecond column are not output.
When the data, whose Microsecond column is set not to output by the configuration tool, is saved to a CSV file,
the Microsecond column is output.
CHAPTER 13 SAVING DISPLAYED DATA/EVENTS
Data row
For a historical trend window, data are output in the order that the data are stored to a data logging file.
For a realtime trend window, data are output in the order that the data are received.
Column number
Column name
1st column
Date and time column*1
2nd column
Microsecond column*1
3rd column
Index column*2
4th column and later
Data column
Output data
Date and time information
Output format: YYYY/MM/DD hh:mm:ss
Data type of data sampling interval column
Index value
Output format: Integer value
Value of sampled device
Output format: Value corresponds to the type in the data
type information row
Last column
*1 :
*2 :
Trigger ON information column
— (Blank)
When the data, whose Date and time column is set not to output by the configuration tool, is saved to a CSV
file, the Date and time column and the Millisecond column are not output.
When the data, whose indexes are set not to output by the configuration tool, is saved to a CSV file, the
indexes with starting from 1 are automatically output.
13
The CSV file format explained in this section differs from the CSV file format obtained from High Speed Data Communication
Module. For module CSV file format, refer to the following manuals.
High Speed Data Communication Module User's Manual
13.2 Saving Displayed Data
13.2.1 Saving displayed data to CSV file
193
(d) Q/L Series Analog Module
Format specification
The following explains the format specification of CSV files.
Item
Description
Delimiter
, (comma)
Linefeed code
CRLF(0x0D,0x0A)
Character code
ASCII
Number of rows
Maximum number of rows: 10003 rows (data rows +3)
Output data of rows/columns
The following is an example of output data of rows/columns.
File information row
Data type information row
Data name row
Data row
File information row
The file information row outputs information related to files.
Column number
1st column
Column name
Output data
File type of output file
File Type
Fixed value: [LOGGING]
The file version of Q/L Analog Module differs
depending on the module type.
2nd column
For details, refer to the user's manual of each
File version
module.
(Example)Q68CT: Q68CT_1
(Example)L60AD4: LAD1
3rd column
Row number of data type information row
4th column
Row number of data name row
5th column
Starting row number of data rows
Number indicating the data type information row
Fixed value: 2
Number indicating the data name row
Fixed value: 3
Starting number of data row
Fixed value: 4
Data type information row
The data type information row outputs data types of each column.
Column number
1st column
2nd column and
later
194
Index column
Output data
Index column
Fixed string: INDEX
Data type of sampled data
Data column
Output format: Data type output string [Additional information]
Page 201, (2)(g) in this section
Last column
*1 :
Column name
Trigger ON information column
'*' is output to 'trigger ON string'.
Fixed string: TRIGGER[(trigger ON string)]*1
CHAPTER 13 SAVING DISPLAYED DATA/EVENTS
Data name row
Column number
1st column
Column name
Index column
Output data
Title of index column
Fixed string: INDEX
Title of data column
Output format: 'DATE:' Hold trigger occurrence time
2nd column and later Data column
'I/O:' XY address No. to acquire logging data
'CH:' Target channel
'CYCLE:' Logging cycle
(Fixed string is displayed in ' ')
Last column
Trigger ON information column
Title of trigger occurrence information column
Fixed string: Trigger
Data row
For a historical trend window, data are output in the order that the data are stored to a data logging file.
Column number
1st column
Column name
Index column*1
13
Output data
Value of index
Output format: Integer value
Value of sampled device
2nd column and later Data column
Output format: Value corresponds to the type in the data
type information row
Last column
*1 :
Trigger ON information column
Information at trigger occurrence
For Q/L Series Analog Module, the index is not output in a logging file. When saving the data in CSV file, the
index is output with continuous numbers from 1 automatically.
195
13.2 Saving Displayed Data
13.2.1 Saving displayed data to CSV file
The CSV file format explained in this section differs from the CSV file format obtained from Q/L Series Analog Module. For
module CSV file format, refer to the user's manual of each module.
(e) Energy Measuring Unit
Format specification
The following explains the format specification of CSV files.
Item
Description
Delimiter
, (comma)
Linefeed code
CRLF(0x0D,0x0A)
Character code
ASCII
Number of rows
Maximum number of rows: 3603 rows (data rows +3)
Output data of rows/columns
The following is an example of output data of rows/columns.
File information row
Data type information row
Data name row
Data row
File information row
The file information row outputs information related to files.
Column number
Column name
1st column
File Type
2nd column
File version
3rd column
Row number of data type information row
4th column
Row number of data name row
Output data
File type of output file
Fixed value: [LOGGING]
Version of output file
Fixed value: YM_1*1
Number indicating the data type information row
Fixed value: 2
Starting number of data rows
With comment row:
Fixed value: 3
5th column
*1 :
196
Starting row number of data rows
Starting number of data rows
Fixed value: 4
(Product type)_(Version number) is displayed at the File version column.
CHAPTER 13 SAVING DISPLAYED DATA/EVENTS
Data type information row
The data type information row outputs data types of each column.
Column number
Column name
1st column
Date and time column*1
2nd column
Microsecond column*1
3rd column
Index column
Output data
Data type of date and time
Fixed string: DATETIME[YYYY/MM/DD hh:mm:ss]
Data type of microsecond of date and time
Fixed string: us]
Index column
Fixed string: INDEX
Data type of sampled data
4th column and later
Data column
Output format: Data type output string [Additional
information]
Page 201, (2)(g) in this section
Fixed string regardless of continuous logging/trigger logging
Last column
Trigger ON information column
Output format: TRIGGER[(trigger ON string); (trigger OFF
13
string)]*2
*1 :
*2 :
When the data, whose Date and time column is set not to output by the configuration tool, is saved to a CSV
file, the Date and time column and the Millisecond column are not output.
On a historical trend window opened with a CSV file, a trigger ON string and trigger OFF string are displayed
according to the information in the file. On a historical trend window opened with a binary file and a realtime
trend window, a trigger ON string = '*' and a trigger OFF string = '-' are displayed.
Data name row
Column number
Column name
Output data
Title of date and time column
Fixed string: TIME
1st column
Date and time column*1
2nd column
Microsecond column*1
3rd column
Index column
Title of index column
Fixed string: INDEX
4th column and later
Data column
Title of data column
Output format: Data name
Last column
Trigger ON information column
Title of trigger column
Fixed string: Trigger
*2 :
Fixed string: usec*2
When the data, whose Date and time column is set not to output by the configuration tool, is saved to a CSV
file, the Date and time column and the Millisecond column are not output.
When the data, whose Date and time column is set to output and Microsecond column is set not to output, is
saved to a CSV file, the Microsecond column is output.
197
13.2 Saving Displayed Data
13.2.1 Saving displayed data to CSV file
*1 :
Title of microsecond column
Data row
For a historical trend window, data are output in the order that the data are stored to a data logging file.
For a realtime trend window, data are output in the order that the data are received.
Column number
Column name
Output data
Date and time information
1st column
Date and time column*1
2nd column
Microsecond column*1
3rd column
Index column*2
4th column and later
Data column
Output format: Value corresponds to the type in the data
Last column
Trigger ON information column
— (Blank)
Output format: YYYY/MM/DD hh:mm:ss
Data type of data sampling interval column
Fixed value: 0
Index value
Output format: Integer value
Value of sampled device
type information row
*1 :
*2 :
When the data, whose Date and time column is set not to output, is saved to a CSV file, the Date and time
column and the Microsecond column are not output.
When the data, whose indexes are set not to output, is saved to a CSV file, the indexes with starting from 1 are
automatically output.
The CSV format explains in this section and acquired from the Energy Measuring Unit differs.
For the CSV file format of Energy Measuring Unit, refer to the manual of Energy Measuring Unit.
198
CHAPTER 13 SAVING DISPLAYED DATA/EVENTS
(f) Sampling trace
Format specification
The following explains the format specification of CSV files.
Item
Description
Delimiter
, (comma)
Linefeed code
CRLF(0x0D,0x0A)
Character code
ASCII
Number of rows
Maximum number of rows:8196 rows (data rows +4)
Output data of rows/columns
The following is an example of output data of rows/columns.
File information row
13
Data type information row
Data name row
Data row
File information row
The file information row outputs information related to files.
Column number
Column name
1st column
File Type
2nd column
File version
Output data
File type of output file
Fixed value: [LOGGING]
Version of output file
SamplingTrace_(Version information)
(Example)SamplingTrace_1
3rd column
Row number of data type information row
Fixed value:
With comment row: 3
Without comment row: 2
Number indicating the data name row
4th column
Row number of data name row
Fixed value:
With comment row: 4
Without comment row: 3
Starting number of data rows
5th column
Starting row number of data rows
With comment row: 5
Without comment row: 4
6th column
*1 :
Row number of comment row*1
Number indicating the comment row
Fixed value: 2
Data in this column are not output if data in the comment row are not output to logging data.
199
13.2 Saving Displayed Data
13.2.1 Saving displayed data to CSV file
Number indicating the data type information row
Data type information row
The data type information row outputs data types of each column.
Column number
1st column
2nd column and
later
Index column
Output data
Index column
Fixed string: INDEX
Data type of sampled data
Data column
Output format: Data type output string [Additional information]
Page 201, (2)(g) in this section
Last column
*1 :
Column name
Trigger ON information column
Fixed string: TRIGGER[(trigger ON string)]*1
'*' is output to 'trigger ON string'.
Data name row
Column number
1st column
Column name
Index column
Output data
Title of index column
Fixed string: INDEX
2nd column and later Data column
Title of data column
Device or device comment
Last column
Title of trigger occurrence information column
Fixed string: Trigger
Trigger ON information column
Data row
Column number
1st column
Column name
Index column*1
Output data
Value of index
Output format: Integer value
Value of sampled device
2nd column and later Data column
Output format: Value corresponds to the type in the data
Last column
Information at trigger occurrence
type information row
*1 :
200
Trigger ON information column
When saving the data in CSV file which is not output the index information, the index is output with continuous
numbers from 1 automatically.
CHAPTER 13 SAVING DISPLAYED DATA/EVENTS
(g) Data type output string
The following explains the data type output string to be output to "Data row".
Data type
Data type output string
Output data
Bit
BIT
BIT[(ON string);(OFF string)]*1
Word [unsigned]
USHORT
USHORT[DEC.0]
Word [signed]
SHORT
SHORT[DEC.0]
Double word [unsigned]
ULONG
ULONG ULONG[DEC.0]
Double word [signed]
LONG
LONG LONG[DEC.0]
FLOAT (Single Precision)
FLOAT
FLOAT[DEC.7]*2
FLOAT (Double Precision)
DOUBLE
DOUBLE[DEC.14]*2
16bit BCD*3
BCD16
BCD16[DEC.0]
32bit BCD*3
BCD32
BCD32[DEC.0]
*1 :
*2 :
*3 :
13
historical trend window opened with a CSV file, a ON string and OFF string are displayed according to the
information in the file. On a historical trend window opened with a binary file and a realtime trend window,
a ON string = '1' and a OFF string = '0' are displayed.
The number of digits after decimal point indicates the maximum number of digits, therefore all of the
specified number of digits are not always displayed. (For High Speed Data Logger Module only)
(Example) For 1.2345, '1.2345' is output, not '1.2345000'.
Supported by High Speed Data Logger Module only.
13.2 Saving Displayed Data
13.2.1 Saving displayed data to CSV file
201
13.2.2
Saving displayed trend graphs to image file
A captured image of the active trend window is saved to a file.
Operating procedure
1.
2.
3.
[File] B [Save As] B [Save Image File] (
)
Select a file format (BMP/JPG/PNG) to be used from "Save as type".
Specify "File name" and click the
button.
(1) Range of data to be saved
When the
button is clicked, the image of active trend window is saved.
Data to be saved
202
CHAPTER 13 SAVING DISPLAYED DATA/EVENTS
13.3
Saving Displayed Events
Events displayed on the active historical event window and realtime event window are saved to either following file.
• CSV file
• Image file
13.3.1
Saving displayed events to CSV file
Displayed events in the event list of active event window are saved to a CSV file.
When saving historical events, event logging names and comments are saved in a selected language.
13
Operating procedure
1.
2.
[File] B [Save As] B [Save CSV File] (
Enter a file name and click the
)
button.
(1) Data to be saved
(a) For Historical event
Events of an event logging file(s) being displayed are saved.
(b) For Realtime event
Events received from the start of monitoring to the click of the
button are saved.
13.3 Saving Displayed Events
13.3.1 Saving displayed events to CSV file
(2) Format specification of CSV file
The following explains the format specification of CSV files.
Item
Description
Delimiter
, (comma)
Linefeed code
CRLF(0x0D,0x0A)
Character code
ASCII
Number of rows
Maximum 200003 rows (Data rows + 3)
(a) Output data of rows/columns
The following is an example of output data of rows/columns.
File information row
Data type information row
Data name row
Data rows
203
(b) File information row
Column number
Column name
1st column
File Type
2nd column
File version
3rd column
4th column
5th column
Row number of data type
information row
Row number of data
name row
Output data
File type of output file
Fixed value: [EVENT]
Version of output file
Fixed value: 1
Number indicating the data type
information row
Fixed value: 2
Number indicating the data
name row
Fixed value: 3
Starting row number of
Starting number of data rows
data rows
Fixed value: 4
(c) Data type information row
Column number
Column name
Output data
Data type of date and time
1st column
Date and time column
Fixed string: DATETIME[YYYY/MM/DD
hh:mm:ss]
2nd column
Microsecond column
Data type of microsecond of date and time
Fixed string: [us]
3rd column
No. column
Data type of No.
Fixed string: SHORT[DEC.0]
4th column
Event logging name column
5th column
Occurrence status column
6th column
Occurrence comment column
7th column
*1 :
204
Data type of event logging name
Fixed string: STRING[64]*1
Data type of occurrence status
Fixed string: SHORT[DEC.0]
Data type of occurrence comment
Fixed string: STRING[64]*1
Occurrence condition value
Data type of occurrence condition value
column
Fixed string: STRING[4623]*1
A number enclosed with [ ] indicates the maximum number of characters (unit: byte)
CHAPTER 13 SAVING DISPLAYED DATA/EVENTS
(d) Data name row
Column number
Column name
1st column
Date and time column
2nd column
Microsecond column
3rd column
No. column
4th column
Event logging name column
5th column
Occurrence status column
6th column
Occurrence comment column
7th column
Output data
Title of the date and time column
Fixed string: TIME
Title of the microsecond column
Fixed string: usec
Title of the No. column
Fixed string: NUMBER
Title of the event logging column
Fixed string: EVENT
Title of the occurrence status column
Fixed string: STATUS
Title of the occurrence comment column
13
Fixed string: COMMENT
Occurrence condition value
Title of the occurrence condition value
column
Fixed string: VALUES
(e) Data row
For a historical event window, data are output in the order that the data are stored to a event logging file.
For a realtime event window, data are output in the order that the data are received.
The CSV file format explained in this section differs from the CSV file format obtained from LCPU or High Speed Data
Logger Module. For module CSV file format, refer to the following manual.
High Speed Data Logger Module User's Manual
13.3 Saving Displayed Events
13.3.1 Saving displayed events to CSV file
205
13.3.2
Saving displayed events to image file
A captured image of the active event window is saved to a file.
Operating procedure
1.
2.
3.
[File] B [Save As] B [Save Image File] (
)
Select a file format (BMP/JPG/PNG) to be used from "Save as type".
Specify "File name" and click the
button.
(1) Range of data to be saved
When the
button is clicked, the image of an active event window is saved.
Data to be saved
206
CHAPTER 14 PRINTING TREND GRAPHS
CHAPTER 14 PRINTING TREND GRAPHS
QnUDVCPU High Speed Data Logger High Speed Data Communication
14.1
Q Analog
LCPU
L Analog
Overview
This function prints a trend graph on the screen while a realtime trend graph or historical trend graph is being
displayed.
It prints a graph area and graph legend area displayed on an active trend window.
Information such as connection target, data logging name, cursor time can be also printed in a header or footer.
14
14.1 Overview
Print
207
14.2
Flow of Print
The following figure shows the flow of printing a trend graph.
Start
Display the "Print" screen.
(Select [File]
[Print](
))
Configure settings as needed.
Setting of color and margin
Setting of printer
Setting of header/footer
Setting of graph legends
to be output
Page 209, Section 14.3.1
Page 210, Section 14.3.2
Page 211, Section 14.3.3
Perform on operation as needed
Check an output image. (Preview screen)
(Click the
button.)
Page 213, Section 14.4
Execute print.
(Click the
button.)
Complete
14.3
Setting Print Configuration
The following settings can be configured on the Print screen.
• Setting of color and margin ( Page 209, Section 14.3.1)
• Setting of printer ( Page 210, Section 14.3.2)
• Setting of header/footer ( Page 211, Section 14.3.3)
• Output setting of graph legends ( Page 212, Section 14.3.4)
208
Page 212, Section 14.3.4
CHAPTER 14 PRINTING TREND GRAPHS
14.3.1
Setting color and margin
Set the print color and margin on the <<Print Setup>> tab of the Print screen.
Screen display
[File] B [Print] (
)
14
Operating procedure
1.
Set the items on the screen.
Item
button
Color Print
Reference
Displays the screen for the printer setting.
Page 210, Section 14.3.2
Select the color mode at time of printing.
-
Select this to print graphs with the colors displayed in the
graph legend area and graph area.
14.3 Setting Print Configuration
14.3.1 Setting color and margin
Color
Description
-
Select this to print graphs and characters in black and
Monochrome Print
background in white.
-
(Highlighted area is printed in gray.)
Check this to print: characters and lines on the graph legend
Reverse Color
area and graphs, and background color, with their colors
-
reversed.*1
Margin [mm]
Specify the print margin.
-
Top
Specify a top margin.
-
Bottom
Specify a bottom margin.
-
Left
Specify a left margin.
-
Right
Specify a right margin.
-
*1 :
2.
Colors are replaced with complementary colors. For example, red is replaced with cyan, blue is replaced with
yellow, and green is replaced with magenta.
Click the
button and check the print preview.
Page 213, Section 14.4 Checking Print Preview
209
14.3.2
Setting printer
Specify a printer to execute the print and number of prints.
Screen display
Click the
button on the <<Print Setup>> tab of the Print screen.
Operating procedure
1.
Set the items on the screen.
Item
Description
Printer
Displays information of a printer device.
Name
Specify a printer to be used.
button
2.
210
Configure the setting for the specified printer.
Print range
Specify the range to be printed.
Copies
Specify the number of copies.
Click the
button.
CHAPTER 14 PRINTING TREND GRAPHS
14.3.3
Setting header/footer
Set the print header and footer on the <<Header/Footer>> tab of the Print screen.
Screen display
Click the <<Header/Footer>> tab.
14
Operating procedure
1.
Set the items on the screen.
Item
Description
Check this to print the following items in a header.
• Connection target
Print a header
• Data logging name (For Realtime trend)
14.3 Setting Print Configuration
14.3.3 Setting header/footer
• Logging file name (For Historical trend)
• Printed time
Check this to print the following items in a footer.
Print a footer
• Cursor time
• Cursor value
• Multiple cursor information (only when the multiple cursor is displayed)
2.
Click the
button and check the print preview.
Page 213, Section 14.4 Checking Print Preview
211
14.3.4
Setting graph legend output
Set the output contents of graph legends on the <<Legends>> tab of the Print screen.
Screen display
Click the <<Legends>> tab.
Operating procedure
1.
Set the items on the screen.
Item
Description
Print a graph legend
2.
Check this to print graph legends.
Data Name, Cursor Value
Select this to print data name and cursor value.
Data Name, Cursor Value, Upper/
Select this to print data name, cursor value, and upper/lower limit display
Lower Bound
value.
Click the
button and check the print preview.
Page 213, Section 14.4 Checking Print Preview
212
CHAPTER 14 PRINTING TREND GRAPHS
14.4
Checking Print Preview
Check output images on the Print Preview screen.
Screen display
Click the
button on the Print screen.
Header information
Graph area
Graph legends
14
Footer information
Operating procedure
Check the output data on the Print Preview screen.
Item
Graph legends
Displays the header information if "Print a header" is checked on the <<Header/Footer>> tab
of the Print screen.
Displays information of the graph legends specified on the <<Legends>> tab of the Print
screen.
Displays the graph area of Historical trend or Realtime trend.
Graph area
Displays the sampling start time at a lower left, plot display format at a lower center, and
sampling end time at a lower right.
Footer information
Displays the footer information if "Print a footer" is checked on the <<Header/Footer>> tab of
the Print screen.
Screen button
Item
Description
button
Prints contents being displayed on the Print Preview screen.
button
Closes the screen.
213
14.4 Checking Print Preview
Header information
Description
CHAPTER 15 HELP MENU
QnUDVCPU High Speed Data Logger High Speed Data Communication
15.1
Opening Manual
This function opens the operating manual of GX LogViewer.
Operating procedure
15.2
[Help] B [Open Manual]
Version Information
This function displays the version information of GX LogViewer.
Operating procedure
[Help] B [About GX LogViewer]
214
Q Analog
LCPU
L Analog
CHAPTER 16 TROUBLESHOOTING
CHAPTER 16 TROUBLESHOOTING
This chapter explains the errors which may occur when using GX LogViewer, and corrective actions correspond to
those errors.
QnUDVCPU High Speed Data Logger High Speed Data Communication
Symptom
Cannot communicate with
the module.
(Cannot operate online)
Check point
Q Analog
LCPU
L Analog
Corrective action
Is there a disconnection along the connection route?
• Connect the cables properly.
• Replace the cable with new one.
Is the IP address duplicated?
• Correct the IP address.
Does a firewall or proxy server exist along the
connection route?
• Ask your network administrator about the
firewall and proxy server settings.
Is Windows firewall enabled on the personal
computer?
• Disable Windows firewall on the personal
computer when using the module search
function or direct connection.
Is antivirus software blocking Ethernet
communications?
• Change the antivirus software settings to allow
Ethernet communications.
• Lower the antivirus software's security setting
level.
• Stop the antivirus software.
Is there any problem on the personal computer?
• Replace it with another personal computer.
Are the authorities of the user logged on to
Windows® sufficient?
• For Windows® XP, logon as a user with a
'limited' or higher user account.
• For Windows Vista®, Windows® 7, and
Windows® 8 logon as a user with a 'standard'
or higher user account.
Are multiple IP addresses enabled at the same
time on the personal computer side?
• For a direct connection, make sure multiple IP
addresses are not enabled at the same time on
the personal computer.
• For a direct connection, enable the wireless
LAN function.
Is Direct Connection specified for Transfer Setup of
High Speed Data Logger Module and High Speed
Data Communication Module?
• For a direct connection, connect a High Speed
Data Logger Module, High Speed Data
Communication Module, and a personal
computer one to one.
Page 25, Section 2.3.3
Is the logging file with only header line displayed?
• After outputting the data, open the storage file.
Is the logging file corrupted?
• Check the file.
A dashed-dotted line is
displayed.
Has missing data occurred?
Page 149, Section 9.11
• Correct the data logging setting on the
configuration tool to prevent the occurrence of
missing data.
A dashed-dotted line is
displayed on the realtime
trend window.
Is logging of data displayed on the realtime trend
window stopped because the number of saved files
exceeded?
• Delete the unnecessary saved files using the
configuration tool, and restart the data logging.
Is Ethernet connected?
• The TCP connection is recommended for the
Ethernet connection since a longer processing
time is required for "Open Logging File" or
"Save Logging File to PC" function when using
the Ethernet direct connection or the UDP
connection.
An error message is
displayed when opening a
logging file.
A process of "Open Logging
File" or "Save Logging File to
PC" function is slow.
When an abnormality exists in a module, functions of GX LogViewer may not be performed normally.
For details of troubleshooting, refer to the user's manual of each CPU.
215
16
APPENDIX
Appendix 1
USB Driver Installation
In order to communicate with a programmable controller CPU via USB, a USB driver needs to be installed.
The following explains the USB driver installation procedure for Windows® XP, Windows Vista®, Windows® 7, or
Windows® 8.
When two or more MELSOFT products are installed, the USB driver is installed in the folder to which the first MELSOFT
product is installed. This section explains using the USB driver installation destination folder: C:\Program Files\
MELSOFT\Easysocket\USBdrivers, as an example.
(1) Windows® XP
The following explains the procedure of USB driver installation for Windows® XP.
Operating procedure
1.
Connect the personal computer and the
programmable controller CPU with USB cable, and
then turn on the programmable controller CPU.
→ The screen shown on the left is displayed.
2.
Select "Install from a list or specific location
[Advanced]" and click the
3.
button.
Select "Search for the best driver in these
locations", and check "Include this location in the
search".
4.
To the next page
216
Click the
button.
APPENDIX
A
From the previous page
5.
Select the USB driver installation destination folder,
select [Easysocket] → [USBDrivers], and click the
button.
6.
Select "MITSUBISHI Easysocket Driver", and click
the
Click the
Appendix 1 USB Driver Installation
7.
button.
button.
The screen shown on the left is displayed and the USB
driver installation is complete.
8.
Click the
button to close the window.
Installation complete
217
If the USB driver cannot be installed, confirm the following settings.
If "Block - Never install unsigned driver software" is selected under [Control Panel] - [System] - [Hardware] - [Driver Signing],
the USB driver may not be installed.
Select "Ignore - Install the software anyway and don't ask for my approval", or "Warn - Prompt me each time to choose an
action" in [Driver Signing], and execute the USB driver installation.
218
APPENDIX
A
(2) Windows Vista®
The following explains the procedure of USB driver installation for Windows Vista®.
Operating procedure
1.
Connect the personal computer and the
programmable controller CPU with USB cable, and
then turn on the programmable controller CPU.
→ The screen shown on the left is displayed.
2.
Select "Locate and install driver software
(recommended)" and wait for a search to finish.
3.
When User Account Control is turned ON, the
screen shown on the left is displayed. Click the
button.
Select "Browse my computer for driver software
(advanced)".
To the next page
219
Appendix 1 USB Driver Installation
4.
From the previous page
5.
Specify "Easysocket\USBdrivers", and click the
button.
6.
Select "Install this driver software anyway".
The screen shown on the left is displayed, and the USB
driver installation is complete.
7.
Installation complete
220
Click the
button.
APPENDIX
A
(3) Windows® 7 and Windows® 8
The following explains the procedure of USB driver installation for Windows® 7 and Windows® 8.
Operating procedure
1.
Connect the personal computer and the
programmable controller CPU with USB cable, and
then turn on the programmable controller CPU.
<When using Windows® 7>
→ The screen shown on the left is displayed.
<When using Windows® 8>
→ The screen shown on the left is not displayed.
2.
Select "System and Security" from the Control
Panel.
(To display the Control Panel, select [Start]
→ [Control Panel].)
Appendix 1 USB Driver Installation
3.
Select "Administrative Tools".
To the next page
221
From the previous page
4.
Select "Computer Management" and double-click it.
5.
Right click "Unknown device" in Device Manager,
and select "Update Driver Software".
If multiple "Unknown devices" exist therefore cannot be
specified, right-click "Unknown device" and select
"Properties". The "Unknown device", whose "Hardware
Ids" is "USB\VID_06D3&PID_1800" on the <<Details>>
tab of the properties screen, is the update target.
To the next page
222
APPENDIX
A
From the previous page
6.
Select "Browse my computer for driver software".
7.
Specify "Easysocket\USBdrivers", and click the
button.
Click the
Appendix 1 USB Driver Installation
8.
button.
To the next page
223
From the previous page
9.
Click the
button.
10. "MITSUBISHI Easysocket Driver" is registered
under "Universal Serial Bus controllers".
Installation complete
224
APPENDIX
Appendix 2
Added and Changed Functions
A
The following are added and changed functions in GX LogViewer and applicable software version.
Added/Changed function
Applicable
software version
Reference
Display of data which contains the following language is supported.
• Chinese Simplified
• English
1.04E or later
Page 137, Section 9.6.6
Page 166, Section 10.4.3
• Japanese
Display of data which contains the following language and character code is
supported.
• Chinese Traditional
Page 56, Section 6.3
1.07H or later
• Korean
Page 137, Section 9.6.6
Page 166, Section 10.4.3
• Unicode (UTF-8)
The jump cursor function can be executed by searching value.
1.10L or later
Display of data logged by the following modules is supported.
• MELSEC-Q High Speed Analog-Digital Converter Module (Q64ADH)
Page 117, Section 9.5.4 (1)
Page 18, CHAPTER 2
• MELSEC-Q Current Transformer Input Module (Q68CT)
• MELSEC-L Analog-Digital Converter Module (L60AD4)
Display of time scale label is supported.
1.18U or later
Page 137, Section 9.6.5
The automatic reflection of the graph display setting when displayed trend
window is supported.
Page 148, Section 9.9
Initializing graph display of the trend graph being displayed is supported.
Page 148, Section 9.10
Expand the maximum display point of the trend graph on one screen from
Page 184, Section 13.2.1
65535 to 100000, and the maximum save number of lines to the CSV file
The plot format of the historical trend graph being displayed can be changed
from equidistance plot format, which is conventional display format, to time
Page 136, Section 9.6.4
interval plot format.
When displaying with time interval plot format, logging data of another file
Page 108, Section 9.4.2
can be added to the trend graph being displayed.
When displaying multiple file logging data on the trend graph, the graph can
1.26C or later
be moved to left or right.
Display of GX LogViewer format sampling trace data saved with GX Works2
Page 127, Section 9.5.7
Page 51, Section 5.5
Version 1.91V or later is supported.
Display of data logged by the following modules is supported.
• QCPU (Q03UDVCPU, Q04UDVCPU, Q06UDVCPU, Q13UDVCPU,
Q26UDVCPU)
-
• LCPU (L06CPU, L26CPU)
• MELSEC-L Analog-Digital Converter Module (L60AD4-2GH)
Page 32, Section 4.2
Windows®8 is supported.
Page 216, Appendix 1
The transparent function of GOT2000 is supported.
Display of data logged by the following modules is supported.
• LCPU (L06CPU-P, L26CPU-P)
• MELSEC-L Analog Input/Output Module (L60AD2DA2)
Page 22, Section 2.2.2 (3)
1.32J or later
-
• High Speed Data Communication Module (QJ71DC96)
• Logging Unit for Energy Measuring Unit (EcoMonitorLight) (EMU4-LM)
225
Appendix 2 Added and Changed Functions
from 131073 to 200003 (data row+3).
Appendix 3
Usable Characters
This section shows the characters which can be used in the setting items.
Appendix 3.1
Usable ASCII characters
The shaded portion can be used.
If entering of unusable characters is attempted, they cannot be entered in the entry field or there will be an error after
entering them.
0
0
1
2
NULL
(SP)
*1
3
4
5
6
7
0
@
P
`
p
1
!
1
A
Q
a
q
2
“
2
B
R
b
r
3
#
3
C
S
c
s
4
$
4
D
T
d
t
5
%
5
E
U
e
u
6
&
6
F
V
f
v
7
‘
7
G
W
g
w
8
(
8
H
X
h
x
9
)
9
I
Y
i
y
A
*
:
J
Z
j
z
B
+
;
K
[
k
{
C
,
<
L
\
l
|
D
-
=
M
]
m
}
E
.
>
N
^
n
~
F
/
?
O
_
o
The following table shows the usable characters for the specific settings.
Corresponding ASCII character
Settings
Location
(SP)
*1
"
'
*
+
,
/
:
;
<
>
?
[
\
]
|
.
Directory
Logging File Save
Function
¯
¯
{
¯
¯
¯
{
¯
¯
¯
¯
¯
{
¯
{
¯
{
Menu name to be
added
Frequently-Used Window
Configurations
{
¯
{
¯
{
{
¯
¯
{
¯
¯
¯
{
¯
{
¯
{
{: Usable ¯: Not usable
*1 :
226
(SP) indicates a space.
APPENDIX
Appendix 3.2
Characters usable in file names, folder (directory)
names
A
The shaded portion can be used.
0
2
3
4
5
6
7
0
@
P
`
p
!
1
A
Q
a
q
2
“
2
B
R
b
r
3
#
3
C
S
c
s
4
$
4
D
T
d
t
5
%
5
E
U
e
u
6
&
6
F
V
f
v
7
‘
7
G
W
g
w
8
(
8
H
X
h
x
9
)
9
I
Y
i
y
A
*
:
J
Z
j
z
B
+
;
K
[
k
{
0
1
*1 :
1
NULL
(SP)
*1
C
,
<
L
\
l
|
D
-
=
M
]
m
}
E
.
>
N
^
n
~
F
/
?
O
_
o
(SP) indicates a space.
Appendix 3 Usable Characters
Appendix 3.2 Characters usable in file names, folder (directory) names
227
Appendix 4
PING Test
This section shows the example for checking the connection by issuing the PING command to the module from an
external device (DOS/V personal computer) connected on the same Ethernet network (LAN).
(Example of checking the connection of the High Speed Data Logger Module/the High Speed Data Communication
Module with an external device on the same network address)
Operating procedure
1.
Select [Start] B [Run] on the Windows menu, enter 'cmd' and click the
2.
Using the keyboard, enter the IP address of the High Speed Data Logger Module/the High Speed
button.
Data Communication Module after 'ping'.
Example
>ping 192.168.3.3
3.
Check the output result.
(a) When the communication was successful
>ping 192.168.3.3
Pinging 192.168.3.3 with 32 bytes of data:
Reply from 192.168.3.3: bytes=32 time<1ms TTL=128
Reply from 192.168.3.3: bytes=32 time<1ms TTL=128
Reply from 192.168.3.3 bytes=32 time<1ms TTL=128
Reply from 192.168.3.3: bytes=32 time<1ms TTL=128
Ping statistics for 192.168.3.3:
Packets: Sent = 4, Received = 4, Lost = 0 (0% loss),
Approximate round trip times in milli-seconds:
Minimum = 0ms, Maximum = 0ms, Average = 0ms
(b) When the communication was unsuccessful
>ping 192.168.3.3
Pinging 192.168.3.3 with 32 bytes of data:
Request timed out.
Request timed out.
Request timed out.
Request timed out.
Ping statistics for 192.168.3.3:
Packets: Sent = 4, Received = 0, Lost = 4 (100% loss),
When the communication was unsuccessful, check the following items and perform the PING test again.
• Network settings for the High Speed Data Logger Module/the High Speed Data Communication Module or
external device
• Cables, hub connection status, power status
The PING test is only valid when the transfer setup method is "Connection via hub".
It is invalid when the transfer setup method is "Direct Connection".
228
INDEX
Multiple cursor . . . . . . . . . . . . . . . . . . . . . . . . . . 134
A
ASSISTANT FUNCTION . . . . . . . . . . . . . . . . . . . . 64
I
N
NaN . . . . . . . . . . . . . . . . . . . . . . . . . . . . . . . . . 151
next events . . . . . . . . . . . . . . . . . . . . . . . . . . . . 169
next graph . . . . . . . . . . . . . . . . . . . . . . . . . . . . . 132
B
Blue cursor . . . . . . . . . . . . . . . . . . . . . . . . . . . . . 134
Boards . . . . . . . . . . . . . . . . . . . . . . . . . . . . . . . . . 23
P
C
color . . . . . . . .
Connect via hub
CSV file . . . . . .
cursor labels . . .
cursors . . . . . .
. . . . . . . . . . . . . . . . . . . . . 138,171
. . . . . . . . . . . . . . . . . . . . . . . . . . 25
. . . . . . . . . . . . . . . . . . . . . 184,203
. . . . . . . . . . . . . . . . . . . . . . . . . 135
. . . . . . . . . . . . . . . . . . . . . . . . . 106
3
4
previous events . . . . . . . . . . . . . . . . . . . . . . . . . 167
previous graph . . . . . . . . . . . . . . . . . . . . . . . . . . 130
Print . . . . . . . . . . . . . . . . . . . . . . . . . . . . . . . . . 207
R
Realtime event . . . . . . . . . . . . . . . . . . . . . . . . . . 161
Realtime trend . . . . . . . . . . . . . . . . . . . . . . . . . . 101
D
Difference information area . . . . . . . . . . . . . . . . . . 93
Direct Connection . . . . . . . . . . . . . . . . . 25,74,82,86
S
Sampling trace data
Save . . . . . . . . . . .
Set Language. . . . .
Sort . . . . . . . . . . . .
Status bar . . . . . . .
E
Equidistance plot . . . . . . . . . . . . . . . . . . . . . . . . 136
Event Properties . . . . . . . . . . . . . . . . . . . . . . . . . 171
F
7
. . . . . . . . . . . . . . . . . . . . . . . 51
. . . . . . . . . . . . . . . . . . . . . . 174
. . . . . . . . . . . . . . . . . . 137,166
. . . . . . . . . . . . . . . . . . . . . . 165
. . . . . . . . . . . . . . . . . . . 95,157
T
Filtering . . . . . . . . . . . . . . . . . . . . . . . . . . . . . . . 163
Time interval plot
Time Label . . . . .
time scale labels .
Transfer Setup . .
G
Graph area . . . . . . . . . . . .
Graph Legend Area . . . . . .
Graph Properties . . . . . . .
Graphical Display Settings .
. . . . . . . . . . . . . . . . . . 92
. . . . . . . . . . . . . . 91,108
. . . . . . . . . . . . . . . . . 138
. . . . . . . . . . . . . . . . . 144
. . . . . . . . . . . . . . . . . . . . . . . . 136
. . . . . . . . . . . . . . . . . . . . . . . . 137
. . . . . . . . . . . . . . . . . . . . . . . . 137
. . . . . . . . . . . . . . . . . . . . . . 74,83
U
Upper/lower limit display value . . . . . . . . . . . . . . . 123
USB Driver. . . . . . . . . . . . . . . . . . . . . . . . . . . . . 216
H
Historical event . . . . . . . . . . . . . . . . . . . . . . . . . . 158
Historical trend . . . . . . . . . . . . . . . . . . . . . . . . . . . 96
I
image file . . .
Index . . . . . .
Inf . . . . . . . .
IP Address . .
. . . . . . . . . . . . . . . . . . . . . . . 202,206
. . . . . . . . . . . . . . . . . . . . . . . . 94,137
. . . . . . . . . . . . . . . . . . . . . . . . . . . 151
. . . . . . . . . . . . . . . . . . . . . . . 76,79,83
J
Jump cursor . . . . . . . . . . . . . . . . . . . . . . . . . . . . 116
M
Missing Data . . . . . . . . . . . . . . . . . . . . . . . . . . . 149
229
8
REVISIONS
*The manual number is given on the bottom left of the back cover.
Print date
*Manual number
Jan., 2010
SH-080915ENG-A
Revision
First edition
Addition
Section 9.6.5, Section 9.7.1 to 9.7.3, Section 10.4.3, Appendix 2
Partial correction
Section 2.1, Section 2.2, Section 2.4, Chapter 3, Section 4.2.1, Section 4.2.2, Section 4.3,
Section 4.3.1, Section 4.3.2, Section 5.1.1 to 5.1.3, Section 6.2, Section 6.3, Section 7.2,
Section 8.1, Chapter 9, Section 9.1, Section 9.2.2, Section 9.3, Section 9.3.1 to 9.3.3,
Section 9.4.1, Section 9.5, Section 9.5.4, Section 9.5.6, Section 9.6, Section 9.6.1,
Section 9.6.2, Section 9.6.4, Section 9.8, Section 9.9, Chapter 10, Section 10.1,
Section 10.3, Section 10.3.1 to 10.3.3, Section 10.4, Section 10.5, Chapter 11, Chapter 12,
Aug., 2010
SH-080915ENG-B
Section 12.1 to 12.6, Chapter 13, Section 13.2, Section 13.2.1, Section 13.2.2,
Section 13.3, Section 13.3.1, Section 13.3.2, Chapter 14, Section 14.3,
Section 14.3.1 to 14.3.4, Chapter 15, Chapter 16, Appendix 1
Section 9.6 to 9.11 → Section 9.5 to 9.10,
Section 9.7.3 to 9.7.4 → Section 9.7.2 to 9.7.3,
Section 9.7.5 to 9.7.6 → Section 9.6.3 to 9.6.4,
Chapter 14 to 17 → Chapter 13 to 16, Section 10.4.1 → Section 10.4.2,
Section 10.4.2 → Section 10.4.1, Appendix 2 to 3 → Appendix 3 to 4
Delete
Section 9.5, Section 9.7.3, Section 9.7.4, Chapter 13
Partial correction
Sep., 2010
SH-080915ENG-C
GENERIC TERMS AND ABBREVIATIONS, Section 2.4, Section 4.2.1, Section 4.2.2,
Section 8.2.2, Chapter 14, Appendix 1, Appendix 2
Dec., 2010
SH-080915ENG-D
Partial correction
Section 2.4, Section 6.3, Section 9.6.5, Section 10.4.3, Appendix 2
The content of Section 2.4 Operating Environment is moved and stored with the files of the
installer.
[For English version software]
Apr., 2011
SH-080915ENG-E
Operating Environment for GX LogViewer Version 1 (English Version) (BCN-P5879)
[For Chinese version software]
*;/RJ9LHZHU9HUVLRQㅔԧЁ᭛⠜䖤㸠⦃๗%&13
Partial correction
Section 2.4, Section 6.3, Appendix 2
Addition
Section 2.1.3, Section 8.2.1, Section 8.3.1
Partial correction
TERMS, Chapter 2, Section 2.1.1, Section 2.2.1, Section 2.2.3, Chapter 3, Section 4.2.1,
Section 5.1.1 to 5.1.3, Section 5.2.1 to 5.2.3, Section 6.2 to 6.4, Section 7.1 to 7.2,
Section 8.1, Section 8.2.2, Section 8.3.3, Section 9.1, Section 9.2.1, Section 9.2.3,
Jul., 2011
SH-080915ENG-F
Section 9.2.5, Section 9.3.1, Section 9.5.4, Section 9.5.9, Section 10.1, Section 10.2.1,
Section 10.2.3, Chapter 11, Section 12.1, Section 13.2.1, Section 14.3.4, Appendix 2
Section 2.1 to Section 2.2 → Section 2.2 to Section 2.1,
Section 5.1 to Section 5.2 → Section 5.2 to Section 5.1,
Section 8.2 to Section 8.3 → Section 8.3 to Section 8.2
Delete
GENERIC TERMS AND ABBREVIATIONS, Section 1.1.1 to 1.1.3
230
Print date
*Manual number
Revision
Addition
Section 2.4, Section 9.8, Section 9.9, Section 9.10
Partial correction
TERMS, Section 1.1, Section 1.2, Chapter 2, Section 2.2.1 to Section 2.2.3, Section 2.4.1,
Chapter 3, Section 4.2.1, Chapter 5, Section 5.1, Section 5.1.1, Section 5.2,
Section 5.2.1 to Section 5.2.3, Section 6.2.3, Section 6.3, Section 7.1, Section 7.2,
Section 8.1, Section 9.1, Section 9.2.3,
Jan., 2012
SH-080915ENG-G
Section 9.2.5, Section 9.3.1, Section 9.5, Section 9.6, Section 9.6.4, Section 9.7,
Chapter 11, Chapter 12, Section 12.1 to Section 12.4, Section 13.2.1, Chapter 16,
Appendix 2
Section 2.4 → Section 2.1, Section 2.1 to Section 2.3 → Section 2.2 to Section 2.4,
Section 9.6.4 → Section 9.6.3, Section 9.6.3 → Section 9.6.4, Section 12.5 → Section 9.8,
Section 9.8 to Section 9.10 → Section 9.11 to Section 9.13
Delete
Section 12.6
Addition
Section 5.3, Section 7.2.1, Section 7.2.2, Section 9.6.4
Partial correction
TERMS, Section 1.1, Section 1.2, Chapter 2, Section 2.2.1, Chapter 2.3, Section 2.3.1,
Section 2.4, Section 2.4.1, Section 2.4.2, Section 2.4.3, Chapter 3, Section 4.3.2,
Chapter 5, Section 5.1.1, Section 5.2, Section 5.2.1, Section 6.1, Section 6.2, Section 6.3,
Feb., 2013
SH-080915ENG-H
Section 6.4, Section 7.1, Section 8.1, Section 9.1, Section 9.2.1, Section 9.2.2,
Section 9.2.4, Section 9.2.5, Section 9.3.1, Section 9.4, Section 9.4.1, Section 9.4.2,
Section 9.5, Section 9.5.4, Section 9.5.7, Section 9.5.9, Section 9.6, Section 9.7.1,
Section 9.8, Section 9.11, Section 10.1, Section 10.2.1, Section 10.3.1, Chapter 11,
Section 12.1, Section 12.2, Section 12.4, Section 13.2.1, Section 13.2.2, Section 13.3.1,
Section 13.3.2, Section 14.1, Section 14.4, Section 15.2, Appendix 2
Section 5.3 to Section 5.4 → Section 5.4 to Section 5.5
Section 9.6.4 to Section 9.6.5 → Section 9.6.5 to Section 9.6.6
Addition
Section 5.3, Section 5.4, Section 8.4
Partial correction
RELATED MANUALS, HOW TO READ THIS MANUAL, TERMS, Section 1.1, Chapter 2,
Section 2.1, Section 2.2, Section 2.2.2, Chapter 2.3, Section 2.3.1, Section 2.3.2,
Section 2.3.3, Section 2.4, Section 2.5, Chapter 3, Section 4.2, Section 4.2.1,
Section 4.2.2, Chapter 5, Section 5.1.1, Section 5.1.2, Section 5.1.3, Section 5.2.1,
Section 5.2.2, Section 5.2.3, , Section 5.6, Section 5.7, Chapter 6, Section 6.2, Section 6.3,
Oct., 2013
SH-080915ENG-I
Chapter 7, Section 7.1, Section 7.2.1, Section 7.2.2, Section 8.1, Section 8.2,
Section 8.2.1, Section 8.2.3, Section 8.3, Section 8.3.1, Section 8.3.2, Section 8.3.4,
Section 8.4, Section 8.4.1, Section 8.4.2, Section 8.4.4, Section 9.1, Section 9.2,
Section 9.2.5, Section 9.3.1, Section 9.3.2, Section 9.3.3, Section 9.4, Section 9.5,
Section 9.5.9, Section 9.6, Section 9.7, Section 9.8, Section 9.9, Section 9.10,
Section 9.11, Section 9.12, Section 9.13, Chapter 10, Chapter 11, Chapter 12, Chapter 13,
Section 13.1, Section 13.2.1, Chapter 14, Chapter 15, Chapter 16, Appendix 1,
Appendix 2, Appendix 4
Section 2.3 → Section 2.2
Section5.2 → Section 5.1
Japanese Manual Version SH-080887-M
This manual confers no industrial rights or any rights of any other kind, nor does it confer any patent licenses.
Mitsubishi Electric Corporation cannot be held responsible for any problems involving industrial property rights which may
occur as a result of using the contents noted in this manual.
© 2010 MITSUBISHI ELECTRIC CORPORATION
231
Microsoft, Windows, Windows NT, Windows Vista are registered trademarks of Microsoft Corporation in the United States
and other countries.
Ethernet is a trademark of Xerox Corporation.
CompactFlash is a registered trademark of SanDisk Corporation in the United States and
other countries.
The SD logo and the SDHC logo are trademarks.
All other company names and product names used in this manual are trademarks or
registered trademarks of their respective companies.
232