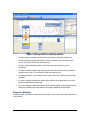
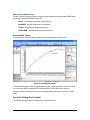
1
Dyno-Scan™ for Windows User Guide Warnings The exclamation point within the triangle is a warning sign alerting you of important instructions accompanying the product. Please observe all warnings. Do not operate the vehicle indoors. A running engine produces lethal carbon monoxide exhaust fumes that can seriously harm or kill you if inhaled. Only run the vehicle motor outdoors with proper ventilation. Many scan tool operations do not require a running motor. Do not attempt to operate or observe the scan tool while driving a vehicle. Driving requires the full attention of the driver. Operating or observing the scan tool will cause driver distraction and could cause a fatal accident. Ensure the PC, cable, and OBD II adapter do not interfere with the vehicle controls. A cable dangling in front of the foot pedals, gear shifter, or steering wheel can interfere with vehicle operation and cause a fatal accident. Always ensure the PC, cable, and OBD II adapter are securely fastened out of the way. If the scan tool and PC cannot be safely attached as to not interfere with the vehicle controls, then do not drive the vehicle with the OBD II adapter connected to the vehicle. Never race or exceed the posted speed limit while on public highways. The dynamometer operations require accelerating to high speeds. Always uses a closed course raceway when performing dynamometer and acceleration tests. ii Terms of Use The Software contains proprietary and confidential information that is protected by applicable intellectual property and other laws. You may not modify or sell works based on the Software. The Software is for your personal use. We grant you a personal and non-exclusive license to use the object code version of the Software on a single Windows-based personal computer; provided that you do not (and do not allow any third party to) copy, modify, reverse engineer, create derivative works from, assign or otherwise transfer any right in the Software; and you will not modify the Software by any means. Disclaimer The “Product” is the complete Dyno-Scan for Windows product including hardware, software, user manual, and packaging. Auterra, LLC assumes no responsibility for any loss or claim by third parties which arise through the use of this Product. Auterra, LLC assumes no responsibility for any damage or loss caused by deletion of data as a result of a Product malfunction. Be sure to backup copies of all important data on other media to protect against data loss. The Software, and all accompanying files, data and materials, are provided "as is" without warranty of any kind, either expressed or implied, including, but not limited to, the implied warranties of merchantability and fitness for a particular purpose. The entire risk as to the quality and performance of the Software is with you. Should the Software prove defective, you assume the cost of all necessary servicing, repair or correction. AUTERRA, OR ITS PRINCIPALS, SHAREHOLDERS, OFFICERS, EMPLOYEES, AFFILIATES, CONTRACTORS, SUBSIDIARIES, OR PARENT ORGANIZATIONS, SHALL NOT BE LIABLE FOR ANY INCIDENTAL, INDIRECT OR CONSEQUENTIAL DAMAGES OR OTHER DAMAGES INCLUDING BUT NOT LIMITED TO, LOSS OF PROFITS, LOSS OF REVENUE, LOSS OF DATA, LOSS OF USE OF THE PRODUCT OR ANY ASSOCIATED EQUIPMENT, DOWNTIME AND CONSUMER’S TIME OR FOR BREACH OF ANY EXPRESS OR IMPLIED WARRANTY OR CONDITION, DAMAGE TO THE VEHICLE, BREACH OF CONTRACT, NEGLIGENCE, STRICT LIABILITY OR ANY OTHER LEGAL THEORY RELATED TO THIS PRODUCT. Copyright 1998-2012 Auterra, LLC. All rights reserved. Trademarks Windows® is a registered trademark of Microsoft Corporation. Google and Google Earth are trademarks of Google Inc. iii Table of Contents Table of Contents Table of Contents i Preface 1 Key Features 1 Minimum Platform and Software Requirements 2 OBD II 2 OBD II Connector 2 Specifications 2 Supported Vehicles 3 Abbreviations 3 Abbreviations and Definitions 3 Installing Windows Software 6 Uninstall Previous Dyno-Scan for Windows 6 Software Installation (All Windows Versions) 6 USB Driver Installation 6 Windows Vista/7 USB Driver Installation 7 Windows XP USB Driver Installation 9 USB Driver Virtual COM Port 13 Bluetooth Driver Installation 14 Bluetooth Pairing 15 Windows XP 15 Windows Vista 17 Windows 7 18 Software Updates Connections 20 21 Connect your Dyno-Scan™ to the Personal Computer 21 Connect the Dyno-Scan™ to your Vehicle 21 Select COM Port 22 i Dyno-Scan Basics 23 Options Dialog 25 Vehicle Speed Correction 28 Distance Correction 29 MPG Correction 29 Boost Calibration 30 Engine Size 31 Fuel Type 31 Fuel Cost 31 Dyno-Scan File Types 31 Create New Files 31 DashDyno Files 32 Docking Windows 33 Properties Windows 34 Navigation Docking Window 35 File Properties Docking Window 36 Dyno Setup Properties Docking Window 37 Run Statistics Docking Window 38 Toolbars 39 Status Bar 40 Scan Tool Operation 41 Connect Scan Tool to Vehicle 41 Start Dyno-Scan™ Software 41 Enhanced OBD II 42 General Information Screen 42 Diagnostic Trouble Codes Screen 43 Stored and Pending Diagnostic Trouble Codes Pane 44 Freeze Frame Pane 45 Record/Playback 46 Edit Parameters Dialog 47 Add and Remove Parameters ii Table of Contents 48 Supported Parameters Live Data Screen 48 55 List Pane 56 Graph Pane 57 Oxygen Sensors 58 Oxygen Sensors Test Results Pane 58 Oxygen Sensor Output Legend Pane 59 Test Results Screen 59 On-Board Tests Screen 60 Analyze Live Data Screen 61 Viewing Recorded Live Data 63 Analyze Tool Bar 63 Options Button 64 Axis Control 64 Data-Cursor Control 66 Analyze Data Export 66 Playback 67 Code Search Screen 67 Import 67 Export 68 Dyno Operation Theory of Operation 69 69 Auterra Dyno-Scan™ for Windows 70 Automatic Transmissions 70 Fast Sampling 71 Dyno Files 71 Dyno Setup File Properties 72 Drag Coefficient and Frontal Area 72 Dyno Setup File Properties Usage 73 Compute Gear Ratio Dialog Tire Diameter iii Table of Contents 74 74 Measuring Overall Gear Ratio 75 Calculating Overall Gear Ratio 75 Confirming Gear Ratio Result 75 Using Tire Diameter and Gear Ratio 76 Automatic Transmissions 76 Dynamometer Getting Started 76 Power Torque Screen 77 Dynamic Graph Update Using File Properties 77 Dyno Run Dialog (Power Torque) 78 Performing a Power Torque Run 78 Power Torque Run Do’s and Don’ts 79 Power Torque Run Statistics 80 Acceleration Screen 80 Dyno Run Dialog (Acceleration) 80 Performing an Acceleration Run 81 Acceleration Run Do’s and Don’ts 82 Acceleration Run Statistics 82 Google Earth 84 Google Earth Options 86 Improving Playback Speed 87 Working Without an Internet Connection 88 Demo Mode Enable Demo Mode Exporting Files 89 89 90 Single-Point Row CSV File Format 90 Multi-Point Row CSV File 92 TrackVision CSV File 93 Analyze Live Data Save 93 Merge Files 93 PID Builder 96 iv Table of Contents Install Existing PID Files 96 OBD II Protocol Background 97 PID Builder Dialog 98 Create PID File 101 Open PID File 101 Troubleshooting 102 Scan Tool Connects but No Live Data 102 Can’t Open COM Port 102 No Communication (Scan Tool) 102 No Communication (Vehicle) 103 Lost Communication 103 Live Data Screen Is Blank 103 Oxygen Sensors Test Results Pane is Blank 103 Freeze Frame Pane is Blank 103 Clearing Codes Did Not Work or MIL Didn’t Turn Off 103 Diagnostic Trouble Codes 104 Diagnostic Trouble Code Format Structure 104 P00XX Fuel and Air Metering and Auxiliary Emission Controls 104 P01XX Fuel and Air Metering 105 P02XX Fuel and Air Metering 107 P03XX Ignition System or Misfire 108 P04XX Auxiliary Emission Controls 110 P05XX Vehicle Speed, Idle Control, and Auxiliary Inputs 111 P06XX Computer and Auxiliary Inputs 112 P07XX Transmission 113 P08XX Transmission 115 Additional Diagnostic Trouble Code Ranges 116 P09XX Transmission 116 P1XXX Manufacturer Controlled 116 P2XXX SAE Controlled DTCs 116 P3XX Manufacturer Controlled and SAE Reserved 117 v Table of Contents Support 118 Warranty Information 119 Index 120 vi Table of Contents CHAPTER 1 Preface Congratulations on your purchase of an Auterra’s Dyno-Scan™ for Windows. Please take time to read through these operating instructions and become familiar with the operating procedure. The Auterra Dyno-Scan™ for Windows, in conjunction with your personal computer, enables access to your vehicle’s diagnostic information. The scan tool offers features such as read and clear trouble codes, turn off the “Check Engine” light, and display live sensor data from the vehicle. The Dyno software adds a performancemeasuring package that includes a dynamometer, acceleration tests, and fuel economy measurements. Key Features Dyno-Scan™ for Windows offers a multitude of diagnostic and performance-measuring features: • All 1996 and later vehicles supported, including American, Asian, and European • Wireless Bluetooth and USB OBD II adapters available • Read and clear diagnostic trouble codes (DTCs) • Integrated DTC description databases including enhanced and generic definitions • Turn off the vehicle’s Check Engine or Service Engine Soon light • Read and clear freeze frame data • Monitor live sensor data with line graphs, bar graphs, and meters • Graphically zoom in/out and pan within a virtual trace buffer • View multiple sensors simultaneously with variable sample rates • Record and playback live sensor data streams • Export recording to a spreadsheet for further analysis • Graphical oxygen sensor monitoring and on-board test results • I/M readiness. Metric and English units of measure • Horsepower and torque measurements • 0-60 time, 1/8 and 1/4 mile time and speed, MPG, and top speed 1 Preface • Supports Windows 98 and higher • 1-year warranty Minimum Platform and Software Requirements You must have one of the following operating on your computer: • Microsoft® Windows® XP (all editions, 32-bit and 64-bit) • Microsoft® Windows® Vista (all editions, 32-bit and 64-bit) • Microsoft® Windows® 7 (all editions, 32-bit and 64-bit) Minimum hardware requirements: • 128MB of RAM or higher OBD II OBD II stands for On-Board Diagnostics second generation. OBD II was incorporated on some 1994 and 1995 model-year vehicles and was required for all 1996-and-later vehicles. OBD II is a series of government regulations intended to reduce in-use vehicle emissions by continually monitoring for failure and/or deterioration of the powertrain and its emissioncontrol systems. A Malfunction Indicator Light (i.e. Check Engine light or Service Engine Soon light) visible to the vehicle operator will be illuminated and a Diagnostic Trouble Code set when either there is a failure of a monitored component/system or any of the sensed parameters deteriorates such that the vehicle's emissions would exceed the relevant standard by approximately 50 percent. The OBD II standard makes the Auterra Dyno-Scan™ for Windows universal to all automobiles, since all newer vehicles sold must conform to these government regulations. OBD II Connector OBD II compliant vehicles must have a 16-pin connector located in plain sight underneath the dash near the driver’s seat (see Figure 1). Alternatively, it may be behind ashtrays or concealed by an easily removed plastic cover, sometimes with the letters “OBD” stamped on the outside. Some 1994 and 1995 vehicles have this connector and are only OBD I compliant. These OBD I vehicles are not supported by the scan tool. Figure 1: Vehicle OBD II Connector (Front View) Specifications The Dyno-Scan OBD II Adapter conforms to these specifications. 2 Preface Table 1: Hardware Specifications Vehicle Protocol Input: External Power: Weight: Dimensions (H x W x D): Temperature: VPW, PWM, ISO, Keyword Protocol (KWP) 2000, and CAN bus. None. Draws power from vehicle. 4 oz 3.5" x 1.75" x .875" 32° to 158° F (0° to 70° C) non-condensing Supported Vehicles Auterra Dyno-Scan™ for Windows supports all 1996 and newer vehicles, including American, European, and Asian models. Some 1994 and 1995 vehicles are also supported with a sticker under the hood indicating OBD II compliance. All vehicles sold in the US model year 1996 and newer are OBD II compliant and do not require the under hood sticker. Abbreviations Some item descriptions are abbreviated within the software. BX – designates a bank number (e.g. B1 means bank 1) SX – designates a sensor number (e.g. S1 means sensor 1) BX-SX – designates a bank-sensor combination (e.g. B1-S2 means bank 1 – sensor 2) Abbreviations and Definitions A/F – Air Fuel A/T – Automatic Transmission Check Engine Light – also known as a MIL (Malfunction Indicator) light. CHT – Cylinder Head Temperature Closed Loop – In closed loop operation the oxygen sensors are used to adjust the fuel mixture. See open loop. DTC – Diagnostic Trouble Code Dyno - Dynamometer EBCM – Electronic Brake Control Module EBTCM – Electronic Brake Traction Control Module ECU – Emission Control Unit (i.e. the vehicle’s on-board computer) EGR – Exhaust Gas Recirculation EFI – Electronic Fuel Injection EMR – Electronic Module Retard ESC – Electronic Spark Control 3 Preface EST – Electronic Spark Timing EVAP – Evaporative Emission Fuel Trim – engine computer function that keeps the air/fuel mixture close to ideal. HC – Hydrocarbons HEI – High Energy Ignition HO2S – Heated Oxygen Sensor Horsepower – a unit of measure to express the rate at which mechanical energy is expended. HP – Horsepower M/T – Manual Transmission MAF – Mass Air Flow MIL – Malfunction Indicator Light (i.e. “Check Engine” or “Service Engine Soon” light on the vehicle’s instrument panel). NOx – Oxides of Nitrogen O2 – Oxygen Open Loop – used to describe the fuel mixture when the oxygen sensors are not being used, usually when the engine is cold or if a malfunction preventing closed loop operation is detected. See closed loop. PCM – Power Control Module PID – Parameter ID is a number used to designate a particular vehicle sensor. PTO – Power Take-Off RPM – Revolutions per Minute SAE – Society of Automotive Engineers Scan Tool – a computer that reads out OBD II values from the vehicle. Service Engine Soon – also known as a MIL light. SFI – Sequential Fuel Injection TBI – Throttle Body Injection TCM – Transmission Control Module TCS – Traction Control Switch TFT – Transmission Fluid Temperature Torque - Torque is a measure of the force acting on an object causing that object to rotate. TP – Throttle Position TPS – Throttle Position Sensor 4 Preface VAC – Vacuum VIN – Vehicle Identification Number VSS – Vehicle Speed Sensor 5 Preface CHAPTER 2 Installing Windows Software Loading the Auterra Windows software onto your personal computer is easy. This section shows you how. Uninstall Previous Dyno-Scan for Windows Auterra recommends uninstalling all previous versions of the Dyno-Scan for Windows software, if any, before proceeding. 1 From the Start menu, select Settings > Control Panel. 2 Double-click on Add/Remove Programs. 3 Click the Install/Uninstall tab, if your Windows version includes it. 4 From the list of programs that you can remove, select Dyno-Scan for Windows. 5 Click Add/Remove. 6 At the prompt, click Yes to confirm that you want to remove the Dyno-Scan for Windows program. 7 When the files are removed, the uninstall program indicates that the process is complete. Software Installation (All Windows Versions) 1 Close all other programs and windows. 2 Insert the CD labeled Dyno-Scan for Windows into your CD-ROM drive. 3 The installation should start automatically. If not, from the Start menu select Run. 4 Type D:\setup (substitute the appropriate letter of your CD-ROM drive for D). 5 Follow the instructions on the screen. USB Driver Installation The A-302 Windows kit comes with USB OBD II adapter. This adapter requires installing a USB driver. This section only applies to the USB version of the OBD II adapter, as shown in Figure 2: USB OBD II Adapter. 6 Installing Windows Software Figure 2: USB OBD II Adapter For Bluetooth OBD II adapter installations, skip to the Bluetooth Driver Installation section below. Windows Vista/7 USB Driver Installation 1 Do not plug in your Auterra USB OBD Adapter into your PC until after the Auterra DynoScan for Windows software is installed. 2 During Dyno-Scan for Windows software installation, the USB driver is installed automatically. Just plug in the USB OBD II adapter and your device is ready for use. If you experience problems installing the USB driver, see the “USB Driver Installation.pdf” manual in the User Guide directory on the Auterra CD ROM. 3 Windows 7: To locate the COM port number, go to the Windows Start button > Devices and Printers. In the Unspecified section, see the Dyno-Scan OBD II USB Adapter Port (COMX), where COMX is the COM port to select within the Dyno-Scan software on the Tools > Options menu dialog. 7 Installing Windows Software Windows Vista: To locate the COM port number, go to the Windows Start button > Control Panel > System and Maintenance and click Device Manager. Expand the Ports (COM & LPT) setting and see the Dyno-Scan OBD II USB Adapter Port (COMX) entry, where COMX is the COM port to select within the Dyno-Scan software on the Tools > Options menu dialog. 8 Installing Windows Software Windows XP USB Driver Installation 1 Do not plug in your Auterra USB OBD Adapter into your PC until after the driver is installed. 2 Start AuterraVCPInstaller.exe within the USB Driver directory located on the Auterra CD ROM. 3 On Windows XP it may display a warning message. Press the Continue Anyway button. With all other versions of Windows no warning dialog is displayed. 9 Installing Windows Software 4 Please wait a few minutes for the driver installation to complete. There will be no progress dialog during installation. 5 Plug in the USB OBD II Adapter to your Windows PC. The Found New Hardware Wizard will display. 6 On the Found New Hardware Wizard, select “Yes, this time only” and press Next. 10 Installing Windows Software 7 On the next dialog, select “Install the software automatically (Recommended). The AuterraVCPInstaller.exe pre-installs the driver on your PC. Optionally, if you wanted to install the driver directly from the Auterra CD ROM, select “Install from a list or specific location (Advanced)” and then select a specific location on your computer (for instance d:\USB Driver). 11 Installing Windows Software 8 On Windows XP, a warning dialog will appear. Press Continue Anyway. All other Windows versions will not display a warning message. 12 Installing Windows Software 9 After the first driver installs, steps 7 though 9 will repeat again. There are two parts to the driver and both must be installed. 10 The driver installation is complete. If you experience problems installing the USB driver, see the “USB Driver Installation.pdf” manual in the User Guide directory on the Auterra CD ROM. 11 To locate the COM port number, go to the Windows Start button > Control Panel > System and Maintenance and click Device Manager. Expand the Ports (COM & LPT) setting and see the Dyno-Scan OBD II USB Adapter Port (COMX) entry, where COMX is the COM port to select within the Dyno-Scan software on the Tools > Options menu dialog. Figure 3: Correct Installation of USB Driver USB Driver Virtual COM Port When the USB OBD II adapter is plugged into the PC, the driver will create a virtual COM port and assign it a number. The Windows Device Manager shows all assigned port numbers. Open Device Manager by doing the following: 1 Click on “Start” and then “Control Panel”. 2 Switch to Classic View (if in Category View). 13 Installing Windows Software 3 Double click on “System”. 4 Select the Hardware tab. 5 Press the “Device Manager” button. 6 Click on the “+” next to Port. 7 The entry labeled “Auterra USB OBD II Adapter” shows the virtual COM port for the USB OBD II adapter. Physical COM ports are also shown if you are using a serial OBD II adapter. Figure 4: Auterra USB OBD II Adapter COM Port Bluetooth Driver Installation The A-303 Windows kit comes with a Bluetooth OBD II adapter. Your PC may already be equipped with a Bluetooth wireless adapter. If so, your PC should already have the driver installed. If your PC does not have a Bluetooth adapter, then a USB Bluetooth adapter (not included) will add wireless capability to your PC. Follow the manufacturer instructions to install the USB Bluetooth Adapter driver. Figure 5: USB Bluetooth Adapter 14 Installing Windows Software Bluetooth Pairing The Bluetooth OBD II adapter must be paired with the Windows PC in order to communicate. The high-level pairing process is as follows: 1 Plug the Bluetooth OBD II adapter into your vehicle’s OBD II connector. 2 Turn the vehicle ignition ON (the vehicle does not have to be running). The Bluetooth OBD II adapter is now automatically placed into discovery mode. 3 Search for Bluetooth devices on your PC. The device name is RN42-nnnn (where nnnn is a letter/number combination unique to each Bluetooth OBD II adapter). 4 Pair the Bluetooth OBD II adapter with the PC. The passkey (or pairing key) is: 1234 5 A serial over Bluetooth link is added to your PC and one or more COM ports assigned (e.g. COM5). The Windows Device Manager will show the COM ports assigned under the “Ports (COM & LPT)” section. 6 In you’re My Bluetooth Places you may need to right mouse click on the RN42 device and select Connect from the shortcut menu. 7 Select the Tools > Find OBD II Adapter menu option in the Auterra Dyno-Scan for Windows software to automatically detect the OBD II adapter. 8 Your OBD II adapter is connected and ready for use. The sections below offer detailed instructions. Your PC screens may be slightly different depending on your Bluetooth driver and ‘Windows operating system. Windows XP 1 Plug the Bluetooth OBD II adapter into your vehicle’s OBD II connector. 2 Turn the vehicle ignition ON (the vehicle does not have to be running). The Bluetooth OBD II adapter is now automatically placed into discovery mode. 3 Select Windows Start > My Bluetooth Places. 4 Select Bluetooth > Search For Devices. Follow the on-screen setup steps. 15 Installing Windows Software 16 Installing Windows Software 5 In My Bluetooth Places you may need to right mouse click on the RN42 device and select Connect from the shortcut menu. 6 Select the Tools > Find OBD II Adapter menu option in the Auterra Dyno-Scan for Windows software to automatically detect the OBD II adapter. 7 Your OBD II adapter is connected and ready for use. Windows Vista 1 Plug the Bluetooth OBD II adapter into your vehicle’s OBD II connector. 2 Turn the vehicle ignition ON (the vehicle does not have to be running). The Bluetooth OBD II adapter is now automatically placed into discovery mode. 3 Select Windows Start > Control Panel and double click Bluetooth Devices. 4 Select the Options tab. 17 Installing Windows Software 5 Place a checkmark next to "Allow Bluetooth devices to find this computer" under the Discovery heading. 6 Place a checkmark next to "Allow Bluetooth devices to connect to this computer" and "Alert me when a new Bluetooth device wants to connect" under the Connections heading. 7 Click Apply. 8 Select the Devices tab, and then click Add. 9 Follow the on-screen instructions to complete pairing. 10 Select the Tools > Find OBD II Adapter menu option in the Auterra Dyno-Scan for Windows software to automatically detect the OBD II adapter. 11 Your OBD II adapter is connected and ready for use. Windows 7 1 Plug the Bluetooth OBD II adapter into your vehicle’s OBD II connector. 2 Turn the vehicle ignition ON (the vehicle does not have to be running). The Bluetooth OBD II adapter is now automatically placed into discovery mode. 3 Select Windows Start > Control Panel > Hardware and Sound then Bluetooth Devices. 4 Click Add, and then follow the on-screen instructions. 18 Installing Windows Software 19 Installing Windows Software 5 Select the Tools > Find OBD II Adapter menu option in the Auterra Dyno-Scan for Windows software to automatically detect the OBD II adapter. 6 Your OBD II adapter is connected and ready for use. Software Updates Check the Auterra website periodically to download software updates at www.auterraweb.com. 20 Installing Windows Software CHAPTER 3 Connections Connecting your Auterra Dyno-Scan™ for Windows to the vehicle is easy. This section shows you how. Connect your Dyno-Scan™ to the Personal Computer A Plug the USB cable into the personal computer’s USB port (not applicable if using the Bluetooth OBD II adapter). B Connect the USB cable to the OBD II adapter (not applicable if using the Bluetooth OBD II adapter). C Connect the OBD II cable to the OBD II adapter and tighten the two thumbscrews. Figure 6: Dyno-Scan™ Connections Connect the Dyno-Scan™ to your Vehicle Locate the OBD II connector on the vehicle. The 16-pin connector is usually located in plain sight underneath the dash near the driver’s seat (see Figure 1). It may also be behind ashtrays. Connect the male OBD II Cable connector to the vehicle’s female OBD II connector. Ensure the connectors are fully engaged. 21 Connections Select COM Port 1 Start the Dyno-Scan application. 2 Plug the OBD II adapter into the vehicle’s OBD II port. 3 If using the USB OBD II adapter, plug the USB cable into the PC. 4 Turn the vehicle ignition ON (vehicle does not have to be running). 5 Select the Tools > Find OBD II Adapter… menu option. The software will automatically detect USB and Bluetooth adapter and set the COM port. 6 Alternatively, select the Tools > Options… menu selection. 7 On the Options dialog, select the COM port that the scan tool is connected to. The COM port dropdown list only shows COM ports installed on your computer. Refer to section USB Driver Virtual COM Port for information on displaying COM port numbers within Windows Device Manager. 8 Press the OK button. Your Dyno-Scan for Windows scan tool is setup and ready for use. If you are having trouble setting the correct COM port, please refer to sections USB Driver Installation or Bluetooth Driver Installation depending on your OBD II adapter type. See the section Troubleshooting for more troubleshooting tips. 22 Connections CHAPTER 4 Dyno-Scan Basics Getting started with your Dyno-Scan for Windows software is easy, and this section shows you how. To connect to your vehicle, press the Connect button on the toolbar. Then press the “Connect to Vehicle” button on the Connect dialog. After a few seconds the scan tool will be connected to the vehicle. If the scan tool fails to connect, see Troubleshooting on page 102. Figure 7: Connect Dialog The Navigation pane is vertically docked on the far left of the screen. The Navigation pane is used to switch between the main screens. Just click an icon, such as Live Data, to change screens. The Navigation pane sorts the main screens by category: Scan Tool, Dyno and Analyze. Mouse click a category on the Navigation pane and new category icons are displayed. A right mouse click brings up a shortcut menu on many screen elements. On the Live Data screen, right mouse click in the middle of a Graph or List pane and select “Edit Parameters” to monitor live sensor data. Alternatively, left mouse click the Options dropdown button located on the right side of the pane title bar. 23 Dyno-Scan Basics Figure 8: Right Mouse Click Shortcut Menu If you close all of the Live Data Graph and List panes, the screen is blank. To add panes again, just right mouse click in the middle of the screen and select “Add List Pane” or “Add Graph Pane” and a new pane will be displayed. Figure 9: Live Data Screen Highlighted Features Not every screen is supported by every vehicle. For instance, some vehicles will not support the Oxygen Sensors screen. If a screen is blank or shows no data, then the vehicle doesn’t support that particular scan tool feature. The Analyze Live Data screen only displays data if you either record data or open a previously recorded live data file. For instance, select File > Open > Live Data File… and select a file to open. Data will then be displayed on the Analyze Live Data screen. Left mouse click the Options button on the Analyze Live Data pane title bar to display a shortcut menu of options. Right mouse click on any graphical element on this screen to display a shortcut menu of options. For instance, right mouse click an x or y axis for options. 24 Dyno-Scan Basics Hold the left mouse button down and drag to move the axis data. Hold the Ctrl keyboard key and mouse drag an axis to zoom in and out. Figure 10: Analyze Live Data Screen If you close any of the docking windows such as Navigation or File Properties, you can display them again on the View menu (e.g. View > Navigation). Options Dialog The Reload last user parameters when starting program setting, when checked, restores all user parameters to their last known state. Otherwise, the program’s default parameters are used. The COM Port setting on the General tab selects the personal computer COM port to use. Make sure the selected COM port matches the one the OBDII’s adapter has been plugged into. The Default Units of Measure setting changes between English or Metric units. Not all sensors use English units of measure, in which case the Metric units are used. The Fast Sampling option on the General tab enables a faster than normal sampling frequency on some vehicles. If you notice on some vehicles that the live sensor monitoring doesn’t function or the sensor measurements update sporadically, disable this feature. The CAN 6x Communication options enables or disables the high-speed six-samples-perquery communication mode. Normally, one sensor at a time is polled from the vehicle. If the 25 Dyno-Scan Basics vehicle supports CAN bus, then the vehicle may support polling up to six parameters at once speeding the transfer of data. The MPG Correction applies a percent correction factor to all Instant Economy, Average Economy and Fuel Used parameters. This correction is used to fine-tune the fuel economy measurements. The Distance Correction applies a percent correction factor to the Distanced Traveled live data parameter. The Vehicle Speed Correction preference adjusts the vehicle speed sensor readings to accommodate a vehicle with an inaccurate speedometer. This is a global setting and adjusts the vehicle speed measurements on all screens displaying or using live data such as Live Data, Gear Ratio and Acceleration. The vehicle speed correction preference does not adjust the vehicle dashboard speedometer nor does it calibrate the vehicle speedometer. The Boost Calibration value is subtracted from all Boost Pressure readings in order to adjust the Boost Pressure measurements from absolute pressure to a gauge pressure. The Boost Calibration entered is the atmospheric pressure in psi (pounds per square inch). To get atmospheric pressure using your vehicle, enter a Boost Calibration value of 0.0% and view the Boost Pressure parameter on the Live Data screen with the engine off. The Boost Pressure reading with a 0.0% calibration is the value to enter into the Boost Calibration box. The Engine Size preference is used in the following parameters: Instant Economy 2, Average Economy 2, Fuel Used 2 and Air Flow Rate From MAP. Ensure you enter an accurate engine size (in liters) if you use these parameters. The Fuel Type preference is used to adjust the fuel economy-related parameters. Ensure you enter the correct fuel type: gas or diesel. The Fuel Cost preference is used to enter the cost per gallon of fuel currently in the vehicle gas tank. This value is used to compute the Fuel Cost live data parameter. If the Units of Measure is Metric, the value is the cost per liter. The Reset Defaults button sets all settings back to their default state. 26 Dyno-Scan Basics Figure 11: Options Dialog, General Tab The View tab allows customization of the Font, Font Style, Font Color, and Font Size settings used in all grid displays. 27 Dyno-Scan Basics Figure 12: Options Dialog, View Tab Vehicle Speed Correction The vehicle speed correction preference adjusts the vehicle speed sensor readings to accommodate a vehicle with an inaccurate speedometer. This is a global setting and adjusts the vehicle speed measurements on all screens displaying of using live data. The vehicle speed correction preference does not adjust the vehicle dashboard speedometer nor does it calibrate the vehicle speedometer. If you vehicle is equipped with a stock tire size you leave this setting at 0.0%. Always compute and adjust the vehicle speed correction first before measuring and adjusting the distance correction or MPG correction. To compute and adjust the vehicle speed correction factor using is GPS: 7 Set Vehicle Speed Correction to 0. 8 Select the Live Data screen and monitor the Vehicle Speed parameter. 9 Drive the vehicle and keep the vehicle speed stead (e.g. 30 MPH). 10 Have a passenger note the Dyno-Scan Vehicle Speed and the GPS speed. 11 Compute an error percentage: vehicle speed correction = ((GPS speed – Dyno-Scan vehicle speed ) / GPS speed) x 100 Example: 7.3% = ((30.0 MPH – 27.8 MPH) / 30.0 MPH) x 100 12 Set the Vehicle Speed Correction to the computed correction factor. 28 Dyno-Scan Basics Distance Correction The distance correction preference fine-tunes the accuracy of the Distance Traveled parameter, if necessary. The distance correction preference does not adjust the vehicle odometer nor does it calibrate the vehicle speedometer. The Distance Traveled parameter is used within the Instant MPG and Average MPG parameter computations. Therefore, an accurate Distance Traveled parameter ensures greatest accuracy of these parameters. To compute and adjust the distance correction preference using your vehicle odometer: 1 Set the Distance Correction to 0. 2 Go to the Live Data screen and monitor the Distance Traveled parameter. 3 Drive the vehicle for 25 to 50 miles. 4 Compare the Dyno-Scan trip computer Distance Traveled value and the vehicle’s odometer mileage. Compute an error percentage: distance correction = ((odometer distance – Dyno-Scan distance ) / odometer distance) x 100 Example: 3.3% = ((27.5 miles – 26.6 miles) / 27.5 miles) x 100 5 Set the Distance Correction to the computed correction factor. Alternatively a GPS may be used in place of the odometer in the above procedure if the vehicle speedometer is not accurate. MPG Correction The MPG correction preference fine-tunes the accuracy of the Instant MPG, Average MPG and Fuel Used parameters due to different fuels or minor vehicle sensor variances. The MPG correction preference does not adjust the amount of fuel used by the vehicle. Always compute and adjust the distance correction first before measuring and adjusting MPG correction. To compute and adjust the MPG correction preference: 1 Set the MPG Correction to 0. 2 Fill up your vehicle gas tank. 3 On the Tools > Options menu press the Reset Fuel Used button then press OK. 4 Go to the Live Data screen and monitor the Fuel Used parameter. 5 Drive the vehicle normally until the tank is near empty. Always have the Average Fuel Economy screen displayed when driving the vehicle. 6 Fill up the vehicle and note the gallons used to fill up the vehicle. 29 Dyno-Scan Basics 7 Compute the error in the Dyno-Scan Fuel Used parameter and the gallons used to fill up the gas tank. MPG correction = ((Dyno-Scan fuel used - gas pump gallons) / gas pump gallons) x 100 Example: -1.2% = ((25.3 gallons – 25.6 gallons) / 25.6 gallons) x 100 8 Set the MPG Correction to the computed correction factor. Boost Calibration Two different methods are used for expressing pressure: gauge pressure and absolute pressure. Gauge pressure is referenced to atmospheric pressure. The atmospheric pressure at sea level is about 14.7psi and changes slightly with atmospheric conditions. Absolute pressure is referenced to 0psi. The relationship between the pressures can be expressed as follows: absolute pressure = gauge pressure + atmospheric pressure The Boost Pressure parameter measures the absolute pressure within the vehicle’s intake manifold. To measure gauge pressure, enter a Boost Calibration offset. Gauge pressure can be expressed as follows: gauge pressure = absolute pressure – atmospheric pressure The Boost Calibration allows entering the atmospheric pressure, in psi, such that a gauge pressure reading may be obtained. boost pressure = absolute pressure – Boost Calibration Two factors affect the Boost Calibration accuracy: weather conditions and elevation changes, the later being more significant. Enter a new Boost Calibration for the most accurate gauge pressure measurements. The boost calibration does not adjust the turbo boost pressure of the vehicle. To compute a Boost Calibration correction factor: 1 Connect Dyno-Scan to your vehicle. 2 Ensure your vehicle is not running. 3 Select the Boost Calibration option to 0. 4 Go to the Live Data screen and monitor the Boost Pressure parameter. 5 The Boost Pressure parameter will display. This is your Boost Calibration correction factor. With the Boost Calibration preference at 0 and the vehicle off, the Boost Pressure value shown is atmospheric pressure. 6 Set the Boost Calibration to the value measured above. 30 Dyno-Scan Basics Engine Size The Engine Size preference is used in the following parameters: Instant Economy 2, Average Economy 2, Fuel Used 2 and Air Flow Rate From MAP. Ensure you enter an accurate engine size (in liters) if you use these parameters. Fuel Type The Fuel Type preference is used to adjust the fuel economy-related parameters. Ensure you enter the correct fuel type: gas or diesel. Fuel Cost The Fuel Cost preference is used to enter the cost per gallon of the fuel currently in the vehicle gas tank. This value is used to correctly display the Fuel Cost live data parameter. If the Units of Measure is set to Metric, the Fuel Cost is the cost per liter. Dyno-Scan File Types The software uses four data file types with five different file extensions. Each file type can be created using the File > New menu option. Table 2: File Types File Type File Extension Description Live Data File Power Torque File Acceleration File Dyno Setup File DashDyno Alarm File .ld .pt .ac .ds .al Live data files store live parameter recordings. Stores power torque run data. Stores acceleration run data. Stores vehicle and environmental setup information. An alarm file used on the DashDyno to illuminate LED lights when sensor limits are exceeded. Create New Files Create files from the File > New menu option. To create a new Live Data file: 1 Select the File > New > Live Data File… menu option. 2 On the New Live Data File dialog, select a directory and enter a file name in the File name box. 3 Press the Save button. 4 The live data file is now ready for recording. See Record/Playback on page 46 for information on recording live data. To create a new Dyno Setup File: 1 Select the File > New > Dyno Setup File… menu option. 31 Dyno-Scan Basics 2 On the New Dyno Setup File dialog, select a directory and enter a file name in the File name box. 3 Select the View > Dyno Setup Properties menu option. 4 In the Dyno Setup Properties docking window, enter each value. For instance, click the 1000 next to Elevation and type in a new value. The file is automatically saved each time a value is changed. See Dyno Setup File Properties on page 72 for information about the Dyno Setup File values. The Power Torque and Acceleration files are created in the same way. See Dynamometer Getting Started on page 76 for information on how to create and record Power Torque and Acceleration files. DashDyno Files The DashDyno SPD shares the same file format with the Dyno-Scan for Windows software. Any file created within the Windows software can be opened on DashDyno. Creating a file on a Windows PC and copying it to the DashDyno SD card can sometimes be more convenient than creating the file directly on the DashDyno handheld. To create a DashDyno Alarm File: 1 Select the File > New > DashDyno Alarm File… menu option. 2 On the New DashDyno Alarm File select the Alarm LEDs tab. 32 Dyno-Scan Basics 3 Set the values for one or more alarm parameters. See the DashDyno SPD user guide Alarms section for information on the Parameter, Alarm Threshold, Set Alarm When and Alarm Action options. 4 Press the File Name button. 5 On the New DashDyno Alarm File Name dialog, enter a directory and name of the file. 6 Press the Save button. 7 Press the Create File button. 8 Locate the file you created and copy it to the ALARM directory on the DashDyno SD card. 9 The alarm file is now ready for use on your DashDyno. See the DashDyno SPD user guide for information on how to use an alarm file. The Shift Alarm tab allows creating a shift light with three RPM levels, one for each LED: green, yellow, and red. When the RPM exceeds the RPM set by the red level, all the LEDs lights will flash in unison indicating it is time to shift. Docking Windows The program contains four docking windows: Navigation, File Properties, Run Statistics, and Dyno Setup Properties. Each docking Windows may be resized, hidden, or slide-in or slide-out from a docked position on demand. 33 Dyno-Scan Basics Figure 13: Floating Toolbars and Property Windows • To hide a docking window, click the red X close button in the upper right corner. • To hide a docking window with slide-in, press the pushpin icon in the upper right corner. The window will slide in and hide itself. • To show a hidden docking window, select the View menu option (e.g. View > Navigation). • To show a docking window with slide-out, hover the mouse button over the docked window name or icon. The window will slide out showing itself. • If a docking window is not visible, the View menu option will redisplay any of the four windows. • To move a docking window from dock to float, either drag window title bar to a new location or double click the title bar. • To move a docking window from float to dock, either drag the window title bar to one of the four window edges (top, bottom, left, right) or double click the title bar. Properties Windows Properties values are shown in certain docking windows, such as the Dyno Setup Properties as shown below. 34 Dyno-Scan Basics Figure 14: Dyno Setup Properties Docking Window All property windows share the same behavioral traits, such as: • Properties displayed in bold font may be modified. • Properties display in grey font cannot be changed. • Any property changes are immediately saved to disk. To change a property value, click the parameter and type in a new value. The change is immediately saved to disk. Navigation Docking Window The Navigation docking window is used to switch main screen. 35 Dyno-Scan Basics Figure 15: Navigation Docking Window To switch screens, perform these steps: 1 Click one of main group buttons. 2 Click an item icon from within that group. For instance, to select the Acceleration screen, select the Dyno group then click the Acceleration icon. File Properties Docking Window Live Data, Power Torque, and Acceleration files properties are viewed and changed from the File Properties docking window. 36 Dyno-Scan Basics Figure 16: File Properties Docking Window The File Properties docking window shows different properties depending on the active screen. Table 3: File Properties Displayed Active Screen Live Data Power Torque Acceleration All other screens File Properties Displayed Live Data file Power Torque file Acceleration file No properties are displayed For instance, to view Live Data file properties within the File Properties docking window, select the File > Open > Live Data File… menu option to open a file then switch to the Live Data screen. Dyno Setup Properties Docking Window The Dyno Setup file properties are viewed and changed from the Dyno Setup Properties docking window. 37 Dyno-Scan Basics Figure 17: Dyno Setup Properties Docking Window To view Dyno Setup file within the Dyno Setup Properties docking window, select the File > Open > Dyno Setup File… menu option to open a file. Run Statistics Docking Window The Run Statistics docking window shows statistical values for Power Torque and Acceleration curves, such as maximum horsepower or top speed. Figure 18: Run Statistics Docking Window For instance, to view Power Torque statistics within the Run Statistics docking window, select the File > Open > Power Torque File… menu option to open the file then switch to the Power Torque screen. 38 Dyno-Scan Basics Toolbars Toolbar locations, docking position, buttons shown, and sizes are completely user customizable. Each time you start the program; the toolbar settings and position is restored if the “Restore last user parameters when starting program” option is selected (see Options Dialog). • To move a docked toolbar, left mouse click and drag the vertical dashed line on a toolbar. Alternatively, double click the dashed line to move the toolbar into a floating position. • To move a floating toolbar, left mouse click the title bar and drag to its new location. Alternatively, double click the title bar to put the toolbar back into its docked position. • To move toolbar to a new docked location, left mouse click and drag the toolbar to a new edge of the screen. The toolbar can be docked to any of the four application window edges (top, bottom, left, right). • To customize the buttons shown on the toolbar, click the down arrow located on a docked toolbar to show a toolbar shortcut menu. Alternatively, right mouse click on any blank location within the toolbar area to show the shortcut menu. • To change to change various toolbar and menu options, such as enable/disable toolbars or change the icons from large to small, select the toolbar shortcut menu then select the Customize… option. 39 Dyno-Scan Basics Figure 19: Customize Toolbars and Menus Dialog Status Bar The status bar is located at the bottom of the program screen. It displays the following information from left to right: Vehicle Connection Status – either Connected or Not Connected Connection Type – the vehicle hardware protocol connection type. For instance, PWM, VPW, CAN, ISO, or KWP. Data Mode – either Live or Play. Live mode means the data is originating from the vehicle. Play mode means the data is originating or recording to/from a file. Playback Percentage Bar Graph – the current playback file position as a percent. Open Live Data File – currently open Live Data file. Open Power Torque File – currently open Power Torque file. Open Acceleration File – currently open Acceleration file. 40 Dyno-Scan Basics CHAPTER 5 Scan Tool Operation The Dyno-Scan™ software is designed for easy operation. This section shows how to operate the software and describes the features on each screen. Not every vehicle is equipped with all sensor types supported by the scan tool. Therefore, the scan tool interrogates the vehicle and creates a custom list of sensors and options unique to the vehicle connected. Ensure the PC, cable, and OBD II adapter do not Interfere with the vehicle controls. A cable dangling in front of the foot pedals, gear shifter, or steering wheel can interferer with vehicle operation and cause a fatal accident. Always ensure the PC, cable, and OBD II adapter are securely fastened out of the way. If the scan tool and PC cannot be safely attached as to not interfere with the vehicle controls, then do not drive the vehicle with the OBD II adapter connected to the vehicle. Connect Scan Tool to Vehicle The scan tool must be connected to the vehicle’s diagnostic connector, except in demonstration mode where the vehicle data is simulated. See Demo Mode for more information about the demo mode. 1 Turn the vehicle ignition off. 2 Connect the OBD II cable to the vehicle’s OBDII connector. Normally the vehicle connector is located under the dash on the driver’s side in plain sight. 3 Turn the vehicle’s ignition on. Vehicle does not have to be running. For engine running tests, the vehicle can be started and idling. Do not operate the vehicle indoors. A running engine produces lethal carbon monoxide exhaust fumes that can seriously harm or kill you if inhaled. Only run the vehicle motor outdoors with proper ventilation. Start Dyno-Scan™ Software 1 Start the Dyno-Scan™ software on the personal computer by double-clicking Dyno-Scan icon located your desktop. You can also start the software in different languages by selecting the Windows start button > Dyno-Scan > Español > Dyno-Scan. 2 Once the software has started, select the File > Connect menu option. 41 Scan Tool Operation 3 On the Connect dialog, press the “Connect to Vehicle” button to connect to the vehicle. Selecting the Connect to Vehicle Demo checkbox to enable Demo mode see Demo Mode. Figure 20: Connect Dialog 4 After a few seconds, the scan tool will detect the vehicle. Enhanced OBD II The scan tool supports optional enhanced OBD II upgrades. These upgrades can be purchased separately for certain makes of vehicle, like Ford, GM, Toyota and others. The enhanced features allow access to other vehicle systems like ABS, airbag (SRS), and others. A Product Key is purchased to unlock these features. Once the Product Key is obtained, it is entered into the Help > Product Registration Keys menu option. If you want to see what enhanced OBD II vehicles systems are supported before purchasing an enhanced upgrade, select a different make on the Vehicle Connection Type dropdown on the Connect dialog, and then press Connect to Vehicle. The software will detect the enhanced systems available on your vehicle such as ABS or airbag. Note the following when detecting enhanced OBD II vehicle systems: 1. Upgrade to the latest Dyno-Scan for Windows software by download the upgrade from the Auterra web site (www.auterraweb.com). 2. If you have an older OBD II adapter version, an adapter firmware update or new OBD II adapter may be required before all available vehicle systems are detected. Please contact Auterra for upgrade options available. General Information Screen The General Information screen contains two panes: Vehicle Monitor Test Status and Vehicle Information. 42 Scan Tool Operation Figure 21: General Systems Screen The Vehicle Monitor Test Status pane shows the status of the vehicle’s built-in readiness monitor tests. Test statuses are either Complete or Incomplete. Other bit-encoded information is also displayed on this screen like fuel system status. Click on a column header to sort the parameters ascending alphabetically. Click the header again and it sorts descending. The software continually queries the vehicle to display current values on the Vehicle Monitor Test Status pane. The Vehicle Information pane shows vehicle specific information such as Vehicle Identification Number (VIN), Calibration IDs and Performance Tracking counters. Diagnostic Trouble Codes Screen The Diagnostic Trouble Codes screen has three panes: Stored Diagnostic Trouble Codes, Pending Diagnostic Trouble Codes, and Freeze Frame. 43 Scan Tool Operation Figure 22: Trouble Codes Screen Stored and Pending Diagnostic Trouble Codes Pane The Stored and Pending Diagnostic Trouble Codes panes display the vehicle’s pending and stored Diagnostic Trouble Codes (DTC), if any. The Diagnostic Trouble Codes screen continually scans for new DTCs, even if some DTCs are already shown. All DTCs are displayed within 10 to 20 seconds. If the vehicle’s Check Engine or Service Engine Soon light on the instrument panel is illuminated, a stored DTC will be displayed. Pending DTCs do not necessarily indicate a faulty component/system. If the vehicle’s test results indicate a failure after additional driving, then the Check Engine light is illuminated and a DTC is set in the stored DTC pane. Two categories of trouble codes exist: generic and enhanced. Generic codes are standardized and common to all vehicle manufacturers. Enhanced codes are not uniquely defined and may overlap with another manufacture, or even the same manufacturer. For instance, multiple definitions may exist for code P1234. Ford may define it as “Engine Oil Pressure Too Low”, but Toyota’s definition could mean something different like “System Voltage Unstable”. The Diagnostic Trouble Codes screen reads and clears both generic and enhanced codes. There are four types of trouble codes: P (Powertrain), B (Body), C (Chassis), and U (Network Communication). The scan tool reads and clears all P-codes and, depending on the vehicle, B, C, and U-codes as well1. 1 Not all vehicles support retrieving and clearing B, C, and U-codes. 44 Scan Tool Operation 1 Switch to the Diagnostic Trouble Codes screen as described in the section Navigation Docking Window. 2 If the vehicle has detected a Diagnostic Trouble Code(s) (DTC) they are listed in either the Stored or Pending Diagnostic Trouble Codes pane. Not all Diagnostic Trouble Codes cause the MIL light (i.e. Check Engine) to illuminate. 3 If the MIL light is on (Check Engine), the Diagnostic Trouble Code that caused the light to illuminate is marked with a Yes in the “DTC Caused MIL” column. The Freeze Frame pane will contain a snapshot of a variety of sensor values at the time the error occurred (see Freeze Frame ). Useful for diagnosing operating parameters of the vehicle at the time the MIL occured. 4 If you wish to clear the MIL, select the Tools > Clear DTCs… menu option to clear all DTCs from the vehicle’s memory. Wait a few seconds after pressing Yes on the Clear Trouble Codes dialog for the scan tool to complete the clear command. 5 Pressing Yes will clear the DTC from vehicle memory. Once cleared, the error codes cannot be recovered. Clearing also extinguishes the vehicle’s MIL (i.e. Check Engine) light and erases the vehicle’s freeze frame log. Sometimes the vehicle’s ignition must be turned off and on again before the Check Engine light turns off. Figure 23: Clear Trouble Codes 6 Tapping the ‘+’ icon next a trouble code number will expand out the possible DTC textual descriptions. The software may not contain a description for every possible trouble code. If the software cannot find a description, please refer to your vehicle’s repair manual. See Diagnostic Trouble Codes for more information. Freeze Frame Pane The Freeze Frame pane displays the vehicle freeze frame log. Select the sensor units of measure, either English or Metric, using the Preferences screen (see Options Dialog). When a Diagnostic Trouble Code occurs that illuminates the Check Engine light, the vehicle’s computer saves the current values of the vehicle’s sensors at the instant the error occurred. If a freeze frame exists, it will display within a few seconds. Each vehicle supports a different complement of sensors. The Freeze Frame pane displays only sensors appropriate for the vehicle under test. This pane remains blank if no freeze frame information is available from the vehicle. 45 Scan Tool Operation Record/Playback The Live Data screen can record and playback live sensor data. The recording and playback is controlled from the Playback menu option. The Record/Playback settings are: Live – display live data as it is occurring. Play – playback a previously recorded file. Stop – stop a playing file. Record – start recording live data. Pause – pause a file during playback. The Live Data panes have two modes of operation: Live and Play. When the Playback control is set to Live, all displayed parameters are live from the vehicle. If the Playback control is set to Play, Pause, Stop, or Record the scan tool is in the Play mode (see Status Bar). The recorded data is saved in a Live Data file. The Live Data files are open and created from the File > New and File > Open menu options. Once a file is open, selecting Record saves the data into the currently opened file. Similarly, Play plays back the currently opened file. New vehicle parameters are selected while in Live mode. Once the mode has switched to Play mode, new parameters cannot be added; always switch to Live mode to add/remove parameters via the Parameter Edit dialog. The playback speed does not use the same time-base as the original recording. Therefore, playback will be faster than when recorded. This makes it easier to review long recorded files. Playback position is controlled using the Playback > Set Playback Position control. 0% is the beginning of the file and 100% is the end. Figure 24: Set Playback Position Dialog A Live Data file saves a list of parameters recorded. The Parameter Edit dialog shows recorded parameters in the Parameter list box and the word “Play” is displayed as the Module. The Sample Speed control is hidden when in play mode. See Edit Parameters Dialog for more information. To record live data: 1 Switch to the Live Data screen as described in the section Navigation Docking Window. 46 Scan Tool Operation 2 Ensure the Playback mode is set to Live by selecting the Playback > Live menu option. 3 Create a new Live Data file by selecting File > New > Live Data File… 4 Enter a file name, and press Open. 5 Press the Options label in the upper right corner of the Graph pane. Alternatively, right mouse click anywhere in the Graph pane. Select the Edit Parameters menu option. 6 Press the Add Parameter button. 7 Select a sensor from the ECU Parameter box located on the right side of the dialog. 8 Press OK. 9 Select the Playback > Record menu option to start recording. 10 Select the Playback > Stop menu option to stop recording. 11 Select the Playback > Play menu option to playback the previously recorded file. Edit Parameters Dialog The Edit Parameters dialog selects a parameter to monitor, record, or playback. Figure 25: Parameter Edit Dialog Not every vehicle is equipped will all sensor types and not every vehicle supports every parameter type. Therefore, the software interrogates the vehicle and creates a custom, alphabetical listing of the parameters unique to the vehicle and module selected. 47 Scan Tool Operation Sample Speed – selects the sampling speed for the sensor. High samples at up to 40mS2, Med is about 3 seconds, and Low is about every 10 seconds per sample. Units of Measure – selects the units of measure for the sensor reading, either English or Metric. Parameters – selects the vehicle parameter to monitor. The list of sensors is dynamically created depending on the types of sensors supported by the vehicle. Add and Remove Parameters To add a Parameter, follow these steps: 1 Switch to the Live Data screen as described in the section Navigation Docking Window. 2 Press the Options button in the upper right corner of the Graph pane. Alternatively, right mouse click anywhere in the Graph pane. Select the Edit Parameters menu option. 3 Press Add Parameter. 4 Select the Sampling Speed desired. 5 Select the Units of Measure to display. 6 Select the parameter to monitor within the ECU Parameters list box. 7 Repeat the above process to add more parameters. 8 Press OK. To remove a Parameter, follow these steps: 1 Select the parameter to remove in the Parameter list. 2 Press the Remove Parameter button. 3 Repeat the above process to remove more parameters. 4 Press OK. Supported Parameters The following is a list of all the live parameters supported by the software and a brief description of each parameter. Other non-live parameters, such as statuses or test results, are not listed here. Each parameter name ending with a number (e.g. “Average Economy 2”) provides the same data value as the non-numeric ending parameter. The distinction is the same parameter is obtained in different ways. Not every vehicle supports all parameters. A custom list of parameters is created unique to the vehicle connected. 2 Actual sampling speed is vehicle dependant. 48 Scan Tool Operation Parameter Parameter Parameter Average Economy Average Speed Battery Voltage Boost Pressure Digital In 1 Distance Traveled Drive Time Fuel Cost Fuel Rate Fuel Used Idle Percent Idle Time Instant Economy Absolute Evap Vapor Pres Absolute Load Value Absolute Throttle Pos B Absolute Throttle Pos C Absolute Throttle Position Accelerator Pedal Pos D Accelerator Pedal Pos E Accelerator Pedal Pos F Actual EGR A Duty Actual EGR B Duty Actual Engine Torque Air Flow Rate From MAF Alcohol Fuel Percentage Ambient Air Temperature Avg Demanded Consumption Avg Reagent Consumption Barometric Pressure Boost Pressure A Boost Pressure B Calculated Load Catalyst Temp B1-S1 Catalyst Temp B1-S2 Catalyst Temp B2-S1 Catalyst Temp B2-S2 Chrg Air Cooler Temp B1S1 Chrg Air Cooler Temp B1S2 Chrg Air Cooler Temp B1S2 Chrg Air Cooler Temp B2S1 Cmd Boost Pressure A Cmd Boost Pressure B EGR Temperature B2-S2 Engine Coolant Temp Engine Coolant Temp 1 Engine Coolant Temp 2 Engine Fuel Rate Engine Oil Temp Engine Reference Torque Engine RPM Engine Torque Idle Point 1 Engine Torque Point 2 Engine Torque Point 3 Engine Torque Point 4 Engine Torque Point 5 Equivalence Ratio B1-S1 Equivalence Ratio B1-S1 2 Equivalence Ratio B1-S2 Equivalence Ratio B1-S2 2 Equivalence Ratio B1-S3 Equivalence Ratio B1-S3 2 Equivalence Ratio B1-S4 Equivalence Ratio B1-S4 2 Equivalence Ratio B2-S1 Equivalence Ratio B2-S1 2 Equivalence Ratio B2-S2 Equivalence Ratio B2-S2 2 Equivalence Ratio B2-S3 Equivalence Ratio B2-S3 2 Equivalence Ratio B2-S4 Equivalence Ratio B2-S4 2 Evap System Vapor Pres Evap System Vapor Press Exhaust Gas Temp B1-S1 Exhaust Gas Temp B1-S2 Exhaust Gas Temp B1-S3 Exhaust Gas Temp B1-S4 Exhaust Gas Temp B2-S1 Exhaust Gas Temp B2-S2 Exhaust Gas Temp B2-S3 Exhaust Gas Temp B2-S4 Exhaust Pressure B1 Exhaust Pressure B2 Fuel Injection Timing Fuel Level Input Fuel Rail Press Rel Manifold O2 B1-S2 Wide Range V O2 B1-S3 Wide Range mA O2 B1-S3 Wide Range V O2 B1-S4 Wide Range mA O2 B1-S4 Wide Range V O2 B2-S1 Wide Range mA O2 B2-S1 Wide Range V O2 B2-S2 Wide Range mA O2 B2-S2 Wide Range V O2 B2-S3 Wide Range mA O2 B2-S3 Wide Range V O2 B2-S4 Wide Range mA O2 B2-S4 Wide Range V O2 Sensor B1-S1 O2 Sensor B1-S2 O2 Sensor B1-S3 O2 Sensor B1-S4 O2 Sensor B2-S1 O2 Sensor B2-S2 O2 Sensor B2-S3 O2 Sensor B2-S4 PM Mass Concentrate B1-S1 PM Mass Concentrate B2-S1 Reagent Tank Level Rel Throttle A Position Rel Throttle B Position Relative Accel Pedal Pos Relative Intake Air A Relative Intake Air B Relative Throttle Position Run Time NOx Warn Short Fuel Trim B1-S1 Short Fuel Trim B1-S2 Short Fuel Trim B1-S3 Short Fuel Trim B1-S4 Short Fuel Trim B2-S1 Short Fuel Trim B2-S2 Short Fuel Trim B2-S3 Short Fuel Trim B2-S4 Short Term Fuel Trim B1 Short Term Fuel Trim B2 Short Term Fuel Trim B3 Short Term Fuel Trim B4 Shrt Term Sec Fuel Trim B1 49 Scan Tool Operation Cmd Fuel Rail Pressure A Cmd Fuel Rail Pressure B Cmd Injection Pressure A Cmd Injection Pressure B Cmd Throttle Actuator A Cmd Throttle Actuator B Cmd Variable Turbo A Cmd Variable Turbo B Command Throttle Actuator Commanded EGR Commanded EGR A Duty Commanded EGR B Duty Commanded Equival Ratio Commanded Evap Purge Commanded Intake Air A Commanded Intake Air B Commanded Wastegate A Commanded Wastegate B Control Module Voltage Distance Since DTCs Clrd Distance Traveled MIL On DPF Delta Pressure B1 DPF Delta Pressure B2 DPF Inlet Pressure B1 DPF Inlet Pressure B2 DPF Inlet Temp B1 DPF Inlet Temp B2 DPF Outlet Pressure B1 DPF Outlet Pressure B2 DPF Outlet Temp B1 DPF Outlet Temp B2 Driver Demand Torque EGR A Error EGR B Error EGR Error EGR Temperature B1-S1 EGR Temperature B1-S2 EGR Temperature B2-S1 Fuel Rail Pressure Fuel Rail Pressure (abs) Fuel Rail Pressure (gauge) Fuel Rail Pressure A Fuel Rail Pressure B Fuel Rail Temp A Fuel Rail Temp B Hybrid Battery Pack Life Ignition Timing Advance Injection Pressure A Injection Pressure B Intake Air Temp B1-S1 Intake Air Temp B1-S2 Intake Air Temp B1-S3 Intake Air Temp B2-S1 Intake Air Temp B2-S2 Intake Air Temp B2-S3 Intake Air Temperature Intake Manifold Abs PresA Intake Manifold Abs PresB Intake Manifold Pressure Long Term Fuel Trim B1 Long Term Fuel Trim B2 Long Term Fuel Trim B3 Long Term Fuel Trim B4 Long Term Sec Fuel Trim B1 Long Term Sec Fuel TrimB2 Long Term Sec Fuel TrimB3 Long Term Sec Fuel TrimB4 Manifold Surface Temp Mass Air Flow A Mass Air Flow B Minutes Run with MIL On NOx Concentration B1-S1 NOx Concentration B2-S1 O2 B1-S1 Wide Range mA O2 B1-S1 Wide Range V O2 B1-S2 Wide Range mA Shrt Term Sec Fuel TrimB2 Shrt Term Sec Fuel TrimB3 Shrt Term Sec Fuel TrimB4 Time Since DTCs Cleared Time Since Engine Start Total Engine Idle Time Total Engine Run Time Total Engine Run w/PTO Total Run w/IE-ACED 1 Total Run w/IE-ACED 10 Total Run w/IE-ACED 2 Total Run w/IE-ACED 3 Total Run w/IE-ACED 4 Total Run w/IE-ACED 5 Total Run w/IE-ACED 6 Total Run w/IE-ACED 7 Total Run w/IE-ACED 8 Total Run w/IE-ACED 9 Turbo A In Compressor Turbo A In Turbine Temp Turbo A Inlet Pressure Turbo A Out Compressor Turbo A Out Turbine Temp Turbo A RPM Turbo B In Compressor Turbo B In Turbine Temp Turbo B Inlet Pressure Turbo B Out Compressor Turbo B Out Turbine Temp Turbo B RPM Variable Turbo A Variable Turbo B Vehicle Speed Warm-ups Since DTCs Clrd Wastegate A Wastegate B Air Fuel Ratio – overall air to fuel ratio of the vehicle being commanded by the vehicle ECU. Air Fuel Ratio BX-SX (up to 8) – air to fuel ratio of the vehicle computed for one bank (i.e. one oxygen sensor). Average Economy – the average fuel economy of the vehicle over time. Battery Voltage – the vehicle battery voltage. 50 Scan Tool Operation Boost Pressure – the pressure measured within the intake manifold. Distance Traveled – distance traveled by the vehicle. This is not the odometer. Drive Time – the engine running time. Fuel Cost – the cost per gallon or liter of fuel. Fuel Used – amount of fuel used by the vehicle. Idle Percent – the ratio of Drive Time vs. Idle Time. Idle Time – the engine idling time defined as the motor running with the vehicle speed at 0. Instant Economy – is defined as the instantaneous fuel economy of the vehicle (e.g. MPG). Absolute Evap Vapor Pres – the evaporative system vapor pressure normally obtained from a sensor located in the fuel tank or a sensor in an evaporative system vapor line. Absolute Load Value – indicates a percentage of peak available torque. The normalized value of air mass per intake stroke displayed as a percent. Absolute Throttle Position (up to 3) – the absolute throttle position (not the relative or learned) throttle position. Usually above 0% at idle and less than 100% at full throttle. Accelerator Pedal Pos (up to 4) – the absolute pedal position (not the relative or learned) pedal position. Actual EGR A Duty (up to 2) – actual EGR displayed as a percent. Actual Engine Torque – the calculated output torque of the engine. Air Flow Rate From MAF – indicates the airflow rate as measured by the mass airflow sensor. Alcohol Fuel Percentage – percentage of alcohol fuel contained in ethanol or methanol fuels. Ambient Air Temperature – displays the ambient air temperature. Avg Demanded Consumption – average demanded reagent consumption by the engine system either over the previous complete 48 hour period of engine operation or the period needed for a demanded reagent consumption of at least 15 liters, whichever is longer. Avg Reagent Consumption – average reagent consumption by the engine system either over the previous complete 48 hour period of engine operation or the period needed for a demanded reagent consumption of at least 15 liters, whichever is longer. Barometric Pressure – barometric pressure normally obtained from a dedicated barometric sensor. Note some weather services report barometric pressure adjusted to sea level. In these cases, the reported value may not match the displayed value. Boost Pressure A (up to 2) –the actual turbocharger/supercharger pressure. Calculated Load Value – indicates a percentage of peak available torque. Reaches 100% at wide open throttle at any altitude or RPM for both naturally aspirated and boosted engines. Catalyst Temp Bank X – Sensor X (up to 4) –the catalyst substrate temperature. Chrg Air Cooler Temp BXSX – (up to 4) – the charge air cooler temperature. 51 Scan Tool Operation Cmd Boost Pressure A (up to 2) – the ECU commanded turbocharger/supercharger pressure. Cmd Fuel Rail Pressure A (up to 2) – the commanded fuel rail pressure when the reading is referenced to atmosphere (gauge pressure). Cmd Injection Pressure A (up to 2) – the commanded injection control pressure. Cmd Throttle Actuator A (up to 2) – the commanded throttle actuator. 0% fully closed and 100% fully open. Cmd Variable Turbo A (up to 2) – the variable geometry turbocharger commanded vane position as a percent. Commanded Throttle Actuator – displays 0% when the throttle is commanded closed and 100% when the throttle commanded open. Commanded EGR (up to 3) – display 0% when the EGR is commanded off, 100% when the EGR system is commanded on, and if the EGR is duty cycled somewhere between 0% and 100%. Commanded Equival Ratio – the commanded equivalence ratio (also known as lambda) while the fuel system. Fuel systems that use conventional oxygen sensors display the commanded open loop equivalence ratio while the system is in open loop. Should report 100% when in closed loop fuel. Fuel systems that utilize wide-range/linear oxygen sensors shall display the commanded ratio in both open-loop and closed-loop operation. Commanded Evap Purge – displays 0% when no evaporative purge is commanded and 100% at the maximum commanded purge position/flow. Commanded Intake Air A (up to 2) – the commanded air intake displayed as a percent. Also known as EGR Throttle on compression ignition engineers. Commanded Wastegate A (up to 2) – the commanded wastegate position as a percent. 0% is fully closed (full boost) and 100% fully open (dump boost). Control Module Voltage – power input to the control module. Normally the battery voltage, less any voltage drop between the battery and the control module. Distance Since DTCs Cleared – distance accumulated since DTCs where cleared with a scan tool. Distance Traveled MIL On – accumulates the vehicle distance traveled while the MIL light is illuminated. DPF Delta Pressure BX (up to 2) – diesel particulate filter delta pressure. DPF Inlet Pressure BX (up to 2) – diesel particulate filter inlet pressure. DPF Inlet Temp BX (up to 2) – diesel particulate filter inlet temperature. DPF Outlet Pressure BX (up to 2) – diesel particulate filter outlet pressure. DPF Outlet Temp BX (up to 2) – diesel particulate filter outlet temperature. Driver Demand Torque – the requested torque output of the engine by the driver. 52 Scan Tool Operation EGR Error (up to 3) – error as percent of actual commanded EGR. Negative percent is less than commanded and positive is more than commanded. EGR Temperature BX-SX (up to 4) – the EGR gas temperature. Engine Coolant Temp (up to 3) – engine coolant temperature derived from an engine coolant temperature sensor or a cylinder head temperature sensor. Engine Fuel Rate – amount of fuel consumed by the engine per unit of time in liters per hour. Engine Oil Temp – engine oil temperature. Engine Reference Torque – display the engine reference torque value. This value does not change. Engine RPM – displays the current engine revolutions per minute value. Engine Torque Idle Point – the torque limit that indicates the available engine torque that can be provided by the engine at idle speed. Engine Torque Point X (up to 4) – the torque limit that indicates the available engine torque that can be provided by the engine point X of the engine map. Equivalence Ratio BX-SX (up to 16) - is defined as the ratio of the fuel-to-oxidizer ratio to the stoichiometric fuel-to-oxidizer ratio. Evap System Vapor Press – evaporative system vapor pressure normally obtained from a sensor located in the fuel tank. Exhaust Gas Temp BX-SX – exhaust gas temperature. Exhaust Gas Pressure BX – exhaust gas pressure. Fuel Injection Timing – the start of the mail fuel injection relative to Top Dead Center (TDC). Positive degrees indicate before TDC. Negative degrees indicate after TDC. Fuel Level Input – indicates the nominal fuel tank liquid fill capacity as a percent of maximum. Fuel Rail Press Rel Manifold – displays the fuel rail pressure referenced to the manifold vacuum (relative pressure). Fuel Rail Pressure – indicates the fuel rail pressure at the engine referenced to atmosphere (gauge pressure). Fuel Rail Pressure (abs) – fuel rail pressure at the engine when the reading is absolute. Fuel Rail Pressure (gauge) – displays the fuel injection rail pressure at the engine when the reading is referenced to atmosphere (gauge pressure). Fuel Rail Pressure A (up to 2) – fuel rail pressure when the reading is referenced to atmosphere (gauge pressure). Fuel Rail Temp A (up to 2) – the fuel rail temperature. Fuel Rate – the rate at which fuel is consumed by the engine in gallons/hour or liters/hour. 53 Scan Tool Operation Hybrid Battery Pack Life – the percent remaining life for the hybrid battery pack. Ignition Timing Advance – ignition timing advance for #1 cylinder (not including any mechanical advance). Injection Pressure A (up to 2) - the injection control pressure. Intake Air Temp BX-SX – displays the intake manifold air temperature. Intake Air Temperature – displays the intake manifold air temperature. Intake Manifold Abs PresA (up to 2) – intake manifold absolute pressure. Intake Manifold Pressure – indicates the manifold pressure derived from a Manifold Absolute Pressure sensor. Long Term Fuel Trim-BX (up to 4) – indicates the correction being used by the fuel control system in both open and closed loop modes of operation. Long Term Fuel Trim BX-SX (up to 8) - indicates the correction being used by the fuel control system in both open and closed loop modes of operation. Manifold Surface Temp – intake manifold surface temperature. Mass Air Flow A (up to 2) – airflow rate as measured by a vehicle MAF sensor or an equivalent source. Minutes Run with MIL On – accumulated minutes of engine run time while the MIL light is on. NOx Concentration BX-SX (up to 2) – NOx concentration. O2 Sensor BX-SX Wide Range mA (up to 8) – shows milliamps for linear or wide-ratio oxygen sensors. O2 Sensor BX-SX Wide Range V (up to 8) – shows voltage for linear or wide-ratio oxygen sensors. O2 Sensor BX-SX (up to 8) – indicates the voltage for conventional 0 to 1V oxygen sensors. O2 sensors with a different full-scale voltage shall be normalized to this range or, if a wide range sensor, may use the wide range parameters instead. PM Mass Concentration BX-SX (up to 2) – particulate matter mass concentration. Reagent Tank Level – nominal reagent tank liquid fill capacity as a percent of maximum. Rel Throttle A Position (up to 2) - relative or “learned” throttle position. Relative Throttle Position – relative or “learned” throttle position. Relative Accel Pedal Pos - relative or “learned” pedal position. Relative Intake Air A (up to 2) – actual intake airflow position displayed as a percent. Also knows as EGR Throttle Position on compression ignition engines. Run Time NOx Warn – run time of the engine while NOx warning mode is activated. 54 Scan Tool Operation Short Term Fuel Trim-BX (up to 4) – indicates the correction being used by the closed loop fuel algorithm. If the fuel system is open loop, 0% correction should be reported. Short Term Fuel Trim BX-SX (up to 8) - indicates the correction being used by the closed loop fuel algorithm. If the fuel system is open loop, 0% correction should be reported. Short Term Sec Fuel Trim BX (up to 4) – short term secondary O2 sensor fuel trim shall indicate the correction being utilized by the closed-loop fuel algorithm. If the fuel system is open loop, 0% correction should be reported. Time Since DTCs Cleared – engine run time accumulated since DTCs were cleared. Time Since Engine Start – indicates the elapsed time since the engine was started while the engine is running. Total Engine Idle Time – total engine idle time for the life of vehicle. Total Engine Run Time – total engine run time for the life of vehicle. Total Engine Run w/PTO – total engine run time with PTO (power take off) engaged for the life of the vehicle. Total Run w/IE-ACED X (up to 10) – total engine run time with Emission Increasing Auxiliary Emission Control Device active for the life of the vehicle. Turbo A In Compressor (up to 2) – turbocharger compressor inlet temperature. Turbo A In Turbine Temp (up to 2) – turbocharger turbine inlet temperature. Turbo A Inlet Pressure (up to 2) – turbocharger inlet pressure. Turbo A Out Compressor (up to 2) – turbocharger compressor outlet temperature. Turbo A Out Turbine Temp (up to 2) – turbocharger turbine outlet temperature. Turbo A RPM (up to 2) – turbocharger revolutions per minute. Variable Turbo A (up to 2) – variable geometry turbocharger actual vane position as a percent. 0% when vanes are fully bypassed and 100% when the vanes are fully utilized. Vehicle Speed – displays the vehicle road speed. Warm-ups Since DTCs Cleared – number of warm-up cycles since all DTCs were cleared via a scan tool. A warm-up is defined as the coolant temperature rising by at least 22°C (40°F) and the engine temperature reaches at a minimum 70°C (160°F) (60°C (140°F) for diesels). Wastegate A (up to 2) – actual wastegate position as a percent. 0% wastegate is off (allow full boost) and 100% fully open (dump boost). Live Data Screen The Live Data screen has two panes: List and Graph. 55 Scan Tool Operation Figure 26: Live Data Screen The Live Data screen supports recording and playback of live data. See Record/Playback for more information. The Options button in the upper right corner of each pane provides a menu of options. Alternatively, right mouse clicking inside any pane displays the Options menu. Panes are added or deleted using the Options menu items Add Graph Pane, Add List Pane, and Delete Pane. List Pane The List pane displays real-time sensor readings from the vehicle in a list format. Any number of sensors can be monitored simultaneously. Note the more sensors selected, the slower the update interval of each sensor. 1 Switch to the Live Data screen as described in the section Navigation Docking Window. 2 Press the Options button in the upper right corner of the List pane. Alternatively, right mouse click anywhere in the List pane. Select the Edit Parameters menu option. 3 Press the Add Parameter button. 4 Select a sensor from the ECU Parameters list box located on the right side of the dialog. 5 Press OK. 6 Live data now displays in the List pane. 7 Selecting Live Data > Hold temporarily suspends updating the Live data display. Selecting Hold again resumes sensor sampling. 56 Scan Tool Operation The List pane shows these values: Parameter – the selected parameter. Value – the last measured parameter reading. Units – the units of measurement for the Value. Min – the minimum Value measured. Max – the maximum Value measured. Bar Graph – the current Value reading in relation to the absolute minimum and maximum parameter values. To reset the Min and Max values, select Options > Reset Min Max. Graph Pane The Graph pane displays real-time sensor readings from the vehicle in a line graph format. Two sensors at a time may be monitored simultaneously on one Graph pane. More panes are added using the Options > Add Graph Pane option. The Live Data menu options Zoom in X, Zoom in Y, Zoom out X, and Zoom out Y zoom the graph - vertically and horizontally. Each trace can be zoomed on the vertical axis independent of the other trace by using the zoom in/out buttons next to the scroll bars. The horizontal axis zooms both traces together. When changing vertical zoom levels, the minimum and maximum display value labels change to reflect the new range. The current sensor reading will always display the correct value irrespective of the zoom range or graphical clipping. Data values exceeding the vertical graph limits, either high or low, will be clipped at the vertical maximum/minimum graph value. The graph control has a virtual trace buffer that stores many pages of graph information. Scroll right and left using the control a the bottom of the graph pane to view all the data within the trace buffer. Exact measurement values for any data point along the trace can be shown using the marker. The marker is a vertical dashed line within the graphing area. A left mouse click within the graph boundaries sets the marker position. The data point under the marker for each axis will update as the marker is moved about the graphing area. Pressing zoom in will center the horizontal axis display around the marker. This facilitates selecting a point of interest with the marker, then zooming in the horizontal axis to examine the data point. The sensor Sample Speed (High, Medium, or Low) for each trace must be the same on the Graph screen. The software enforces identical sample speeds. 1 Switch to the Live Data screen as described in the section Navigation Docking Window. 2 Press the Options button in the upper right corner of the Graph pane. Alternatively, right mouse click anywhere in the List pane. Select the Edit Parameters menu option. 57 Scan Tool Operation 3 Press the Add Parameter button. 4 Select a sensor from the ECU Parameters list box located on the right side of the dialog. 5 Press OK. 6 Live data now displays on the Graph pane. 7 Selecting Live Data > Hold temporarily suspends the Live display. Selecting Hold again resumes sensor sampling. Oxygen Sensors The Oxygen Sensors screen has two panes: Oxygen Sensor Test Results and Oxygen Sensor Output Legend. Figure 27: Oxygen Sensors Screen Oxygen Sensors Test Results Pane The Oxygen Sensors Test Results pane displays the vehicle’s oxygen sensor test results. The results displayed here are computed/measured by the vehicle’s on-board computer (ECU) last successful test. These tests are performed internally by the vehicle and are not initiated by the scan tool. These are not live values but instead the results of the ECU’s last O2 sensor test. For live O2 sensor readings, refer to any of the live sensor screens such as Graph Pane, selecting the desired O2 sensor parameters For these test results to accurate, the Oxygen Sensor test on the in the Vehicle Monitor Status section within the Vehicle Monitor Test Status pane should have a Test Status of Complete. 58 Scan Tool Operation Not all test values are applicable to all vehicles. Therefore, the list generated will vary depending on the vehicle. In addition, not all vehicles support the Oxygen Sensors screen. If the vehicle or a particular sensor does not support this feature, the screen list will be blank. The test values measured by the ECU correspond to certain attributes of the O2 sensor voltage over time waveform as shown the Oxygen Sensor Output Legend Pane. 1 Switch to the Oxygen Sensors screen as described in the section Navigation Docking Window. 2 Press the “+” icon next to the Sensor Location to display the sensor results. The Oxygen Sensors Test Results displays these values: Parameter – an oxygen sensor parameter. Value – the ECU measured test result Min - the minimum test limit for which the measured test result is compared. Max - the maximum test limit for which the measured test result is compared. Units – the units of measure for the Value. Oxygen Sensor Output Legend Pane The Oxygen Sensor Output Legend Pane shows an oxygen sensor voltage over time waveform illustration. Each parameter with in the Oxygen Sensors Test Results pane is measured is shown on the illustration. Test Results Screen The Test Results screen shows the results for on-board diagnostic monitoring test of specific components / systems that are continuously monitored (e.g. mis-fire monitoring) and noncontinuously monitored (e.g. catalyst system). The Test Results pane displays the vehicle ECU’s test results. The results displayed here are computed/measured by the vehicle’s on-board computer (ECU) last successful test. These tests are performed internally by the vehicle and are not initiated by the scan tool. These are not live values but instead the results of the ECU’s last test. Not all test values are applicable to all vehicles. Therefore, the list generated will vary depending on the vehicle. In addition, only vehicles using CAN communication protocol are supported on this screen. If the vehicle or a particular sensor does not support this feature, the screen list will be blank. The Test Results displays these values: Parameter – a test result parameter. Value – the ECU measured test result Min - the minimum test limit for which the measured test result is compared. Max - the maximum test limit for which the measured test result is compared. 59 Scan Tool Operation Units – the units of measure for the Value. Figure 28: Test Results Screen On-Board Tests Screen The On-Board Tests screen shows the bi-directional controls supported by the vehicle. Bidirectional on-board tests are commands sent by the scan tool to the vehicle to perform some action. The Bi-Directional Control pane shows the tests supported by the vehicle. If the vehicle does not support any bi-directional controls, the screen will remain blank. To run an on-board test, select the test to run then press the Run Selected On-Board Test. The vehicle will respond to the command with a status shown in the Status column. Table 4: Status Messages Status Complete General Reject Service Not Supported Sub Function Not Supported 60 Scan Tool Operation Meaning Indicates the vehicle completed the requested action successfully. Indicates that the service requested was rejected but the vehicle ECU did not specify the reason of the rejection. Indicates that the requested action will not be taken because the vehicle ECU does not support the requested service. Indicates that the requested action will not be taken because – Invalid Format Busy – Repeat Request Conditions Not Correct Or Request Sequence Error the vehicle ECU does not support the arguments of the requested message. Indicates the vehicle ECU is temporarily too busy to perform he requested operation. Indicates that the requested action will not be taken because the vehicle ECU prerequisite conditions are not met. May also occur when sequence sensitive requests are issued in the wrong order. The Bi-Directional Test Description pane provides a description for the currently selected bidirectional control within the Bi-Directional Control pane. Figure 29: On-Board Tests Screen Analyze Live Data Screen The Analyze Live Data screen provides a view of the entire live data recording. Whereas the Live Data screen plays back the recorded data, the Analyze Live Data screen shows the recorded data all at once. The Analyze Live Data screen is a data analysis tool. Numerous options are available for viewing the data, such as a stacked or side-by-side view, hiding traces, zoom in and out, and markers showing each data point. 61 Scan Tool Operation Figure 30: Analyze Live Data Screen (Side-By-Side) 62 Scan Tool Operation Figure 31: Analyze Live Data Screen (Stacked) A right mouse button click on these graph elements brings up a shortcut menu for additional options. • • • X-Axis Y-Axis Data-Cursor Viewing Recorded Live Data To open a recorded Live Data file an view on the Analyze Live Data screen: 1 Select the File > Open > Live Data File… menu option. 2 On the Open Live Data File dialog select a previously recorded live data file. 3 Press Open to open the file. 4 Switch to the Analyze Live Data screen to view the opened data. See Record/Playback on page 46 for more information on how to record a Live Data file. Analyze Tool Bar The toolbar provides quick and easy control over the function of the chart. 63 Scan Tool Operation Button Meaning Resume Button: Shows all data on all axes. Pause Button: Pauses tracking for all axes. Axes Mode Buttons: Changes the mode that the axes are in when using the mouse. The first icon puts the axes in scroll mode. The second icon puts the axes in zoom mode. TIP: Press the Ctrl keyboard key to toggle between the two modes. Zoom In/Out Buttons: Zooms all axes in or out. Select Button: Used for selecting items in the data view area. Zoom Box Button: Allows the user to draw a "Zoom Box" to zoom ALL axes. Data Cursor Button: Show or hide all data cursors. Values for each channel are displayed in a hint window next to the cursor(s). Copy Button: Copies the current component image to the clipboard. Save Button: Save chart data to an image or data file. Print Button: Print image of chart to printer. Options Button The Options dropdown button on the upper right corner of the Analyze Live Data graph title bar provides a menu to graph features. Shortcut Menu Side-By-Side View Show Markers Show File Name Show Legend Show All Parameters Hide All Parameters Parameters Meaning Switches between Side-By-Side view and the Stacked view. Shows a round dot on each data point. Shows the file name at the top of the graph. Shows a trace legend on the right side of the graph. Shows every parameter on the screen. Hides all parameters on the screen. Shows/hides individual parameters on the graph. Axis Control The chart has two axes, one x-axis (horizontal) and one or more y-axis (vertical). Each axis shows the name of the parameter, units of measure, and numbers showing the axis scale. The chart has two main modes, Axis Scroll mode and Axis Zoom mode. The modes are switched using the Axis Scroll or Axis Zoom buttons on the toolbar. Many options require dragging, which means pressing and holding the left mouse button while moving the mouse is a direction. 64 Scan Tool Operation Zoom All Axes Toolbar Zoom: All axes can be zoomed together using the toolbar. 1 Left mouse click anywhere inside the line graphing area (a dotted box will surround the entire axes and line graphing area). 2 Press the Zoom In or Zoom Out toolbar button. Zoom-Box Zoom: All axes can be zoomed using the Zoom-Box tool. 1 Select the Zoom-Box button on the toolbar. 2 Click inside the line graph area and drag a dotted line box around the area to zoom in. Mouse Zoom: The entire graph area can be dynamically zoomed using the mouse. 1 Press the Axes Zoom toolbar button. 2 Press the Select toolbar button. 3 Drag the line graphing area to dynamically zoom both the x and y-axes. Drag left and right zooms the x-axis, and up and down zooms the y-axis. Zoom One Axis Toolbar Zoom: Each axis can be zoomed independent of the other using the toolbar zoom buttons. 1 Press the Axis Zoom toolbar button. 2 Select an axis to zoom with the left mouse button (a dotted box will surround the axis). 3 Press the Zoom In or Zoom Out toolbar button. Mouse Zoom: Each axis can be dynamically zoomed using the mouse. 1 Select the Axis Zoom button on the toolbar. 2 Drag an axis to zoom in and out. Shortcut Menu Zoom: The software can also zoom a parameter to fit the entire graphing area. 1 Right mouse click an axis and select from the shortcut menu Zoom To Fit > All or Zoom To Fit > In-View. The All option zooms the line based upon the data points in the entire recorded file. The In-View option only zooms the data points that are visible within the graphing area. Scroll One Axis Mouse Scroll: Once an axis is zoomed, it can be scrolled up and down. 1 Press the Axis Scroll toolbar button. 2 Drag an axis to scroll. 65 Scan Tool Operation Scroll All Axes Mouse Scroll: The entire graph area can be scrolled in any axis direction by mouse dragging. The chart must be zoomed on at least 1 axis before you can drag the chart. 1 Press the Axis Scroll toolbar button. 2 Drag the graph in any direction causes dynamic zooming in and out. Data-Cursor Control The Data-Cursor is a red crosshair within the graphing area. Dragging the crosshair vertical line moves the cursor. As the cursor is moved, the tooltip shows the current x/y value. If the Options > Show Markers is on, round markers will mark each individual data point. Tooltip values between actual marker data points are interpolated. The data cursor can be moved to a data point marker. 1 Drag the cursor close to the marker you want to measure. 2 Release the left mouse button. The cursor will snap to the closest marker providing an exact value of the data point. Moving the data-cursor between parameters uses the shortcut menu. 1 Right mouse click anywhere on the cursor crosshair lines. 2 Select Channel from the shortcut menu, then the parameter to monitor. The data-cursor has many different measurement modes selected from the Style shortcut menu: • • • • • • Value-XY Value-X Value-Y Period Peak-Peak Frequency Analyze Data Export The Analyze Live Data screen can export data into a data file or graphics file. Save Button The Save button on the graph toolbar can save the graph as a graphics image file or as a text data file (.dat). The text data file is saves a series of X and Y values for each parameter. The file can be opened with any text editor or with a spreadsheet such as Microsoft Excel. Copy Button The Copy button on the graph toolbar can copy the data into the Windows clipboard as either a graphics image file or as text data. Once copied, the data can be pasted into another application such as word processor. 66 Scan Tool Operation Playback Pressing the Play button on the Playback Control toolbar plays the data on the Analyze Live Data screen. The tooltip on the Data Cursor will continually update as the data plays back. The Playback Pause or Stop button halts playback. Playback is particularly useful in conjunction with the Google Earth feature. See Google Earth on page 84 for more information. Code Search Screen The Code Search dialog provides an interactive search of diagnostic trouble code definitions (DTCs). Figure 32: Code Search Dialog Generic codes and enhanced codes have predefined numeric ranges as shown in Table 5: DTC Groupings. Table 5: DTC Groupings ISO/SAE Controlled (Generic) P0000 to P0999 P2000 to P2999 P3400 to P3999 Manufacturer Controlled (Enhanced) P1000 to P1999 P3000 to P3399 1 Select the Tools > Code Search… menu option. 2 Type a code into the Code to Search field (e.g. P1234). The code must start with a P, B, C or U and end with a 4-digit number. 3 Press the Search button. If a definition is found, it will display in the Search Results table. Import The Import feature allows users with the Dyno-Scan™ for Palm OS software product to import files recorded on a Palm OS device. Acceleration, Power Torque, and Scan Data files may be imported and viewed within the Dyno-Scan for Windows software. The Import feature is located on the File > Import > Palm PDB File… menu option. 67 Scan Tool Operation Export The Export feature allows files to be exported into a comma separated values (CSV) file format. Acceleration, Power Torque, and Scan Data files may be exported. The Export feature is located on the File > Export menu option. See Exporting Files on page 90 for more information regarding exporting files. 68 Scan Tool Operation CHAPTER 6 Dyno Operation The Dyno software is designed for easy operation. This section shows how to operate the Dyno features and describes the features on each screen. Dyno operations require driving the vehicle while the software records performance data. For increased safety, the software does not require user intervention during the test runs. All data is recorded for later analysis and audible tones are used to convey instructions to the user while driving. Ensure the PC, cable, and OBD II adapter do not interfere with the vehicle controls. A cable dangling in front of the foot pedals, gear shifter, or steering wheel can interfere with vehicle operation and cause a fatal accident. Always ensure the PC, cable, and OBD II adapter are securely fastened out of the way. If the scan tool cannot be safely attached as to not interfere with the vehicle controls, then do not drive the vehicle with the OBD II adapter connected to the vehicle. Never race or exceed the posted speed limit while on public highways. The dynamometer operations require accelerating to high speeds. Always uses a closed course raceway when performing dynamometer and acceleration tests. Do not attempt to operate or observe the scan tool while driving a vehicle. Driving requires the full attention of the driver. Operating or observing the scan tool will cause driver distraction and could cause a fatal accident. Theory of Operation A dynamometer, or dyno for short, is used to measure the power produced by an engine. Until now, automotive dynos were either crankshaft dynamometers or chassis dynamometers. Crankshaft dynos require the motor to be removed from the vehicle. The power is measured directly at the crankshaft, or flywheel, and is not affected by transmission and axle powertrain losses. Vehicle manufacturers spec crankshaft power on new cars and trucks. Chassis dynos test the entire vehicle. The vehicle is tied down to a large machine and the drive wheels are placed over a rotating drum. The chassis dyno tests the entire powertrain system, 69 Dyno Operation not just the crankshaft power. This is a more realistic test since it measures the power delivered to the wheels, not just the crankshaft. As such, the power figures measured are always less than with a crankshaft dyno since the powertrain robs some power from the vehicle. Clearly pulling the motor to use a crankshaft dyno is beyond most people, and chassis dynos can run $150 and hour or more to operate. Auterra Dyno-Scan™ for Windows The Auterra Dyno-Scan™ for Windows software is a newly developed device designed expressly for the automotive enthusiast. It uses the OBD II computer port located on all 1996 and newer automobiles to compute engine power, acceleration times, fuel economy, and more. The Dyno-Scan™ for Windows is the only dyno to test the vehicle in a completely real world situation that includes powertrain losses, drag from disk brakes and wheel bearings, tire rolling resistance, etc. – everything a vehicle sees on the street. Aerodynamic drag is compensated for within the calculations. So, whether your vehicle has the aerodynamics of a Chevy Suburban or a Porsche 911, the power calculations can correct for losses due to wind drag. Weather conditions affect the output of an internal combustion motor. A correction factor is applied to compensate the measurements for weather conditions and elevation. The industry standard document for horsepower and torque corrections is SAE J1349. The Dyno-Scan™ for Windows software applies this correction factor to all horsepower and torque measurements. By applying these correction factors to the dyno results, a vehicle dyno'd in Denver on a hot day will give the same results as a chilly day in San Diego. Using the Dyno-Scan™ for Windows, measurements generated are comparable with one another the world over. The dyno runs are performed in a single gear. Any gear will work, however increased accuracy is obtained if the software has an increased measurement duration. For instance, the time to accelerate from 1000 RPM to 5000 RPM in 1st gear is a shorter duration than it would be in 3rd gear. Therefore, using 2nd or 3rd gear for dyno runs offers longer test durations for greater accuracy. Extensive comparison testing on a Dynojet chassis dynamometer has shown the Dyno-Scan™ for Windows to be extremely accurate. Automatic Transmissions All automatic transmissions are equipped with a torque converter. The torque converter is designed to slip under certain conditions, such as at low RPM and under heavy load. When the torque converter slips, the gear ratio is artificially lower and the RPM is higher than if the torque converter is locked up in direct drive. At cruising speeds and under low load requirements, the torque converter locks up for increased fuel economy. Under heavy acceleration, the slippage is greatest below 3000 RPM. Above 3000 RPM the slippage is still evident but to a lesser degree. 70 Dyno Operation A slipping torque converter is perfectly normal. Automatic transmissions are designed to slip, which gives them some advantages when towing a heavy load. However, this causes an anomaly known to all chassis dynos and the Dyno-Scan™ for Windows. Since the RPM is higher than normal while the torque converter is slipping below 3000 RPM, the power vs. torque graphs may display an unnaturally large swell below 3000 RPM. This swell is the torque converter multiplying the engines available torque. The swell is normal and all dynos exhibit this behavior. The power torque figures above 3000 RPM are the real numbers generally used for evaluation. Figure 33: Power Torque Run Automatic Transmission Fast Sampling The Fast Sampling preference on the Options dialog must be enabled to achieve accurate dyno operation. Ensure this option is selected whenever using Dyno features. Dyno Files The Dyno feature use three storage file types: Power Torque – stores Power and Torque run data. Acceleration – stores Acceleration run data. Dyno Setup – stores Dyno setup variables such as vehicle weight, elevation, humidity, etc. Each of the files may be opened or created from the File > Open or File > New menu option. 71 Dyno Operation The properties of each file may be viewed and modified in either the File Properties or Dyno Setup Properties docking window. See Properties Windows for more information. Dyno Setup File Properties The Dyno Setup file properties are changed on the Dyno Setup Properties Docking Window. The file attributes are: File – file name. File Full Path –file name and path. Weight – weight of the vehicle including passengers during the run. Gear Ratio – the overall gear ratio of the vehicle, which includes transmission and axle. Tire Diameter – the vehicle tire diameter. Temperature – current outside temperature. Elevation –elevation at the test track. Humidity – current outside humidity. Pressure – current outside altimeter pressure available from www.nws.noaa.gov. Altimeter pressure is different than barometric pressure. Drag Coef – drag coefficient of vehicle. Frontal Area – the frontal area of the vehicle. Note – an optional text note. Make – Vehicle make. VIN – vehicle identification number. Year – model year of vehicle. The software can measure the gear ratio and compute the tire diameter for you. See Compute Gear Ratio for more information. Drag Coefficient and Frontal Area Common drag coefficients are usually in the range of 0.25 to 0.45 – the lower the number the less wind drag on the vehicle. Frontal areas are usually in the range of 17 to 28 sq. ft – the lower the number the less frontal area. Smaller vehicles have lower frontal areas. To get an understanding for these numbers, Table 6: Drag Coefficients and Frontal Areas list the values for different vehicle types. 72 Dyno Operation Table 6: Drag Coefficients and Frontal Areas Vehicle 2005 BMW 325i 2005 Chevrolet Corvette Z06 2006 Porsche Cayman 1999 Chevy Cavalier 2000 Ford Taurus 2000 Chevy Silverado 1500 2WD 2000 Ford Explorer 2002 Honda Insight 2002 Honda Civic Hatchback 2000 Acura Integra 2000 Volvo S40 2000 Mercedes E320 2000 Chrysler LHS Drag Coefficient 0.30 0.31 0.29 0.36 0.32 0.45 0.45 0.25 0.36 0.32 0.32 0.29 0.31 Frontal Area (sq/ft) 22.7 22.4 21.3 21.5 23.7 28.0 25.8 20.5 20.5 20.1 20.9 22.3 23.1 See the Auterra Vehicle Specifications document for more information on your specific vehicle make and model. An Internet search is another good source of drag coefficients, frontal areas and vehicle weights. The web site www.carfolio.com has specifications for thousands vehicles. Many frontal areas on the Internet are listed in metric square meter (m2). To convert to square feet (f2) multiply the metric frontal area by 10.76. 2.11 m2 x 10.76 = 22.71 f2 Calculation of Frontal Area Frontal area can be calculated for any car. The frontal area represents the front projection area of the vehicle. If one takes a straight-on picture of the front of a vehicle, it is the area included in the outline. Use the following to calculate: 1. Calculate the area of a rectangle, which would encompass the front of the vehicle (multiply width by the height). 2. Adjust the figure obtained above for areas not included, such as top rounded corners, etc. Typical adjusting values are 85 percent for cars, and 100 percent for trucks. Dyno Setup File Properties Usage The Dyno Setup file stores vehicle setup variables. When a power torque run is performed, the Dyno Setup file settings are copied into the Power Torque file. Similarly, the current Dyno Setup file is copied into the Acceleration file for acceleration runs. Once the settings are copied from the Dyno Setup file to the Power Torque or Acceleration file, there is no tie to the original Dyno Setup file. Meaning if you change a Dyno Setup file, it does not affect any stored Power Torque or Acceleration properties. 73 Dyno Operation Compute Gear Ratio Dialog The Gear Ratio screen measures the overall gear ratio of the vehicle and computes a tire diameter given the tire size. The screen is located on the Tools > Compute Gear Ration menu option. Figure 34: Compute Gear Ratio Dialog Tire Diameter Computing a tire diameter requires entering the tire size. Most passenger car tire sizes are listed as width, ratio, and rim diameter (e.g. 205/65 R15). Enter the tire size using the Width, Ratio, and Rim Dia drop down lists. Once entered, press the Compute Tire Diameter to calculate the tire diameter in inches. Many large truck tire sizes are sized differently. These tires are listed as diameter, width, and rim diameter (e.g. 31x10.5 R16). In this case, the first number is used as the tire diameter, in inches (e.g. 31”), and entered directly into the Tire Diameter field. Manufacturers are usually off very slightly from the indicated tire size. Many manufactures list the exact tire diameter on their website. If available, use the tire diameter listed on the manufacturer’s datasheet. 74 Dyno Operation Measuring Overall Gear Ratio Measuring the vehicle gear ratio involves keeping the vehicle speed steady while the software computes an overall gear ratio. The gear ratio changes with each transmission gear. Therefore, the software computes one overall gear ratio per gear ratio run (e.g. overall gear ratio for 2nd gear). The overall gear ratio is the combination of the transmission gear ratio and the final drive gear ratio. The Status field lists the status of the gear ratio run, either: Idle – no data is being gathered. Countdown to Start – shows the number of seconds until data collection begins. Collecting Data – vehicle data is being recorded. A tire diameter must be entered in the Tire Diameter field before performing a gear ratio run. Pressing Measure Gear Ratio will start a gear ratio run. Once a tire diameter is entered, pressing the Measure Gear Ratio button starts the 10-second countdown. During this time, get the vehicle moving in the gear the run is going to be performed in (e.g. 2nd gear). The vehicle RPM should be between 3000 and 4000 RPM for best results. Once the gear and RPM is achieved, keep the throttle steady and clutch out (if a manual transmission). At the end of the countdown, the software will beep. After the beep continue to keep the throttle steady until a second beep is heard (about 10 seconds). The second beep indicates the gear ratio run is over. Bring the vehicle to a complete stop. The measured overall gear ratio is displayed. Calculating Overall Gear Ratio The overall gear ratio can also be computed if the tire diameter and RPM at a speed is known. The following formula computes the overall vehicle gear ratio used by the dyno software: overall gear ratio = RPM x tire diameter / MPH x 336 Example car: 3.57 = 3000 RPM x 26” / 65 MPH x 336 The preferred method is to use the Dyno-Scan™ to compute the overall gear ratio. If calculating, always confirm your ratio calculation is correct by performing the procedure in section Confirming Gear Ratio Result. Confirming Gear Ratio Result At the bottom of the Gear Ratio screen are three live values: RPM – current measured RPM. MPH (computed) – computed MPH using only RPM and the gear ratio. MPH (real) – real MPH measured via the vehicle’s on-board computer. 75 Dyno Operation MPH (computed) will only display if values are entered into the Tire Diameter and Gear Ratio fields. If the computed MPH and real MPH values match throughout the RPM range then the gear ratio and tire diameter values are correct for this vehicle. If they do not match, adjust the Gear Ratio field up or down until the computed and real MPH match. A computed verses real MPH check in a single gear might be: 1. Keep a steady speed at 2000 RPM. 2. Confirm the computed and real MPH values match. 3. Increase speed to a steady 4000 RPM. 4. Confirm the computed and real MPH values match. Always have a passenger confirm the computed and real MPH readings match. Driving requires the full attention of the driver. Operating or observing the scan tool while driving will cause driver distraction and could cause a fatal accident. Computing a gear ratio requires an accurate speedometer. If the vehicle’s tire size is either smaller or larger than stock and the speedometer has not been recalibrated to the new wheel size, then the computed gear ratio will be incorrect. This will make the horsepower and torque figures higher or lower than expected. Using Tire Diameter and Gear Ratio After obtaining the tire diameter and gear ratio, the values are entered into the Gear Ratio and Tire Diameter fields within a Dyno Setup file. See Dyno Setup File for more information. TIP: To have multiple gear ratio setups for the same car, create a Dyno Setup file for each gear with file names like Ford1stGear, Ford2ndGear, etc. Automatic Transmissions The software uses the gear ratio on the power torque run, which is performed under heavy acceleration. The gear ratio run, however, is performed under essentially a no-load condition where the torque converter slippage is negligible. Therefore, for automatic transmissions the measured gear ratio may have to be lowered by 5 to 15% to account for the torque converter slippage. Otherwise, the power and torque curves will show lower than expected results. Dynamometer Getting Started Using the dynamometer features requires a few one-time configurations. This section summarizes those steps. 1 Obtain the drag coefficient, frontal area and vehicle weight as described in Drag Coefficient and Frontal Area on page 72. 2 Measure gear ratio of your vehicle as described in Compute Gear Ratio Dialog on page 74. 3 Create a Dyno Setup file as described Dyno Setup File Properties on page 72. 76 Dyno Operation 4 Create a Power Torque file as described in Dyno Files on page 71. 5 Connect the OBD II adapter to your vehicle. 6 Turn the vehicle ignition ON. 7 Select the File > Connect menu option. 8 To measure power and torque, proceed to Dyno Run Dialog (Power Torque) on page 78. Power Torque Screen The Power. Torque screen analyzes power and torque data gathered from a vehicle run. Figure 35: Power Torque Screen The power torque graph shows the relationship between horsepower/torque and engine RPM. The vertical axis shows the power and torque. The horizontal axis shows the engine RPM. The value at any point along the curve is obtained by placing the mouse cursor (circle) over a data point. The File Properties displays the settings used to compute the power torque curve. When the File Properties are modified the graph dynamically updates to show the newly computed curve. See Dynamic Graph Update Using File Properties for more information. Dynamic Graph Update Using File Properties The File Properties docking window offers the ability to change parameters stored within the file (see File Properties Docking Window). When the Power Torque screen is displayed, 77 Dyno Operation modifying these File Properties causes the Power Torque graph and Run Statistics to recompute based upon the new values. Similarly, the Acceleration screen offers file properties. However, only Weight within the File Properties docking window changes the computed Horsepower in the Run Statistics docking window. Unlike power and torque, the acceleration graph is not derived from mathematical computations and therefore the Acceleration File Properties are for informational purposes only. For instance, if the Power Torque file properties Elevation value is changed from 1000 feet to 9000 feet, the graph will redraw using the new input parameter. See Properties Windows for more information about changing properties. Dyno Run Dialog (Power Torque) The Dyno Run dialog acquires the data from a power torque or acceleration run. Figure 36: Power Torque Run Two files are required to perform a power torque run: a Power Torque and a Dyno Setup file. The Power Torque file is the destination for the collected run data. The Dyno Setup file provides the operational parameters used by the software to compute horsepower and torque. Both files types are created from the File > New menu option. The Status field shows the status of the run, either: Idle – no data is being gathered. Countdown to Start – shows the number of seconds until data collection begins. Collecting Data – vehicle data is being recorded. Performing a Power Torque Run Before the run, ensure the laptop, cables and OBD II adapter are securely fastened out of the way and do not interfere with vehicle operation. Once the Power Torque file and Dyno Setup files are selected, pressing the Start Run button starts the 10-second countdown. 78 Dyno Operation During the countdown, get the vehicle moving in the gear the run is going to be performed in (e.g. 2nd gear). The vehicle RPM during the countdown should be relatively low, under 2000 RPM, the throttle steady, and clutch out (if a manual transmission). At the end of the countdown, the software will beep. At the beep, floor the accelerator to achieve maximum acceleration. Once maximum RPM is reached, either shift to the next higher gear or decelerate the vehicle by letting off the accelerator. Bring the vehicle to a complete stop and press Done to stop data collection. Power Torque Run Do’s and Don’ts For safety and the most accuracy from the Dyno software, please follow the guidelines below. Keep your attention on driving – the software is designed to require no user intervention when a run is performed. Start the power torque run while the vehicle is stopped. During the countdown, accelerate to the correct gear and starting RPM. Audible tones signal when to accelerate the vehicle. Consistent vehicle setup – use the same tire pressure, same number of passengers, no A/C, windows rolled up, low beams on, radio and other accessories off. Automatic transmission – most automatic transmissions will want to downshift under hard acceleration. Experiment with higher starting RPM or roll the throttle on slowly at first to prevent a downshift. Manual transmission – ensure the clutch is completely out when the data collection starts. Steady throttle – do not “blip” the throttle during the countdown period. Keep the throttle and RPM steady. Maximum throttle – keep the throttle fully floored until maximum RPM is achieved. A dip in the RPM will cause the power torque graphs to terminate early3. Dyno setup – try to obtain current temperature, humidity, elevation, and altimeter pressure before each day of runs. Head/Tail Wind – a windy day will skew the power/torque results higher or lower depending on the wind direction. A relatively calm day provides the best results. Level Ground – an uphill climb will make the power/torque lower and conversely a downhill run will have higher than expected values. Level ground provides the best results. Heat soak – repeated runs will cause the intake manifold temperature to increase. Hot air is less dense and causes a reduction in power/torque. Just note that the first run may have slightly higher values than subsequent runs if performed back-to-back. 3 Use common sense – let off the accelerator if something gets in the way of the vehicle. 79 Dyno Operation Power Torque Run Statistics The Run Statistics docking window calculates the peak horsepower and torque at RPM values for the currently opened Power Torque file. Power – peak horsepower output during the run. Peak RPM – the RPM peak power was achieved. Torque – peak torque output during the run. Torque RPM – the RPM peak torque was achieved. Acceleration Screen The Acceleration screen analyzes acceleration data gathered from a vehicle run. Figure 37: Acceleration Screen The acceleration graph shows the relationship between vehicle speed over time. The vertical axis shows the vehicle speed in MPH. The horizontal axis shows the time in seconds. The value at any point along the curve is obtained by placing the mouse cursor over a data point. Dyno Run Dialog (Acceleration) The Dyno Run dialog acquires the data from an acceleration run. 80 Dyno Operation Figure 38: Acceleration Run Dialog Two files are required to perform an acceleration run: an Acceleration file and a Dyno Setup file. The Acceleration file is the destination for the collected run data. The Dyno Setup file provides the operational parameters used by the software to compute a 1/4-mile horsepower figure. Both file types are created from the File > New menu option. The Status field shows the current status of the run, either: Idle – no data is being gathered. Waiting to Start – waiting for the vehicle to start moving. Collecting Data – vehicle data is being recorded. Performing an Acceleration Run Before the run, ensure the laptop, cables and OBD II adapter are securely fastened out of the way and do not interfere with vehicle operation. Once the Acceleration file and Dyno Setup files are selected, press the Start Run button. The acceleration run is performed from a standing start. Once the Status field says “Waiting to Start”, the software is waiting for the vehicle to start accelerating. The acceleration run does not use RPM like a power torque run does. Therefore, while waiting to accelerate you may rev the motor or do whatever else you think will achieve the quickest acceleration time. As you accelerate down the track, you may stop the acceleration run at different data points depending on the data you’re trying to collect. 60 MPH – if acceleration stops after 60 MPH is reached, the 0-60 time will be computed. 1/8 mile – if acceleration stops after 1/8 mile reached, the 1/8-mile time and speed is computed. 1/4 mile – if acceleration stops after 1/4 mile reached, the 1/4-mile time and speed is computed. In addition, a 1/4-mile horsepower value is computed. Its best to accelerate slightly beyond a data point to ensure the software captures the vehicle passing through the data point at maximum acceleration. For instance, don’t let off the 81 Dyno Operation accelerator at exactly 60 MPH. Accelerate just beyond 60for approximately ½ second to achieve the best results. Bring the vehicle to a complete stop and press the Done button to stop data collection. Acceleration Run Do’s and Don’ts For safety and the most accuracy from the Dyno software, please follow the guidelines below. Keep your attention on driving – the software is designed to require no user intervention when a run is performed. Consistent vehicle setup – use the same tire pressure, same number of passengers, no A/C, windows rolled up, low beams on, radio and other accessories off. Head/Tail Wind – a windy day will skew the acceleration results higher or lower depending on the wind direction. A relatively calm day provides the best results. Level Ground – an uphill climb will make the acceleration lower and conversely a downhill run will have higher than expected values. Level ground provides the best results. Heat soak – repeated runs will cause the intake manifold temperature to increase. Hot air is less dense and causes a reduction in power/torque. Just note that the first run may have slightly faster values than subsequent runs if performed back-to-back. Accelerate Just Past Data Point - accelerate slightly beyond a data point (e.g. 60 MPH, 1/8 mile, or 1/4 mile) to ensure the software captures the vehicle passing through the data point at maximum acceleration If the vehicle’s tire size is either smaller or larger than stock and the speedometer has not been recalibrated to the new wheel size, then the computed acceleration figures will be incorrect. Acceleration runs require an accurate speedometer. Acceleration Run Statistics The Run Statistics screen computes times and horsepower values based upon how fast the vehicle accelerates. Top Speed – maximum speed achieved during the run. 0 to 60 Time – how fast in seconds the vehicle traveled from 0 to 60 MPH. 1/8 Mile Speed – how fast in MPH the vehicle was traveling at the 1/8-mile mark. 1/8 Mile Time – time in seconds, the vehicle traveled a 1/8-mile. 1/4 Mile Speed – how fast in MPH the vehicle was traveling at the 1/4-mile mark. 1/4 Mile Time – time in seconds, the vehicle traveled a 1/4-mile. 1/4 Mile HP – a rough calculation of horsepower based strictly on 1/4-mile time and vehicle weight. 82 Dyno Operation N/A will be displayed in a column if the vehicle didn’t travel far enough to compute the statistic. 83 Dyno Operation CHAPTER 7 Google Earth Google Earth is a geographic information system (GIS) and provides a 3D software representation of Earth using satellite imagery. It provides you with the ability to move about the Earth and view any location on the planet from any altitude or viewing angle. Google Earth is a free application and may be downloaded from http://earth.google.com. Ensure you are running version 4.1 or higher. DashDyno and Dyno-Scan for Windows utilize Google Earth to correlate recorded vehicle sensor data with the vehicle’s georeferenced position on Earth. This is an extremely powerful tool in analyzing vehicle data whether on a racetrack, off road or around town. DashDyno records OBD II vehicle sensors data, analog voltages and GPS data onto the SD card. Dyno-Scan for Windows then opens the file and if it contains GPS data, Dyno-Scan for Windows interactively sends coordinate information to Google Earth. You do not need to interact with Google Earth –Dyno-Scan for Windows updates the camera position and viewing angles automatically. The Google Earth feature within the Dyno-Scan for Windows software may only be used in conjunction with an Auterra DashDyno SPD data logger. Dyno-Scan for Windows cannot connect to a GPS and will not record GPS data. The software reads GPS data recorded by an Auterra DashDyno. 84 Google Earth When a DashDyno live data file containing GPS data is opened, Google Earth draws a yellow line showing the complete vehicle path and flies to that location. Moving the data cursor on the Analyze Live Data screen causes Google Earth to immediately fly to the new location on the yellow line. The Google Earth yellow pushpin shows the current GPS location within the data file. Two Google Earth view modes are supported: Stationary and Follow Vehicle. In stationary mode, the Google Earth view elevation and position does not move. This is useful if you want to see the entire vehicle path. In Follow Vehicle mode, Google Earth zooms to the vehicle georeferenced location. If the Play button on the Playback Control toolbar is pressed, the line graph data within the Analyze Live Data window starts to move and the Google Earth position continually updates during playback. If the Follow Vehicle option is selected, you will follow behind the vehicle position as it moves. To analyze a DashDyno live data file: 1 Using your DashDyno and GPS receiver, record GPS and vehicle sensor data. See the DashDyno SPD User Guide for more information on recording data using DashDyno. 85 Google Earth 2 Eject the SD card from DashDyno and insert into your PC card reader connected to your computer. 3 Start the Dyno-Scan for Windows software. 4 Go to the Tools > Options dialog then select the Google Earth tab. 5 Check the Enable Google Earth checkbox. Press OK. 6 Select the File > Open > Live Data File menu option. 7 Go to the PC card reader drive and open the DashDyno live data file. Live data files are stored on the SD card within the LIVE directory (e.g. f:\LIVE\MY_DATA.ld). 8 Google Earth will start automatically when the file is opened. A yellow vehicle path line is drawn and the camera zooms over the entire vehicle path. 9 Select the Analyze Live Data icon on the Navigation docking window. 10 Press the Data Cursor button on the Analyze Tool Bar. 11 Left mouse click the data cursor and drag it to a new location. Google Earth will reposition to the vehicle’s georeferenced location as recorded within your data file. 12 Press the Play button on the Playback Control toolbar. The line graph will start to move and Google Earth will continually update its position during playback. See Analyze Live Data Screen on page 61 for more information on how to use Analyze Live Data screen. Google Earth Options Dyno-Scan for Windows has settings to control how GPS data is displayed within Google Earth. The user’s point of view within Google Earth is called a camera position. The camera position can be adjusted for altitude and viewing angle. The Google Earth settings with the Dyno-Scan for Windows Tools > Options dialog are: Enable Google Earth – when checked, Google Earth is used to display GPS position information from within a live data file. Playback Mode – the Stationary option holds the camera position and attitude steady during playback. The camera position when the Play button is pressed is used as the stationary position. The Follow Vehicle option zooms the camera behind the vehicle position. When the vehicle position is updated, the camera view will follow. GPS Heading Camera View – uses the heading (i.e. direction of travel) from the GPS to orient the camera view. During playback, the camera point of view always faces the vehicle’s direction of travel. Otherwise, the camera points north. Playback Speed – controls the playback speed. Refresh Rate – controls how often Google Earth is sent GPS positional data. Camera Tilt Angle – controls the tilt of the camera position. 0 degrees looks straight down and 80 degrees looks toward the horizon. 86 Google Earth Camera Range – controls how far from the ground the camera is positioned. Enable Automatic Window Tiling – when checked, the software vertically tiles DynoScan and Google Earth so both application windows are visible. Tile Percentage – the horizontal percentage of screen width Google Earth will occupy. The Google Earth toolbar prevents Google Earth from sizing to a small horizontal screen width. To allow a small screen width, uncheck the menu View > Toolbar within Google Earth. Improving Playback Speed The Analyze Live Data screen Playback feature can be slow on an older computer. If this is the case, here are some tips: 87 Google Earth 1 On Dyno-Scan, slow the Refresh Rate and/or Playback Speed. For instance, setting a playback speed of 0.2 seconds and a refresh speed of 1.0 second’s means every 5th data point Google Earth will receive a new GPS coordinate. 2 On Dyno-Scan, turn off the round markers by selecting the Options button pull down on the Analyze Live Data title bar and unchecking Show Markers. 3 On Google Earth’s Tools > Options… dialog, set the Detail Area to Small and set the Terrain Quality to Lower. Its best to restart Google Earth after making changes. 4 On Google Earth’s Layers sidebar, uncheck unused options such as Roads, Terrain, Dining, etc… 5 On Google Earth, select the View > Sidebar menu option to hide the sidebar. This will prevent needless refreshing of the sidebar during playback. Working Without an Internet Connection Google Earth obtains satellite imagery from the Internet. If you want to use Google Earth away from the Internet (e.g. at track day), you’ll need to cache the images to your computer disk drive. To cache satellite imagery, while connected to the Internet move the Google Earth view around the location you want to view when not connected to the Internet. As you fly around, look at the area from different directions and attitudes. This will cause the satellite images to be stored within the Google Earth memory cache for use when offline. If necessary, the Google Earth cache can be increased by going to the Tools > Options menu then select the Cache tab. 88 Google Earth CHAPTER 8 Demo Mode Demonstration mode simulates all vehicle data. This mode facilitates learning about scan tool features without connecting to a live vehicle. Enable Demo Mode Demo mode is enabled from the File > Connect dialog. 1 Select the “Connect to Vehicle Demo” checkbox on the Connect screen. Figure 39: Connect to Vehicle Demo 2 Press the “Connect to Vehicle” button. With demo mode enabled, all vehicle data is simulated – even if the scan tool is connected to a vehicle. 89 Demo Mode CHAPTER 9 Exporting Files Four different export formats available within the software. 1 Single-Point Row CSV File 2 Multi-Point Row CSV File 3 TrackVision File 4 Analyze Live Data Save All file formats may be imported into a spreadsheet application such as Microsoft Excel. Once the data is imported into the spreadsheet, numerous data manipulations are possible such as graphing and analyzing the data. Single-Point Row CSV File Format This file format exports the data into a one-data point per row format. Each row within the spreadsheet corresponds to one data sample. The sample time on each row is the exact time the data sample was taken. The CSV file is a tabular format of data placed into rows and columns. The first row contains basic file information: File Name – the name of the PDB file. Make – make of the vehicle. Year – the year of the vehicle. VIN – the optional VIN number field. Note – the optional note field. 90 Exporting Files Figure 40: Single-Point Row CSV File in Excel The second row contains the column headings for the scan data. Metric values are always included in the CSV file, however if there is no corresponding English units of measure for a sensor then no conversion is shown. Sample – the sample number. Name– the parameter name. Sample Time – the time stamp when the data was sampled in seconds. Value Metric – the sensor value in Metric units. Units Metric – the Metric units of measure. Value English – the sensor value in English units. Units English – the English units of measure. To export a live data Single-Point Row CSV File: 1 Select the File > Export > Single-Point Row CSV File… menu option. 2 On the Open Source Export File dialog, select the file type “Live Data File (*.ld)” on the “Files of type:” dropdown. 3 Within the same Open Source Export File dialog, go to the directory where the live data file is stored in. Click the “Look in:” dropdown to change directories. 91 Exporting Files 4 Single click to highlight the live data file then press the Open button. Alternatively, double click the live data file. 5 On the Save Destination CSV File dialog, type a file name within the “File name:” box and press the Save button. 6 The data is now exported to the CSV file name you entered. Multi-Point Row CSV File This file format exports the data in a multiple data points per row format. Each row within the spreadsheet corresponds to one or more data samples. The data arrives from the vehicle at different times. A single time stamp cannot accurately identify the exact moment when multiple vehicle samples arrive4. Therefore, the sample time used on each row is the time of the last sensor to be sampled on that row. The order of the columns is not important and does not indicate the order in which the sensors were sampled. All the sampled data within a certain time period is combined into a single row. If a new data sample is not available for a row within the time period, then the last known good data sample is inserted instead. The multi-point row CSV file format may be easier to use than the single-point row CSV format at the expense of loosing the exact time stamp for each data sample point. Figure 41: Multi-Point Row CSV File in Excel 4 On CAN bus equipped vehicles with CAN 6x mode enabled up to 6 sensors can be simultaneously sampled from the vehicle. 92 Exporting Files To export a live data Multi-Point Row CSV File: 1 Select the File > Export > Multi-Point Row CSV File… menu option. 2 On the Open Source Export File dialog, select the file type “Live Data File (*.ld)” on the “Files of type:” dropdown. 3 Within the same Open Source Export File dialog, go to the directory where the live data file is stored in. Click the “Look in:” dropdown to change directories. 4 Single click to highlight the live data file then press the Open button. Alternatively, double click the live data file. 5 On the Save Destination CSV File dialog, type a file name within the “File name:” box and press the Save button. 6 The data is now exported to the CSV file name you entered. TrackVision CSV File TrackVision is a 3rd party software package that merges in-car video recorded with a camcorder and vehicle data recorded with DashDyno. The TrackVision software synchronizes the video and data and creates a virtual dashboard overlay within your video. Engine RPM, throttle position, vehicle speed, GPS position and more can be displayed. The resulting movie is exported to different video file formats or a DVD. TrackVision can be purchased at www.trackvision.net. To export a Live Data file into a format suitable for import within TrackVision, select the File > Export > TrackVision File… menu option. For more information on using TrackVision, refer to Auterra’s DashDyno SPD User Guide. Analyze Live Data Save The Save icon on the Analyze Live Data Screen toolbar exports a .dat file. This tab delimited file may be imported into a spreadsheet using a spreadsheet import data feature. See Save Button on page 66 for more information regarding the Analyze Live Data Save button. Merge Files The File > Export > Merge Files… menu option merges two or more live data files into a new, merged live data file. The merged file can then be opened using the File > Open > Live Data File… menu option or exported to a CSV file for viewing inside a spreadsheet. The Merge Files feature is particularly useful when merging Auto-Record live data files created on an Auterra DashDyno SPD device. Auto-Record allows recording data over days, weeks or months over which time multiple live data files are saved. Using the Merge Files feature, these discrete live data files are merged into a single live data file for a complete long-term data view. See the DashDyno SPD user guide for more information regarding the Auto-Record feature. 93 Exporting Files Note these key points when using the Merge Files feature: • Only merge live data files with the same recorded parameters - For instance, if you have two files both with Engine RPM and Vehicle Speed merging will combine these two files into a single combined new file. However, if you have two files, one with Engine RPM and Vehicle Speed and the other with say Coolant Temperature, the two files don’t share recorded parameters and thus will not result in a correctly merged file. • The order of files selected on the Merge Input Files dialog is the order of merging – The Merge Input Files dialog allows highlighting two or more files. The order of the files in the “File name:” box is the order in which the files are merged. The files listed first in the “File name:” box will the first in the output file, and so on, until the last file. For instance, if the “File name:” box shows “AR_1.ld” “AR_2.ld” “AR_3.ld” this means AR_1.ld is added to the merged file first, then AR_2.ld, then finally AR_3.ld. Press and hold the CTRL key and click one file at a time in the Merge Input Files dialog. Click the oldest recorded file first up to the newest in order. This will create the files within the “File name:” box in the correct newest-to-oldest order. Alternatively, press and hold the SHIFT key and click the oldest file first, then click the newest file. This will select a range of files in a newest-to-oldest order. • Merge smaller subset of your data if single merged file is too large – If the merged live data file is too large to be opened on your PC, create multiple merged live data files. For instance, if you have 200 live data files, merge 100 into one file and 100 into another then analyze each file independently. • Corrupt file data is ignored during a merge – If the DashDyno is accidentally unplugged during a recording, some data might be lost because the file did not save to the SD card. Normally a File > Open will not open a partially saved file. However, the Merge Files feature will try to exact as much data as possible from a partially saved file. If no data can be extracted, the file is ignored and the next merge file is processed. Over time, the Auto-Record feature on DashDyno saves data to multiple files reducing the amount of data lost if unplugged during recording. To merge live data files: 1 Select the File > Export > Merge Files… menu option. 2 On the Merge Input Files dialog, select the two (or more) live data files to merge. Press and hold the CTRL key and click one file at a time in the Merge Input Files dialog. Click the oldest recorded file first up to the newest in order. This will create the files within the “File name:” box in the correct newest-to-oldest order. Alternatively, press and hold the SHIFT key and click the oldest file first, then click the newest file. This will select a range of files in a newest-to-oldest order. For instance, if the “File name:” box shows “AR_1.ld” “AR_2.ld” “AR_3.ld” this means AR_1.ld is added to the merged file first, then AR_2.ld, then finally AR_3.ld. 3 Once the files are selected, press the Open button. 94 Exporting Files 4 On the Merge Output File dialog, type a file name within the “File name:” box and press the Save button. This is the destination for the merged file output. 5 The data is merged to the file name you entered. 95 Exporting Files CHAPTER 9 PID Builder PID Builder is an advanced feature of the Dyno-Scan software to create unique live data parameters to be viewed and recorded on the Live Data screen. PID Builder allows direct interaction with the vehicle computer to create custom PIDs (parameter IDs). Custom PIDs definitions are saved to a .pid file to be opened and used by the software. The Dyno-Scan software contains all the industry-standardized parameters for OBD II equipped vehicles. For instance, Engine RPM and Coolant Temperature are standardized parameters. Each vehicle is also equipped with additional enhanced parameters that are unique to a particular make and/or model vehicle. The PID Builder allows you to tap into these enhanced parameters for your car by creating custom PID definitions. After a PID is tested on the PID Builder screen, it can be saved as a .pid file. The .pid files are automatically opened by the Dyno-Scan for Windows software and added to the Edit Parameters dialog to be selected for live data viewing. Auterra may offer some commonly requested PID files for download and use with your software. This way, you’ll just need to download the PID files appropriate for your vehicle without detailed knowledge of the OBD II protocol. For advanced users, information about enhanced PIDs may be also be located on the Internet or news forums discussing your specific vehicle, or discovered interactively using the PID Builder dialog. Install Existing PID Files The Dyno-Scan software reads the PID files from the My Documents\Dyno-Scan directory. Any PID files located in this directory are read at startup. Displaying the Edit Parameters dialog from the Live Data screen will show the parameters loaded from the PID Files. 1 Download or create a PID File. 2 Copy the PID File into the My Documents\Dyno-Scan directory. 3 Go to the Live Data screen and open the Edit Parameters dialog. The PID File parameter will be listed in the Parameters box. In the sample below, Trans Temp is the parameter name. 96 PID Builder OBD II Protocol Background On-Board Diagnostics II is the industry standard for communicating with the vehicle using scan tool equipment such as the Dyno-Scan for Windows. A bit of knowledge about the OBD II communication protocol used on the vehicle is essential to effectively using PID Builder. This section provides a brief tutorial on OBD II. However, the Internet has many detailed articles covering OBD II in more detail. Generic messages are well-defined industry standards that all carmakers adhere to. Enhanced messages are defined by each manufacturer to support unique features. OBD II defines Modes and PIDs (parameter IDs). The generic Mode 01 is used to display live data. PID 0C, for instance, is used to extract engine RPM. In additional to Mode and PID information, there is additional header information. This can change depending on whether the query is generic or enhanced. It can also change depending on the exact protocol being used. The OBD II standard is actually comprised of many different protocols. VPW, PWM, ISO, KWP and CAN bus. The meaning of these acronyms is not important, only that the scan tool uses these different protocols depending on the vehicle make/model/year. After connecting to the vehicle, the Dyno-Scan software shows the protocol in the lower left corner of the screen next to the “Connected”. Table 7: Header Bytes (Generic) PWM VPW 97 PID Builder 61 68 6A 6A F1 F1 ISO KWP CAN (SI 250k), CAN (SI 500k) CAN (EI 250k), CAN (EI 500k) 68 C2 00 18 6A 33 00 DB F1 F1 07 33 DF F1 The enhanced messages may change the header bytes. Here are some examples of enhanced header bytes. This is not an exhaustive list, but just a few samples. Table 8: Header Bytes (Enhanced) PWM VPW ISO CAN (SI 250k), CAN (SI 500k) C4 6C 6C 00 10 10 10 00 F1 F1 F1 07 E0 A complete non-CAN message example to request engine RPM. A PID may be one or two bytes depending on the parameter requested. Header Bytes 68 6A F1 Mode 01 PID 0C A complete non-CAN message response to the engine RPM. The Mode has 40 added to the original Mode 01. The engine RPM data will be returned in the last two bytes. Header Bytes 48 6B 10 Mode 01 PID 0C Data ?? Data ?? A complete CAN message example to request engine RPM. Length is the number of bytes after the header bytes. A PID may be one or two bytes depending on the parameter requested. Header Bytes 00 00 07 DF Length 02 Mode 01 PID 02 A complete CAN response to the engine RPM request. The length is the number of bytes after the header. The Mode has 40 added to the original Mode 01. The engine RPM data will be returned in the last two bytes. Header Bytes 00 07 E0 Length 04 Mode 41 PID 0C Data ?? Data ?? PID Builder Dialog The PID Builder is used to create PID files. The dialog is interactive meaning the data is send, received and displayed on the dialog allowing you to refine the PID in real-time. 98 PID Builder The PID Builder dialog has these fields: Vehicle Send Message – the message bytes sent to the vehicle. Send Button – to send the Vehicle Send Message to the vehicle for interactive testing. Vehicle Recv Message – the raw data bytes received from the vehicle. Each hexadecimal byte is separated by a hyphen (‘-‘). Name – the name of the parameter. This is the name shown on the Live Data screen. Units – the parameter units of measure. Min Value – the minimum value of the parameter. This is only used for scaling graph controls and doesn’t affect the value displayed. Max Value – the maximum value of the parameter. This is only used for scaling graph controls and doesn’t affect the value displayed. Scale – the scale factor applied to the measured parameter data. Offset – the offset applied to the measured parameter data. Precision – the decimal places of precision for the measured parameter data. Value Bit Offset – the starting bit location of the measured parameter data. Each data byte is 8-bits. Value Bit Length – the length of the measured parameter data. Vehicle Recv Decoded Message – the fully decoded message using the supplied name, units, scale, offset, precision, value bit offset and value bit length. This is the value that will display on the Live Data screen. Open PID – Opens a PID File. Save PID – Saves the dialog information to a PID File. 99 PID Builder Figure 42: PID Builder Dialog In the example shown above, within the Vehicle Recv Raw Message window notice the data returned from the vehicle. 00-07-33-04-41-0C-3E-3E-00-00 This is a CAN protocol message and the engine RPM data is located in 7th and 8th bytes: 3E and 3E. Value Bit Offset is where the data starts, so in this example: 48 bits = 6 bytes x 8 bits per byte Value Bit Length is how long the data is. Engine RPM is two bytes so: 16 bits = 2 bytes x 8 bites per byte The hexadecimal 3E3E converted to decimal is 15934. The formula used in the scale and offset is: Displayed Value = (Data x Scale) + Offset 100 PID Builder 3984 RPM = (15934 x 0.25) + 0 Create PID File 1 Select File > Connect to connect to the vehicle. 2 Select Tools > PID Builder… to open the PID Builder dialog. The dialog will be pre-populated with header, Mode and PID information to create an Engine RPM PID file based on the current vehicle protocol (e.g. VPW, CAN, …). 3 Change the Vehicle Send Message to custom PID, or just accept the default values. 4 Press Send. 5 Notice the Vehicle Recv Raw Message and Vehicle Receive Decoded Message are populated. Verify these are correct per your PID information. 6 Press the Save PID button. Create a name for the PID File and store the file in the My Documents\Dyno-Scan folder. 7 Press OK to close the PID Builder dialog. 8 Go the Live Data screen. 9 Right mouse click in a List or Graph pane. Select Edit Parameters from the popup shortcut menu. 10 Press Add Parameter. 11 The Name on PID Builder that you supplied for your PID will display in the Parameters box. 12 Select the parameter and press OK. 13 The data for your newly created PID will start to display on-screen. Open PID File 1 Select Tools > PID Builder… to open the PID Builder dialog. 2 Press Open PID. 3 Open any .pid file. The data on PID Build will update showing the contents of the PID File. 101 PID Builder CHAPTER 10 Troubleshooting This section contains solutions for common problems encountered with the scan tool. Scan Tool Connects but No Live Data If no live data is displayed in the Live Data screens, try the following remedies: 1 Right mouse click in a Graph or List pane and select “Edit Parameters” from the shortcut menu and add the parameters you want to monitor. 2 Disable the Fast Sampling option in the Tools > Options dialog. 3 Disable the CAN 6x Communication option in the Tools > Options dialog. Can’t Open COM Port The COM port is either busy or does not exist, try the following remedies: 1 Ensure the USB or Bluetooth drivers are installed correctly. See sections USB Driver Installation or Bluetooth Driver Installation depending on your adapter type. No Communication (Scan Tool) If the No Communication (Scan Tool) dialog appears, this means the software cannot communicate with the vehicle. Try the following remedies: 1 Ensure the vehicle ignition is turned on. Vehicle does not have to be running; however, it can be. 2 Try pressing the “Connect to Vehicle” button again. 3 Ensure the OBD II Adapter is securely plugged into the vehicle’s OBD II connector. 4 Ensure the vehicle is OBD II compliant (see Supported Vehicles). 5 Ensure no vehicle fuses are blown. OBD II adapter power is derived from the vehicle and a blown fuse could prevent power from reaching the scan tool. Sometimes the OBD II connector and cigarette lighter share the same fuse. 6 Ensure the USB or Bluetooth drivers are installed correctly. See sections USB Driver Installation or Bluetooth Driver Installation depending on your adapter type. 7 Ensure the Bluetooth adapter is paired with your PC. See Bluetooth Pairing for more information. 102 Troubleshooting 8 Ensure the PC is connected to the Bluetooth device. You may need to go to My Bluetooth Places, right mouse click on the RN42 device and select “Connect”. 9 Ensure you have entered the pairing or passkey for the Bluetooth adapter. The passkey is: 1234. No Communication (Vehicle) If the No Communication (Vehicle) dialog appears, see No Communication (Scan Tool). Lost Communication If the Lost Communication dialog appears, this means the software initially established communication but subsequently lost it. Try the following remedies: 1 Ensure the OBD II Adapter is securely plugged into the vehicle’s OBD II connector. Live Data Screen Is Blank Right mouse click in the center of the screen and select “Add List Pane” or “Add Graph Pane” from the shortcut menu to add new panes. Oxygen Sensors Test Results Pane is Blank Not all vehicles support the features provided by the Oxygen Sensor screen. If the vehicle does not support this feature, the data for the screen will be blank. Freeze Frame Pane is Blank If the vehicle has not detected a failure that caused the Check Engine to illuminate, the data for the Freeze Frame pane will be blank. Clearing Codes Did Not Work or MIL Didn’t Turn Off There are a few possible causes for the check engine light not to extinguish or the DTCs to reappear on the scan tool. First, if the problem is not fixed the DTC may return immediately for problems such as misfires, open or shorted sensors, etc. Second, some vehicles can't be running when the memory is cleared. In these cases, ensure the key is on but the engine is off before attempting to clear the memory. Last, some vehicles require, after the codes are cleared, for the ignition key to be turned off and then on again before the MIL light actually turns off. 103 Troubleshooting APPENDIX A Diagnostic Trouble Codes A Diagnostic Trouble Code (DTC) is a 5-digit value starting with a letter. The DTC’s codes listed here are generic to all manufacturers. These generic Diagnostic Trouble Codes are those codes where industry uniformity has been achieved. However, each vehicle manufacturer may optionally create new codes beyond the generic ones. The Auterra DynoScan™ for Windows can read these enhanced manufacturer specific codes. The DTC database files included with the software incorporates thousands of more codes, both generic and enhanced, than those listed here. The following listing simply provides an overview of the types of codes available. Diagnostic Trouble Code Format Structure The Diagnostic Trouble Code numbering follows a standardized structure. All Diagnostic Trouble Codes have a letter followed by a 4-digit number (e.g. P1234). The first letter indicates the type of code: P = Powertrain C = Chassis B = Body U = Network Communication The remaining 4-digit number specifies the problem within that system. P00XX Fuel and Air Metering and Auxiliary Emission Controls P0010 P0011 P0012 P0013 P0014 P0015 “A” Camshaft Position Actuator Circuit “A” Camshaft Position - Timing Over-Advanced or System Performance “A” Camshaft Position - Timing Over-Retarded “B” Camshaft Position - Actuator Circuit “B” Camshaft Position - Timing Over-Advanced or System Performance “B” Camshaft Position -Timing Over-Retarded P0020 P0021 P0022 P0023 P0024 P0025 “A” Camshaft Position Actuator Circuit “A” Camshaft Position - Timing Over-Advanced or System Performance “A” Camshaft Position - Timing Over-Retarded “B” Camshaft Position - Actuator Circuit “B” Camshaft Position - Timing Over-Advanced or System Performance “B” Camshaft Position - Timing Over-Retarded P0030 P0031 P0032 P0033 HO2S Heater Control Circuit HO2S Heater Control Circuit Low HO2S Heater Control Circuit High Turbo Charger Bypass Valve Control Circuit 104 Diagnostic Trouble Codes (Bank 1) (Bank 1) (Bank 1) (Bank 1) (Bank 1) (Bank 1) (Bank 2) (Bank 2) (Bank 2) (Bank 2) (Bank 2) (Bank 2) (Bank 1 Sensor 1) (Bank 1 Sensor 1) (Bank 1 Sensor 1) P0034 P0035 P0036 P0037 P0038 Turbo Charger Bypass Valve Control Circuit Low Turbo Charger Bypass Valve Control Circuit High HO2S Heater Control Circuit HO2S Heater Control Circuit Low HO2S Heater Control Circuit High (Bank 1 Sensor 2) (Bank 1 Sensor 2) (Bank 1 Sensor 2) P0042 P0043 P0044 HO2S Heater Control Circuit HO2S Heater Control Circuit Low HO2S Heater Control Circuit High (Bank 1 Sensor 3) (Bank 1 Sensor 3) (Bank 1 Sensor 3) P0050 P0051 P0052 HO2S Heater Control Circuit HO2S Heater Control Circuit Low HO2S Heater Control Circuit High (Bank 2 Sensor 1) (Bank 2 Sensor 1) (Bank 2 Sensor 1) P0056 P0057 P0058 HO2S Heater Control Circuit HO2S Heater Control Circuit Low HO2S Heater Control Circuit High (Bank 2 Sensor 2) (Bank 2 Sensor 2) (Bank 2 Sensor 2) P0062 P0063 P0064 P0065 P0066 P0067 HO2S Heater Control Circuit HO2S Heater Control Circuit Low HO2S Heater Control Circuit High Air Assisted Injector Control Range/Performance Air Assisted Injector Control Circuit or Circuit Low Air Assisted Injector Control Circuit High (Bank 2 Sensor 3) (Bank 2 Sensor 3) (Bank 2 Sensor 3) P0070 P0071 P0072 P0073 P0074 P0075 P0076 P0077 P0078 P0079 P0080 P0081 P0082 P0083 P0084 P0085 P0086 Ambient Air Temperature Sensor Circuit Ambient Air Temperature Sensor Range/Performance Ambient Air Temperature Sensor Circuit Low Input Ambient Air Temperature Sensor Circuit High Input Ambient Air Temperature Sensor Circuit Intermittent Intake Valve Control Solenoid Circuit Intake Valve Control Solenoid Circuit Low Intake Valve Control Solenoid Circuit High Exhaust Valve Control Solenoid Circuit Exhaust Valve Control Solenoid Circuit Low Exhaust Valve Control Solenoid Circuit High Intake valve Control Solenoid Circuit Intake Valve Control Solenoid Circuit Low Intake Valve Control Solenoid Circuit High Exhaust Valve Control Solenoid Circuit Exhaust Valve Control Solenoid Circuit Low Exhaust Valve Control Solenoid Circuit High (Bank 1) (Bank 1) (Bank 1) (Bank 1) (Bank 1) (Bank 1) (Bank 2) (Bank 2) (Bank 2) (Bank 2) (Bank 2) P01XX Fuel and Air Metering P0100 P0101 P0102 P0103 P0104 P0105 P0106 P0107 P0108 P0109 P0110 P0111 P0112 P0113 P0114 P0115 P0116 P0117 Mass or Volume Air Flow Circuit Mass or Volume Air Flow Circuit Range/Performance Problem Mass or Volume Air Flow Circuit Low Input Mass or Volume Air Flow Circuit High Input Mass or Volume Air Flow Circuit Intermittent Manifold Absolute Pressure/Barometric Pressure Circuit Manifold Absolute Pressure/Barometric Pressure Circuit Range/Performance Problem Manifold Absolute Pressure/Barometric Pressure Circuit Low Input Manifold Absolute Pressure/Barometric Pressure Circuit High Input Manifold Absolute Pressure/Barometric Pressure Circuit Intermittent Intake Air Temperature Circuit Intake Air Temperature Circuit Range/Performance Problem Intake Air Temperature Circuit Low Input Intake Air Temperature Circuit High Input Intake Air Temperature Circuit Intermittent Engine Coolant Temperature Circuit Engine Coolant Temperature Circuit Range/Performance Problem Engine Coolant Temperature Circuit Low Input 105 Diagnostic Trouble Codes (Bank 2) P0118 P0119 P0120 P0121 P0122 P0123 P0124 P0125 P0126 P0127 P0128 Engine Coolant Temperature Circuit High Input Engine Coolant Temperature Circuit Intermittent Throttle/Pedal Position Sensor/Switch A Circuit Throttle/Pedal Position Sensor/Switch A Circuit Range/Performance Problem Throttle/Pedal Position Sensor/Switch A Circuit Low Input Throttle/Pedal Position Sensor/Switch A Circuit High Input Throttle/Pedal Position Sensor/Switch A Circuit Intermittent Insufficient Coolant Temperature for Closed Loop Fuel Control Insufficient Coolant Temperature for Stable Operation Intake Air Temperature Too High Coolant Thermostat (Coolant Temperature Below Thermostat Regulating Temperature) P0130 P0131 P0132 P0133 P0134 P0135 P0136 P0137 P0138 P0139 P0140 P0141 P0142 P0143 P0144 P0145 P0146 P0147 P0148 P0149 P0150 P0151 P0152 P0153 P0154 P0155 P0156 P0157 P0158 P0159 P0160 P0161 P0162 P0163 P0164 P0165 P0166 P0167 P0168 P0169 P0170 P0171 P0172 P0173 P0174 P0175 O2 Sensor Circuit O2 Sensor Circuit Low Voltage O2 Sensor Circuit High Voltage O2 Sensor Circuit Slow Response O2 Sensor Circuit No Activity Detected O2 Sensor Heater Circuit O2 Sensor Circuit Malfunction O2 Sensor Circuit Low Voltage O2 Sensor Circuit High Voltage O2 Sensor Circuit Slow Response O2 Sensor Circuit No Activity Detected O2 Sensor Heater Circuit O2 Sensor Circuit Malfunction O2 Sensor Circuit Low Voltage O2 Sensor Circuit High Voltage O2 Sensor Circuit Slow Response O2 Sensor Circuit No Activity Detected O2 Sensor Heater Circuit Fuel Delivery Error Fuel Timing Error O2 Sensor Circuit O2 Sensor Circuit Low Voltage O2 Sensor Circuit High Voltage O2 Sensor Circuit Slow Response O2 Sensor Circuit No Activity Detected O2 Sensor Heater Circuit O2 Sensor Circuit Malfunction O2 Sensor Circuit Low Voltage O2 Sensor Circuit High Voltage O2 Sensor Circuit Slow Response O2 Sensor Circuit No Activity Detected O2 Sensor Heater Circuit O2 Sensor Circuit Malfunction O2 Sensor Circuit Low Voltage O2 Sensor Circuit High Voltage O2 Sensor Circuit Slow Response O2 Sensor Circuit No Activity Detected O2 Sensor Heater Circuit Fuel Temperature Too High Incorrect Fuel Composition Fuel Trim System too Lean System too Rich Fuel Trim Malfunction System too Lean System too Rich P0176 P0177 P0178 P0179 Fuel Composition Sensor Circuit Fuel Composition Sensor Circuit Range/Performance Fuel Composition Sensor Circuit Low Input Fuel Composition Sensor Circuit High Input 106 Diagnostic Trouble Codes (Bank 1 Sensor 1) (Bank 1 Sensor 1) (Bank 1 Sensor 1) (Bank 1 Sensor 1) (Bank 1 Sensor 1) (Bank 1 Sensor 1) (Bank 1 Sensor 2) (Bank 1 Sensor 2) (Bank 1 Sensor 2) (Bank 1 Sensor 2) (Bank 1 Sensor 2) (Bank 1 Sensor 2) (Bank 1 Sensor 3) (Bank 1 Sensor 3) (Bank 1 Sensor 3) (Bank 1 Sensor 3) (Bank 1 Sensor 3) (Bank 1 Sensor 3) (Bank 2 Sensor 1) (Bank 2 Sensor 1) (Bank 2 Sensor 1) (Bank 2 Sensor 1) (Bank 2 Sensor 1) (Bank 2 Sensor 1) (Bank 2 Sensor 2) (Bank 2 Sensor 2) (Bank 2 Sensor 2) (Bank 2 Sensor 2) (Bank 2 Sensor 2) (Bank 2 Sensor 2) (Bank 2 Sensor 3) (Bank 2 Sensor 3) (Bank 2 Sensor 3) (Bank 2 Sensor 3) (Bank 2 Sensor 3) (Bank 2 Sensor 3) (Bank 1) (Bank 1) (Bank 1) (Bank 2) (Bank 2) (Bank 2) P0180 P0181 P0182 P0183 P0184 P0185 P0186 P0187 P0188 P0189 P0190 P0191 P0192 P0193 P0194 P0195 P0196 P0197 P0198 P0199 Fuel Temperature Sensor A Circuit Fuel Temperature Sensor A Circuit Range/Performance Fuel Temperature Sensor A Circuit Low Input Fuel Temperature Sensor A Circuit High Input Fuel Temperature Sensor A Circuit Intermittent Fuel Temperature Sensor B Circuit Fuel Temperature Sensor B Circuit Range/Performance Fuel Temperature Sensor B Circuit Low Input Fuel Temperature Sensor B Circuit High Input Fuel Temperature Sensor B Circuit Intermittent Fuel Rail Pressure Sensor Circuit Fuel Rail Pressure Sensor Circuit Range/Performance Fuel Rail Pressure Sensor Circuit Low In put Fuel Rail Pressure Sensor Circuit High Input Fuel Rail Pressure Sensor Circuit Intermittent Engine Oil Temperature Sensor Engine Oil Temperature Sensor Range/Performance Engine Oil Temperature Sensor Low Engine Oil Temperature Sensor High Engine Oil Temperature Sensor Intermittent P02XX Fuel and Air Metering P0200 P0201 P0202 P0203 P0204 P0205 P0206 P0207 P0208 P0209 P0210 P0211 P0212 P0213 P0214 P0215 P0216 P0217 P0218 P0219 P0220 P0221 P0222 P0223 P0224 P0225 P0226 P0227 P0228 P0229 P0230 P0231 P0232 P0233 P0234 P0235 P0236 P0237 P0238 P0239 Injector Circuit Injector Circuit - Cylinder 1 Injector Circuit - Cylinder 2 Injector Circuit - Cylinder 3 Injector Circuit - Cylinder 4 Injector Circuit - Cylinder 5 Injector Circuit - Cylinder 6 Injector Circuit - Cylinder 7 Injector Circuit - Cylinder 8 Injector Circuit - Cylinder 9 Injector Circuit - Cylinder 10 Injector Circuit - Cylinder 11 Injector Circuit - Cylinder 12 Cold Start Injector 1 Cold Start Injector 2 Engine Shutoff Solenoid Injector/Injection Timing Control Circuit Engine Coolant Over Temperature Condition Transmission Fluid Over Temperature Condition Engine Over Speed Condition Throttle/Pedal Position Sensor/Switch “B” Circuit Throttle/Pedal Position Sensor/Switch “B” Circuit Range/Performance Problem Throttle/Pedal Position Sensor/Switch “B” Circuit Low Input Throttle/Pedal Position Sensor/Switch “B” Circuit High Input Throttle/Pedal Position Sensor/Switch “B” Circuit Intermittent Throttle/Pedal Position Sensor/Switch “C” Circuit Throttle/Pedal Position Sensor/Switch “C” Circuit Range/Performance Problem Throttle/Pedal Position Sensor/Switch “C” Circuit Low Input Throttle/Pedal Position Sensor/Switch “C” Circuit High Input Throttle/Pedal Position Sensor/Switch “C” Circuit Intermittent Fuel Pump Primary Circuit Fuel Pump Secondary Circuit Low Fuel Pump Secondary Circuit High Fuel Pump Secondary Circuit Intermittent Turbo/Super Charger Overboost Condition Turbo/Super Charger Boost Sensor “A” Circuit Turbo/Super Charger Boost Sensor “A” Circuit Range/Performance Turbo/Super Charger Boost Sensor “A” Circuit Low Turbo/Super Charger Boost Sensor “A” Circuit High Turbo/Super Charger Boost Sensor “B” Circuit 107 Diagnostic Trouble Codes P0240 P0241 P0242 P0243 P0244 P0245 P0246 P0247 P0248 P0249 P0250 P0251 P0252 P0253 P0254 P0255 P0256 P0257 P0258 P0259 P0260 P0261 P0262 P0263 P0264 P0265 P0266 P0267 P0268 P0269 P0270 P0271 P0272 P0273 P0274 P0275 P0276 P0277 P0278 P0279 P0280 P0281 P0282 P0283 P0284 P0285 P0286 P0287 P0288 P0289 P0290 P0291 P0292 P0293 P0294 P0295 P0296 Turbo/Super Charger Boost Sensor “B” Circuit Range/Performance Turbo/Super Charger Boost Sensor “B” Circuit Low Turbo/Super Charger Boost Sensor “B” Circuit High Turbo/Super Charger Wastegate Solenoid “A” Turbo/Super Charger Wastegate Solenoid “A” Range/Performance Turbo/Super Charger Wastegate Solenoid “A” Low Turbo/Super Charger Wastegate Solenoid “A” High Turbo/Super Charger Wastegate Solenoid “B” Turbo/Super Charger Wastegate Solenoid “B” Range/Performance Turbo/Super Charger Wastegate Solenoid “B” Low Turbo/Super Charger Wastegate Solenoid “B” High Injection Pump Fuel Metering Control “A” (Cam/rotor/Injector) Injection Pump Fuel Metering Control “A” Range/Performance (Cam/Rotor/Injector) Injection Pump Fuel Metering Control “A” Low (Cam/Rotor/Injector) Injection Pump Fuel Metering Control “A” High (Cam/Rotor/Injector) Injection Pump Fuel Metering Control “A” Intermittent (Cam/Rotor/Injector) Injection Pump Fuel Metering Control “B” (Cam/Rotor/Injector) Injection Pump Fuel Metering Control “B” Range/Performance (Cam/Rotor/Injector) Injection Pump Fuel Metering Control “B” Low (Cam/Rotor/Injector) Injection Pump Fuel Metering Control “B” High (Cam/Rotor/Injector) Injection Pump Fuel Metering Control “B” Intermittent (Cam/Rotor/Injector) Cylinder 1 Injector Circuit Low Cylinder 1 Injector Circuit High Cylinder 1 Contribution/Balance Cylinder 2 Injector Circuit Low Cylinder 2 Injector Circuit High Cylinder 2 Contribution/Balance Cylinder 3 Injector Circuit Low Cylinder 3 Injector Circuit High Cylinder 4 Contribution/Balance Cylinder 4 Injector Circuit Low Cylinder 4 Injector Circuit High Cylinder 4 Contribution/Balance Cylinder 5 Injector Circuit Low Cylinder 5 Injector Circuit High Cylinder 5 Contribution/Balance Cylinder 6Injector Circuit Low Cylinder 6 Injector Circuit High Cylinder 6 Contribution/Balance Cylinder 7 Injector Circuit Low Cylinder 7 Injector Circuit High Cylinder 7 Contribution/Balance Cylinder 8 Injector Circuit Low Cylinder 8 Injector Circuit High Cylinder 8 Contribution/Balance Cylinder 9 Injector Circuit Low Cylinder 9 Injector Circuit High Cylinder 9 Contribution/Balance Cylinder 10 Injector Circuit Low Cylinder 10 Injector Circuit High Cylinder 10 Contribution/Balance Cylinder 11 Injector Circuit Low Cylinder 11 Injector Circuit High Cylinder 11 Contribution/Balance Cylinder 12 Injector Circuit Low Cylinder 12 Injector Circuit High Cylinder 12 Contribution/Balance P0298 Engine Oil Over Temperature P03XX Ignition System or Misfire P0300 Random/Multiple Cylinder Misfire Detected 108 Diagnostic Trouble Codes P0301 P0302 P0303 P0304 P0305 P0306 P0307 P0308 P0309 P0310 P0311 P0312 P0313 P0314 Cylinder 1 Misfire Detected Cylinder 2 Misfire Detected Cylinder 3 Misfire Detected Cylinder 4 Misfire Detected Cylinder 5 Misfire Detected Cylinder 6 Misfire Detected Cylinder 7 Misfire Detected Cylinder 8 Misfire Detected Cylinder 9 Misfire Detected Cylinder 10 Misfire Detected Cylinder 11 Misfire Detected Cylinder 12 Misfire Detected Misfire Detected with Low Fuel Single Cylinder Misfire (Cylinder not Specified) P0320 P0321 P0322 P0323 P0324 P0325 P0326 P0327 P0328 P0329 P0330 P0331 P0332 P0333 P0334 P0335 P0336 P0337 P0338 P0339 P0340 P0341 P0342 P0343 P0344 P0345 P0348 P0347 P0348 P0349 P0350 P0351 P0352 P0353 P0354 P0355 P0356 P0357 P0358 P0359 P0360 P0361 P0362 Ignition/Distributor Engine Speed Input Circuit Ignition/Distributor Engine Speed Input Circuit Range/Performance Ignition/Distributor Engine Speed Input Circuit No Signal Ignition/Distributor Engine Speed Input Circuit Intermittent Knock Control System Error Knock Sensor 1 Circuit Knock Sensor 1 Circuit Range/Performance Knock Sensor 1 Circuit Low Input Knock Sensor 1 Circuit High Input Knock Sensor 1 Circuit Input Intermittent Knock Sensor 2 Circuit Knock Sensor 2 Circuit Range/Performance Knock Sensor 2 Circuit Low Input Knock Sensor 2 Circuit High Input Knock Sensor 2 Circuit Input Intermittent Crankshaft Position Sensor A Circuit Crankshaft Position Sensor A Circuit Range/Performance Crankshaft Position Sensor A Circuit Low Input Crankshaft Position Sensor A Circuit High Input Crankshaft Position Sensor A Circuit Intermittent Camshaft Position Sensor “A” Circuit Camshaft Position Sensor “A” Circuit Range/Performance Camshaft Position Sensor “A” Circuit Low Input Camshaft Position Sensor “A” Circuit High Input Camshaft Position Sensor “A” Circuit Intermittent Camshaft Position Sensor “A” Circuit Camshaft Position Sensor “A” Circuit Range/Performance Camshaft Position Sensor “A” Circuit Low Input Camshaft Position Sensor “A” Circuit High Input Camshaft Position Sensor “A” Circuit Intermittent Ignition Coil Primary/Secondary Circuit Ignition Coil “A” Primary/Secondary Circuit Ignition Coil “B” Primary/Secondary Circuit Ignition Coil “C” Primary/Secondary Circuit Ignition Coil “D” Primary/Secondary Circuit Ignition Coil “F” Primary/Secondary Circuit Ignition Coil “F” Primary/Secondary Circuit Ignition Coil “G” Primary/Secondary Circuit Ignition Coil “H” Primary/Secondary Circuit Ignition Coil “I” Primary/Secondary Circuit Ignition Coil “J” Primary/Secondary Circuit Ignition Coil “K Primary/Secondary Circuit Ignition Coil “L’ Primary/Secondary Circuit P0365 P0366 P0367 P0368 Camshaft Position Sensor “B” Circuit Camshaft Position Sensor “B” Circuit Range/Performance Camshaft Position Sensor “B” Circuit Low Input Camshaft Position Sensor “B” Circuit High Input 109 Diagnostic Trouble Codes (Bank 1 or Single Sensor) (Bank 1 or Single Sensor) (Bank 1 or Single Sensor) (Bank 1 or Single Sensor) (Bank 1 or Single Sensor) (Bank 2) (Bank 2) (Bank 2) (Bank 2) (Bank 2) (Bank 1 or Single Sensor) (Bank 1 or Single Sensor) (Bank 1 or Single Sensor) (Bank 1 or Single Sensor) (Bank 1 or Single Sensor) (Bank 2) (Bank 2) (Bank 2) (Bank 2) (Bank 2) (Bank 1) (Bank 1) (Bank 1) (Bank 1) P0369 P0370 P0371 P0372 P0373 P0374 P0375 P0376 P0377 P0378 P0379 P0380 P0381 P0382 Camshaft Position Sensor “B” Circuit Intermittent Timing Reference High Resolution Signal “A” Timing Reference High Resolution Signal “A” Too Many Pulses Timing Reference High Resolution Signal “A” Too Few Pulses Timing Reference High Resolution Signal “A” Intermittent/Erratic Pulses Timing Reference High Resolution Signal “A” No Pulse Timing Reference High Resolution Signal “B” Timing Reference High Resolution Signal “B” Too Many Pulses Timing Reference High Resolution Signal “B” Too Few Pulses Timing Reference High Resolution Signal “B” Intermittent/Erratic Pulses Timing Reference High Resolution Signal “B” No Pulses Glow Plug/Heater Circuit “A” Glow Plug/Heater Indicator Circuit Glow Plug/Heater Circuit “B” P0385 P0386 P0387 P0388 P0389 P0390 P0391 P0392 P0393 P0394 Crankshaft Position Sensor “B” Circuit Crankshaft Position Sensor “B” Circuit Range/Performance Crankshaft Position Sensor “B” Circuit Low Input Crankshaft Position Sensor “B” Circuit High Input Crankshaft Position Sensor “B” Circuit Intermittent camshaft Position Sensor “B” Circuit Camshaft Position Sensor “B” circuit Range/Performance Camshaft Position Sensor “B” Circuit Low Input Camshaft Position Sensor “B” Circuit High Input Camshaft Position Sensor “B” Circuit Intermittent (Bank 1) (Bank 2) (Bank 2) (Bank 2) (Bank 2) P04XX Auxiliary Emission Controls P0400 P0401 P0402 P0403 P0404 P0405 P0406 P0407 P0408 P0409 P0410 P0411 P0412 P0413 P0414 P0415 P0416 P0417 P0416 P0419 P0420 P0421 P0422 P0423 P0424 P0425 P0426 P0427 P0428 P0429 P0430 P0431 P0432 P0433 P0434 Exhaust Gas Recirculation Flow Exhaust Gas Recirculation Flow Insufficient Detected Exhaust Gas Recirculation Flow Excessive Detected Exhaust Gas Recirculation Control Circuit Exhaust Gas Recirculation Control Circuit Range/Performance Exhaust Gas Recirculation Sensor “A” Circuit Low Exhaust Gas Recirculation Sensor “A” Circuit High Exhaust Gas Recirculation Sensor “B” Circuit Low Exhaust Gas Recirculation Sensor “B” Circuit High Exhaust Gas Recirculation Sensor “A” Circuit Secondary Air Injection System Secondary Air Injection System Incorrect Flow Detected Secondary Air Injection System Switching Valve “A” Circuit Secondary Air Injection System Switching Valve “A” Circuit Open Secondary Air Injection System Switching Valve “A” Circuit Shorted Secondary Air Injection System Switching Valve “B” Circuit secondary Air Injection System Switching Valve “B’ Circuit Open secondary Air Injection System Switching Valve “B” Circuit Shorted Secondary Air Injection System Relay “A” Circuit Secondary Air injection System Relay “B” Circuit Catalyst System Efficiency Below Threshold Warm Up Catalyst Efficiency Below Threshold Main Catalyst Efficiency Below Threshold Heated Catalyst Efficiency Below Threshold Heated Catalyst Temperature Below Threshold Catalyst Temperature Sensor Catalyst Temperature Sensor Range/Performance Catalyst Temperature Sensor Low Input Catalyst Temperature Sensor High Input Catalyst Heater Control Circuit Catalyst System Efficiency Below Threshold Warm Up Catalyst Efficiency Below Threshold Main Catalyst Efficiency Below Threshold Heated Catalyst Efficiency Below Threshold Heated Catalyst Temperature Below Threshold 110 Diagnostic Trouble Codes (Bank 1) (Bank 1) (Bank 1) (Bank 1) (Bank 1) (Bank 1) (Bank 1) (Bank 1) (Bank 1) (Bank 1) (Bank 2) (Bank 2) (Bank 2) (Bank 2) (Bank 2) P0435 P0436 P0437 P0438 P0439 P0440 P0441 P0442 P0443 P0444 P0445 P0446 P0447 P0448 P0449 P0450 P0451 P0452 P0453 P0454 P0455 P0456 P0457 P0460 P0461 P0462 P0463 P0464 P0465 P0466 P0467 P0468 P0469 P0470 P0471 P0472 P0473 P0474 P0475 P0476 P0477 P0478 P0479 P0480 P0481 P0482 P0483 P0484 P0485 P0486 P0487 P0488 Catalyst Temperature Sensor Catalyst Temperature Sensor Range/Performance Catalyst Temperature Sensor Low Input Catalyst Temperature Sensor High Input Catalyst Heater Control Circuit Evaporative Emission Control System Evaporative Emission Control System Incorrect Purge Flow Evaporative Emission Control System Leak Detected (small leak) Evaporative Emission Control System Purge Control Valve Circuit Evaporative Emission Control System Purge Control Valve Circuit Open Evaporative Emission Control System Purge Control Valve Circuit Shorted Evaporative Emission Control System Vent Control Circuit Evaporative Emission Control System Vent Control Circuit Open Evaporative Emission Control System Vent Control Circuit Shorted Evaporative Emission Control System Vent Valve/Solenoid Circuit Evaporative Emission Control System Pressure Sensor Evaporative Emission Control System Pressure Sensor Range/Performance Evaporative Emission Control System Pressure Sensor Low Input Evaporative Emission Control System Pressure Sensor High input Evaporative Emission Control System Pressure Sensor Intermittent Evaporative Emission Control System Leak Detected (gross leak) Evaporative Emission Control System Leak Detected (very small leak) Evaporative Emission Control System Leak Detected (fuel cap loose/off) Fuel Level Sensor Circuit Fuel Level Sensor Circuit Range/Performance Fuel Level Sensor Circuit Low Input Fuel Level Sensor Circuit High Input Fuel Level Sensor Circuit Intermittent EVAP Purge Flow Sensor Circuit EVAP Purge Flow Sensor Circuit Range/Performance EVAP Purge Flow Sensor Circuit Low Input EVAP Purge Flow Sensor Circuit High Input EVAP Purge Flow Sensor Circuit Intermittent Exhaust Pressure Sensor Exhaust Pressure Sensor Range/Performance Exhaust Pressure Sensor Low Exhaust Pressure Sensor High Exhaust Pressure Sensor Intermittent Exhaust Pressure Control Valve Exhaust Pressure Control Valve Range/Performance Exhaust Pressure Control Valve Low Exhaust Pressure Control Valve High Exhaust Pressure Control Valve Intermittent Cooling Fan 1 Control Circuit Cooling Fan 2 Control Circuit Cooling Fan 3 Control Circuit Cooling Fan Rationality Check Cooling Fan Circuit Over Current Cooling Fan Power/Ground Circuit Exhaust Gas Recirculation Sensor “B” Circuit Exhaust Gas Recirculation Throttle Position Control Circuit Exhaust Gas Recirculation Throttle Position Control Range/Performance (Bank 2) (Bank 2) (Bank 2) (Bank 2) (Bank 2) P0491 P0492 Secondary Air Injection System Secondary Air Injection System (Bank 1) (Bank 2) P05XX Vehicle Speed, Idle Control, and Auxiliary Inputs P0500 P0501 P0502 P0503 P0505 Vehicle Speed Sensor Vehicle Speed Sensor Range/Performance Vehicle Speed Sensor Circuit Low Input Vehicle Speed Sensor Intermittent/Erratic/High Idle Control System 111 Diagnostic Trouble Codes P0506 P0507 P0508 P0509 P0510 P0512 P0513 Idle Control System RPM Lower Than Expected Idle Control System RPM Higher Than Expected Idle Control System Circuit Low Idle Control System Circuit High Closed Throttle Position Switch Starter Request Circuit Incorrect Irnmobilizer Key (“Immobilizer pending SAE J1930 approval) P0515 P0516 P0517 Battery Temperature Sensor Circuit Battery Temperature Sensor Circuit Low Battery Temperature Sensor Circuit High P0520 P0521 P0522 P0523 P0524 Engine Oil Pressure Sensor/Switch Circuit Engine Oil Pressure Sensor/Switch Range/Performance Engine Oil Pressure Sensor/Switch Low Voltage Engine Oil Pressure Sensor/Switch High Voltage Engine Oil Pressure Too Low P0530 P0531 P0532 P0533 P0534 A/C Refrigerant Pressure Sensor Circuit A/C Refrigerant Pressure Sensor Circuit Range/Performance A/C Refrigerant Pressure Sensor Circuit Low Input A/C Refrigerant Pressure Sensor Circuit High Input Air Conditioner Refrigerant Charge Loss P0540 P0541 P0542 Intake Air Heater Circuit Intake Air Heater Circuit Low Intake Air Heater Circuit High P0544 Exhaust Gas Temperature Sensor Circuit P0545 Exhaust Gas Temperature Sensor Circuit Low P0546 Exhaust Gas Temperature Sensor Circuit High P0547 Exhaust Gas Temperature Sensor Circuit P0548 Exhaust Gas Temperature Sensor Circuit Low P0549 Exhaust Gas Temperature Sensor Circuit High P0550 Power Steering Pressure Sensor Circuit P0551 Power Steering Pressure Sensor Circuit Range/Performance P0552 Power Steering Pressure Sensor Circuit Low Input P0553 Power Steering Pressure Sensor Circuit High Input P0554 Power Steering Pressure Sensor Circuit Intermittent P0560 System Voltage P0561 System Voltage Unstable P0562 System Voltage Low P0563 System Voltage High P0564 Cruise Control Multi-Function Input Signal P0565 Cruise Control On Signal P0566 Cruise Control Off Signal P0567 Cruise Control Resume Signal P0568 Cruise Control Set Signal P0569 Cruise Control Coast Signal P0570 Cruise Control Accel Signal P0571 Cruise Control/Brake Switch A Circuit P0572 Cruise Control/Brake Switch A Circuit Low P0573 Cruise Control/Brake Switch A Circuit High P0574 Cruise Control System - Vehicle Speed Too High P0575 Cruise Control Input Circuit P0576 Cruise Control Input Circuit Low P0577 Cruise Control input Circuit High P0578 through P0580 Reserved for Cruise Control Codes P06XX Computer and Auxiliary Inputs P0600 P0601 Serial Communication Link Internal Control Module Memory Check Sum Error 112 Diagnostic Trouble Codes (Bank 1) (Bank 1) (Bank 1) (Bank 2) (Bank 2) (Bank 2) P0602 P0603 P0604 P0605 Control Module Programming Error Internal Control Module Keep Alive Memory (KAM) Error Internal Control Module Random Access Memory (RAM) Error Internal Control Module Read Only Memory (ROM) Error (Module Identification Defined by SAE J1979) P0606 P0607 P0608 P0609 P0610 ECM/PCM Processor Control Module Performance Control Module VSS Output “A” Control Module VSS Output “B” Control Module Vehicle Options Error P0615 P0616 P0617 P0618 P0619 P0620 P0621 P0622 P0623 P0624 Starter Relay Circuit Starter Relay Circuit Low Starter Relay Circuit High Alternative Fuel Control Module KAM Error Alternative Fuel Control Module RAM/ROM Error Generator Control Circuit Generator Lamp “L” Terminal Control Circuit Generator Field “F” Terminal Control Circuit Generator Lamp Control Circuit Fuel Cap Lamp Control Circuit P0630 P0631 VIN Not Programmed or Mismatch - ECM/PCM VIN Not Programmed or Mismatch - TCM P0635 P0836 P0637 P0638 P0639 P0640 Power Steering Control Circuit Power Steering Control Circuit Low Power Steering Control Circuit High Throttle Actuator Control Range/Performance Throttle Actuator Control Range/Performance Intake Air Heater Control Circuit P0645 P0646 P0647 P0648 P0649 P0650 A/C Clutch Relay Control Circuit A/C Clutch Relay Control Circuit Low A/C Clutch Relay Control Circuit High Immobilizer Lamp Control Circuit (“Immobilizer” pending SAE J1930 approval) Speed Control Lamp Control Circuit Malfunction Indicator Lamp (ML) Control Circuit P0654 P0655 P0656 Engine RPM Output Circuit Engine Hot Lamp Output Control Circuit Fuel Level Output Circuit P0660 P0661 P0662 P0663 P0664 P0665 Intake Manifold Tuning Valve Control Circuit Intake Manifold Tuning Valve Control Circuit Low Intake Manifold Tuning Valve Control Circuit High Intake Manifold Tuning Valve Control Circuit Intake Manifold Tuning Valve Control Circuit Low Intake Manifold Tuning Valve Control Circuit High P07XX Transmission P0700 P0701 P0702 P0703 P0704 P0705 P0706 P0707 P0708 P0709 P0710 Transmission Control System (MIL Request) Transmission Control System Range/Performance Transmission Control System Electrical Torque Converter/Brake Switch B Circuit Clutch Switch In put Circuit Malfunction Transmission Range Sensor Circuit Malfunction (PRNDL Input) Transmission Range Sensor Circuit Range/Performance Transmission Range Sensor Circuit Low Input Transmission Range Sensor Circuit High Input Transmission Range Sensor Circuit intermittent Transmission Fluid Temperature Sensor Circuit 113 Diagnostic Trouble Codes (Bank 1) (Bank 2) (Bank 1) (Bank 1) (Bank 1) (Bank 2) (Bank 2) (Bank 2) P0711 P0712 P0713 P0714 P0715 P0716 P0717 P0718 P0719 P0720 P0721 P0722 P0723 P0724 P0725 P0726 P0727 P0728 P0730 P0731 P0732 P0733 P0734 P0735 P0736 P0737 P0739 P0739 P0740 P0741 P0742 P0743 P0744 P0745 P0746 P0747 P0748 P0749 P0750 P0751 P0752 P0753 P0754 P0765 P0756 P0757 P0758 P0759 P0760 P0761 P0762 P0763 P0764 P0765 P0766 P0767 P0768 P0769 P0770 P0771 P0772 P0773 P0774 Transmission Fluid Temperature Sensor Circuit Range/Performance Transmission Fluid Temperature Sensor Circuit Low Input Transmission Fluid Temperature Sensor Circuit High Input Transmission Fluid Temperature Sensor Circuit Intermittent Input/Turbine Speed Sensor Circuit input/Turbine Speed Sensor Circuit Range/Performance Input/Turbine Speed Sensor Circuit No Signal Input/Turbine Speed Sensor Circuit Intermittent Torque Converter/Brake Switch B Circuit Low Output Speed Sensor Circuit Output Speed Sensor Circuit Range/Performance Output Speed Sensor Circuit No Signal Output Speed Sensor Circuit Intermittent Torque Converter/Brake Switch B Circuit High Engine Speed Input Circuit Engine Speed Input Circuit Range/Performance Engine Speed Input Circuit No Signal Engine Speed Input Circuit Intermittent Incorrect Gear Ratio Gear 1 Incorrect Ratio Gear 2 Incorrect Ratio Gear 3 Incorrect Ratio Gear 4 Incorrect Ratio Gear 5 Incorrect Ratio Reverse Incorrect Ratio TCM Engine Speed Output Circuit TCM Engine Speed Output Circuit Low TCM Engine Speed Output Circuit High Torque Converter Clutch Circuit Torque Converter Clutch Circuit Performance or Stuck Off Torque Converter Clutch Circuit Stuck On Torque Converter Clutch Circuit Electrical Torque Converter Clutch Circuit Intermittent Pressure Control Solenoid “A” Pressure Control Solenoid “A” Performance or Stuck Off Pressure Control Solenoid “A” Stuck On Pressure Control Solenoid “A” Electrical Pressure Control Solenoid “A” Intermittent Shift Solenoid “A” Shift Solenoid “A” Performance or Stuck Off Shift Solenoid “A” Stuck On Shift Solenoid “A” Electrical Shift Solenoid “A” Intermittent Shift Solenoid “B” Shift Solenoid “B” Performance or Stuck Off Shift Solenoid “B” Stuck On Shift Solenoid “B” Electrical Shift Solenoid “B” Intermittent Shift Solenoid “C” Shift Solenoid “C” Performance or Stuck Off Shift Solenoid “C” Stuck On Shift Solenoid “C” Electrical Shift Solenoid “C” Intermittent Shift Solenoid “C” Shift Solenoid “D” Performance or Stuck Off Shift Solenoid “D” Stuck On Shift Solenoid “D” Electrical Shift Solenoid “D” Intermittent Shift Solenoid “E” Shift Solenoid “E” Performance or Stuck Off Shift Solenoid “E” Stuck On Shift Solenoid “E” Electrical Shift Solenoid “E” Intermittent 114 Diagnostic Trouble Codes P0775 P0776 P0777 P0778 P0779 P0780 P0781 P0782 P0783 P0784 P0785 P0786 P0787 P0788 P0789 P0790 P0791 P0792 P0793 P0794 P0795 P0796 P0797 P0798 P0799 Pressure Control Solenoid “B” Pressure Control Solenoid “B” Performance or Stuck Off Pressure Control Solenoid “B” Stuck On Pressure Control Solenoid “B” Electrical Pressure Control Solenoid “B” Intermittent Shift 1-2 Shift 2-3 Shift 3-4 Shift 4-5 Shift Shift/Timing Solenoid Shift/Timing Solenoid Range/Performance Shift/Timing Solenoid Low Shift/Timing Solenoid High Shift/Timing Solenoid Intermittent Normal/Performance Switch Circuit Intermediate Shaft Speed Sensor Circuit Intermediate Shaft Speed Sensor Circuit Range/Performance Intermediate Shaft Speed Sensor Circuit No Signal Intermediate Shaft Speed Sensor Circuit Intermittent Pressure Control Solenoid “C” Pressure Control Solenoid “C” Performance or Stuck off Pressure Control Solenoid “C” Stuck On Pressure Control Solenoid “C” Electrical Pressure Control Solenoid “C” Intermittent P08XX Transmission P0801 Reverse Inhibit Control Circuit P0803 P0804 P0805 P0806 P0807 P0808 P0809 P0810 P0811 P0812 P0813 P0814 P0815 P0816 P0817 P0818 1-4 Upshift (Skip Shift) Solenoid Control Circuit 1-4 Upshift (Skip Shift) Lamp Control Circuit Clutch Position Sensor Circuit Clutch Position Sensor Circuit Range/Performance Clutch Position Sensor Circuit Low Clutch Position Sensor Circuit High Clutch Position Sensor Circuit Intermittent Clutch Position Control Error Excessive Clutch Slippage Reverse Input Circuit Reverse Output Circuit Transmission Range Display Circuit Upshift Switch Circuit Downshift Switch Circuit Starter Disable Circuit Driveline Disconnect Switch Input Circuit P0820 P0821 P0822 P0823 P0824 P0825 Gear Lever X-Y Position Sensor Circuit Gear Lever X Position Circuit Gear Lever Y Position Circuit Gear Lever X Position Circuit Intermittent Gear Lever Y Position Circuit Intermittent Gear Lever Push-Pull Switch (Shift Anticipate) P0830 P0831 P0832 P0833 P0834 P0835 P0836 P0837 P0838 Clutch Pedal Switch “A” Circuit Clutch Pedal Switch “A” Circuit Low Clutch Pedal Switch “A” Circuit High Clutch Pedal Switch “B” Circuit Clutch Pedal Switch “B” Circuit Low Clutch Pedal Switch “B” Circuit High Four Wheel Drive (4WD) Switch Circuit Four Wheel Drive (4WD) Switch Circuit Range/Performance Four Wheel Drive (4WD) Switch Circuit Low 115 Diagnostic Trouble Codes P0839 P0840 P0841 P0842 P0843 P0844 P0845 P0846 P0847 P0848 P0849 Four Wheel Drive (4WD) Switch Circuit High Transmission Fluid Pressure Sensor/Switch “A” Circuit Transmission Fluid Pressure Sensor/Switch “A” Circuit Range/Performance Transmission Fluid Pressure Sensor/Switch “A” Circuit Low Transmission Fluid Pressure Sensor/Switch “A” Circuit High Transmission Fluid Pressure Sensor/Switch “A” Circuit Intermittent Transmission Fluid Pressure Sensor/Switch “B” Circuit Transmission Fluid Pressure Sensor/Switch “B” Circuit Range/Performance Transmission Fluid Pressure Sensor/Switch “B” Circuit Low Transmission Fluid Pressure Sensor/Switch “B” Circuit High Transmission Fluid Pressure Sensor/Switch “B” Circuit Intermittent Additional Diagnostic Trouble Code Ranges Other DTC ranges are defined for either manufacturer specific codes or under the control of SAE (Society of Automotive Engineers) and not yet defined. This section documents these additional ranges. Refer to your vehicle’s repair manual for manufacturer specific Diagnostic Trouble Codes. P09XX Transmission P1XXX Manufacturer Controlled P10XX Fuel and Air Metering and Auxiliary Emission Controls P11XX Fuel and Air Metering P12XX Fuel and Air Metering P13XX Ignition System or Misfire P14XX Auxiliary Emission Controls P15XX Vehicle Speed, Idle Control, and Auxiliary Inputs P16XX Computer and Auxiliary Outputs P17XX Transmission P18XX Transmission P19XX Transmission P2XXX SAE Controlled DTCs P20XX Fuel and Air Metering and Auxiliary Emission Controls P21XX Fuel and Air Metering and Auxiliary Emission Controls P22XX Fuel and Air Metering and Auxiliary Emission Controls P23XX Ignition System or Misfire P24XX SAE Reserved P25XX SAE Reserved P26XX SAE Reserved P27XX SAE Reserved 116 Diagnostic Trouble Codes P28XX SAE Reserved P29XX SAE Reserved P3XX Manufacturer Controlled and SAE Reserved P30XX Fuel and Air Metering and Auxiliary Emission Controls P31XX Fuel and Air Metering and Auxiliary Emission Controls P32XX Fuel and Air Metering and Auxiliary Emission Controls P33XX Ignition System Misfire P34XX SAE Reserved P35XX SAE Reserved P36XX SAE Reserved P37XX SAE Reserved P38XX SAE Reserved P39XX SAE Reserved 117 Diagnostic Trouble Codes APPENDIX B Support Technical support is offered on our products via email. Please note technical support cannot assist you in diagnosing and repairing your vehicle. Support is limited to operation of the scan tool only. When contacting technical support please provide the following information: • • • • • Year of Vehicle (e.g. 1997) Make (e.g. Chevrolet) Model (e.g. K1500 Pickup Extended Cab) Problem encountered, be specific as possible. List any error messages displayed by the software. Version of Auterra software located on the Help Options > About Dyno-Scan… menu. Figure 43: About Auterra Dyno-Scan Dialog Technical support is provided at: [email protected]. 118 Support APPENDIX C Warranty Information Auterra warranties the Dyno-Scan™ for Windows hardware for 1 year. Damage caused by misuse or modification is not covered. Auterra is not responsible for damage to vehicle caused by misuse or otherwise. Auterra's sole liability is limited to the repair or replacement of the scan tool while under warranty. When contacting Auterra for an RMA please provide the following information: • • • • Year of Vehicle (e.g. 1997) Make (e.g. Chevrolet) Model (e.g. K1500 Pickup Extended Cab) Problem encountered. Please be as specific as possible. Contact Auterra technical support via email at: [email protected]. 119 Warranty Information Index 16-pin, 2, 21 Fast Sampling, 25, 71, 102 a tire diameter, 74, 75 Features, 1 accuracy, 70, 79, 82 File Properties, 33, 34, 36, 37, 72, 73, 77, 78 Aerodynamic, 70 Freeze Frame, 43, 45, 103 automatic transmissions, 70 Frontal areas, 72 CAN, 3, 40 gear ratio, 70, 72, 74, 75, 76 Check Engine, 1, 2, 3, 4, 44, 45, 103 generic, 104 COM port, 21, 22, 25, 102 Import, 67 comma separated values, 68 ISO, 3, 40, 67 correction factor, 70 KWP, 3, 40 CSV, 68, 90, 91 Live Data, 31, 36, 37, 40, 46, 47, 48, 55, 56, 57, 58, 102 demo mode, 41, 89 Demo mode, 42, 89 demonstration mode, 41 Demonstration mode, 89 Diagnostic Trouble Code, 2, 3, 45, 104, 116 Diagnostic Trouble Codes, 43, 44, 45, 104, 116 docking window, 34, 35, 36, 37, 38, 72, 77, 78, 80 drag coefficients, 72, 73 Lost Communication, 103 MIL, 3, 4, 45, 52, 54, 103, 113 No Communication, 102, 103 OBD II, 2 OBD II adapter, ii, 21, 41, 69, 78, 81, 102 OBD II Cable, 21 OBD II compliant, 2, 3, 102 OBD II connector, 2, 21, 102, 103 DTC, 1, 3, 44, 45, 67, 103, 104, 116 Options, 22, 25, 27, 39, 45, 47, 48, 56, 57, 71, 102, 113, 118 dynamometers, 69 Parameter Edit, 46, 47 Dynojet, 70 PWM, 3, 40 ECU, 3, 47, 48, 56, 58, 59 RMA, 119 ECU Parameters, 48, 56, 58 RS-232 cable, 21, 78, 81 enhanced, 104 Run Statistics, 33, 38, 78, 80, 82 Export, 68 safety, 69, 79, 82 120 Index Sample Speed, 46, 48, 57 torque converter, 70, 71, 76 Software Requirements, 2 units of measure, 1, 25, 45, 48, 59, 60, 91 spreadsheet, 90 Units of Measure, 25, 48 status bar, 40 Updates, 20 support, 118 VIN, 5, 72, 90, 113 Supported Vehicles, 3 VPW, 3, 40 tire diameter, 72, 74, 75, 76 Zoom, 57 121 Index