1
Overview of Receptors from
Combinatorial Nucleic Acid and Protein
Libraries
UNIT 24.1
Andrew D. Ellington1
1
University of Texas at Austin, Austin, Texas
ABSTRACT
This unit provides a brief description of the different approaches that can be used to identify
functional peptides, proteins, and nucleic acids from combinatorial libraries. Curr. Protoc. Mol.
C 2007 by John Wiley & Sons, Inc.
Biol. 80:24.1.1-24.1.3. Keywords: combinatorial library r protein r nucleic acid r aptamer r selection r SELX r
phage display r directed evolution
Biopolymer receptors are used in a wide
variety of molecular biology techniques, from
ELISAs to immunoprecipitations to proteomic
arrays. Receptors that are of particular interest
or utilty for these applications can be generated
by either selection or by screening combinatorial libraries.
Combinatorial library methods can be
roughly classified according to the type of
molecules being examined and to the deconvolution methods being used. In particular,
one large division is between biopolymer and
chemical libraries, while a second division is
between selections and screens for function.
Selections rely on the amplification of templates encoding functional receptors, while
screens rely on the identification and subsequent resynthesis of functional receptors. As a
rough generalization, biopolymer libraries are
frequently selected for function (although they
can also be screened), while chemical libraries
are frequently screened for function (although
with increasingly novel methods they can be
selected).
Biopolymer libraries include, but are not
limited to, proteins and nucleic acids. Protein
libraries can be of many different forms, from
the partial randomization of large proteins
to the segmental randomization of pieces
of proteins, to the complete randomization
of peptides. Since proteins do not encode
replicable sequence information, proteins and
their attendant phenotypes must somehow
be coupled to genetic sequence information,
i.e., RNA or DNA. There are several different
methods by which this can be accomplished,
but in all instances the key is the physical link
between phenotype and genotype. In one of
the first and most robust instantiations of protein selection methods, peptide libraries were
adjoined to phage proteins such as pIII and
pVIII, and thereby expressed (“displayed”)
on the surface of bacteriophage. Such phage
libraries tend to have on the order of a billion
different variants. Selection for binding led to
the isolation of peptides that carried with them
the genes that encoded them. Re-infection of
cells led to the amplification of phage with
these desirable phenotypes. Multiple cycles
of selection and amplification generally led to
the purification of phage peptides that could
bind to a given target. Oftentimes, however,
binding required the multivalent presentation
of the peptides (i.e., researchers got exactly
what they selected for: the peptides were
presented in several copies, and the best
binding phage used these several copies
to interact with a target). Since these first
demonstrations, phage display methods have
been devised for the selection of antibodies,
enzyme substrates, and enzymes themselves.
Phage display selection is the subject of protocols in other Current Protocols volumes (e.g.,
Bradbury, 1999; Galanis et al., 1999; Benhar
and Reiter, 2002; Bradbury et al., 2002;
Enshell-Seijffers and Gershoni, 2002; Kay
and Castagnoli, 2003) and has been reviewed
many times in the literature (Kehoe and Kay,
2005). In addition, other viruses and entire
cells have been used as vehicles for the display
of protein libraries (see, for example, Farinas,
2006).
Current Protocols in Molecular Biology 24.1.1-24.1.3, October 2007
Published online October 2007 in Wiley Interscience (www.interscience.wiley.com).
DOI: 10.1002/0471142727.mb2401s80
C 2007 John Wiley & Sons, Inc.
Copyright Generation and
Use of
Combinatorial
Libraries
24.1.1
Supplement 80
Receptors from
Combinatorial
Nucleic Acid and
Protein Libraries
In addition to selecting peptides or proteins
displayed on the outside of a cell or phage, peptides or proteins can be selected within cells.
There is a long history of carrying out directed
evolution experiments with whole cells, based
in large measure on cellular phenotypes and
natural or artificially elevated mutation rates.
One classic example is the selection of evolved
beta galactosidase (ebg; Hall, 2003). However,
the ability to chemically manipulate DNA and
thereby create DNA libraries drastically increased the ability to select nucleic acids with
novel phenotypes. In recent years, so-called
peptide aptamers (a term originally applied to
nucleic acids, see below) have been selected
based on the ability of individual library members to inhibit protein functions, such as enzymatic activity or dimerization, and thereby
modulate key features of cell physiology, such
as signal transduction pathways (numerous examples can be found in Hoppe-Seyler et al.,
2004; Baines and Colas, 2006). While almost
any phenotype can be screened or selected,
it is frequently useful to couple peptide aptamer function to the production of a contrived
genetic marker, such as an antibiotic or fluorescent protein. While the great advantage of
peptide aptamers is their immediate tie to a relevant cellular phenotype, the library sizes that
can be examined are limited by transformation
efficiencies and cell-based selection methods
to generally ≤107 . The production and utility of peptide aptamers is examined in greater
detailin UNIT 24.4.
In all of these instances, translation inside
of a cell has been used to generate a protein
library. There are also methods where translation outside of a cell can be used to generate libraries in which phenotype is connected
with genotype. There are several popular variants of in vitro display technologies: ribosome or mRNA display (Lipovsek and Pluckthun, 2004), and in vitro compartmentalization
(Rothe et al., 2006). In ribosome display, the
elimination of a stop codon or release factor
leads to mRNAs being noncovalently linked
to peptides or proteins extruded through the
exit pore of the ribosome. The entire complex
can be selected for binding or other functions.
In mRNA display, the antibiotic puromycin,
which normally covalently adds to growing
peptide chains, is linked to a nucleic acid, causing the nucleic acid to be covalently added to
a growing peptide or protein chain. Again, an
mRNA is connected to its translated protein
counterpart, except in this instance the connection is via a covalent linkage rather than
a noncovalent one. An excellent description
of mRNA display can be found in UNIT 24.5.
Finally, in vitro compartmentalization methods utilize in vitro transcription and translation mixes in water-in-oil emulsions to generate literally billions of separate ‘cell-like’
compartments where individual proteins in a
library can be made. In this instance, the connection between genotype and phenotype is
initially enforced by the compartment itself.
Clever schemes to further enforce the linkage
have also been devised, e.g., a gene that is
covalently coupled to a bead produces an enzyme that fluorescently labels the bead, which
is in turn captured via FACS. Amplification of
the gene allows further cycles of selection for
those enzymes that are most active and those
beads that are most fluorescent. While these
methods are quite different from one another,
in the libraries that can be sieved are in general larger (≥1010 ) than is the case with phage
display (Griffiths and Tawfik, 2006).
Functional nucleic acids can also be selected from random sequence libraries. In
these instances, the coupling between genotype and phenotype is natural, since functional
nucleic acids overcome the ‘chicken and egg’
problem: the genotype is the phenotype, and
vice versa. Individual, single-stranded nucleic
acids (DNA or RNA) can be generated by either chemical or enzymatic methods. The current volume contains a detailed description of
how to prepare a nucleic acid pool (UNIT 24.1).
Each single-stranded nucleic acid will fold
into a unique three-dimensional conformation.
These conformations can be sieved for either
binding or catalytic activity (ribozymes). Nucleic acid variants that survive a round of selection can be amplified by a combination of
reverse transcription, PCR, and in vitro transcription. One of the more common and useful types of in vitro selection experiments is
the identification of anti-protein aptamers via
filter-binding selection, a procedure that is described in UNIT 24.3. The disadvantage of using nucleic acid libraries is that the chemistry
is not nearly as robust as for proteins: the 5
canonical nucleobases have much less chemical functionality than the 20 amino acids. This
disadvantage is being overcome by the inclusion of modified nucleotides during enzymatic
replication or transcription. The advantage of
using nucleic acid libraries is that they can be
much larger than protein libraries (on the order of 1015 variants) and can be manipulated
entirely in vitro. Nucleic acid selections are increasingly yielding aptamers with biomedical
24.1.2
Supplement 80
Current Protocols in Molecular Biology
relevance, as reviewed in Nimjee et al. (2005)
and Yan et al. (2005). While most nucleic acid
selections are carried out in vitro, it has also
proven possible to directly select for function
in vivo, as with peptide aptamers (Cassidy and
Mahler, 2003).
It is anticipated that the line between chemistry and biology will become increasingly
blurred. Already, it has proven possible to generate chemical libraries with nucleic acid or
peptide tags, allowing the details regarding
the composition and synthesis of a given compound to be encoded in a biopolymer (Brenner
and Lerner, 1992). While such methods can
simplify the identification of active pharmacophores, they do not yield replicable chemical compounds per se, as delimited chemical libraries must still be resynthesized based
on the functional information gained from a
given round of screening or selection. However, more recently small chemical libraries
have been synthesized based on the alignment of reactive chemical compounds on DNA
templates (Gartner et al., 2004; Scheuermann
et al., 2006). By coupling DNA tagging and
DNA templating methodologies, it has even
proven possible to directly evolve the structures of chemical compounds (Halpin and
Harbury, 2004).
LITERATURE CITED
Baines, I.C. and Colas, P. 2006. Peptide aptamers as
guides for small-molecule drug discovery. Drug
Discov. Today 11:333-341.
Benhar, I. and Reiter, Y. 2002. Phage display of
single-chain antibody constructs. Curr. Protoc.
Immunol. 48:10.19B.1-10.19B.31.
Bradbury, A. 1999. The use of phage display in
neurobiology. Curr. Protoc. Neurosci. 7:5.12.15.12.17.
Bradbury, A., Sblaterro, D., Marzari, R., Rem, L.,
and Hoogenboom, H. 2002. Using phage display in neurobiology. Curr. Protoc. Neurosci.
18:5.18.1-5.18.28.
Brenner, S. and Lerner, R.A. 1992. Encoded combinatorial chemistry. Proc. Natl. Acad. Sci. U.S.A.
89:5831-5833.
Cassiday, L.A. and Mahler, L.J. 2003. Yeast genetic
selections to optimize RNA decoys for transcription factor NF-kappaB. Proc. Natl. Acad. Sci.
U.S.A. 100:3930-3935.
Enshell-Seijffers, D. and Gershoni1, J.M., 2002.
Phage display selection and analysis of Abbinding epitopes. Curr. Protoc. Immunol.
50:9.8.1-9.8.27.
Farinas, E.T. 2006. Fluorescence activated cell sorting for enzymatic activity. Comb. Chem. High
Throughput Screen. 9:321-328.
Galanis, M., Irving, R.A., and Hudson, P.J. 1999.
Bacteriophage library construction and selection of recombinant antibodies. Curr. Protoc.
Immunol. 34:17.1.1-17.1.48.
Gartner, Z.J., Tse, B.N., Grubina, R., Doyon,
J.B., Snyder, T.M., and Liu, D.R. 2004. DNAtemplated organic synthesis and selection of
a library of macrocycles. Science 305:16011605.
Griffiths, A.D. and Tawfik, D.S. 2006. Miniaturising the laboratory in emulsion droplets. Trends
Biotechnol. 24:395-402.
Hall, B.G. 2003. The EBG system of E. coli: Origin
and evolution of a novel beta-galactosidase for
the metabolism of lactose. Genetica 118:143156.
Halpin, D.R. and Harbury, P.B. 2004. DNA display II: Genetic manipulation of combinatorial
chemistry libraries for small molecular evolution. PLoS Biol. 2:E174
Hoppe-Seyler, F., Crnkovic-Mertens, I., Tomai, E.,
and Butz, K. 2004. Peptide aptamers: Specific
inhibitors of protein function. Curr. Mol. Med.
4:529-538.
Kay, B.K. and Castagnoli, L. 2003. Mapping protein-protein interactions with phagedisplayed combinatorial peptide libraries. Curr.
Protoc. Cell Biol. 17:17.4.1-17.4.9.
Kehoe, J.W. and Kay, B.K. 2005. Filamentous
phage display in the new millennium. Chem.
Rev. 105:4056-4072.
Lipovsek, D. and Pluckthun, A. 2004. In vitro protein evolution by ribosome display and mRNA
display. J. Immunol. Methods 290:51-67.
Nimjee, S.M., Rusconi, C.P., and Sullenger, B.A.
2005. Aptamers: An emerging class of therapeutics. Annu. Rev. Med. 56:555-583.
Rothe, A., Surjadi, R.N., and Power, B.E. 2006.
Novel proteins in emulsions using in vitro compartmentalization. Trends Biotechnol. 24:587592.
Scheuermann, J., Dumelin, C.E., Meikko, S., and
Neri, D. 2006. DNA-encoded chemical libraries.
J. Biotechnol. 126:566-581.
Yan, A., Bell, K.M., Breeden, M.M., and Ellington,
A.D. 2005. Aptamers: Prospects in therapeutics
and biomedicine. Front. Biosci. 10:1802-1827.
Generation and
Use of
Combinatorial
Libraries
24.1.3
Current Protocols in Molecular Biology
Supplement 80
Design, Synthesis, and Amplification of
DNA Pools for In Vitro Selection
UNIT 24.2
Bradley Hall,1 John M. Micheletti,2 Pooja Satya,2 Krystal Ogle,2
Jack Pollard,3 and Andrew D. Ellington1
1
Department of Chemistry and Biochemistry, University of Texas, Austin, Texas
Freshman Research Initiative, University of Texas, Austin, Texas
3
3rd Millennium Corporation, Cambridge, Massachusetts
2
ABSTRACT
Preparation of a random-sequence DNA pool is presented. The degree of randomization
and the length of the random sequence are discussed, as is synthesis of the pool using
a DNA synthesizer or via commercial synthesis companies. Purification of a singlestranded pool and conversion to a double-stranded pool are presented as step-by-step
protocols. Support protocols describe determination of the complexity and skewing of
the pool, and optimization of amplification conditions. Curr. Protoc. Mol. Biol. 88:24.2.1C 2009 by John Wiley & Sons, Inc.
24.2.27. Keywords: In vitro selection r DNA pool synthesis r phosphoramidite DNA synthesis r
randomization
INTRODUCTION
This unit describes the design, synthesis, purification, and amplification of a randomsequence DNA pool. Functional nucleic acid–binding or catalytic species can be selected
from these random sequence pools. In designing the DNA pool, careful consideration
should be given both to the degree of randomization and the length of the random
sequence region (see Strategic Planning). Following pool design, chemical synthesis
on a commercial DNA synthesizer will yield a single-stranded DNA pool. The newly
synthesized oligonucleotide pool can then be purified (see Basic Protocol 1). Prior to
amplification, the initial complexity of the pool should be determined (see Support
Protocol 1), the skewing of the pool should be determined (see Support Protocol 2),
and amplification reaction conditions should be optimized (Support Protocol 3). If the
nascent synthetic oligonucleotide is judged to be suitable for large-scale amplification, it
can be enzymatically converted into a double-stranded DNA library (see Basic Protocol
2). Multiple copies of a single-stranded DNA pool can be derived from each doublestranded DNA library, or the library can be transcribed to yield an RNA pool or a
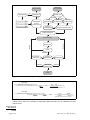
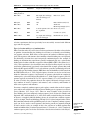
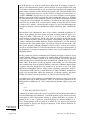
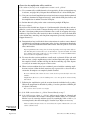
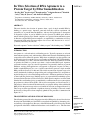
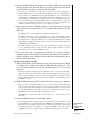
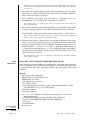
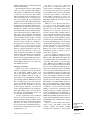
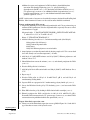
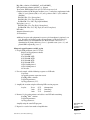
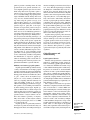
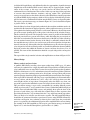
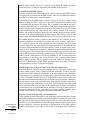
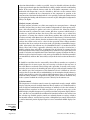
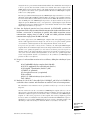
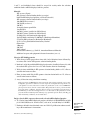
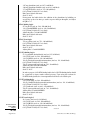
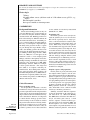
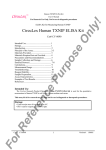
modified RNA pool (see UNIT 24.3). Figure 24.2.1 outlines the procedure.
STRATEGIC PLANNING
Designing the Initial DNA Pool
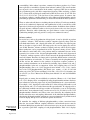
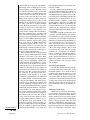
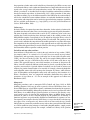
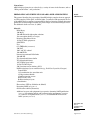
The nucleic acid pools used for in vitro selection experiments typically contain a randomized central core flanked by constant sequences that are required for enzymatic
manipulations, such as PCR amplification, in vitro transcription, or restriction digestion
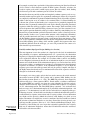
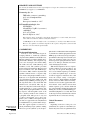
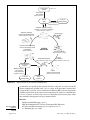
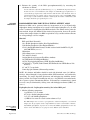
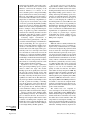
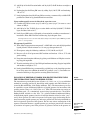
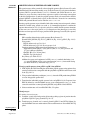
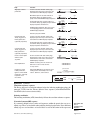
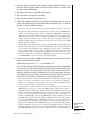
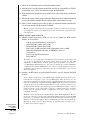
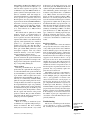
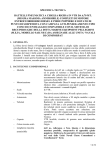
(see also Fig. 24.2.2).
Since a pool is relatively expensive to synthesize, both in terms of time and cost, some
effort should be devoted to pool design. There are many subtle parameters to consider
that can greatly influence the outcome of a selection experiment, including the degree
of randomization, pool length, and pool modularity (see Table 24.2.1 for references to
Current Protocols in Molecular Biology 24.2.1-24.2.27, October 2009
Published online October 2009 in Wiley Interscience (www.interscience.wiley.com).
DOI: 10.1002/0471142727.mb2402s88
C 2009 John Wiley & Sons, Inc.
Copyright Generation and
Use of
Combinatorial
Libraries
24.2.1
Supplement 88
add promoter
yes
design primer
design pool
RNA pool?
binding site?
no
add optional
features
(restriction sites)
known
partial
randomization
degree of
randomization
novel
complete
segmental
randomization randomization
length of random region
combine pool parts
synthesize pool
skewed
too low
PAGE purify
yield?
sufficient
extension
efficiency?
sufficient
optimize
amplification
large-scale
amplification
composition?
sufficient
storage
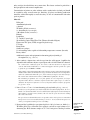
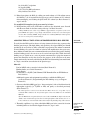
Figure 24.2.1
Flow chart outlining pool design, synthesis, and large-scale amplification.
T7 promotor
5' –GCTAATACGACTCACTATAGGGAGATCACT
StyI
AvaI
5' – GCTAATACGACTCACTATAGGGAGATCACTTACGGCACC ----- Nx ------- CCAAGGCTCGGGACAGCG – 3'
BanI
5' – CGCTGTCCCGAGCCTTGG
T7 promotor
5' – GATAATACGACTCACTATAGGGAATGGATCCACATCTACGA
PstI
HindIII
5' –GGGAATGGATCCACATCTACGAATTC ------ N30 ------- TTCACTGCAGACTTGACGAAGCTT– 3'
BamHI
EcoRI
5' – AAGCTTCGTCAAGTCTGCAGTGAA
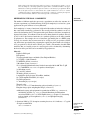
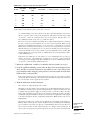
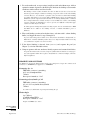
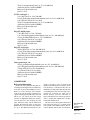
Figure 24.2.2 Two examples of pools used in in vitro selection. Primers are shown above and below the
sequence of the pool. The T7 promoter is delineated in bold. Restriction sites are underlined, with their
enzymes listed.
DNA Pools for In
Vitro Selection
24.2.2
Supplement 88
Current Protocols in Molecular Biology
Table 24.2.1 Selection Experiments with Different Types and Sizes of Pools
Target
DNA/RNA
Length of random region
Reference
Bacteriophage T4
DNA polymerase
RNA
8
Tuerk and Gold (1990)
HIV-1 Rev
RNA
66, doped (65% wild type,
30% non-wild type, 5%
deleted)
Bartel et al. (1991)
Ribozyme
RNA
120
Bartel and Szostak (1993)
HIV-1 Rev
RNA
30
Tuerk and
MacDougal-Waugh (1993)
HIV-1 Rev
RNA
4 and 6, segmental; 6-9 and Giver et al. (1993)
6-9, segmental
PKCβ
RNA
120
Conrad et al. (1994)
HTLV-1 Rex
RNA
43, doped (70% wild type,
30% non-wild type)
Baskerville et al. (1995)
selection experiments that have previously been successfully executed with different
types and sizes of pools).
Type of selection and degree of randomization
Most researchers who carry out in vitro selection experiments wish either to better define
or optimize a known binding site (binding-site selection), or to identify a novel binding
site (aptamer selection). Each of these tasks requires the synthesis of different types of
pools. The sequences and structures that contribute to known binding sites are frequently
best defined by selections that start from partially randomized pools. One example of
binding-site definition that started from a partially randomized pool was a selection that
defined critical residues of the Rev-responsive element (RRE) of HIV-1 Rev (Bartel et al.,
1991). This experiment is also described in more detail below. Biased pools can also be
used for the optimization of a previously isolated motif. For example, aptamers that could
bind to the Rex protein of HTLV-1 were selected from a partially randomized pool based
on the wild-type Rex-binding element (XBE) but in the end bound Rex 9-fold better than
the XBE (Baskerville et al., 1995). Doped sequence selections can also be used to better
define the functional sequences and structures of aptamers obtained from completely
random pools, as described below (Hessleberth et al., 2000). Doped sequence pools for
aptamers typically retain from 70% to 95% sequence identity (5% to 30% mutation rate)
in order to balance the population between the original, functional wild-type variant,
large numbers of inactive sequences and structures, and a relatively small number of
more active sequences and structures.
In contrast, completely random sequence pools explore a much wider swath of sequence
space and are more useful for the isolation of novel binding species (aptamers) or catalytic
species (Breaker, 1997; Jaeger, 1997). There are many examples of the selection of
novel binding sites from completely random sequence pools (reviewed in Chandra and
Gopinath, 2007, and Stoltenburg et al., 2007). Even when a natural binding site is known
in advance, a completely different binding site may be selected from a random sequence
pool; for example, Tuerk and MacDougal-Waugh (1993) isolated unique binders to Rev
that bound better than the wild-type RBE sequence in vitro. Completely random sequence
pools can also be used to extract aptamers that bind to proteins not normally thought
to bind to nucleic acids; an example of this is the selection of an RNA aptamer that
bound and inhibited the β isoform of protein kinase C (Conrad et al., 1994). Completely
random sequence pools can also be used for the selection of novel nucleic acid catalysts.
Generation and
Use of
Combinatorial
Libraries
24.2.3
Current Protocols in Molecular Biology
Supplement 88
For example, starting from a pool with a 220-position random region, Bartel and Szostak
(1993) isolated a novel ribozyme capable of RNA ligation. Generally, selections for
catalysis require pools with a random region greater than 90 residues, while binding
selections use pools with a random region of less than 70 residues.
Intermediate between partially random and completely random sequence pools are segmentally random sequence pools. In a segmentally random pool, short tracts of sequence
are completely randomized. Segmental randomization thus allows all possible sequences
within a short region or set of residues to be examined. Thus, if a natural binding site
is known, but a portion of that binding site is suspected to be particularly important for
function, then a segmentally random pool can be used to identify all possible, functional
sequences within the wild-type sequence context. For example, Tuerk and Gold (1990)
selected aptamers that bound T4 DNA polymerase from a pool that contained 8 random sequence positions flanked by wild-type residues. Similarly, many binding sites are
known to be presented within a particular structural context, such as a stem-loop or stembulge structure. In these cases, a portion of the structure can be completely randomized,
and all possible functional stem-loops or stem-bulges can be identified. For example,
the Rev-binding element was known to form a stem-internal loop-stem structure. Giver
et al. (1993) segmentally randomized only the internal loop portion of the structure and
selected Rev-binding species. Many of the anti-Rev aptamers had sequences that were
significantly different than the wild-type, yet were still presented in the context of a
stem-internal loop-stem structure.
Partially random (doped) pool design (binding site selection)
The most important issue in the synthesis of a doped pool is the level of randomization
(the probability of sequence substitution/position). As a general rule, the substitution
frequency of a doped pool should roughly correspond to the number of positions thought
to be required for function. For example, if 10 residues within a nucleic acid binding
site are thought to be functional, then the rate of substitution might be set to yield single
mutants at least half the time. If the substitution frequency is set too low, there may be too
few varying residues or combinations of residues to yield information about functional
sequences or structures. In contrast, if the substitution frequency is set too high, the
sequence space nearest the wild-type motif will only be sparsely sampled, and many of
the highly mutated molecules may be nonfunctional because their sequences will have
diverged too far from the wild-type.
DNA Pools for In
Vitro Selection
For example, an in vitro genetic analysis has been used to uncover the critical structural
interactions between the HIV-1 Rev protein and its primary RNA binding site, the
Rev-binding element (Bartel et al., 1991). The RBE had previously been mapped by
deletion analysis to a short segment of HIV-1. Bartel and his co-workers assumed that
the minimal RBE was smaller even than the region identified by deletion analysis,
and thus decided to heavily dope a portion of a 66-nucleotide sequence at a frequency
of 35% substitution/position. The initial RRE library contained ∼1013 molecules that
had an average of 23 substitutions/template (0.35 probability substitution/position × 66
positions = ∼23 substitutions); less than 1 in 1012 molecules were completely wild-type.
Following selection, a 20-nucleotide core-binding site within the 66-nucleotide pool was
readily defined by sequence conservations and co-varying residues. A lower substitution
rate might not have precisely defined the relatively small binding site, while an even
higher substitution rate might have created a mutational load that would have limited
the selection of functional molecules or even have allowed the selection of novel, nonwild-type anti-Rev aptamers (Giver et al., 1993; Tuerk and MacDougal-Waugh, 1993).
Conversely, if the binding site were larger than originally hypothesized, the relatively
high rate of substitution might have meant that few functional molecules could have
survived the selection unscathed.
24.2.4
Supplement 88
Current Protocols in Molecular Biology
The number and type of sequence substitutions, as opposed to the probable target size for
mutation, can also be used to plan the synthesis of a doped sequence pool, as described by
the following equations. Typically, a 1-μmol synthesis of a 100-residue template yields a
pool of ∼1015 amplifiable molecules. Regardless of the degree of partial randomization
or the precise doping strategy employed, the number of different mutational combinations
is given by:
3n {L!/[n!(L − n)!]}
where n is the number of sequence substitutions/template in a template of length L. For
example, in the case of the 66-nucleotide RRE pool discussed earlier, there were ∼2.17 ×
109 possible 5-residue substitutions and ∼1.25 × 10¹⁶ possible 10-residue substitutions.
To calculate the fraction of a given set of substitutions that are actually contained in a
doped pool, the binomial probability distribution can be used:
P(n,L,f) = {L!/[n!(L − n)!]}( f n )(1 − f )(L − n)
where P is the fraction of the template population when f is the probability of substitution/
position. If primarily single-base substitutions are desired, then f should be maximized for
n = 1; if multiple mutations (e.g., double or triple substitutions) are desired, then f should
be correspondingly higher. If the doping strategy is optimized for n substitutions, then
this number of substitutions will occur most frequently, “n − 1” and “n + 1” substitutions
will occur less frequently but in roughly equal numbers, and so forth. Higher levels of
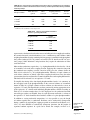
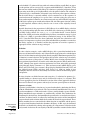
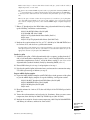
sequence substitution skew the mutant frequency distribution, allowing the sampling of
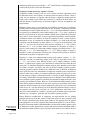
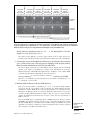
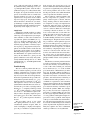
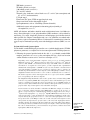
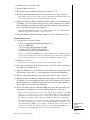
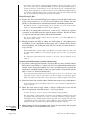
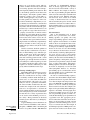
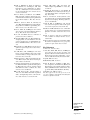
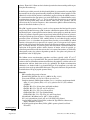
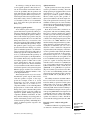
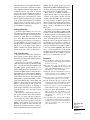
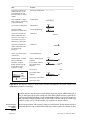
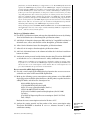
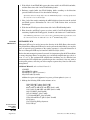
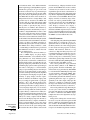
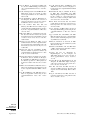
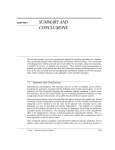
some regions of sequence space to the exclusion of others (Fig. 24.2.3).
Therefore, in the RRE example already cited, a pool of 1 × 10¹³ molecules doped at a
frequency of 35% would contain few 5-residue substitutions [1 × 10¹³ × P(5,66,0.35) =
∼1.82 × 10⁶ 5-residue substitutions out of ∼2.17 × 10⁹ possible 5-residue substitutions].
In contrast, if the pool were doped at a frequency of 18%, all 5-residue substitutions
would almost certainly be included [1 × 10¹³ × P(5,66,0.18) = ∼9.3 × 10¹⁰ 5-residue
Percent of pool containing a
given number of substitutions
14
12
18% substitution/position
10
8
35% substitution/position
6
4
2
0
0 2 4 6 8 10 12 14 16 18 20 22 24 26 28 30 32 34 36 38 40 42 44 46 48 50 52 54 56 58 60 62 64 66
Number of substitutions
Figure 24.2.3
18% or 35%.
Comparison of substitution distributions for a 66-nucleotide pool doped to either
Generation and
Use of
Combinatorial
Libraries
24.2.5
Current Protocols in Molecular Biology
Supplement 88
substitutions]. Note that in a pool of only 1 × 10¹³ total molecules, neither doping scheme
would yield all possible 10-residue substitutions.
Completely random pool design (aptamer selection)
Completely random sequence pools are used to initiate selection experiments when
no functional nucleic acid sequence or structural motif is known in advance. There is
really only one parameter to consider when designing a completely random pool: the
length of the random region. While this parameter is considered in detail below, we
must first dismiss a frequent bogey of selection neophytes, the issue of complexity and
representation.
Random sequence space is a vast landscape of possibilities of which only a vanishingly
small fraction can be sampled by either nature or man. Assuming a 4-monomer repertoire
from which pools can be constructed, there are ∼1.6 × 1060 unique individual sequences
in a sequence space bounded by a 100-residue template (4100 = ∼1.6 × 1060 ), a quantity of
nucleic acid greater than an Avogadro’s number of Earth masses. While this grotesquely
large value is clearly beyond the realm of experimental possibility, modern methods
of chemical nucleic acid synthesis do allow the sampling of nearly as much sequence
information as may be contained in the Earth’s biosphere. As a back-of-the-envelope
calculation, consider that there are on the order of ∼1× 10⁹ species in the biosphere, each
with ∼1 × 10⁵ genes. If each of these genes in turn is composed of ∼1 × 10³ residues,
then there are ∼1 × 10¹⁷ residues worth of information in a biosphere. In contrast, a
typical 1-μmol synthesis of a 100-residue random sequence pool would contain 1 × 10¹⁵
molecules × ∼1 × 10² residues/molecule = ∼1 × 10¹⁷ unique residues or roughly 1
biosphere’s worth of information. Obviously, the connection and ordering of sequence
information in organisms is important as well.
Typically, a 1-μmol scale column random sequence pool synthesis contains ∼1 × 10¹⁵
molecules, and thus can potentially sample on the order of all possible 25-mers (415
= ∼1.1 × 10¹⁵ ). In fact, since different 25-mers can be found in different “reading
frames,” a slightly larger sequence space will likely be sampled. Because of this physical
restriction, it is sometimes thought that random sequence pools should be no more than
25 residues in length—any longer, and only a fractional sampling would be possible,
and many potential sequences would be lost. While this is true, it should be realized that
longer pools do not lose any of the numerical complexity of smaller pools (except in those
instances where long syntheses are extremely inefficient) and in fact gain access to some
fraction of longer sequence and structural motifs as well. For example, tRNA molecules
are roughly 76 nucleotides in length. It might prove more difficult to select tRNA mimics
from a random sequence population containing 30 randomized residues than from a pool
spanning 80 randomized residues. However, any short functional tRNA mimics present
in the shorter population should also be present in equal or greater number in the longer
population. In most instances, the relative completeness of the pool is not a consideration
in the success of a selection. Indeed, it has been shown that functional nucleic acids are
not extremely rare (for reviews see Gold et al., 1995, and Fitzwater and Polisky, 1996)
and can be isolated both from “complete” pools that span 20 random sequence positions
and from very “incomplete” pools that span 90 random sequence positions.
DNA Pools for In
Vitro Selection
Having dismissed considerations of complexity and representation, the one guiding
principle that emerges from this analysis is that longer pools are more generally useful
for selection experiments than shorter pools. However, this principle must be applied
with appropriate caveats. First, aptamers derived from shorter pools are easier to analyze.
Sequence and structural motifs embedded within a 30-nucleotide random sequence region
are much more readily apparent than sequence and structural motifs embedded within a
90-nucleotide random sequence region, especially if the motifs are not colinear. Second,
24.2.6
Supplement 88
Current Protocols in Molecular Biology
longer pools are more difficult and costly to synthesize than shorter pools. Finally, longer
pools are more likely to yield amplification or other selection artifacts than shorter pools.
For example, pools that contain random regions greater than 90 nucleotides in length can
form self-aggregates that precipitate from solution upon prolonged incubation, and thus
require immobilization on a solid support prior to selection (Bartel and Szostak, 1993;
Lorsch and Szostak, 1994). Because of these considerations, pools used for the in vitro
selection of aptamers typically contain from 20 to 80 random sequence positions.
Longer pools are not only desirable but are likely required in selections for complex
functions, such as catalysis. Pools used for the selection of ribozymes typically contain
from 50 to 220 random sequence positions (for recent reviews see Scott, 2007; Pan
and Clawson, 2008; Piganeau, 2009). The optimal length of the random region is an
active area of research (Sabeti et al., 1997) where many of the fundamental parameters
remain to be defined. A computational analysis of structural diversity in RNA pools
suggested that longer pools may not be substantially more functional than shorter pools
(Kim et al., 2007), although our practical experience continues to suggest otherwise.
Practically, though, longer pools must be synthesized as oligonucleotides of 150 residues
or fewer in length because of the constraints of DNA synthetic chemistry. For this reason,
pools longer than 150 bases are typically generated in a modular fashion by ligating
together individual, synthetic oligonucleotides (Bartel and Szostak, 1993). Segments
of shorter DNAs can be stitched together by the inclusion of unique restriction sites
(Bartel and Szostak, 1993). Asymmetric restriction sites, such as AvaI (C|YCGRG),
BanI (G|GYRCC), and StyI (C|CWWGG), where Y = C or T, R = A or G, and W =
A to T, are very useful for this task since they minimize intra-pool dimerization via
self-ligation. Also, these enzymes are cost-effective for digesting large amounts of DNA.
Alternatively, an overlapping region can be included at the 3 end of each synthetic
oligonucleotide and mutually primed synthesis (e.g., UNIT 8.2) of a longer template can be
carried out. After assembling pool modules, the complexity (yield) of the new, aggregate
pool will need to be freshly assessed. The upper boundary of the complexity of an
assembled pool (e.g., 1011 100-mer modules × 1011 100-mer modules) will likely be
much larger than its actual complexity (e.g., 100 μg of ligated 200-mer, 9.12 × 10¹⁴
molecules).
Segmentally random pool design (binding site and aptamer selection)
In general, the rules governing the design of segmentally random pools are idiosyncratic,
depending on experimental purpose. If the desire is to better define a known binding site,
then relatively short sequence tracts (i.e., from four to ten residues) should be completely
randomized. The randomization of longer sequence tracts may lead to the selection of
novel binding sites rather than variants of a known binding site. The residues can either
be colinear (as is the case for many DNA binding sites) or dispersed (as is the case for
many RNA binding sites). If the desire is to identify a binding site within the context
of a known structural element, then from four to twenty residues can be completely
randomized. In this instance, the fewer the number of residues that are randomized, the
more likely it will be that the selected sequences will resemble a wild-type binding site or
retain an engineered structure. The greater the number of residues that are randomized,
the more likely it will be that a novel aptamer sequence or structure will be discovered.
Recently, computational models and simulations have been developed that might help in
the design of “smart” pools (Chen, 2007).
Primer design
When designing pools, the constant sequences at the 5 and 3 ends of a pool function as primer-binding sites and can be almost any sequence or length. Primers of 20
nucleotides in length are convenient because their melting temperatures are convenient
Generation and
Use of
Combinatorial
Libraries
24.2.7
Current Protocols in Molecular Biology
Supplement 88
for PCR and they can easily be synthesized in high yields. In designing constant sequences and complementary primers, obvious artifacts associated with the PCR, such
as secondary-structure formation or self-association that could lead to the production of
primer dimers, should be avoided. Web-based programs such as Integrated DNA Technologies’ OligoAnalyzer (http://www.idtdna.com/analyzer/Applications/OligoAnalyzer)
or MIT’s PRIMER3 (http://frodo.wi.mit.edu) can assist in designing constant primerbinding regions. Each of these programs has initial variables that must be set. Utilizing
the values that mimic reaction conditions (such as salt and dNTP concentrations in PCR)
is suggested. As a rule of thumb, one should try to avoid using the same triplet sequence
more than once in either of the constant regions; attempt to ensure that the GC content
is between 45% and 60%; and check primer sequences to avoid self-dimerization, the
formation of hairpins, and cross-hybridization (Singh and Kumar, 2001; Abd-Elsalam,
2003).
Beyond these basal considerations, there are two schools of thought regarding the sequence of the priming site itself. On the one hand, designing primers to possess a 3
clamp of 5 -WSS-3 (IUB codes: W = A or T, S = C or G), such as ACC, ensures
good extension by polymerases. On the other hand, the inclusion of A/T-rich regions
at the 3 termini of primers reduces the frequency of mispriming and allows virtually
“infinite” multiplication of DNA amplicons (Crameri and Stemmer, 1993). The inclusion
of restriction sites within primer regions can facilitate cloning of selected nucleic acids
into specific plasmids, although palindromes adjacent to the 3 ends can also facilitate
the genesis of primer-dimers. So-called T/A kits that take advantage of the propensity of
Taq polymerase to incorporate untemplated adenines at the 3 end of amplicons are also
frequently utilized.
Finally, primers for partially randomized pools should be designed so that they do not
conflict with the folding or accessibility of a known DNA or RNA binding site. It is
suggested that the secondary structure of the wild-type binding site with any appended
primer-binding sites be determined using an algorithm such as Mfold (Jaeger et al., 1989;
Zuker, 2003). If the native or wild-type structure of the binding site is not among the
most common folds, then the primers should be redesigned. Additional improvements
in primer and probe design have been stimulated by the desire to carry out single
nucleotide polymorphism analyses, whole-genome sequencing, phylogenetic analyses,
and quantitative PCR (Vieux et al., 2002; Boutros et al., 2009). In addition, methods have
begun to be developed that address the interference of constant sequences and primer
binding sites during selection (Legiewicz et al., 2005; Pan and Clawson, 2009).
If an RNA pool is to be constructed, runoff RNA transcripts for in vitro selection are
frequently made with T7 RNA polymerase. There are several known promoters for T7
RNA polymerase (Milligan et al., 1987), but the following minimal sequence gives good
yields:
-17 -1
5 -TAA-TAC-GAC-TCA-CTA-TA-3
DNA Pools for In
Vitro Selection
Addition of a G and C residue at the -18 and -19 positions of the minimal promoter helps to
close the DNA duplex and stabilize the 5 end of the promoter region, thereby increasing
transcriptional yields. Transcription initiation is optimal when there are stretches of
purines in the +1 and +2 positions, with GG being the best initiator (Milligan et al.,
1987). Transcriptional yields also increase if uridine does not appear in the transcript
before position 6. Typical pool designs incorporating all the elements described are
shown in Figure 24.2.2.
24.2.8
Supplement 88
Current Protocols in Molecular Biology
Chemically Synthesizing the Pool
While pools of genomic DNA sequences have been used for selection (Singer et al., 1997),
partially or completely random sequence pools must be chemically synthesized. Modern DNA synthesizers utilize phosphoramidite chemistry (UNIT 2.11) or H-phosphonate
chemistry (Strömberg and Stawinski, 2004) and can routinely produce usable amounts of
DNA up to 150 nucleotides in length. Longer oligonucleotides can also be synthesized,
but products of side reactions such as branching and depurination accumulate throughout
the synthesis, and the amount of final, usable product recovered can be vanishingly small.
Since stepwise coupling efficiencies for a long oligonucleotide are, on average ≥98%,
the typical yield of a 100-base synthesis that starts with a 1-μmol column is 13.5%, or
13.5 nmol, or 1 × 10¹⁶ different molecules, of which ∼10% to 30% can be enzymatically elongated or amplified. Several strategies can be used to enhance the synthetic
yield of oligonucleotides that are longer than 100 bases (see UNIT 2.11). Further, if a pool
longer than ∼150 nucleotides is desired, smaller pools can be modularly synthesized and
coupled by ligation or mutually-primed synthesis (see discussion of completely random
pool design, above).
Deciding on commercial synthesis
With the advent of oligonucleotide synthesis companies such as IDT, Sigma, and Invitrogen, primers and pools can now be custom ordered. Because of reagent costs, the need for
specialized synthetic expertise, and equipment overhead, it is frequently better to order a
pool than to synthesize it in the lab. While the yield of homemade and outsourced pools
is often similar, the quality of randomization and the overall synthetic integrity (number
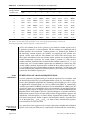
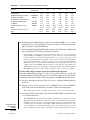
of extendable sequences) are typically much higher from synthesis companies (see Table
24.2.2 for a comparison).
In determining the costs for outsourcing, the length of the overall pool and the type of
random region desired are the primary considerations. Many commercial supply houses
with businesses focused on primer production set price ranges based on size, and thus
longer pools are forced into higher price ranges. Most pools should be synthesized on
either a 100 nmol scale (up to 90 nt) or a 250 nmol scale (90 to 100 nt). That said,
there is a substantial difference in price between these two scales ($0.55 and $0.95 per
nucleotide, respectively). There is also frequently a separate setup fee for mixing an “N”
bottle of phosphoramidites.
The yield and quality of pools should also be considered when deciding between commercial and in house synthesis. In the authors’ experience, yields were similar: for both
a longer and shorter pool, around 10% of the synthesis could be recovered as full-length
products (a coupling efficiency of ∼97.6 ± 0.2%; see Table 24.2.2). Pool complexity is also a function of the number of full-length sequences that can be replicated
Table 24.2.2 Comparison of Synthetic Methods for Two Pools
Pool
Synthesis
method
Crude yield
Coupling
efficiency
Extension
efficiency
N73
IDTb
N44
b
$277.70
7.4%
97.7%
44%
IDT
$136.90
12.4%
97.5%
69%
N73
In house
$293
8.6%
97.8%
6%
N44
In house
$293
11.8%
97.4%
17%
Costa
a Costs reflect available discounts and are stated in 2009 dollars.
b IDT: Integrated DNA Technologies (http://www.idtdna.com/).
Generation and
Use of
Combinatorial
Libraries
24.2.9
Current Protocols in Molecular Biology
Supplement 88
(extendability). In the authors’ experience, commercial syntheses produces 4- to 7-times
more replicable or extendable sequences than in-house syntheses. The overall randomness of pools is also a consideration. In the authors’ experience, IDT does an adequate
job of producing pools with little compositional skewing. When analyzing a sample
of 17 variants from an N44 pool synthesized by IDT the base ratios of A:C:T:G were
25.4%:21.1%:25.9%:27.6% (744 total bases in the random region). In contrast, during in-house synthesis, coupling efficiencies of the different phosphoramidites must be
painstakingly optimized to avoid skewing (as discussed below under In-house synthesis).
There are other trade-offs however, including the time of delivery. For in-house methods,
pools can be synthesized, deprotected, and lyophilized in as little as one full day, while
upwards of 2 weeks may be required for an outsourced order. In addition, when synthesizing pools in-house, additional syntheses do not greatly increase the cost, due to reagent
quantities. Therefore, while synthesizing one pool in-house is often cost-prohibitive,
synthesizing multiple pools may provide a savings over commercial sources.
In house synthesis
In certain cases, such as the production of doped pools, it may be desirable to perform
a synthesis “in-house.” IDT and other synthesis companies typically charge $100 for
each hand-mixed bottle, and a doped pool utilizes five such bottles for doped regions
that are less than or equal to 40 nt. For longer pools, the cost for doping may well be
over $1000. Therefore, in-house synthesis of doped pools may still be the best option.
Most synthesizers can be programmed for in-line, degenerate mixing of bases. While
this method is useful when only a few positions must be randomized, because of the
extremely fast reaction of the activated phosphoramidite with the newly deprotected
5 hydroxyl, random sequences will be skewed towards the phosphoramidite that first
enters the column. Therefore, for longer pools or pools that should contain a statistically
random distribution of nucleotides, it is better to manually mix the phosphoramidites
off-line and use this mixture for the synthesis of degenerate sequence positions. A
more stochastic distribution can be obtained by including larger amounts of A and C
phosphoramidites in the mix to compensate for the faster coupling times of G and T
phosphoramidites (Zon et al., 1985). Suggested ratios include a 1.5:1.5:1.0:1.2 molar
ratio of A:C:G:T phosphoramidites (D.P. Bartel, pers. comm.), a 1.30:1.25:1.45:1.00
molar ratio of A:C:G:T (Unrau and Bartel, 1998) and a 1.50:1.25:1.15:1.00 molar ratio
of A:C:G:T (see User’s Manual for PE Biosystems Models 392 and 394 DNA/RNA
Synthesis).
Doped pools are among the most difficult to synthesize (Hermes et al., 1989; Bartel
et al., 1991). Doping can be accomplished by using phosphoramidite mixtures that have
been adjusted to ensure the proper level of partial randomization of a given nucleotide.
For example, a 10% doped pool would contain 90% of the wild-type nucleotide at each
doped position, and 3.3% of each of the non-wild-type nucleotides. If a doped pool is to
be synthesized in which non-wild-type residues are included at a rate of 10%/position,
then for the 2 -deoxyadenosine bottle, a molar ratio of 33.43:1.50:1.00:1.21 of A:C:G:T
phosphoramidites should be used. These ratios were derived by first adjusting for the
relative molecular mass and coupling differentials of the individual phosphoramidites,
then mixing the phosphoramidite solutions on a percent volume basis to yield the desired
extent of doping. This process is described in greater detail below.
DNA Pools for In
Vitro Selection
To normalize the coupling of different phosphoramidites, relative correction factors
that take into account different coupling efficiencies and molecular masses must be
calculated. Multiplying together these correction factors gives an overall correction factor to provide equal molar coupling of each phosphoramidite. Table 24.2.3 displays
24.2.10
Supplement 88
Current Protocols in Molecular Biology
Table 24.2.3 Representative Calculations Based on the Masses and Efficiencies for Couplings
that Utilize the Canonical Tetrazole Activation Chemistry and Phosphoramidites Bearing Standard
Protecting Groups
Phosphoramiditea
Molecular mass
(g/mol)
Mass
correction
Coupling efficiency
correction
Overall
correction
858
0.87
0.67
0.58
5 -CE-dA
b
5 -CE-dC
834
0.89
0.67
0.60
840
0.89
1.00
0.89
745
1.00
0.83
0.83
5 -CE-dG
5 -CE-dT
a CE (β-cyanoethyl)
b Ac-CE-dC can also be utilized for faster deprotection
Table 24.2.4 Volumes of Acetonitrile Needed to
Dissolve 1 g of Phosphoramidite
Phosphoramidite
5 -CE-dA
Volume
acetonitrile (ml)
11.6
12.0
17.8
16.6
5 -CE-dC
5 -CE-dG
5 -CE-dT
representative calculations based on the masses and efficiencies for couplings that utilize
the canonical tetrazole activation chemistry (UNIT 2.11 and Beaucage and Caruthers, 2000)
and phosphoramidites bearing standard protecting groups [cyanoethyl for the phosphates
along either isobutyryl (N-2 of guanine) or benzoyl (N-6 of adenine and N-4 of cytosine) groups]. Other chemistries and protections may require the substitution of other
correction factors.
Most modern synthesizers require that ∼1 g of phosphoramidite be dissolved in ∼20 ml
of acetonitrile to be used in the coupling reaction. Applying this constraint along with
the combined mass-coupling (overall) correction factor gives the volumes shown in
Table 24.2.4 to dissolve 1 g of each phosphoramidite. Therefore, if equal volumes of
each of these solutions are mixed, equal molar coupling should occur since the molar
concentrations have been adjusted to account for both the mass and coupling differentials.
This bottle will be referred to as an equiactive “N” bottle.
To simplify the mixing of the four doped phosphoramidites bottles, it is customary to
first resuspend each of the phosphoramidites in the corrected volumes of acetonitrile
shown in Table 24.2.4. Equal volumes of these solutions are then mixed to create an
equiactive “N” bottle. The doped bottles are then generated by mixing appropriate ratios
of the equiactive “N” solution with individual phosphoramidites solution according to
Table 24.2.5. As in the example above, if a 10% doped pool is to be synthesized in which
non-wild-type residues are included, then, for each degenerate nucleotide, 1 volume of
the equiactive “N” bottle should be mixed with 6.5 volumes of a given phosphoramidite.
In addition to varying nucleotide composition, it is also possible to vary the length
of random sequence that is synthesized. Deletions can be stochastically incorporated
during a synthesis by replacing the capping step with an acetonitrile wash (Bartel et al.,
1991). It is more difficult to stochastically incorporate insertions, but the lengths of
segmental random sequences in a pool can be mixed. For example, in Giver et al.
Generation and
Use of
Combinatorial
Libraries
24.2.11
Current Protocols in Molecular Biology
Supplement 88
Table 24.2.5 Amidite Mixtures for a Given Level of Mutagenesis in a Doped Poola
Equiactive
phosphoramidite
(volume ratio)c
0.25
1
2
3
4
5
6
7
8
1
15.0%
37.5%
50.0%
56.3%
60.0%
62.5%
64.3%
65.6%
66.7%
2
8.3%
25.0%
37.5%
45.0%
50.0%
53.6%
56.3%
58.3%
60.0%
3
5.8%
18.8%
30.0%
37.5%
42.9%
46.9%
50.0%
52.5%
54.5%
3.5
5.0%
16.7%
27.3%
34.6%
40.0%
44.1%
47.4%
50.0%
52.2%
4
4.4%
15.0%
25.0%
32.1%
37.5%
41.7%
45.0%
47.7%
50.0%
5
3.6%
12.5%
21.4%
28.1%
33.3%
37.5%
40.9%
43.8%
46.2%
6
3.0%
10.7%
18.8%
25.0%
30.0%
34.1%
37.5%
40.4%
42.9%
6.5
2.8%
10.0%
17.6%
23.7%
28.6%
32.6%
36.0%
38.9%
41.4%
7
2.6%
9.4%
16.7%
22.5%
27.3%
31.3%
34.6%
37.5%
40.0%
8
2.3%
8.3%
15.0%
20.5%
25.0%
28.8%
32.1%
35.0%
37.5%
Equiactive N (volume ratio)b
a Bold values represent common doping percentages per position.
b The equiactive “N” bottle should contain equal volumes of each of the resuspended phosphoramidites; see Table 24.2.4.
c Each of the phosphoramidites should be resuspended according to Table 24.2.4.
(1993), four columns were used to generate a pool with two random regions of 6 to
9 positions separated by a constant domain. The first column was synthesized with 6
random positions, the second with 7 random positions, etc. Following the addition of
the intervening constant sequence, the synthesis was stopped, the four columns were
opened, and the resins from the four columns were mixed. The mixed resins were
then equally redivided into four new columns and the synthesis was resumed. The first
column incorporated 6 positions, the second column 7 positions, etc. Thus, the first
column contained oligonucleotides in which the first random segment was 6, 7, 8, or 9
residues long, and a second random segment that was uniformly 6 residues long. The
second column contained oligonucleotides in which the first random segment was 6, 7,
8, or 9 residues long and a second random segment was uniformly 7 residues long, and
so forth. Following the completion of all four syntheses, the reactions were combined to
generate the final random sequence pool.
BASIC
PROTOCOL 1
DNA Pools for In
Vitro Selection
PURIFICATION OF A RANDOM SEQUENCE POOL
A newly synthesized oligonucleotide pool should be deprotected in accordance with
the instructions provided for a given phosphoramidite reagent (see, for example, step 1,
below), then lyophilized and purified on a denaturing polyacrylamide gel (UNIT 2.12) prior
to amplification. Oligonucleotides can also be purified using HPLC or commercially
available spin columns, but HPLC purification is not recommended for ssDNA pools due
to concerns about cross-contamination. Since oligonucleotides of equivalent length but
different sequence migrate at slightly varying rates (see User’s Guide for PE Biosystems
Expedite Nucleic Acid Synthesis System), a pool should appear as a broader band than a
homogeneous sequence. In fact, because of the presence of capped failure sequences and
depurinated, cleaved fragments, it is likely that the oligonucleotide product will appear
even more heterogeneous. Failure sequences will include the mixture of products that
are of the length pooln-1 , pooln-2 , pooln-3 , etc. Some of these foreshortened sequences
can eventually be recovered by PCR.
As a general note, since sequences exist as single copies prior to amplification, individual
species can be easily lost. Therefore, it is important to wash and elute the various filters,
24.2.12
Supplement 88
Current Protocols in Molecular Biology
tubes, and tips described below one or more times. The eluates can then be pooled for a
final precipitation and eventual amplification.
Contamination of primers or other solutions with a synthesized or isolated pool should
be avoided by using aerosol barrier tips. Similarly, gel plates used during purification
should be washed thoroughly to ensure that they are free of contamination with other
pools or primers.
Materials
DNA pool
Ammonium hydroxide
n-butanol
TE buffer, pH 8.0 (APPENDIX 2)
2× denaturing dye (see recipe)
3 M sodium acetate (APPENDIX 2)
Ethanol
Lyophilizer
75◦ and 90◦ C water baths
50-ml Sterile Conical Tube Filter Unit (Thermo Scientific Nalgene)
Fluorescent TLC plate (VWR), wrapped in plastic wrap
UV lamp
Razor blades
Small-bore syringes
13-ml centrifuge tubes capable of withstanding temperature extremes (Sarstedt)
Rotary shaker
Additional reagents and equipment for denaturing polyacrylamide gel
electrophoresis (e.g., UNIT 2.12)
1. After synthesis, deprotection, and cleavage from the solid support, lyophilize the
oligonucleotide solution to dryness or precipitate with a 10-fold volume of n-butanol.
For commercially synthesized pools, the nucleic acid has already been deprotected,
cleaved, and desalted. Oftentimes, a commercial supplier will also provide the option
to purify the pool via HPLC or PAGE.
As an example, when utilizing Glen Research synthesis reagents, such as Sterling phosphoramidites and columns, the manufacturer suggests an 8-hr incubation at room temperature
with 1 ml of ammonium hydroxide per 1 μmol synthesis for deprotection and cleavage.
The resin is then washed with 3 volumes of diH2 O and lyophilized to dryness.
The n-butanol precipitation can occur quite quickly at room temperature for longer
oligonucleotides. Shorter (<20 base) oligonucleotides may require longer or colder incubations. To ensure more efficient recoveries of oligonucleotides it is safest to precipitate
for ≥1 hr at −70◦ C.
2. Pour a 15 cm × 17 cm × 1.6 mm denaturing polyacrylamide gel (e.g., UNIT 2.12).
To allow for good separation of near-full-length from non-full-length products, the acrylamide concentration should be chosen so that the full-length oligonucleotide will migrate
approximately one-half to three-fourths of the way into the gel by the time the loading
dye reaches the bottom.
For a pool between 80 and 130 nt, this corresponds to an 8 to 10% gel. It is recommended
that pools be sieved on a medium-format gel (15 cm × 17 cm) with 1.6 mm spacers to
ensure good separation and to prevent overloading.
3. Resuspend the lyophilized or precipitated pellet in 100 μl of water or buffer (i.e.,
TE buffer, pH 8.0) per 250-nmol-scale synthesis, and add an equal volume of 2×
denaturing dye. Heat denature samples at 75◦ C for 5 min prior to loading. Load the
Generation and
Use of
Combinatorial
Libraries
24.2.13
Current Protocols in Molecular Biology
Supplement 88
entire 250 nmol scale synthesis or up to 1/3 of a 1 μmol synthesis per polymerized
gel and perform electrophoretic separation (UNIT 2.12).
It is often convenient to load several (six) wells in the gel in parallel, although a single
well that extends the breadth of the gel can also be loaded.
4. Place gel on a fluorescent TLC plate that has been wrapped in plastic wrap and
excise the oligonucleotide product from the gel with the aid of a UV lamp, using
razor blades.
The desired oligonucleotide product is generally the darkest, shadowed band on the
gel (excluding UV-absorbing material that runs at the dye front). If stepwise synthetic
efficiency has been low, the product will appear as a smear instead of as a clear band.
Since many of the n-1, n-2, etc. products can be converted into full-length products by
the polymerase chain reaction, a fairly wide band of near full-length products can be cut
from the gel. The excision should be carried out relatively quickly, since unnecessarily
long UV exposure can damage the oligonucleotide product.
The full-length oligonucleotide product should be the slowest-migrating band. However,
if deprotection has been incomplete, lighter bands that migrate considerably above the
major fully deprotected band may be observed.
Unpolymerized acrylamide absorbs strongly at 211 nm and may cause shadowing at the
edges and wells of the gel. This can obscure the resolution or recovery of bands in the
outer lanes.
5. Elute the oligonucleotide from the gel slices as follows.
a. To aid in the diffusion of the oligonucleotide from the acrylamide matrix, chop
gel slabs into fine particles by forcing the gel through a small-bore syringe.
b. Place the crushed gel slabs in a 13-ml centrifuge tube capable of withstanding
temperature extremes.
c. Add 3 ml of TE buffer, pH 8.0, per 0.5 ml of gel slab (typically corresponding to
two wells). Do not exceed 13 ml of buffer for the entire gel slab. Place the sample
at −80◦ C for 30 min or until it is frozen solid.
d. Quickly thaw the tube in a hot water bath and then let it soak at 90◦ C for 5 min.
Elute the DNA overnight at 37◦ C or room temperature on a rotary shaker.
This freeze-rapid thaw approach (Chen and Ruffner, 1996) allows ice crystals to break
apart the acrylamide matrix, increasing yield and decreasing elution time. Typically, 80%
of a 20-mer oligonucleotide can be recovered after 3 hr of rotary shaking, making this
technique comparable to electroelution (see, e.g., UNIT 2.7).
Because elution is a diffusion-controlled process, higher elution volumes or serial elutions from the same gel slice can increase the amount of DNA recovered. Longer oligonucleotides diffuse from the gel more slowly than shorter sequences. Samples of especially
long synthetic DNAs and RNAs that are particularly resistant to elution with aqueous
buffers may be eluted more easily in 6 vol of formamide (>5 hr at room temperature),
followed by a brief elution with an aqueous buffer (∼1 hr). Isoamyl alcohol extraction
(e.g., UNIT 2.12) can be used to bring the extracts to a convenient volume for subsequent
precipitation.
6. Filter the eluted oligonucleotide through a conical tube vacuum filter unit to remove
the remaining polyacrylamide gel fragments.
DNA Pools for In
Vitro Selection
7. Precipitate the eluted oligonucleotide pool by adjusting the salt concentration to
0.3 M, adding from a 3 M sodium acetate stock solution, then adding 2.5 vol of
ethanol. Keep at −20◦ C for 3 hr, then microcentrifuge at maximum speed, 4◦ C.
Lyophilize to dryness. Resuspend the synthetic pool in TE buffer, pH 8.0 (to protect
against nuclease contamination or drastic pH changes).
24.2.14
Supplement 88
Current Protocols in Molecular Biology
If the volume of the eluted oligonucleotide is too large to conveniently precipitate, concentrate the sample by extracting against an equal volume of n-butanol. Remove the upper
butanol layer and repeat until the aqueous volume is convenient for precipitation. About
1/5 of the aqueous layer is extracted into the organic butanol layer for every volume
of butanol used. If too much butanol is used, thereby completely extracting the aqueous
layer into the butanol, add more water and repeat the concentration.
DETERMINING THE POOL COMPLEXITY
The number of different molecules present in a population can affect the outcome of a
selection experiment (see Troubleshooting). If the pool complexity is too low for a given
application, the pool will have to be resynthesized.
SUPPORT
PROTOCOL 1
Pool complexity is, in turn, a function of yield and of the number of molecules in the pool
that can be fully extended by a polymerase. The overall yield of the synthesis can be calculated by determining the UV absorption of the pool. However, deletions, incompletely
deprotected residues, or backbone lesions that arise during chemical synthesis decrease
by 10% to 40% the fraction of molecules in a synthetic pool that can be fully extended
by polymerases. For example, the rate of insertions (presumably due to a DMTr group
cleavage via tetrazole) has been measured to be as high as 0.4% per position, and the
rate of deletions (presumably due to incomplete capping) has been found to be as high as
0.5% per position (A. Keefe and D. Wilson, pers. comm.). The number of usable DNA
molecules that are actually present in a nascent pool can be calculated by determining
the fraction of the pool that can be extended by Taq polymerase.
Materials
Purified ssDNA pool
PCR primers
T4 polynucleotide kinase and buffer (New England Biolabs)
[γ-32 P]ATP (>3000 Ci/mmol)
0.5 M EDTA, pH 8.0 (APPENDIX 2)
3 M sodium acetate (APPENDIX 2)
25:24:1 phenol/chloroform/isoamyl alcohol saturated with 10 mM Tris·Cl, pH
8.1/1 mM EDTA (see UNIT 2.1A or purchase from Sigma)
3.0 M sodium acetate
70% and 95% ethanol
TE buffer, pH 8.0 (APPENDIX 2)
1 mg/ml blue-dyed glycogen (GlycoBlue; Ambion)
10× PCR amplification buffer (see recipe)
Taq DNA polymerase
2× denaturing dye (see recipe)
Thermal cycler
15 cm × 17 cm × 0.75 mm denaturing polyacrylamide gel (UNIT 2.12)
Phosphor imager plate and phosphor imager (APPENDIX 3A)
Additional reagents and equipment for quantitation of DNA (e.g., APPENDIX 3D),
end-labeling of DNA (e.g., UNIT 3.10), phenol/chloroform and chloroform
extraction of DNA (UNIT 2.1A), PCR amplification (e.g., Chapter 15), denaturing
polyacrylamide gel electrophoresis (UNIT 2.12), and phosphor imaging
(APPENDIX 3A)
1. Quantitate DNA by UV absorption assuming that A260 of 1.0 indicates ∼37 μg/ml
of single stranded DNA.
Also see APPENDIX 3D.
Generation and
Use of
Combinatorial
Libraries
24.2.15
Current Protocols in Molecular Biology
Supplement 88
2. Label the 5 end of the 3 PCR primer with [γ-32 P]ATP by preparing the following
reaction mixture:
For a 20-μl reaction:
2 μl 10× NEB T4 polynucleotide kinase buffer
80 pmol dephosphorylated DNA, 5 ends
20 pmol (150 μCi) [γ-32 P]ATP
10 U T4 polynucleotide kinase
Incubate 60 min at 37◦ C, then stop the reaction by adding 1 μl of 0.5 M EDTA.
Phenol/chloroform and chloroform extract the labeled oligonucleotide (see UNIT 2.1A),
and precipitate by adding one-tenth volume of 3 M sodium acetate (for a final
concentration of 0.3 M) and 2.5 volumes of 95% ethanol to precipitate the RNA.
Mix and incubate at −80◦ C for 15 min. Microcentrifuge 10 to 15 min at maximum
speed, 4◦ C, to recover the precipitate. Wash the pellet with cold 70% ethanol and
dry the pellet completely. Redissolve the labeled DNA pellet in 20 μl of TE buffer,
pH 8.0.
Also see UNIT 3.10.
The authors frequently include 3 μl of a 1 mg/ml blue-dyed glycogen solution to increase
the yield of nucleic acid precipitation and to better visualize the pellet. If glycogen would
prevent binding to a given target, transfer RNA can also be used as a carrier, but will
obfuscate the quantification of the pool RNA (see below).
The primer concentration after this step should be 4 μM. The volume of the reaction and
the concentration of DNA and [γ -32 P]ATP will vary depending on application.
This procedure ensures that most of the unincorporated label remains in the supernatant.
In addition, a desalting column can be employed to ensure complete removal of unincorporated label prior to the phenol/chloroform extraction.
3. In two separate reactions, incubate ∼10 pmol of labeled primer with (or without) a
10-fold molar excess of pool in a 30-μl extension reaction in 1× PCR amplification
buffer, under the same conditions that will be used in the final amplification, in a
thermal cycler as follows (see, e.g., UNIT 15.1 for PCR).
a. Denature and anneal the primer and template DNA in 1× PCR amplification
buffer.
Typical thermal cycling conditions include denaturation at 94◦ C for 5 min, annealing at
∼50◦ C for 1 min, and extension at 72◦ C for 20 min. More commonly referred to as a Taq
extension assay, this procedure is one cycle of PCR with a long extension step.
b. Finally, terminate the reaction by the addition of an equal volume of 2× denaturing
dye.
4. Heat the extension reaction to 90◦ C for 3 min and load the reaction on a 15 cm ×
17 cm × 0.75 mm denaturing polyacrylamide gel. Electrophorese until the dye is at
or near the bottom of the gel, but do not let the radiolabeled primers run off.
Also see UNIT 2.12.
It is also useful to load a separate well with an aliquot of the primer alone to verify that
the band is of the correct size. Appropriately radiolabeled size markers can also be used
to gauge size. Choose an acrylamide percentage that allows efficient separation of small
primers from larger extended products.
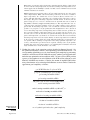
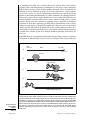
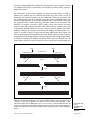
5. Dry and expose the gel to a phosphor imager plate. Using a phosphor imager
(APPENDIX 3A), quantify the control primer band and the extended product band
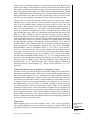
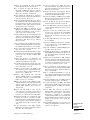
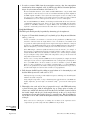
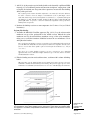
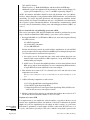
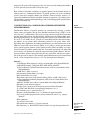
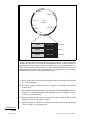
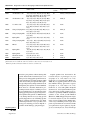
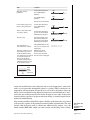
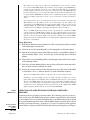
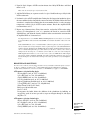
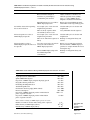
(see Fig. 24.2.4 for expected results).
DNA Pools for In
Vitro Selection
24.2.16
Supplement 88
Current Protocols in Molecular Biology
3′
5′
fully extended pool
3′
3′
aborted extension
products
5′
primer
only
primer
+ template
5′
unextended primer
Figure 24.2.4 Typical extension reaction. The pool used (N59) is shown to the right, next to the
figure of the gel. Lane 1 shows the fully extended product and a large number of extensions on
incomplete or damaged templates. Lane 2 is a control reaction containing only the primer. The
extension reaction was incubated for 30 min.
There may be a smear leading up to the extended band. Determining how much near-fulllength material to include in the quantitation is a somewhat subjective decision. Calculate
the percent extension by dividing counts of labeled, extended product by counts of labeled
primer. Percent extension for a gel-purified ssDNA pool can range from 10% to 30% for
in-house syntheses to as high as 75% for commercial syntheses. The complexity of the
pool is then the yield (determined in step 1) multiplied by the extension efficiency (percent
extension determined above). If the complexity of the pool is insufficient for planned
experiments, then the pool must be resynthesized.
DETERMINING THE POOL BIAS
Following extension, the reaction should be repeated using a cold primer and the nonradioactive double-stranded DNA pool should be amplified in a PCR reaction, cloned
(e.g., using a TA cloning kit from Invitrogen), and individual members sequenced to determine the degree of randomness. The cloning step could also be carried out following
PCR optimization (see Support Protocol 3). From 20 to 30 clones should be sequenced
to determine the base composition of the starting pool. The random region should be
composed of roughly 25% of each base. A pool with the random region skewed toward
one or more bases (>30%) should be resynthesized.
SUPPORT
PROTOCOL 2
Generation and
Use of
Combinatorial
Libraries
24.2.17
Current Protocols in Molecular Biology
Supplement 88
SUPPORT
PROTOCOL 3
SMALL-SCALE PCR OPTIMIZATION OF POOL AMPLIFICATION
To enhance yield and further avoid bias, the amplification conditions for a pool should be
optimized prior to carrying out a large-scale amplification. Moreover, since amplifying
a pool is costly in terms of both time and money, any optimization of the PCR should
first take place on a small scale. The more involved large-scale amplification can then be
carried out with confidence.
Materials
Purified ssDNA pool
PCR primers
PCR amplification buffer (see recipe) containing 1.5 mM Mg2 +
dNTP mix (dATP, dCTP, dGTP, dTTP; UNIT 3.4)
Taq DNA polymerase (e.g., New England Biolabs)
3.8% NuSieve 3:1 agarose gel (Cambrex; also see UNIT 2.5)
1× TBE buffer (APPENDIX 2)
dsDNA mass markers (e.g., Invitrogen)
Thermal cycler
Densitometer
Additional reagents and equipment for PCR (Chapter 15) and agarose gel
electrophoresis (e.g., UNIT 2.5)
1. Carry out a 100-μl PCR reaction using a 1:50 dilution of synthetic pool oligonucleotide as template, 2 μM primers, and PCR buffer with 1.5 mM magnesium. Use
the manufacturer’s suggested quantity of Taq polymerase (e.g., 2.5 U of New England
Biolabs Taq) in a reaction containing 200 μM each dNTP. A suggested temperature
regime is:
1 cycle:
1 to 10 additional cycles:
5 min
1 min
20 min
30 sec
1 min
1 min
95◦ C
50◦ C
72◦ C
95◦ C
55◦ C
72◦ C
(denaturation)
(annealing)
(extension)
(denaturation)
(annealing)
(extension).
After 4 to 8 cycles of amplification, check the length and purity of the amplified
DNA on a 3.8% Nu Sieve agarose gel in 1× TBE buffer (e.g., UNIT 2.5) using dsDNA
mass markers.
Conditions for the initial extension step should mimic those in step 3 of Support Protocol
1 to maintain pool complexity. The annealing step should be modified to reflect predicted
primer melting temperatures and conditions.
Annealing temperature may need to be adjusted to as low as 45◦ C depending on primer
composition (e.g., for a small or AU-rich primer). A gradient PCR can be carried out to
assay different annealing temperatures simultaneously and thereby optimize the amplification procedure (see Fig. 24.2.5 for expected results).
A 100-μl reaction typically yields ∼1 μg, but the amount can vary from 0.1 to 10 μg. A
fuzzy band may indicate that too many cycles of PCR have been carried out. In this case,
set up the reaction again and perform fewer cycles.
2. Dilute the double-stranded PCR DNA product 1:128, and repeat the PCR reaction,
removing a 5- to 10-μl aliquot during the last 10 sec of the cycle-7 extension step.
DNA Pools for In
Vitro Selection
24.2.18
Supplement 88
Current Protocols in Molecular Biology
annealing
54.6 C
PCR cycles
0 2 4 6 8
100-bp ladder
annealing
51.7 C
PCR cycles
0 2 4 6 8
100-bp ladder
annealing
48.4 C
PCR cycles
0 2 4 6 8
100-bp ladder
annealing
45.5 C
PCR cycles
0 2 4 6 8
100-bp ladder
100-bp ladder
annealing
41.7 C
PCR cycles
0 2 4 6 8
annealing
58.4 C
PCR cycles
0 2 4 6 8
synthesis
at IDT
synthesis
in house
3′
3′
5′
3′
5′
5′
Figure 24.2.5 A PCR cycle course and optimization of annealing temperature. The gel follows amplification
of the N73 pool across a gradient of annealing temperatures. Two different pool synthesis methods were
analyzed. Samples were removed after 0, 2, 4, 6 and 8, cycles. The pool used in the cycle course is depicted
below the figure of the gel. IDT: Integrated DNA Technologies (http://www.idtdna.com/).
Serially dilute the amplified product 1:2, 1:4, . . . 1:128. Electrophorese all of the
samples on a large agarose gel (UNIT 2.5).
Note that it is quite difficult to accurately pipet solutions at 72◦ C. It may therefore be
desirable to pipet an amount slightly larger than that intended for use in the serial dilution.
3. Calculate the average PCR amplification efficiency by identifying to what extent the
cycle-7 PCR reaction is the result of progressive doublings of the original synthetic
DNA. Determine which dilution lanes lack detectable DNA.
The largest dilution that lacks detectable DNA is also the dilution that is a minimum
estimate of the number of doublings. For example, if the 1/64 dilution is the largest
dilution without detectable DNA, this implies that six “doublings” of the synthetic DNA
yielded at least 64-fold more DNA. This is expressed as follows:
(average efficiency)no. of theoretical doublings (i.e., PCR cycles) = fold increase in DNA
Thus, if 7 cycles of PCR were performed, then the average number of doublings per cycle
is ∼1.81 [from (∼1.81)7 = 64].
4. Modulate PCR conditions to enhance PCR efficiency.
If the pool’s average number of doublings per cycle is <1.8, then the PCR conditions
chosen may skew the representation of the pool. In that case, PCR conditions should be
modulated to enhance PCR efficiency. The following parameters or variables are most
amenable to modification. It is best to begin the optimization with a single set of reaction
conditions, modify individual parameters relative to this one reference reaction, and then
combine all advantageous alterations into a single reaction. For more information on
PCR see UNIT 15.1.
Theoretically PCR can proceed until the primers or dNTPs are depleted. Therefore, primer
and dNTP concentrations should be well above those used for the amplification of small
amounts of DNA. Primer concentrations from 1 μM to as high as 5 μM have been used
(although concentrations >5 μM are generally not helpful). It may be useful to scan both
above and below 2.5 μM in 0.5-μM increments.
Generation and
Use of
Combinatorial
Libraries
24.2.19
Current Protocols in Molecular Biology
Supplement 88
Magnesium concentration affects both primer annealing and the fidelity of Taq (which
decreases with increasing magnesium concentration). Starting at the magnesium concentration supplied in the PCR buffer (usually 1.5 mM), scan in 1-mM increments toward
5 mM as a maximal concentration.
DNA denaturation at temperatures above 95◦ C is usually impractical, since this greatly
reduces Taq’s half-life. While other thermostable polymerases can be more resistant to
higher temperatures, they usually have a lower extension efficiency and are more expensive than Taq. Annealing temperatures are dependent upon both primer sequence
and length. The primer annealing temperatures should already be known from the
primer design process, or may be calculated via an algorithm that can be found at
http://idtdna.com/analyzer/Applications/OligoAnalyzer/. This algorithm takes into account nucleotide composition, stacking energies (according to Turner’s rules), and empirical data. An annealing temperature ∼5◦ C less than the calculated annealing temperature is a good place to begin optimization. The amplification is more efficient at
a lower annealing temperature, but mispriming and secondary-structure problems are
more pronounced. Higher temperatures improve the specificity, but decrease the overall yield of the reaction. To determine the optimum annealing temperature for a given
primer and magnesium concentration, one should scan in both directions around the
annealing temperature in 5◦ C increments. Finally, extension temperatures are modulated
by the properties of Taq, which will extend (although inefficiently) at temperatures as
low as 65◦ C. When extending at temperatures above Taq’s optimum temperature (70◦
to 75◦ C), somewhat more polymerase may be required; scanning of the enzyme quantity
should be done in 2.5-U increments. However, too much Taq may be harmful to structured
single-stranded nucleic acids (Lyamichev et al., 1993).
5. Confirm the results of the extension reaction described in Support Protocol 1 by
the optimization method as follows. After optimizing pool PCR conditions for >1.8
average number of doublings per cycle, determine the pool complexity by performing
another 0.1-ml PCR reaction with 2 nM of the original, synthetic pool oligonucleotide
under the now optimized reaction conditions. After 7 or more cycles of PCR, perform
agarose gel electrophoresis on serial dilutions of the PCR reaction adjacent to serial
dilutions of dsDNA mass markers. Calculate the amount of amplified DNA either
using a densitometer or by estimating which dilutions are most similar. Calculate the
approximate pool complexity as follows:
g of PCR DNA after N cycles of PCR
=
g avg. no. of doublings per cycle (see step 4)
g of starting extendable ssDNA
g of starting extendable ssDNA
=
330 g/mol × (no. of bases in full-length product)
mol of starting extendable ssDNA
mol of starting extendable ssDNA × (6.02 × 10²³ ) =
molecules of starting extendable ssDNA
molecules of starting extendable ssDNA
=
starting molecules
fractio
on of extendable ssDNA
DNA Pools for In
Vitro Selection
fraction of extendable ssDNA ×
no. of synthetic pool molecules = pool complexity
24.2.20
Supplement 88
Current Protocols in Molecular Biology
PCR efficiency should be optimized to balance the average number of doublings per
cycle against the total reaction volume. A pool of 1 × 10¹⁵ molecules (∼1.7 × 10⁹ mol)
at a starting template concentration of 2 nM will require 0.85 liters for amplification.
Therefore, it is greatly desirable to amplify the pool at the highest template concentration
that still gives a reasonable number of doublings per cycle. The amplification should
generate at least 8 copies of pool DNA if the pool complexity is to be archived and
preserved (see Basic Protocol 2).
LARGE-SCALE PCR AMPLIFICATION OF POOL DNA
Very long and complex pools often require PCR amplification on a multiple-milliliter
scale. Large-scale PCR differs from conventional PCR in that it is typically conducted in
water baths using 15-ml, 17 × 120-mm, screw-capped (Sarstedt) thermostable tubes to
accommodate the larger volumes. Amplification reactions of up to 2.5 liters have been
carried out in this way. Medium-scale amplifications can sometimes be carried out in
thermal cyclers that can accommodate multiple samples (e.g., 96-well PCR plates).
BASIC
PROTOCOL 2
Materials
Purified ssDNA pool and primers
0.5 M EDTA, pH 8.0 (APPENDIX 2)
2-butanol (for larger volumes)
3 M sodium acetate
Ethanol
TE buffer, pH 8.0 (APPENDIX 2), containing 50 mM of a salt such as KCl
Thermal cycler or three water baths (one must be a circulating water bath)
96-well PCR plate or 13-ml thermostable tubes (Sarstedt)
Thermometer
Styrofoam racks
Spectrophotometer or fluorimeter
Additional reagents and equipment for PCR amplification (UNIT 15.1; see Support
Protocol 3 for determination of conditions on a small scale) and
phenol/chloroform and chloroform extraction of DNA (UNIT 2.1A)
Plan the reaction
Since large-scale reactions are quite expensive in terms of nucleotides and enzyme,
preparedness and planning for the large-scale amplification cannot be overemphasized.
Primers <20 bases in length usually do not need to be gel purified and can instead be
purified by precipitation.
1. After identifying the optimal PCR conditions on a small scale (see Support Protocol
3), prepare reagents for the large-scale reaction. Set aside time for the large-scale
amplification, which will probably consume an entire day.
The size of the large-scale reaction will be determined in part by the amount of DNA pool
to be amplified and by the number of copies of the library that are desired. For example,
one copy of a dsDNA pool with a complexity of 1×10¹⁵ weighs ∼100 μg. Assuming a
16-fold amplification in which the typical amount of DNA recovered from a 100-μl PCR
reaction is 1 μg, then each 100-μl reaction should have 1 μg/16 = 60 ng of DNA. 100
μg total/60 ng/100 μl = 1667 × 100 μl, or a 167-ml reaction.
The authors normally start with a complexity to 1×10¹⁴ sequences and carry out a 10-fold
amplification. These parameters are ideally suited for one to two 96-well PCR plates that
will be inoculated with 20 to 50 μl (total) of the pool. Actual amounts will of course
depend on synthetic yield, extension efficiency, and amplification efficiency.
Generation and
Use of
Combinatorial
Libraries
24.2.21
Current Protocols in Molecular Biology
Supplement 88
Choose how the amplification will be carried out
If the volume of the large-scale amplification reaction is to be ≤100 ml
2a. Use a commercially available thermal cycler repetitively. Set the reaction mixture up
in advance, and pipet 100-μl aliquots into individual wells of a 96-well PCR plate.
3a. Carry out several small amplification reactions in advance to ensure that the optimized
conditions determined in Support Protocol 3 work with the PCR plate format, and
that amplification is uniform across the PCR plate.
4a. Perform thermal cycling on the entire reaction using multiple PCR plates.
For larger volumes
Reactions will be divided into aliquots in 13-ml thermostable (Sarstedt) tubes and amplified in a series of water baths. Construct floating racks by cutting off the bottom of
the tubes’ Styrofoam packing material. Reinforce these racks by wrapping their edges
with heavy tape. Place the racks iteratively in three circulating or static water baths held
at the denaturation, annealing, and elongation temperatures previously determined (see
Support Protocol 3).
2b. Determine how long it will take for the reaction mixture in a tube to come to thermal
equilibrium by constructing a temperature probe, placing a thermometer through the
top of a 13-ml Sarstedt tube filled with 10 ml of water. Place the probe in a rack with
other, similar tubes.
Typical equilibration times range from 2 to 8 min, depending on the temperature differential. Annealing and extension times of 5, 6, and 7 min are typical. It should be noted that
these ramping temperature profiles are very slow relative to a commercial PCR machine
and can yield more amplification artifacts.
3b. To ensure that the reaction conditions actually work as planned, fill the rack with
tubes of water, a single amplification reaction, and the temperature probe. Denature
the sample for 30 min, and then add Taq after the first annealing step. Take aliquots
at each cycle to monitor the progress of the reaction.
4b. When reaction conditions have been confirmed, proceed with the remaining amplification reactions. Allow the final extension step to proceed for at least 20 min to
ensure that all templates are completely double-stranded.
Do not be alarmed if the solution becomes cloudy; the detergent in the buffer causes the
turbidity.
Amplification efficiencies of 3 to 4 doublings in 5 cycles can typically be achieved using
this method.
5. Following the amplification, pool the reactions from the individual wells or tubes.
Chelate the magnesium in the buffer by adding 1.1 molar equivalents of EDTA, pH
8.0 (from 0.5 M stock).
The reactions can be left at 4◦ C overnight.
6a. If the PCR reaction volume is ≤100 ml: Proceed directly to step 7.
6b. If the PCR reaction volume is ≥100 ml: Add an equal volume of 2-butanol and
extract to concentrate the reaction to a manageable volume (usually 10- to 20-fold).
Mix the layers by vortexing and then separate by centrifuging 5 min at 1200 × g at
room temperature, then discard the upper, 2-butanol layer. Repeat as necessary.
DNA Pools for In
Vitro Selection
About one-fifth of the aqueous layer is extracted into the organic 2-butanol layer for each
volume of butanol used.
24.2.22
Supplement 88
Current Protocols in Molecular Biology
7. After concentrating the DNA, carry out a phenol/chloroform extraction, followed by
two successive chloroform extractions (see UNIT 2.1A).
At this point, it should be possible to easily precipitate the DNA. Be sure to temporarily
save all of the organic layers in case of a mishap. Falcon tubes (50 ml) work well for
these extractions, as they are conveniently sized and have a small surface area. Alternatively, a Teflon extraction funnel may be useful since nucleic acids will not stick to its
surface.
8. Precipitate the DNA by adding one-tenth volume of 3 M sodium acetate (final
concentration, 0.3 M) and 2.5 vol ethanol in 13-ml Sarstedt tubes if possible.
If larger tubes are required, prepare a set of Beckman 250-ml high-speed centrifugation
bottles. Wash the centrifugation bottles with 15 ml of 3% hydrogen peroxide for 30 min
and then rinse three times, each time with 100 ml of distilled water to remove any residual
DNases that may remain from previous use (typically bacterial cell pelleting).
9. Resuspend the amplified DNA in 100 to 200 μl TE buffer, pH 8.0, containing 50 mM
of a salt such as KCl.
It is unwise to resuspend a double-stranded DNA pool in water, since the random segments
may denature, reassort, and become transcriptionally incompetent.
If it is suspected that the pool has become denatured (for example, if a large singlestranded DNA component is seen on a nondenaturing agarose gel), simply repeat one to
two cycles of PCR.
10. Quantitate the PCR DNA.
Determine the overall amplification efficiency and the final number of DNA molecules.
This can be done by carrying out gel electrophoresis in parallel with dilutions of a DNA
ladder of known concentration. The concentration can also be determined spectrophotometrically or by monitoring the change in absorbance of an intercalated fluorescent dye,
Hoechst 33258 (Sigma), on a fluorimeter (e.g., DyNA Quant 200, GE Healthcare). These
latter methods are much more quantitative (although the fluorimeter method may not be
accurate for sequences <100 nucleotides in length). However, these methods may not
distinguish precipitated double-stranded DNA from residual, precipitated nucleotides or
single-stranded primers.
The amount of DNA obtained from large-scale amplification is often referred to in terms
of the number of copies of the original synthetic pool’s complexity. For example, if the
starting pool had a complexity of 1 × 10¹⁵ molecules and 8 × 10¹⁵ total DNA molecules
were recovered, then, on average, 8 copies of the original starting pool were obtained
from the amplification. It should be noted that skewing may arise during amplification.
In addition, statistical skewing will occur during sampling of the amplified pool and may
cause this estimation to be inaccurate; nevertheless, it is empirically useful.
11. Following large-scale amplification, store at least 4 copies of the pool at −80◦ C.
Because of the aforementioned sampling errors, archiving at least 4 copies worth of
the pool DNA ensures the preservation of most of the pool’s complexity. The amount of
preserved pool complexity can be calculated using the following equation:
% of the pool complexity in a given sample = 100 × {1-[( x - y)/x]x }
where x is total number of pool copies, and y is the number of pool copies archived.
Therefore, in the example given above, if 4 of the 8 copies of the pool generated through
amplification are archived, then ∼99.6% of the original starting pool’s complexity is
preserved. Similarly, at least 4 copies of the pool should be used whenever manipulations
such as ligation, transcription, or biotinylation, are carried out, so that the original
complexity is also manifest in the manipulated or synthesized copies.
Generation and
Use of
Combinatorial
Libraries
24.2.23
Current Protocols in Molecular Biology
Supplement 88
REAGENTS AND SOLUTIONS
Use deionized, distilled water in all recipes and protocol steps. For common stock solutions, see
APPENDIX 2; for suppliers, see APPENDIX 4.
Denaturing dye, 2×
TBE buffer (APPENDIX 2) containing:
0.1% (w/v) bromphenol blue
7 M urea
Store up to 6 months at –20◦ C
PCR amplification buffer, 10×
500 mM KCl
100 mM Tris·Cl, pH 8.3 (APPENDIX 2)
x mM MgCl2
0.1% (w/v) gelatin
Store in aliquots at –20◦ C
This solution can be sterilized by autoclaving. Alternatively, it can be made from sterile
water and stock solutions, and the sterilization omitted.
15 mM MgCl2 in the 10× buffer is the concentration (x) used for most PCR reactions.
However, the optimal concentration depends on the sequence and primer of interest and
may have to be determined experimentally.
COMMENTARY
Background Information
DNA Pools for In
Vitro Selection
As early as 1955, researchers began developing methods to chemically synthesize
oligonucleotides (Michelson and Todd, 1955).
Modern synthetic procedures utilizing phosphoramidite chemistry and solid phase supports were developed and refined during
the 1970s and early 1980s (Beaucage and
Caruthers, 1981). The synthetic procedure
has been reviewed extensively (Beaucage and
Iyer, 1992; Brown, 1993; Iyer and Beaucage,
1999; Reese, 2005). Current oligonucleotide
synthetic methods involve a stepwise addition of nucleoside phosphoramidites to the 5 hydroxyl of an oligonucleotide immobilized
on Controlled Pore Glass (CPG) resin. The
dimethoxytrityl (DMTr) protecting group of
the oligonucleotide is first de-blocked with
trichloroacetic acid (TCA). This step produces a free trityl that can be monitored spectrophotometrically to assess extension efficiency. Then, the phosphoramidite is activated
by tetrazole, and nucleophilic attack of the
free 5 -hydroxyl results in the formation of
a phosphite bond. This process is very fast
(<30 sec) and typically goes to near completion (97% to 100%). Uncoupled oligonucleotides are capped with acetic anhydride and
1-methylimidazole to prevent further elongation. The capped sequences account for reduced yields during longer syntheses. During
the last step of the synthesis cycle, the phos-
phite bond is oxidized with iodine and pyridine
to yield the more familiar phosphotriester. The
DMTr group on the newly incorporated phosphoramidite is then deprotected, and the cycle
starts over. Variations on this cycle allow for
the incorporation of phosphorothioates, unnatural C-5 -C3 linkages, and other, more chemically challenging nucleosides.
With the development of de novo oligonucleotide synthesis, it became possible to not
only carry out site-specific mutagenesis but
also to create random sequence pools. Hermes
et al. (1989) used “spiked oligos” to select for
second-site suppressor mutations that could
rescue the catalytic activity of triosephosphate isomerase, while Oliphant and Struhl
(1989) carried out similar selections with βlactamase. It also became apparent that functional nucleic acids could be selected from
random sequence pools, and the Struhl lab
also selected double-stranded oligonucleotide
binding sites for the yeast DNA-binding protein GCN4 (Oliphant et al., 1990). This work
set the stage for many of the directed evolution
experiments that are carried out to this day.
Critical Parameters
Synthesis
Depending on the size of the pool to be
synthesized, the operation of the DNA synthesizer may first need to be optimized. Short
24.2.24
Supplement 88
Current Protocols in Molecular Biology
pools (<80 total nucleotides in length) can
be synthesized using standard protocols (see,
e.g., PerSeptive Biosystems, 1998). In order to
synthesize longer pools (>80 total nucleotides
in length), all reagents should be fresh, and
special care should be taken to exclude water
from the synthesis (see UNIT 2.1A). To ensure
equimolar base incorporation in the random
region of longer pools, the phosphoramidites
must be mixed in a skewed ratio (see Strategic Planning). Coupling efficiency should be
monitored throughout the synthesis by following the trityl cation output (see UNIT 2.11).
Amplification
Optimization of PCR conditions according
to established protocols is vital to the success
of the large-scale amplification. Cycle temperatures and times, as well as the concentrations
of polymerase, primers, and dNTPs (see, e.g.,
UNIT 15.1), should be addressed prior to the
large-scale workup. Most importantly, since
extremely large quantities of relatively expensive reagents (e.g., Taq polymerase) may be required, care should be taken to make sure that
all reagents and procedures are in readiness.
Different priming sequences often require distinct PCR buffers for optimal extension efficiency; the best buffer for a given pool and
primer combination can be easily and systematically identified through the use of a PCR
optimization kit (e.g., the PCR Optimizer Kit
from Invitrogen).
Troubleshooting
The most common problem with the synthesis of a random sequence pool is the overall
synthetic yield. However, researchers should
carefully decide how many sequences are really necessary for their selection experiments.
In selection experiments from a pool with a relatively limited potential diversity (i.e., a segmentally random pool with only 1 × 10¹¹ possible sequences or less), even a low synthetic
yield should be sufficient. However, in vitro selection from a pool with a very high potential
diversity (i.e., a completely random pool with
1 × 10¹⁵ possible sequences or more) should
use at least 1 × 10¹⁴ different sequences initially in order to adequately sample the potential sequence space. Pools that contain fewer
than 1 × 10¹³ possible sequences should not
be used.
The most likely sources of low yields
and coupling efficiencies are old (i.e., watercontaminated) synthesis reagents. Thus, instead of attempting to amplify an incomplete
pool, the pool should be resynthesized with
fresh reagents; the old and new pools can
then be combined, if desired. If fresh synthesis
reagents do not significantly raise yields, then
more serious problems, such as line or valve
blockage, may be the cause, and the instrument
service representative should be contacted.
The second most common problem is that
the base composition of a partially or completely random region is skewed. Unfortunately, skewing cannot be detected until after completion of a large-scale amplification.
Fortunately, unless the degree of skewing is
extreme, it should not seriously affect the outcome of a selection. Moreover, if the degree
of skewing is known in advance of a selection, it can be taken into account when analyzing the results of the selection. For example, Baskerville et al. (1995) selected functional Rex-binding elements from a partially
randomized pool. Despite the fact that the initial pool did not contain equimolar representation of non-wild-type bases at partially randomized positions, these authors were able to
determine the relative importance of individual residues by comparing the degree of conservation or variance before and after selection. If a researcher decides that extant skewing of base ratios is unacceptable, this can
only be fixed by adjustment of the randomized
phosphoramidite mixture and resynthesis of
the pool.
The third most common problem is that the
pool fails to efficiently elongate. With the proviso that the efficiency of extension may be
as low as 10% of the available pool, it should
not be much lower (i.e., 1% of the available
pool). If extension or PCR efficiency is dauntingly low, the PCR conditions should be reexamined and optimized as described, including buffer and enzyme concentrations, temperatures, and extension times. Switching to
a different thermostable polymerase, or to a
combination of polymerases, will sometimes
improve primer extension. If all possible PCR
optimization conditions have been addressed,
poor extension efficiency could reflect a problem with the synthetic DNA. For example,
the pool may not have been completely deprotected or a primer binding site may have
become largely depurinated during the course
of a long synthesis. Although incomplete deprotection is rarely a problem, small aliquots
of the pool can be further treated with ammonia, and extension and amplification can again
be assessed. If additional deprotection instead
yields oligonucleotide degradation, then it is
likely that apurinic sites have accumulated,
and the pool will have to be resynthesized.
Generation and
Use of
Combinatorial
Libraries
24.2.25
Current Protocols in Molecular Biology
Supplement 88
Anticipated Results
It is apparent from the discussion earlier in
this unit that there is no one correct way to
design and amplify a random sequence pool
(Piasecki et al., 2009). However, by following
the protocols described above, results similar
to the following should be observed.
If the integrity of the nascent, synthetic pool
is good, then the primer extension efficiency
(described in Support Protocol 1) should be
relatively high. Figure 24.2.4 shows a typical
extension reaction for a pool synthesized in
the authors’ laboratory. Molecules that were
incapable of full extension make up the smear
leading to the full-length product. By determining the number of counts in the full-length
product relative to the radiolabeled primer, the
extension efficiency for the pool was calculated to be ∼39%.
Assuming that the nascent pool is intact
and can serve as a template for the primer
extension reaction, then it should be possible
to amplify the pool via PCR. Figure 24.2.5
shows the results of an amplification “cycle
course” for a different pool (N73, with a 73nucleotide random sequence core). A 10-ml
PCR reaction was aliquotted into multiple 96well PCR plates and cycled on a BioRad DNA
Engine thermocycler. The samples in the figure
were withdrawn at 0, 2, 4, 6, and 8 cycles.
Time Considerations
The amount of time required for the protocols described in this unit should not be underestimated. Pool design will take at least 1 day,
depending on the degree of background research required. It is strongly recommended
that pool design be discussed with one or more
colleagues prior to synthesis. The synthesis
of oligonucleotides <150 bases in length can
be easily accomplished in 1 day, allowing 1
hr to ensure proper instrument setup. Commercial synthesis companies are frequently almost as fast, but in some cases may take up
to two weeks to deliver the pool. Pool purification and optimization of PCR conditions
should take 1 to 2 additional weeks. Finally,
the actual large-scale amplification and subsequent isolation of the dsDNA pool will require the researcher’s undivided attention for
∼2 days.
Acknowledgements
DNA Pools for In
Vitro Selection
24.2.26
Supplement 88
The authors would like to thank the initial
contributors, Jack Pollard and Sabine Bell, for
their original work. We would like to thank
the Welch Foundation for their continued support. Bradley Hall was partially supported
by the National Institute of Health and the
Freshman Research Initiative at the University
of Texas at Austin. In addition, these methods were refined by undergraduate students
from the Freshman Research Institute based on
generous funding from the National Science
Foundation and the Howard Hughes Medical
Institute.
Literature Cited
Abd-Elsalam, K.A. 2003. Bioinformatic tools and
guideline for PCR primer design. Afr. J. Biotech.
2:91-95.
Bartel, D.P. and Szostak, J.W. 1993. Isolation of
new ribozymes from a large pool of random sequences. Science 261:1411-1418.
Bartel, D.P., Zapp, M.L., Green, M.R., and Szostak,
J.W. 1991. HIV-1 Rev regulation involves recognition of non-Watson-Crick base pairs in viral
RNA. Cell 67:529-536.
Baskerville, S., Zapp, M., and Ellington, A.D. 1995.
High-resolution mapping of the human T-cell
leukemia virus type 1 rex-binding element by in
vitro selection. J. Virol. 69:7559-7569.
Beaucage, S.L. and Caruthers, M.H. 1981. Deoxynucleoside phosphoramidites. A new class
of key intermediates for deoxypolynucleotide
synthesis. Tetrahedron Lett. 22:1859-1862.
Beaucage, S.L. and Caruthers, M. 2000. Synthetic
strategies and parameters involved in the synthesis of oligodeoxyribonucleotides according
to the phosphoramidite method. Curr. Protoc.
Nucl. Acid Chem. 00:3.3.1-3.3.20.
Beaucage, S.L. and Iyer, R.P. 1992. Advances in
the synthesis of oligonucleotides by the phosphoramidite approach. Tetrahedron 48:22232311.
Boutros, R., Stokes, N., Bekaert, M., and Teeling,
E.C. 2009. UniPrime2: A web service providing
easier Universal Primer design. Nucl. Acids Res.
37:w209-w213.
Breaker, R.R. 1997. In vitro selection of catalytic
polynucleotides. Chem. Rev. 97:371-390.
Brown, D.M. 1993. A brief history of oligonucleotide synthesis. Methods Mol. Biol. 20:117.
Chandra, S. and Gopinath, B. 2007. Methods
developed for SELEX. Anal. Bioanal. Chem.
387:171-182.
Chen, C.K. 2007. Complex SELEX against target
mixture: Stochastic computer model, simulation, and analysis. Comput. Methods Programs
Biomed. 87:189-200.
Chen, Z. and Ruffner, D.E. 1996. Modified crushand-soak method for recovering oligodeoxynucleotides from polyacrylamide gel. BioTechniques 21:820-822.
Conrad, R., Keranen, L.M., Ellington, A.D., and
Newton, A.C. 1994. Isozyme-specific inhibition
of protein kinase C by RNA aptamers. J. Biol.
Chem. 269:32051-32054.
Crameri, A. and Stemmer, W.P.C. 1993. 1020 -fold
aptamer library amplification without gel purification. Nucl. Acids Res. 21:4410.
Current Protocols in Molecular Biology
Fitzwater, T. and Polisky, B. 1996. A SELEX
primer. Methods Enzymol. 267:275-301.
Giver, L., Bartel, D., Zapp, M., Pawul, A.,
Green, M., and Ellington, A.D. 1993. Selective
optimization of the Rev-binding element of
HIV-1. Nucl. Acids Res. 21:5509-5516.
Gold, L., Polisky, B., Uhlenbeck, O., and Yarus,
M. 1995. Diversity of oligonucleotide functions.
Annu. Rev. Biochem. 64:763-797.
Hermes, J.D., Parekh, S.M., Blacklow, S.C., Koster,
H., and Knowles, J.R. 1989. A reliable method
for random mutagenesis: The generation of mutant libraries using spiked oligodeoxyribonucleotide primers. Gene 84:143-151.
Hesselberth, J.R., Miller, D., Robertus, J., and
Ellington, A.D. 2000. In vitro selection of RNA
molecules that inhibit the activity of ricin achain. J. Biol. Chem. 275:4937-4942.
Iyer, R.P. and Beaucage, S.L. 1999. Oligonucleotide
synthesis. In Comprehensive Natural Products
Chemistry, Vol. 7: DNA and Aspects of Molecular Biology (E.T. Kool, ed.) pp. 105-152.
Elsevier, London.
Pan, W. and Clawson, G.A. 2009. The shorter
the better: Reducing fixed primer regions of
oligonucleotide libraries for aptamer selection.
Molecules. 14:1353-1369.
PerSeptive Biosystems. 1998. Expedite Nucleic
Acid Synthesis System: User’s Guide. PerSeptive Biosystems, Framingham, Mass.
Piasecki, S.K., Hall, B., and Ellington, A.D. 2009.
Nucleic acid pool preparation and characterization. Methods Mol. Biol. 535:3-18.
Piganeau, N. 2009. In vitro selection of allosteric
ribozymes. Methods Mol. Biol. 535:45-57.
Reese, C.B. 2005. Oligo- and poly-nucleotides: 50
years of chemical synthesis. Org. Biomol. Chem.
3:3851-3868.
Sabeti, P.C., Unrau, P.J., and Bartel, D.P. 1997.
Accessing rare activities from random RNA
sequences: The importance of the length of
molecules in the starting pool. Chem. Biol.
4:767-774.
Scott, W.G. 2007. Ribozymes. Curr. Opin. Struct.
Biol. 17:280-286.
Jaeger, J.A., Turner, D.H., and Zuker, M. 1989. Predicting optimal and suboptimal secondary structure for RNA. Methods Enzymol. 183:281-306.
Jaeger, L. 1997. The new world of ribozymes. Curr.
Opin. Struct. Biol. 7:324-335.
Kim, N., Gan, H.H., and Schlick, T. 2007. A computational proposal for designing structured RNA
pools for in vitro selection of RNAs. RNA.
13:478-492.
Singer, B.S., Shtatland, T., Brown, D., and Gold,
L. 1997. Libraries for genomic SELEX. Nucl.
Acids Res. 25:781-786.
Legiewicz, M., Lozupone, C., Knight, R., and
Yarus, M. 2005. Size, constant sequences, and
optimal selection. RNA 11:1701-1709.
Lorsch, J.R. and Szostak, J.W. 1994. In vitro evolution of new ribozymes with polynucleotide kinase activity. Nature 371:31-36.
Lyamichev, V., Brow, M.A., and Dahlberg, J.E.
1993. Structure-specific endonucleolytic cleavage of nucleic acids by eubacterial DNA polymerases. Science 260:778-783.
Strömberg, R. and Stawinski, J. 2004. Synthetic
strategies and parameters involved in the synthesis of oligodeoxyribo- and oligoribonucleotides
according to the H-phosphonate method. Curr.
Protoc. Nucl. Acid Chem. 19:3.4.1-3.4.15.
Michelson, A.M. and Todd, A.R. 1955. Nucleotides. XXXII. Synthesis of a dithymidine
dinucleotide containing a 3 ,5 -internucleotidic
linkage. J. Chem. Soc. 2632-2638.
Milligan, J.F., Groebe, D.R., Witherell, G.W.,
and Uhlenbeck, O.C. 1987. Oligoribonucleotide
synthesis using T7 RNA polymerase and
synthetic DNA templates. Nucl. Acids Res.
15:8783-8798.
Oliphant, A.R. and Struhl, S. 1989. An efficient method for generating proteins with altered enzymatic properties: application to betalactamase. Proc. Natl. Acad. Sci. 86:9094-9098.
Oliphant, A.R., Brandl, C.J., and Struhl, K. 1990.
Defining the sequence specificity of DNAbinding proteins by selecting binding sites from
random-sequence oligonucleotides: Analysis of
yeast GCN4 protein. Mol. Cell Biol. 9:29442949.
Pan, W. and Clawson, G.A. 2008. Catalytic
DNAzymes: Derivations and functions. Expert
Opin. Biol. Ther. 8:1071-1085.
Singh, V.K. and Kumar, A. 2001. PCR Primer Design. Mol. Biol. Today 2:27-32.
Stoltenburg, R., Reinemann, C., and Strehlitz, B.
2007. SELEX-A (r)evolutionary method to generate high-affinity nucleic acid ligands. Biomol.
Eng. 24:381-403.
Tuerk, C. and Gold, L. 1990. Systematic evolution of ligands by exponential enrichment: RNA
ligands to bacteriophage T4 DNA polymerase.
Science 249:505-510
Tuerk, C. and MacDougal-Waugh, S. 1993. In
vitro evolution of functional nucleic acids: High
affinity RNA ligands of HIV-1 proteins. Gene
137:33-39.
Unrau, P.J. and Bartel, D.P., 1998. RNA-catalysed
nucleotide synthesis. Nature. 395:260-263.
Vieux, E.F., Kwok, P.Y., and Miller, R.D. 2002.
Primer design for PCR and sequencing in highthroughput analysis of SNPs. Biotechniques
32:S28-S32.
Zon, G., Gallo, K.A., Samson, C.J., Shao, K.,
Summers, M.F., and Byrd, R.A. 1985. Analytical studies of “mixed sequence” oligodeoxyribonucleotides synthesized by competitive
coupling of either methyl- or β-cyanoethyl-N,Ndiisopropylamino phosphoramidite reagents, including 2 -deoxyinosine. Nucl. Acids Res.
13:8181-8196.
Zuker, M. 2003. Mfold web server for nucleic acid
folding and hybridization prediction. Nucleic
Acids Res. 31:3406-3415.
Generation and
Use of
Combinatorial
Libraries
24.2.27
Current Protocols in Molecular Biology
Supplement 88
In Vitro Selection of RNA Aptamers to a
Protein Target by Filter Immobilization
UNIT 24.3
Bradley Hall,1 Seyed Arshad,2 Kyunghyun Seo,2 Catherine Bowman,2 Meredith
Corley,2 Sulay D. Jhaveri,3 and Andrew D. Ellington1,2
1
Department of Chemistry and Biochemistry, University of Texas, Austin, Texas
Freshman Research Initiative, University of Texas, Austin, Texas
3
Nova Research, Inc., Alexandria, Virginia
2
ABSTRACT
This unit describes the selection of aptamers from a pool of single-stranded RNA by
binding to a protein target. Aptamers generated from this selection experiment can
potentially act as protein function inhibitors, and may find applications as therapeutic
or diagnostic reagents. A pool of dsDNA is used to generate an ssRNA pool, which is
mixed with the protein target. Bound complexes are separated from unbound reagents
by filtration, and the RNA:protein complexes are amplified by a combination of reverse
transcription, PCR, and in vitro transcription. Curr. Protoc. Mol. Biol. 88:24.3.1-24.3.27.
C 2009 by John Wiley & Sons, Inc.
Keywords: aptamer r in vitro selection r affinity reagent r filter binding assay r SELEX
INTRODUCTION
An aptamer is a selected nucleic acid binding species. Typically aptamers are selected
from random sequence pools, and form three-dimensional structures with binding pockets
comparable to those formed by proteins. While there are multiple ways that aptamers can
be selected in vitro (for current reviews, see Chandra and Gopinath, 2007; Kulbachinskiy,
2007; Stoltenburg et al., 2007), this unit will describe one of the most common: selection
of aptamers that bind to a protein target from a single-stranded RNA pool. Aptamers
generated from these types of selection experiments can potentially function as protein
inhibitors, and may find applications as therapeutic or diagnostic reagents. In short, a
double-stranded DNA pool (see UNIT 24.2) will be transcribed to generate a single-stranded
RNA pool (Basic Protocol 1 in this unit). The initial concentration of protein target to be
used is determined by labeling an aliquot of the pool (see Support Protocol 1) and performing the binding assay as described in Support Protocol 2. Following purification, the pool
is mixed with the protein target. Binding species are separated from nonbinding species
by nitrocellulose filtration (see Basic Protocol 2). RNA:protein complexes are then eluted
from the filter, and binding species are amplified by a combination of reverse transcription,
the polymerase chain reaction (PCR), and in vitro transcription (see Basic Protocol 3).
The progress of the selection will be monitored by assaying the affinity of the radiolabeled
RNA pool for the protein target after several rounds of selection (see Support Protocol 3).
These steps are then repeated until a significant increase in binding is observed or until
the diversity of the pool has been completely plumbed. The procedure is summarized in
Figure 24.3.1.
TRANSCRIPTION AND ISOLATION OF RNA POOLS
The following protocol describes the preparation of the RNA pool to be used for selection.
Starting from the dsDNA pool, the RNA is transcribed and purified by denaturing polyacrylamide gel electrophoresis. Recovery of the RNA from the gel is followed by ethanol
precipitation of the RNA. Additional instructions can be found in UNIT 3.8. The directions
Current Protocols in Molecular Biology 24.3.1-24.3.27, October 2009
Published online October 2009 in Wiley Interscience (www.interscience.wiley.com).
DOI: 10.1002/0471142727.mb2403s88
C 2009 John Wiley & Sons, Inc.
Copyright BASIC
PROTOCOL 1
Generation and
Use of
Combinatorial
Libraries
24.3.1
Supplement 89
initial pool of
dsDNA
(UNIT 24.2)
Transcription
Gel Isolation
(Basic Protocol 1)
pool of
RNA
assay for
binding affinity
End Labeling
(Support Protocol 2)
Random Sequence Library
prepare 1013 or more sequences
(Basic Protocol 2, steps 1-2)
Negative Selection
remove filter-binding RNAs
protein target
(Basic Protocol 2, steps 3-5)
Isolation and Amplification
reverse transcription, PCR,
transcription
(Basic Protocol 3)
in vitro
selection
Protein Incubation
(Basic Protocol 2, step 6)
Elute Bound Species
(Basic Protocol 2, steps 10-12)
Filter
Immobilize
(Basic Protocol 2, steps 7-8)
save dsDNA
samples
Monitor Progress
after 5th and
every 3rd round
Wash
remove unwashed pool
(Support Protocol 3)
assay for
binding affinity
Figure 24.3.1
(Basic Protocol 2, step 9)
clone/
sequence
Steps involved in in vitro selection of RNA aptamers.
provided here are specific for the isolation of nucleic acid pools. As is the case for the
original amplification of DNA pools (UNIT 24.2), many of the procedures described here
can potentially lead to the cross-contamination of different RNA selection experiments
or different generations of the same selection experiment. To avoid cross-contamination,
it is wise to always use barrier tips, and to use disposable plastic Pasteur pipets rather
than automatic micropipettors for large-volume transfers.
Materials
Selection of RNA
Aptamers
Double-stranded DNA pool (UNIT 24.2)
High Yield AmpliScribe T7 In Vitro Transcription Kit (Epicentre)
8% polyacrylamide denaturing gel (see recipe and UNIT 2.12)
2× denaturing dye (see recipe)
24.3.2
Supplement 89
Current Protocols in Molecular Biology
TBE buffer (APPENDIX 2)
TE buffer, pH 8.0 (see recipe)
3 M sodium acetate (APPENDIX 2)
70% and 95% ethanol
Thermal cycler, incubators, or heat blocks set at 37◦ or 42◦ C (for transcription) and
65◦ to 75◦ C (for denaturation)
UV light source
Fluorescent TLC plate (VWR) wrapped in plastic wrap
Sharp razor blade, fresh or thoroughly cleaned
Spectrophotometer, such as a NanoDrop (Thermo Scientific)
Additional reagents and equipment for denaturing polyacrylamide gel
electrophoresis (UNIT 2.12)
NOTE: All solutions and buffers should be made with deionized water (18.2 M resistivity), filtered through a 0.2-μm polyethersulfone (PES) membrane, and sterilized by
autoclaving. Use sterile, disposable plasticware and micropipet tips with filter barriers
where possible. See Chapter 4 introduction and UNIT 4.1 for guidelines on standard methods to protect against contaminating RNases. If ribonuclease contamination is found to
occur, it may be eliminated by treating water with diethylpyrocarbonate (DEPC; see UNIT
4.1).
Perform initial round of transcription
Use the double-stranded DNA pool generated in UNIT 24.2 (which should contain a T7 RNA
polymerase promoter) as a template for in vitro transcription with T7 RNA polymerase.
1. Following the protocol provided with the kit, add ∼1 μg of double-stranded DNA
template generated as in UNIT 24.2 to the transcription mix for a 20-μl total reaction
volume. Incubate reaction at 42◦ C for 4 hr or overnight at 37◦ C.
Depending on the length and initial complexity of the pool, 1 μg of double-stranded
DNA will represent ∼1013 different sequences while 10 μg represents ∼1014 different
sequences. The dsDNA concentration from the large-scale PCR (UNIT 24.2) should be
determined by electrophoresis on an agarose gel and compared with a quantitation
standard. The initial quantity of dsDNA used for selection should be calculated based
on a desired number of starting species or total pool complexity (also see UNIT 24.2). It
should be kept in mind that the overall complexity of the unamplified pool and the extent of
amplification must be known in order to carry out these calculations (also see UNIT 24.2).
The authors typically seed the transcription with 1 to 3 copies of the amount of dsDNA
pool corresponding to the desired complexity.
The AmpliScribe High Yield T7 kit can be used to produce between 20 and 100 μg RNA
from 0.5 to 1 μg starting dsDNA. This yield equates to between 40 and 200 copies of each
sequence originally present. The kit can be used with up to 8 μl of dsDNA template in
a 20-μl reaction. If more RNA is desired for initial or subsequent rounds of selection, a
proportionately larger transcription reaction should be attempted.
In some instances it will be desirable to radiolabel the RNA. For example, it is relatively
easy to determine whether and how much RNA binds to a filter in the presence or
absence of a protein target by radiolabeling the initial pool (Support Protocol 1). An [α32
P]nucleoside triphosphate—e.g., 0.5 μl [α-32 P]GTP (GE Healthcare Life Sciences) in
a 20-μl total volume—can be included in the reaction mixture in addition to all the other
reagents. Varying the proportion of “hot” to “cold” nucleoside triphosphates can control
the specific activity of the RNA pool. Since the overall yield of the transcription reaction
will generally be important, the specific activity of the nucleoside triphosphate mixture
should be varied by increasing the amount of radioactive nucleotide added, rather than by
decreasing the amount of unlabeled nucleotide present. Again, commercial transcription
kits can be obtained that are geared towards the incorporation of labeled nucleoside
triphosphates (RiboScribe, Epicentre).
Generation and
Use of
Combinatorial
Libraries
24.3.3
Current Protocols in Molecular Biology
Supplement 88
2. In order to remove DNA from the transcription reaction, after the transcription
incubation has been completed, add 1 μl of RNase-free DNase I from the Epicentre
kit per 20-μl reaction and incubate for 25 min at 37◦ C.
Because individual members of the double-stranded DNA library can potentially bind
nonspecifically to either the target or to the selection matrix and subsequently be amplified,
the DNA template should be removed from the transcription reaction according to this
step, prior to proceeding with the selection. The effectiveness of this step can be evaluated
by PCR analysis of reverse transcription in the absence of reverse transcriptase.
It is essential that RNase-free DNase, such as that provided with the kit, be used; otherwise
contaminating ribonucleases may destroy the newly transcribed RNA. An alternative
would be to add RNase inhibitors to impure DNases, but such inhibitors themselves
frequently contain endogenous ribonucleases that can be released during the incubation.
Purify the RNA pool
The RNA pool should generally be purified by denaturing gel electrophoresis.
3. Prepare a 0.75-mm thick, denaturing 8% acrylamide gel (see Reagents and Solutions
and, e.g., UNIT 2.12).
An 8% acrylamide concentration is convenient for the purification of RNA molecules
from 60 to 150 nucleotides in length. However, the concentration of acrylamide used
to separate the full-length transcript from incomplete transcripts is ultimately contingent
upon the size of the RNA and should be chosen so that the RNA will migrate approximately
half-way through the gel when the loading dye has reached the bottom (see UNIT 2.12).
If the RNA sample contains a significant amount of nascent structure (for example, a
doped sequence population that is based on a tightly folded secondary structure), it may
not fully denature. Thus, it may be advisable to warm the gel to ∼55◦ C by first pre-running
the gel at a higher voltage (300 to 400 V). The temperature of the gel can be monitored
using adherent thermometers (VWR).
In some cases, very large amounts of RNA may need to be purified (for example, the initial
transcription of an extremely complex DNA library may yield upwards of a milligram or
more of an RNA library). In these instances, it may be desirable to purify the RNA
library by either gel-filtration or ion-exchange chromatography (e.g., Qiagen RNA kit).
However, the purification of the initial or subsequent pools should never be neglected, as
foreshortened amplicons can arise and overtake selected populations.
4. Fully denature the RNA pool by adding an equal volume of 2× denaturing dye, and
heat the RNA-dye mix for 3 min at 65◦ to 75◦ C.
Although each species in the pool has a different sequence and shape, they should migrate
similarly when fully elongated.
Using a higher temperature or longer denaturing time risks hydrolysis of the RNA into
smaller fragments, given the high concentration of Mg2 + present in the transcription
buffer.
5. Thoroughly rinse each well of the gel prepared in step 3 with TBE buffer using
a plastic Pasteur pipet, 1000-μl micropipettor tip, or syringe prior to loading (to
remove urea, which will otherwise leach into the wells and form a barrier between
the loaded sample and the gel). Load samples directly on the gel (a single 20-μl
transcription reaction will typically fit into a 1-cm-wide lane). Run electrophoresis
for 45 min to 1 hr at 400 V, until the bromphenol blue dye front reaches the bottom
of the gel.
If the wells are not cleaned prior to loading, the resolution of the separation can be
compromised, especially if large amounts of RNA are being isolated.
Selection of RNA
Aptamers
24.3.4
Supplement 88
Current Protocols in Molecular Biology
6. Visualize the RNA bands by UV shadowing on a fluorescent TLC plate covered with
plastic wrap, then excise the bands. Be sure to cut with a sharp razor blade and cut
only the shadowed regions that contain the bulk of the RNA.
There may be extra bands in the lane that correspond to incomplete transcripts or
undigested DNA. The use of a size standard in a neighboring lane is recommended. Note,
however, that the size standard should not itself be amplifiable, as cross-contamination of
a single sequence with the RNA pool would drastically skew the distribution of sequences
in the purified pool. Similarly, the razor blade used for excision should not have come
into contact with other potentially amplifiable sequences, and should either be fresh or be
cleaned extensively. Finally, if multiple selections are being carried out in parallel, they
should be separated by at least two wells, or on a different gel entirely.
7. Immerse the gel slices in 1× TE buffer, pH 8.0, at ∼1 ml buffer/cm2 of gel (typically,
slices from three lanes) and incubate at 37◦ C overnight with agitation to elute the
RNA pool.
The TE buffer is necessary to inhibit trace quantities of ribonucleases.
For quicker elution, use a 1-ml syringe plunger to crush the gel chunks into a slurry
in a 1.7-ml microcentrifuge tube. Resuspend the slurry in 400 μl of 1× TE buffer, then
incubate the slurry at −80◦ C for 10 min to use ice crystals to fully break up the acrylamide
matrix. Elute the ssRNA from the gel at 65◦ to 75◦ C for 15 min. Repeat the elution with
an additional 400 μl TE buffer.
The authors routinely recover 95% of the nucleic acid with this procedure. To increase
recovery, additional elutions can be performed, but increased incubation at elevated
temperatures increases cleavage of RNA molecules.
8. Decant the eluate with a micropipettor and 1000-μl tip to separate the RNAcontaining supernatant from the gel slice. Filter the elution through a 0.45-μm nitrocellulose membrane (such as Millipore Ultrafree-MC microcentrifuge filter tube) to
remove acrylamide fragments.
Precipitate and quantitate the RNA
9. Add one-tenth volume of 3 M sodium acetate for a final concentration of 0.3 M and
2.5 volumes of 95% ethanol to precipitate the RNA. Mix, then incubate at −80◦ C
for 15 min. Microcentrifuge 10 to 15 min at maximum speed, 4◦ C, to recover the
precipitate.
The authors frequently include 3 μl of a 1 mg/ml blue-dyed glycogen solution (GlycoBlue,
Ambion) to increase the yield of nucleic acid precipitate and to better visualize the pellet.
If the selection target binds to or interacts with glycogen, then this step should be omitted.
Transfer RNA can also be used as a carrier, but will obfuscate the quantification of the
pool RNA (see below).
10. Wash the RNA pellet with cold 70% ethanol and allow the pellet to dry completely.
The pellet can be air dried, dried under a nitrogen or argon stream, or dried in a SpeedVac
evaporator. The first method is least likely to result in cross-contamination of nucleic acid
species; the last method is least likely to lead to degradation. In any event, keep the tube
covered with Parafilm to avoid inadvertent nuclease contamination (poke holes in the
Parafilm with a sterile pipet tip to allow evaporation to occur).
If the RNA pool is particularly short (≤50 nucleotides), use cold 95% ethanol for the
wash step.
11. Resuspend the RNA pellet in 25 μl TE buffer, pH 8.0.
To avoid disturbing the composition of the selection buffer, the pellet can also be resuspended in RNase-free water. The small amount of EDTA present in TE buffer, however, will
limit ribonuclease degradation of the pool, since ribonucleases frequently require a divalent metal to function. In some instances (e.g., small-volume PCR reactions), the presence
of EDTA may have to be compensated for by adding more magnesium to the reaction.
Generation and
Use of
Combinatorial
Libraries
24.3.5
Current Protocols in Molecular Biology
Supplement 88
12. Estimate the quantity of the RNA spectrophotometrically by measuring the
absorbance at 260 nm.
Use an extinction coefficient of 0.025 ml/cm·μg (see, e.g., APPENDIX 3D). In practical terms,
measure the A260 of a 1:10 dilution of the sample on a NanoDrop spectrophotometer or
cuvette-based spectrophotometer. The A260 /A280 and A260 /A230 ratio should be between
1.8 and 2.2. If ratios are outside of these ranges, the purity of the original RNA sample
may be suspect (with residual acrylamide or salt being the most likely contaminants), and
the sample should be reprecipitated prior to use.
SUPPORT
PROTOCOL 1
RADIOLABELING RNA FOR USE IN AN INITIAL AFFINITY ASSAY
Radioactive RNA can be generated either by incorporation of an [α-32 P]nucleoside
triphosphate during transcription or by transfer of the terminal phosphate of γ-32 P ATP
to the 5 terminus of a dephosphorylated RNA molecule. The authors tend to prefer the
latter method, despite the additional labor involved in preparation, because the specific
activity of the sample is higher, less RNA is required for assays, and dissociation constants
are correspondingly easier to compute.
Materials
RNA pool (Basic Protocol 1)
10× alkaline phosphatase buffer (New England Biolabs)
Calf alkaline phosphatase (New England Biolabs)
25:24:1 phenol/chloroform/isoamyl alcohol saturated with 10 mM Tris·Cl, pH
8.0/1 mM EDTA (UNIT 2.1A)
Chloroform
3 M sodium acetate (APPENDIX 2)
70% and 95% ethanol
1 mg/ml blue-dyed glycogen (GlycoBlue; Ambion)
10× PNK buffer (New England Biolabs)
10 U/μl T4 polynucleotide kinase (PNK; New England Biolabs)
167 mCi/ml [γ-32 P]ATP (7000 Ci/mmol; ICN Biomedical or GE Healthcare Life
Sciences)
42◦ and 75◦ C water baths
Centri-Sep Spin Columns (Princeton Separations)
NOTE: All solutions and buffers should be made with deionized water (18.2 M resistivity), filtered through 0.2-μm polyethersulfone (PES) membrane, and sterilized by
autoclaving. Use sterile, disposable plasticware and micropipet tips with filter barriers
where possible. See Chapter 4 introduction and UNIT 4.1 for guidelines on standard methods to protect against contaminating RNases. If ribonuclease contamination is found
to occur, it may be eliminated by treating water with diethylpyrocarbonate (DEPC; see
UNIT 4.1).
Dephosphorylate the 5 triphosphate termini of the isolated RNA pool
1. Mix the following components:
1 μg RNA in <3.5 μl volume
0.5 μl 10× alkaline phosphatase buffer
1 μl (1 U) calf alkaline phosphatase
x μl RNase-free water for a total reaction volume of 5 μl.
The RNA sample may need to be reprecipitated to obtain an adequately concentrated
sample. If so, the precipitate can be resuspended directly in the reaction buffer or mixture.
Selection of RNA
Aptamers
Calf alkaline phosphatase is preferred over bacterial alkaline phosphatase because the
activity can be heat-killed (see step 4) prior to the addition of the radiolabel.
24.3.6
Supplement 88
Current Protocols in Molecular Biology
2. Incubate at 42◦ C for 20 min to 2 hr.
3. Add 95 μl RNase-free water.
4. Heat-denature the calf alkaline phosphatase for 10 min at 75◦ C.
5. Perform a phenol/chloroform extraction (see Basic Protocol 2, steps 13 and 14).
If the sample will be gel-isolated, this step can be omitted. If the radiolabeled sample will
merely be precipitated prior to use, this step should be included.
6. Ethanol precipitate the RNA by adding one-tenth volume of 3 M sodium acetate
(0.3 M final), 3 μl of 1 mg/ml blue-dyed glycogen, and 2.5 volumes of 95% ethanol,
microcentrifuging, and washing the pellet with 70% ethanol (see Basic Protocol 1,
steps 9 and 10). Allow pellet to dry completely.
Avoid precipitating RNA in the presence of ammonium acetate, since ammonium ions
inhibit the T4 polynucleotide kinase used in the next step.
7. Resuspend the dried pellet in a minimal volume (3 to 10 μl) of RNase-free water.
Perform kinase reaction
8. Set up the kinase reaction as follows:
0.5 to 3 μl dephosphorylated RNA pool (from step 7)
0.5 μl 10× PNK buffer
1 μl (10 U) T4 polynucleotide kinase (PNK)
0.5 μl (83 μCi) [γ-32 P]ATP (7000 Ci/mmol)
x μl RNase-free H2 O for a total volume of 5 μl.
Only a very small amount of RNA will be used in the binding assay (∼50 pM in a 100 μl
reaction). Unless multiple experiments are contemplated, the specific activity of the sample
can be kept quite high by using a very small amount of RNA in the kinase reaction.
9. Incubate for 1 hr at 37◦ C.
During this step, it is helpful to hydrate the Centri-Sep desalting columns.
10. Heat-inactivate the kinase in the reaction mixture at 70◦ C for 10 min, and increase
the volume to 20 μl with water.
11. Apply the diluted kinase reaction directly to the middle of the Centri-Sep gel bed
and centrifuge 2 min at 450 × g, room temperature, collecting the flowthrough.
12. Perform a phenol/chloroform extraction (see Basic Protocol 2, steps 13 and 14).
13. Ethanol precipitate the RNA by adding one-tenth volume of 3 M sodium acetate
(0.3 M final), 3 μl of 1 mg/ml blue-dyed glycogen, and 2.5 volumes of 95% ethanol,
microcentrifuging, and washing the pellet with 70% ethanol (see Basic Protocol 1,
steps 9 and 10). Allow pellet to dry completely.
14. Optional: To fully purify the radiolabeled RNA pool, isolate the transcript by polyacrylamide gel electrophoresis as described in Basic Protocol 1, steps 3 to 8.
If this is done, the phenol/chloroform extractions and the final precipitation of the RNA
(steps 12 to 13 of this protocol) can be omitted. While unincorporated, radioactive
triphosphates can also be removed by gel electrophoresis, the authors recommend utilizing
the desalting (Centri-Sep) column to limit opportunities for radioactive contamination.
The chief disadvantages of gel isolation are the time required for sample preparation and
the relatively low efficiency of recovery of the radiolabeled RNA pool. However, since
only a small amount of RNA pool is required for the binding assay, such low yields can
frequently be tolerated. The authors frequently gel isolate radiolabeled RNA pools to
ensure the integrity of RNA samples prior to carrying out binding assays.
Generation and
Use of
Combinatorial
Libraries
24.3.7
Current Protocols in Molecular Biology
Supplement 88
SUPPORT
PROTOCOL 2
BINDING ASSAY WITH THE END-LABELED RNA POOL TO DETERMINE
THE OPTIMAL PROTEIN CONCENTRATION FOR SELECTION
To determine the initial concentration of a protein target to be used in a selection experiment, it is necessary to measure the affinity of the unselected pool for the protein
target. The aggregate dissociation constant of the pool:protein complex can be calculated
by determining the fraction of radioactively labeled RNA that can be bound at various
protein concentrations.
The radiolabeled RNA is incubated in the binding buffer and protein solutions are added.
The binding reaction is filtered through a vacuum manifold containing nitrocellulose
and nylon membranes, and the fraction of RNA bound to the target is calculated to
obtain a value for the dissociation constant. The nitrocellulose membrane will capture
RNA:protein complexes, while the nylon membrane will capture all free RNA that flows
through the nitrocellulose membrane.
Materials
Radiolabeled RNA pool (Support Protocol 1)
Binding buffer (see Critical Parameters)
Target protein
65◦ to 75◦ C thermal cycler, water bath, or heat block
Minifold I Dot-Blot System (Whatman)
Nylon transfer membrane (Hybond N+, GE Healthcare Life Sciences)
0.45-μm nitrocellulose transfer and immobilization membrane (BA85 Protran,
Whatman)
Clean forceps or tweezers
PhosphorImager (GE Healthcare Life Sciences) and screen or X-ray film and
densitometer (also see APPENDIX 3A)
Graphing software (e.g., SigmaPlot, Systat Software, or R Project)
Additional reagents and equipment for phosphor imaging or imaging using X-ray
film and densitometry (APPENDIX 3A)
NOTE: All solutions and buffers should be made with deionized water (18.2 M resistivity), filtered through 0.2 μm polyethersulfone (PES) membrane, and sterilized by
autoclaving. Use sterile, disposable plasticware and micropipet tips with filter barriers
where possible. See Chapter 4 introduction and UNIT 4.1 for guidelines on standard methods to protect against contaminating RNases. If ribonuclease contamination is found
to occur, it may be eliminated by treating water with diethylpyrocarbonate (DEPC; see
UNIT 4.1).
Set up binding reactions
1. Collect the RNA precipitate by centrifugation and resuspend the radiolabeled RNA
in a minimal volume (i.e., 5 to 10 μl) of RNase-free water. Dilute the RNA sample
with binding buffer to a final concentration of 100 pM.
The binding assay will yield 11 data points in triplicate (see below). Since each data
point will be generated from a 50-μl binding reaction, 2 μl of the RNA solution should
be adequate. If the specific activity of the RNA is not high enough, a higher concentration
of RNA may be used; however, that will complicate the assumption that RNA is limiting
and hence make the calculation of the Kd more difficult.
2. To ensure that each species in the RNA pool folds into the most accessible or most
stable conformation, heat the RNA pool in 25 μl binding buffer to 65◦ to 75◦ C for
3 min and then allow the sample to cool to room temperature over ∼10 min.
Selection of RNA
Aptamers
24.3.8
Supplement 88
Current Protocols in Molecular Biology
3. Add 25 μl of the protein target in binding buffer to the thermally equilibrated RNA
from step 2. Use ten different protein concentrations in triplicate, ranging from 1 μM
to 50 pM. Also include one data point with no protein to measure the filter-binding
ability of the pool itself.
The original protein solution should be sufficiently concentrated for all of the dilutions.
To ensure consistency between samples, serial dilutions of the 1 μM sample can be
made. The authors suggest the following final concentrations (i.e., 1 μM, and subsequent
1/3 dilutions): 1 μM, 333 nM, 111 nM, 37 nM, 12 nM, 4.1 nM, 1.4 nM, 460 pM, 152
pM, 51 pM, and a “no-protein” control. For statistically significant results, perform the
binding assay in triplicate.
4. Incubate the binding reaction at room temperature for 15 min to 1 hr (see Critical
Parameters).
Perform filter binding
5. Assemble the Minifold 1 Dot-Blot apparatus (Fig. 24.3.2). Lay the nylon transfer
membrane on top of the perforations in the middle section. Moisten the nylon
membrane and lay the nitrocellulose membrane on top of the nylon membrane,
taking care to avoid the formation of bubbles between the two membranes. Cover
and tighten the brackets.
Prior to filtering the binding reactions, prewash the wells with binding buffer and check
for leaks. When the manifold is used in conjunction with a water aspirator, turn the water
faucet to a level that causes liquid to pass slowly through the membranes (i.e., 100 μl
every 3 sec).
Since there are so many binding reactions, it is more convenient to use a manifold
apparatus that can accommodate multiple filtrations (up to 96 slots) than to assemble
33 individual filter holders.
6. Filter the binding reactions and wash three times, each time with 1 volume of binding
buffer.
When pipetting onto the manifold, dispense the liquid slowly and evenly. Try to keep the
membrane constantly hydrated during each wash step. Keep the micropipet tip close to the
membrane to avoid bubble formation, but not so close as to risk damaging the membrane.
nitrocellulose
nylon
to
vacuum
Figure 24.3.2 Assembly of the Minifold 1 Dot-Blot Milliblot apparatus used for binding assays.
The nitrocellulose sheet collects binding species, whereas the nylon collects all remaining RNA.
The apparatus is assembled, clamped down to hold the filters in place, then attached to a vacuum
for filtration.
Current Protocols in Molecular Biology
Generation and
Use of
Combinatorial
Libraries
24.3.9
Supplement 88
Utilization of a multichannel micropipettor (Pipet-Lite with LTS, Rainin) for the prewash
and wash steps is recommended. Alternatively, the entire wash volume can be added to
the blot at once.
7. Disassemble the manifold apparatus and transfer the membranes to a clean paper
towel. Dry for ∼5 min at room temperature or in an 80◦ C oven. Handle membranes
with a clean pair of forceps or tweezers.
8. Cover membranes with plastic wrap and expose to a phosphor screen (e.g.,
PhosphorImager) or X-ray film for 4 to 12 hr (also see APPENDIX 3A).
If the samples have a very high specific activity, the exposure time can be reduced to
between 5 and 60 min.
9. Measure the radioactivity using the PhosphorImager, or a densitometer if X-ray film
was used to develop the image, and calculate the binding percentages as follows:
Fraction bound = cpm on nitrocellulose/(cpm on nitrocellulose + cpm on nylon)
If X-ray film was used to develop the image, then a digitizer (densitometer) should yield
similar results to those obtained with a PhosphorImager.
10. Plot the fraction bound as a function of the concentration of unbound protein. Fit the
points to a curve using graphing software (e.g., SigmaPlot) and obtain a value for the
aggregate parent dissociation constant. Within the SigmaPlot program, fit the curve
using the equation y = m1 m0 /(m0 + m2 ), where y = the fraction of RNA bound, m0
= concentration of unbound protein, m1 = the extrapolated activity of the RNA at
an infinite protein concentration (maximal value of fraction bound), and m2 = the
apparent dissociation constant.
The apparent Kd is equal to the concentration of unbound protein at half the maximal
value of fraction bound.
BASIC
PROTOCOL 2
ISOLATING A FUNCTIONALLY ENRICHED POOL OF RNA
In the following protocol, the RNA pool is partitioned to isolate those species that bind
to the target protein and not to the filter. RNAs that are coimmobilized with the target
are eluted from the filter under denaturing conditions and subsequently isolated and
amplified.
Materials
RNA pool (see Basic Protocol 1)
Binding buffer (see Critical Parameters)
Elution buffer (see recipe)
3 M sodium acetate (APPENDIX 2)
70% and 95% ethanol
25:24:1 phenol/chloroform/isoamyl alcohol saturated with 10 mM Tris·Cl, pH
8.0/1 mM EDTA (UNIT 2.1A), ice-cold (optional)
Chloroform (optional)
Isopropanol (optional)
Selection of RNA
Aptamers
65◦ to 75◦ C, 95◦ C. and 100◦ C heat blocks with appropriate bore sizes for the
microcentrifuge tube
13 mm Nuclepore Pop-Top or Swin-Lok Filter holders (Whatman)
13-mm, 0.45-μm HAWP nitrocellulose disk filters (Millipore)
5-ml syringe
Vacuum manifold
Sterile forceps
24.3.10
Supplement 88
Current Protocols in Molecular Biology
NOTE: All solutions and buffers should be made with deionized water (18.2 M resistivity), filtered through 0.2 μm polyethersulfone (PES) membrane, and sterilized by
autoclaving. Use sterile, disposable plasticware and micropipet tips with filter barriers
where possible. See Chapter 4 introduction and UNIT 4.1 for guidelines on standard methods to protect against contaminating RNases. If ribonuclease contamination is found
to occur, it may be eliminated by treating water with diethylpyrocarbonate (DEPC; see
UNIT 4.1).
Partition the pool
1. Use >400 pmol of the RNA pool (>2.4 × 10¹⁴ different sequences) for selection.
Using significantly lower quantities of RNA may affect the diversity of the population in the
initial rounds of selection. Using significantly higher quantities may lead to precipitation
of the nucleic acid pool. Irvine et al. (1991) devised a formula to determine the optimum
protein and RNA concentration in order to minimize the number of rounds of selection,
based on the Kd of the starting pool, the desired Kd , and the fraction of free RNA molecules
that partitions as nonspecific background versus the fraction of RNA molecules that
forms specific RNA:protein complexes. Empirically, the concentrations of many available
protein targets will be in the nanomolar range, and a 1- to 10-fold excess of the RNA pool
should suffice for early rounds of selection.
If only a small amount of RNA pool is initially recovered from the gel, be sure to save at
least some sample for the “no-protein” control (see below).
2. To ensure that each species in the RNA pool folds into the most accessible or most
stable conformation, heat the RNA pool in 50 to 100 μl binding buffer (see Critical
Parameters for discussion on choosing a binding buffer) between 65◦ and 75◦ C for
3 min, and then allow the sample to cool to room temperature over ∼10 min.
Since ionic strength, monovalent and divalent cation concentrations, pH, temperature,
and buffer concentrations can all influence interactions with the target, it is usually
wise to keep all of these parameters constant during the early rounds of selection when
productive binding species are accumulating. Hence, the binding buffer, equilibration
time, and preparation of the RNA for selection should be kept uniform until a significant
interaction between pool and target is observed (see Critical Parameters for discussion
of stringency of selection).
Higher temperatures can be used for thermal equilibration, but the presence of divalent
metal ions in the selection buffer can lead to RNA degradation.
3. Prior to the addition of the protein target, perform a negative selection to remove
any filter-binding species that may be in the population. Place a pre-wetted filter into
the filter holder top and lock the filter holder base into the clips protruding from the
filter holder top. Secure the filter holder base by passing the ring lock down the filter
holder top until it fits snugly (Fig. 24.3.3).
Negative selection to remove filter-binding species is an extremely important step in the
selection procedure. Filter-binding species are typically more numerous in a naive RNA
population than are aptamers. If filter-binding species are not efficiently sieved from
the population, they will quickly accumulate to the point where it may be difficult (and
likely impossible) to select protein-binding species. If the potential for accumulating
filter-binding species is large (i.e., the target has a low initial affinity for a pool, or
selections with DNA or modified RNA pools), then repeat the preselection filtration to
remove any filter-binding species that may persist, or carry out a post-selection filtration
(see optional steps 17 through 20, below). If filter-binding species accumulate during a
selection experiment, it is usually best to repeat the selection starting with a different pool
that can be amplified with different primers.
In addition to filter-binding species, replication parasites (see Critical Parameters for
discussion on parasites) can accumulate in and over-run a selected population. A separate
regime is required to avoid these selection predators.
Generation and
Use of
Combinatorial
Libraries
24.3.11
Current Protocols in Molecular Biology
Supplement 88
ring lock
filter holder top
filter
filter holder base
Figure 24.3.3 Components and assembly of filter holder used during selection. Pop-top graphic
adapted, with permission, from Whatman product sheet.
4. Load the binding buffer onto the filter. Place the micropipet tip just above the filter
to avoid the formation of any bubbles. Lock a 5-ml syringe to the top of the filter
holder and apply gentle pressure to force the liquid out of the filter holder and into a
collecting tube.
If the syringe plunger does not regain position when pressure is removed, there is likely
a leak in the filter. It should be removed and replaced with another filter.
Prior to filtering the RNA, it is important to wash the nitrocellulose filter disk with
binding buffer and check for leaks in the assembled filter holder. The syringe should form
a tight seal with the filter holder. The pressure applied should be just enough to force the
liquid through without rupturing the membrane. Formation of foam at the bottom of the
filter holder or the presence of a hissing sound when pressure is applied indicates that
the pressure is too high, and the integrity of the seal or the membrane may have been
breached. Test for leaks every time the filter holder is assembled to avoid substantial loss
of sample.
5. Load the RNA solution onto the filter. Place the micropipet tip just above the filter
to avoid the formation of any bubbles. Lock a 5-ml syringe to the top of the filter
holder and apply gentle pressure to force the liquid out of the filter holder and into a
collecting tube.
Since there will still be some amount of liquid retained by the filter and filter holder, it
is necessary to wash the filter with an equal amount of binding buffer to maximize the
collection of non-filter-binding species. Discard the filter.
6. Add the protein target and any competitors, specific and/or nonspecific, to the filtrate.
Allow the binding reaction to equilibrate (typically 30 min initially; however, this
time can be reduced when selecting for enhanced binding kinetics).
Selection of RNA
Aptamers
In selection experiments that targeted the cytokine bFGF, the authors used an equimolar
protein-to-RNA ratio for the first two rounds of selection and decreased it 10-fold after
two rounds and 60-fold after another two, yielding a functionally enriched pool after
six rounds of selection and amplification (Table 24.3.1). The final volume of the binding
reaction should be from 100 to 200 μl. In addition, to ensure that the selected RNAs
24.3.12
Supplement 88
Current Protocols in Molecular Biology
Table 24.3.1 Progress of N30 Selection Against bFGFa,b
Round
Input RNA
(nM)
Input bFGF
(nM)
RNA:bFGF
1
800
760
1.05
2.1
2.3
2
800
760
1.05
—
—
3
800
76
10.5
—
—
4
800
76
10.5
6.0
4.0
5
800
13
61.5
—
—
6
800
13
61.5
17.0
0.4
% bound to protein % bound to filter
a Pools were assayed in a 50-μl reaction at a concentration of 75 nM in the presence and absence of equimolar protein.
b N30 is a RNA pool with 30 random sequence positions (Lato et al., 1995).
are actually binding to the target and not to the filter, a parallel binding reaction in the
absence of protein can be carried out intermittently. The authors strongly suggest that
“no-protein” controls be scrutinized before the selection begins, and then after every
three additional rounds of selection (i.e., rounds 3, 6, and 9).
The choice of selection conditions is probably the second most important factor (following
the choice of target) for determining the success of a selection experiment. While general
guidelines for modulating the stringency of selection can be recommended (see Critical
Parameters for comments on the stringency of selection), every target and every selection is
different and no precise guidelines for success can be provided. In general, the stringency
of selection should be lower in early rounds of selection and higher in later rounds. This
will give binding species an opportunity to establish themselves in the population relative
to filter-binding species.
It should be noted that there is some danger of cross-contaminating the selected pool
with the “no-protein” control. Basically, executing the “no-protein” control is identical
to selecting for protein-independent (filter) binding species; hence, DNA arising from the
“no-protein” control should be handled with care.
7. During the equilibration, assemble a second filter disk into a holder (see step 3).
8. Load the equilibrated binding reaction onto the filter. Place the micropipet tip just
above the filter to avoid the formation of any bubbles. Lock a 5-ml syringe to the
top of the filter holder and apply gentle pressure to force the liquid out of the filter
holder and into a collecting tube.
If the syringe plunger does not regain position when pressure is removed, there is likely
a leak in the filter. It should be removed and replaced with another filter. The solution in
the collection tube can be reapplied to the new filter.
9. Wash the unbound or weakly bound pool.
Three washes are sufficient during early rounds.
Alternatively, the filter holder can be attached to a vacuum manifold (which is used here
to maintain a constant negative pressure during filtration, so that each round of selection
is similar and reproducible). Apply a negative pressure of 127 mm of Hg to the filter
holder. Pipet the binding reaction directly onto the filter with the tip just above the filter,
avoiding the formation of bubbles, which may lead to an uneven application of the sample
to the filter and impede the flow of liquid through the filter. Wash the filter with 3 vol of
binding buffer.
Varying the strength of the vacuum, uneven application of the sample, and formation of
bubbles during wash steps may result in inefficient sieving of binding from nonbinding
species, and hence may reduce the efficiency of an individual round of selection. However,
the selection as a whole is fairly robust with respect to changes in these parameters. In
other words, even if steps are not performed perfectly, the selection can be carried forward.
Generation and
Use of
Combinatorial
Libraries
24.3.13
Current Protocols in Molecular Biology
Supplement 88
It should be noted that the vacuum manifold attachment must be thoroughly cleaned
after each round or target. Nonbinding RNAs can stick to the manifold and transfer to
the filter holder base in alternating selection experiments, thereby contaminating them
during elution. The authors recommend using a green Scotch-Bright pad (3M Company)
to scrub the manifold with Alconox Precision Cleaner and water. The manifold should
then be rinsed with water and dried by spraying with ethanol.
Elute RNA off the filter
10. Remove the filter containing RNA:protein complexes from the filter holder using
sterile forceps and place it in a 0.5-ml microcentrifuge tube. Transfer the filter
quickly to avoid ribonuclease contamination from the surrounding environment.
The authors strongly recommend changing gloves after this step to prevent the accumulation of contaminating RNAs in solutions and on equipment.
11. Add 200 μl of elution buffer and heat for 5 min at 95◦ C, followed by agitation
(vortexing) to elute RNA molecules from the protein and filter. Transfer the eluate
to a separate tube and repeat elution with fresh elution buffer.
Two shorter, smaller-volume elutions will more efficiently recover intact RNA than one
long, large-volume elution.
12. Ethanol precipitate the RNA by adding one-tenth volume of 3 M sodium acetate
(0.3 M final), 3 μl of 1 mg/ml blue-dyed glycogen, and 2.5 volumes of 95% ethanol,
microcentrifuging, and washing the pellet with 70% ethanol (see Basic Protocol 1,
steps 9 and 10).
If the binding buffer contains a high (>0.5 M) salt concentration, dilute the eluate with
an equal volume of RNase-free water and precipitate with one volume of isopropanol
instead.
If a subsequent phenol/chloroform extraction is necessary, this precipitation can be
omitted.
Perform a phenol/chloroform extraction (optional steps)
13. To remove residual peptide fragments or proteins that may have coeluted with the
RNA, add an equal volume (i.e., 400 μl) of cold 25:24:1 phenol/chloroform/isoamyl
alcohol. Vortex, then microcentrifuge for 1 min at maximum speed to separate the
liquid phases (the RNA should be in the top, aqueous phase). Transfer the aqueous
phase to a new 1.5-ml microcentrifuge tube.
Avoid transferring phenol/chloroform with the aqueous layer, as it can interfere with
subsequent enzyme reactions. Nevertheless, the aqueous phase will sometimes appear
milky, especially at low temperatures, due to the presence of dissolved phenol-chloroform.
14. Extract the eluate with a similar volume of chloroform to remove any residual phenol.
Avoid transferring chloroform with the aqueous layer, as it can interfere with subsequent
enzyme reactions.
15. Dilute the eluate with an equal volume (∼400 μl) of RNase-free water and add
800 μl of isopropanol, then chill 20 min at −20◦ C to precipitate.
A carrier such as glycogen (see step 12) can be added to aid precipitation.
The elution buffer contains a high concentration of urea. Dilution with 400 μl water and
precipitation with isopropanol is necessary to avoid the formation of salt precipitates,
which appear as oily, unstable droplets in the bottom of the microcentrifuge tube following
centrifugation. If such “salt pellets” appear, additional water should be added to the
sample, the mixture should be homogenized, and the precipitation repeated.
Selection of RNA
Aptamers
16. Microcentrifuge 30 min at maximum speed, remove the supernatant, and resuspend
the RNA sample in 12 ml sterile RNase-free water.
24.3.14
Supplement 88
Current Protocols in Molecular Biology
Perform an additional negative selection (optional steps)
An extremely effective method for ridding the population of filter-binding species is to
carry out an additional negative selection following the selection for binding species,
but prior to amplification. However, at early stages of the selection, an additional postselection filtration step may reduce the complexity of the selected population. Therefore,
it is recommended that post-selection filtration only be carried out following the second
round of selection. Post-selection filtration can also be used to successfully remove
filter-binding species that have begun to accumulate and overrun a selected population.
However, once filter-binding species have established themselves, even a combination
of pre- and post-selection filtrations may not allow specific binding species to regain
a selective advantage. If a simple regime of pre- and post-filtration negative selections
does not succeed in drastically reducing or eliminating established filter-binding species,
the selection should be repeated with a different RNA pool that can be amplified with
different primers, as recommended above.
17. Resuspend the selected RNA pellet in 50 μl binding buffer.
18. Assemble the filter holder with a fresh filter disk as described above.
19. Filter the sample and wash as described above.
20. Discard the filter disk and ethanol precipitate the RNA filtrate as described in step
12.
A carrier (glycogen; see step 12) can be added to improve the efficiency of precipitation.
If the binding buffer contains a high (>0.5 M) salt concentration, dilute the filtrate
with an equal volume of RNase-free water and precipitate with isopropanol instead
(see step 15).
AMPLIFYING SELECTED PROTEIN-BINDING RNA SPECIES
In the following steps, RNA species that survived the positive and negative selection
steps are reverse transcribed to generate a cDNA library, which is subsequently amplified
by PCR. The double-stranded DNA resulting from these steps comprises the pool from
which the next round of selection will begin. While the authors have found that reverse
transcription and PCR steps can be combined for some selections, this is not universally
true. To obtain the highest yield of RNA and DNA products, it is frequently desirable to
carry out separate reverse transcription and PCR reactions, as described below.
BASIC
PROTOCOL 3
Materials
Selected RNA pool (Basic Protocol 2)
TE buffer, pH 8.0 (see recipe), or RNase-free water
SuperScript II reverse transcription kit (Invitrogen)
20 and 200 μM 3 -end primer
4 mM dNTP mix (containing 4 mM each of dATP, dCTP, dGTP, and dTTP)
10× PCR buffer (see recipe)
20 μM 5 -end primer
5 U/μl Taq DNA polymerase (New England Biolabs)
6× nondenaturing dye: 0.6% (w/v) bromphenol blue and 10× ethidium bromide in
TBE buffer (see APPENDIX 2 for TBE buffer)
NuSieve agarose (Cambrex)
10 mg/ml ethidium bromide solution (APPENDIX 2)
TBE buffer (APPENDIX 2)
3 M sodium acetate (APPENDIX 2)
1 mg/ml blue-dyed glycogen (GlycoBlue; Ambion)
Generation and
Use of
Combinatorial
Libraries
24.3.15
Current Protocols in Molecular Biology
Supplement 88
70% and 95% ethanol
Thermal cycler (e.g., BioRad DNAEngine with heated lid) and PCR tubes
Additional reagents and equipment for the polymerase chain reaction (Chapter 15),
agarose gel electrophoresis (e.g., UNIT 2.6), and DNA sequencing (Chapter 7)
NOTE: All solutions and buffers should be made with deionized water (18.2 M resistivity), filtered through 0.2-μm polyethersulfone (PES) membrane, and sterilized by
autoclaving. Use sterile, disposable plasticware and micropipet tips with filter barriers
where possible. See Chapter 4 introduction and UNIT 4.1 for guidelines on standard methods to protect against contaminating RNases. If ribonuclease contamination is found
to occur, it may be eliminated by treating water with diethylpyrocarbonate (DEPC; see
UNIT 4.1).
Reverse transcribe the selected binding species into ssDNA
The reverse transcription (RT) and PCR amplification should be performed in separate
steps so that the accumulation of DNA during a cycle course can be evaluated.
1. Resuspend the RNA in 13 μl TE buffer or RNase-free water and set up the following
20-μl RT reactions:
8.5 μl RNA suspension
2.0 μl 200 μM 3 -end primer
2.5 μl 4 mM dNTP mix
Perform the following controls in parallel with the amplification of selected RNA
species in order to detect nonspecifically bound RNA species and replication parasites
(see Critical Parameters for discussion of parasites).
a. No-template control: To ensure that none of the stock solutions have been contaminated with exogenous RNA or DNA amplicons, set up an RT-PCR reaction
without adding any template.
b. No-RT control: To ensure that amplified products are in fact derived from selected
RNA species and not from endogenous or cross-contaminating DNA molecules,
set up an RT-PCR reaction without the reverse transcriptase.
2. Heat denature the reaction at 65◦ C in a thermal cycler for 5 min and cool to room
temperature over 10 min
This step ensures that primer can access and anneal to the primer-binding site on the
pool.
3. Add the following components to each reaction:
4 μl 5× First Strand Buffer (from SuperScript II kit)
2 μl 0.1 M DTT (from SuperScript II kit)
1 μl SuperScript II reverse transcriptase from SuperScript II kit (or RNase-free
water for the no-reverse transcriptase control)
4. Mix the reaction well by pipetting up and down, then incubate the reaction at 42◦ C
for 50 min. Heat inactivate the enzyme at 70◦ C for 15 min.
Selection of RNA
Aptamers
Perform cycle-course PCR
It is important not to over-amplify the selected templates, especially in the first several
rounds, since amplification artifacts can dominate a selection. To determine the optimal
number of cycles for amplification in each round, an initial “ranging” or cycle-course
PCR must be performed. A small sample of DNA is taken from the PCR every 2 to
3 cycles, and saved for gel analysis. The cycle at which a strong band is present is the
24.3.16
Supplement 88
Current Protocols in Molecular Biology
6
8
PCR cycle
10 12 14
16
18
20
100-bp ladder
4
Figure 24.3.4
Cycle-course PCR.
cycle that should be used to amplify the remainder of the pool (see Fig. 24.3.4). If a
“no-protein” negative control selection was performed, the relative appearance of bands
during the cycle course can be used to help determine if partitioning of binding species
from nonbinders has occurred.
5. With the ssDNA from the reverse transcriptase reaction, set up the PCR reaction as
follows:
10 μl 10× PCR buffer
5 μl 4 mM dNTP mix
2 μl 20 μM 5 -end primer
2 μl 20 μM 3 -end primer
2 μl pool ssDNA (from step 4)
0.5 μl 5 U/μl Taq DNA polymerase
77.5 μl nuclease-free water.
6. Incubate the reaction under the following conditions:
1 cycle:
20 cycles:
1 cycle:
5 min
45 sec
45 sec
1 min
indefinitely
95◦ C
92◦ C
50◦ C
72◦ C
4◦ C
(initial denaturation)
(denaturation)
(annealing)
(extension)
(hold).
It should be noted that the listed conditions have been optimized for the pool design
methods described in UNIT 24.2. However, different pools and primers may require very
different amplification conditions. See UNIT 15.4 for comments on primer selection and for
the experimental parameters that govern reverse transcription and PCR.
7. Within the last 10 sec of the 72◦ C extension step in cycle 6, remove a 5-μl sample
and combine it with 1 μl of 6× non-denaturing dye in a separate PCR tube.
To prevent cross-contamination within the thermal cycler, remove the tube when aliquotting each sample.
8. Repeat step 7 at the end of the 72◦ C extension step of cycles 8, 10, 12, and 14. Allow
the PCR to progress to cycle 20 and remove a final 5-μl sample aliquot within the
last 10 sec of the 72◦ C extension step of that cycle.
Check for the presence of amplified, double-stranded DNA
9. Make a 3.8% NuSieve agarose gel solution that contains 0.1 μg/ml ethidium bromide.
Pour an agarose gel with this solution. Load the samples and run the gel in TBE at
125 V for 30 min (see UNIT 2.6). Look for products with a UV transilluminator (see
Fig. 24.3.4).
Generation and
Use of
Combinatorial
Libraries
24.3.17
Current Protocols in Molecular Biology
Supplement 88
An estimate of the minimal number of cycles needed to visualize a product band on the
agarose gel can be roughly calculated. Consider that, of the 5 μg of RNA added to the
selection, ∼3% likely binds to the filter and is lost during the negative selection step.
Approximately 0.1% to 1% of the population may bind to the target. When the selected
RNA is precipitated, two-thirds of the sample are used for the reverse transcription and
one-tenth for the PCR. Therefore:
(5.0 μg)(0.97)(0.01)(2/3)(0.1) = 3.2 ng RNA.
Assuming that every cycle doubles the amount of DNA, a minimum of nine cycles would
be necessary to obtain 1 to 2 μg of DNA. This would imply that 0.05 to 0.1 μg could
be loaded and readily visualized on the ethidium bromide–stained agarose gel. Thus,
from 10 to 12 cycles should initially be carried out and the products analyzed by gel
electrophoresis. The authors frequently find this rough estimate to be accurate.
The accumulation of double-stranded DNA is closely monitored in order to avoid overamplification of the sample and the concomitant accumulation of high-molecular-weight
species. DNA that has been over-amplified will look blurry and dispersed following
analysis by gel electrophoresis. These large DNA molecules are often the result of the
3 end of a single-stranded DNA folding back and internally priming its own extension,
resulting in a long stem-loop that can be amplified by a single PCR primer (also known
as single-primer artifacts). Over-amplified DNA templates can also yield RNA molecules
of the incorrect size following transcription.
If one primer is more abundant or efficient than the other, a smaller, single-stranded DNA
band or bands may also be present.
The various controls (no-protein, no-template, no–reverse transcriptase) should be amplified in parallel with the actual sample. If specifically bound RNA is acting as a template
for the accumulating amplicons, then the “no-RT” sample should lag the pool PCR reaction by at least three cycles. It is desirable that no bands be observed in the “no-template”
control, but if they do arise, they should lag the RT-PCR reaction by at least five cycles. If
bands do arise, a distinction should be made between full-length PCR products (indicating contaminating replicons) and smaller products (likely primer amplification artifacts).
If product bands in the control lanes are as prominent as product bands in the experimental lanes, then it is necessary to check or remake reagents and go back and repeat
the previous round of selection. There is one exception to this rule: in the initial rounds,
it is common to see a band in the “no-protein” control lane because the proportion of
the population that binds to the filter is typically greater than the proportion that binds
specifically to the target. However, subsequent rounds of selection should result in the
diminution or disappearance of the “no-protein” band.
Observing the number of cycles needed to visualize a double-stranded DNA band can
loosely monitor the progress of the selection. The number of cycles should be roughly
proportional to the amount of RNA pool that originally binds to the protein. Therefore, if
the RNA eluted from the “no-protein” control requires more cycles for full amplification
than does the RNA selected in the presence of protein, it can be tentatively assumed that
the selected RNA is binding to the protein. Occasionally, in the early rounds of selection,
this may not be true, since a very small fraction of the pool will bind to the protein relative
to the small fraction of the pool that adheres to the filter.
Counting PCR cycles is, however, only a very rough (and frequently inconsistent) measure
of success. In fact, it is common for the number of cycles required to fully amplify selected
nucleic acids to vary greatly between rounds. Direct binding assays of the RNA pool
(Support Protocol 3) are a much more accurate and useful gauge of the progress of a
selection experiment.
10. Once the optimum PCR cycle has been determined, set up eight 100-μl PCR reactions
as described below, and perform the cycling conditions listed above in parallel for
the optimum number of cycles.
Selection of RNA
Aptamers
80 μl 10× PCR buffer
40 μl 4 mM dNTP mix
16 μl 20 μM 5 -end primer
24.3.18
Supplement 88
Current Protocols in Molecular Biology
16 μl 20 μM 3 -end primer
16 μl pool ssDNA
4 μl 5 U/μl Taq DNA polymerase
628 μl nuclease-free water
11. Ethanol precipitate the RNA by adding one-tenth volume of 3 M sodium acetate
(0.3 M final), 3 μl of 1 mg/ml blue-dyed glycogen, and 2.5 volumes of 95% ethanol,
microcentrifuging, and washing the pellet with 70% ethanol (see Basic Protocol 1,
steps 9 and 10).
Use amplified DNA template for the next round of selection
12. Resuspend the pellet in 20 μl TE buffer or nuclease-free deionized water. Proceed
with the next round of selection starting with step 1 of Basic Protocol 1.
A 100-μl PCR reaction yields ∼1 μg dsDNA, so approximately one-quarter of the resuspended DNA will equate to 2 μg sample and should be used for the next transcription
reaction. The remaining dsDNA, and potentially the remaining RNA after transcription,
can serve as a long-term, archival sample.
ASSAYING THE ACCUMULATION OF PROTEIN-BINDING RNA SPECIES
To verify that the RNA pool has been or is being winnowed to those few sequences that
bind the protein target with high affinity and specificity, the selected RNA pool should
periodically be assayed for its ability to bind the target protein. The authors recommend
an initial binding assay after five rounds of selection and amplification, then again every
three additional rounds (the same recommendation that was made with regard to checking
for filter-binding species; the two tests can be carried out in parallel). While the initial
binding assay is carried out at a series of protein concentrations to gauge the amount of
protein that should be used in the selection, the progress of the selection can be most
simply monitored by internally radiolabeling the RNA and determining how much binds
to a single, convenient concentration of the protein target.
SUPPORT
PROTOCOL 3
Materials
Pool of dsDNA after n rounds of selection (Basic Protocol 3)
Binding buffer (see Critical Parameters)
Target protein
167 mCi/ml [α-32 P]ATP (7000 Ci/mmol; ICN Biomedical Inc or GE Healthcare
Life Sciences)
Additional reagents and equipment for purifying a radiolabeled RNA pool
(see Basic Protocol 1) and performing the filter binding assay (see Support
Protocol 2)
1. Generate radiolabeled RNA pool via a “hot transcription” with α-labeled nucleoside
triphosphate (typically [α-32 P]GTP or ATP) and purify as described previously
(Basic Protocol 1).
The transcription is carried out as described in Basic Protocol 1 except that 1 μl of
α-labeled ATP is added to the 20-μl transcription reaction in addition to the standard
NTP mix.
After the RNA has been separated from free nucleotides via PAGE, the buffer in the bottom
chamber will contain unincorporated nucleoside triphosphates and will therefore be extremely radioactive. Care should be taken when transferring and disposing of this solution.
2. Thermally equilibrate 1 μg of the radiolabeled RNA pool after a round of selection
in binding buffer as described in Support Protocol 2, steps 1 and 2.
Generation and
Use of
Combinatorial
Libraries
24.3.19
Current Protocols in Molecular Biology
Supplement 88
3. For each round tested, set up reactions in triplicate with and without target. Add an
equimolar amount of protein to the RNA pool. Incubate the binding reaction under
conditions similar to those used for selection.
The binding reaction volume should be the same as that used for the selection. If the
amount of protein sample is limited or limiting, less protein can be used in the binding
reaction. However, one should be cognizant of the fact that less than 100% binding
is possible. Alternatively, less protein and less RNA sample can be used, although the
diminution of both components will mean that one is assaying binding under conditions
more stringent than those actually used for selection. While the volume of the binding
reaction could also be diminished to conserve protein, it is difficult to uniformly apply
volumes less than 30 μl to the filter.
To limit spurious background signal, blocking agents such as nonradioactive tRNA
and BSA can be added to the binding reaction, or added immediately prior to
filtration.
4. Filter each binding reaction and wash three times, each time with 1 volume binding
buffer (see Support Protocol 2, steps 5 through 10).
A good result at this point would be 15 to 20% fraction bound above background (see
Table 24.3.1. round 6). If binding to filter alone is too high, then filter binders are being
selected and more negative selection is needed.
5. If the desired binding is detected, clone (UNIT
Chapter 7) to isolate individual variants.
15.4)
and sequence the pool (see
6. Compare aptamers with one another to identify sequence and structural similarities.
A typical observation is the selection of sequence families that are similar over a large portion of the aptamer and/or short sequence motifs that are common to multiple, otherwise
different aptamers.
REAGENTS AND SOLUTIONS
Use RNase-free deionized, distilled water in all recipes and protocol steps. For common stock
solutions, see APPENDIX 2; for suppliers, see APPENDIX 4.
Denaturing dye, 2×
TBE buffer (APPENDIX 2) containing:
0.1% (w/v) bromphenol blue
7 M urea
Store up to 6 months at −20◦ C
Denaturing polyacrylamide gel, 8%
TBE buffer (APPENDIX 2) containing:
8% (v/v) 19:1 acrylamide:bisacrylamide
7 M urea
See UNIT 2.12 for full details on pouring and running the gel.
Elution buffer
4 to 7 M urea
25 mM disodium EDTA
Store up to 3 months at −20◦ C
Prepare with RNase-free water.
Selection of RNA
Aptamers
24.3.20
Supplement 88
Current Protocols in Molecular Biology
PCR buffer, 10×
100 mM Tris·Cl, pH 8.4 (APPENDIX 2)
500 mM KCl
20 mM MgCl2
PCR buffer can be stored at room temperature, or can be refrigerated or frozen. If it is
frozen, care should be taken to mix the buffer after thawing.
TE buffer, pH 8.0
10 mM Tris·Cl, pH 8.0 (APPENDIX 2)
1 mM EDTA, pH 8.0 (APPENDIX 2)
Store up to 6 months at −20◦ C
COMMENTARY
Background Information
Sol Spiegelman and co-workers developed
a working system for the in vitro replication
and evolution of small RNA molecules over
35 years ago (Mills et al., 1967; Levisohn and
Spiegelman, 1969; Kramer et al., 1974). The
development of more advanced (although conceptually identical) methods for in vitro evolution, as described in this unit, was potentiated by advances in the chemical synthesis
of oligonucleotides and the amplification of
nucleic acids, such as PCR, in vitro transcription, and self-sustained sequence replication
(3SR) (Guatelli et al., 1990). The adaptation
of these methods to in vitro evolution of RNA
molecules was partially due to the recognition that early evolutionary events, such as
the genesis of ribozymes, could be recapitulated in a test tube, and partially due to the
recognition that the ability to tailor RNAbinding species and catalysts might have numerous biotechnological applications. Following the publication of key papers outlining
and proving selection technologies (Ellington
and Szostak, 1990; Tuerk and Gold, 1990),
a much wider array of selection experiments
has been attempted. To date, RNA molecules
that can bind targets as small as zinc and as
large as viruses and organelles have been selected (reviewed in Stoltenburg et al., 2007 and
Shamah et al., 2008). RNA molecules that interact with both nucleic-acid-binding proteins
and non-nucleic-acid-binding proteins can be
selected with almost equal facility from random sequence populations. These results have
been thoroughly reviewed in numerous publications (Gold et al., 1995; Uphoff et al., 1996;
Kulbachinskiy, 2007).
Critical Parameters
Choosing protein targets
As briefly described above, a wide variety of proteins have proven to be success-
ful targets for selection experiments, including enzymes, transcription factors, cytokines,
antibodies, and viral capsids (Gopinath, 2007;
Stoltenburg et al., 2007). There is no common functional theme uniting these targets,
nor can many generalities be drawn regarding
their biochemistry or structure. However, it is
safe to say that “good” selection targets tend
to fall into two classes. First, proteins that normally bind nucleic acids will also be able to extract aptamers from a random sequence pool.
The notion of a nucleic-acid-binding protein
can, to some extent, be expanded to include
proteins that bind nucleotides. For example,
kinases and dehydrogenases bind nucleotide
cofactors and have proven to be good selection targets.
Second, proteins that for whatever reason contain basic patches in their primary
sequences or on their surfaces also frequently yield high-affinity aptamers. For example, many cytokines and other signaltransduction proteins bind heparin or other sulfated oligosaccharides, and can also be used to
select aptamers from random sequence populations. The anti-cytokine aptamers frequently
bind to the same sites as heparin (Jellinek et al.,
1993). Similarly, proteins that bind phosphate
or phosphomonoester or phosphodiester bonds
frequently have positively charged active sites
and can be used to elicit aptamers. For example, anti-phosphatase aptamers have been selected from random sequence pools (Bell et al.,
1998).
This is not to say that proteins that do not
fall into these categories will necessarily be
poor selection targets, but merely that they
are not guaranteed selection targets. For example, antibodies have frequently proven to
be excellent selection targets irrespective of
whether they bind negatively charged antigens (Keene, 1996). This likely implies that
proteins with large pockets or clefts on their
Generation and
Use of
Combinatorial
Libraries
24.3.21
Current Protocols in Molecular Biology
Supplement 88
surface are good selection targets. This hypothesis is further bolstered by another line
of reasoning. Aptamers selected to bind proteins frequently inhibit protein function. That
is, anti-antibody aptamers block interactions
with antigens, anti-enzyme aptamers inhibit
enzymatic activities, and so forth. This socalled ”homing principle” may be due to the
fact that aptamers not only have to form a surface that is chemically complementary to a target, but they also must fold into a structure that
properly presents the chemically complementary surface. The most informationally parsimonious way to achieve both functions is to fit
into a pocket on a target, rather than to form a
“grasping” structure that can enfold a surface
protrusion of a target. Thus, the most common
(and most highly represented) aptamers may
be those that fit into surface crevices. In contrast, antibodies have a preformed structure for
the presentation of chemically complementary
surfaces, and thus can more easily grasp protruding epitopes and less easily fit into surface
crevices.
Overall, researchers should be guided not
so much by these considerations as by the results of initial binding assays with their particular protein target. If the target binds to
the filter (not a given, since small, acidic proteins such as the Rop protein from E. coli will
frequently pass through the filter) and shows
some affinity for a random sequence pool, then
it is highly probable that there will be some
sequences or structures within the pool with
greatly enhanced affinities for the target.
Selection of RNA
Aptamers
Choosing a binding buffer
The binding buffer should promote specific
binding of nucleic acids to a protein target.
The first consideration in choosing a buffer
is to identify conditions under which the protein is active, or at least stable. In addition, if
the selected nucleic acid species are to eventually be used in a particular environment,
the selection buffer should reflect this environment. For example, if the selected nucleic
acids are to be expressed in a cell, then the
selection buffer should be at physiological pH
and contain physiological ion concentrations.
Second, there are a variety of parameters that
can be used to make the RNA pool more or
less “sticky.” These parameters are discussed
in much greater detail below (see Stringency
of selection).
A typical binding reaction is built from one
of the commonly used buffers, such as Tris·Cl,
phosphate, or HEPES, which can hold the pH
near 6 to 8, together with 50 to 200 mM NaCl
or KCl and 1 to 10 mM MgCl2 . However,
these are merely suggestions, and aptamers
have in fact been selected under a variety of
buffer conditions. For example, in the selection that targeted bFGF, phosphate-buffered
saline was used even though it lacked divalent
cations (Jhaveri, 1998). Similarly, ribozyme
selections have been carried out in which
a variety of divalent metal ions are mixed,
and nascent ribozyme species “decide” which
combination of metals most enhance their activities (Lehman and Joyce, 1993). An equivalent strategy could be used for the selection of
aptamers.
Selection matrices
Due to the tremendous ratio of matrix
surface area to protein surface area, matrixbinding aptamers can quickly and easily
eclipse target-binding aptamers. Proteins are
likely captured on nitrocellulose or modified
cellulose filters via hydrophobic interactions.
Nucleic acids are, by and large, too hydrophilic
or charged to be similarly captured. This distinction is the basis for most filter-binding
assays. However, the nucleobases of nucleic
acids obviously contain large hydrophobic surface areas, and it is easy to select nucleic
acids that can present nucleobases and be captured by the filter. Selected filter-binding sequences frequently contain purine (especially
guanosine) tracts presented as single-stranded
loops or bulges. Interestingly, hydrophobicbinding sequences selected on one hydrophobic matrix are frequently cross-reactive with
other hydrophobic matrices: i.e., microtiter
plate-binding species can bind tubes and filters, filter-binding species can bind tubes and
microtiter plates, and so forth.
In order to avoid filter-binding sequences,
the authors have filtered RNA samples multiple times in the absence of protein, and in some
cases filtered samples following selection but
prior to the RT-PCR step. Matrix-binding sequences can also be avoided by altering the
matrices used for selection. For example, techniques such as gel mobility shifts, immunoprecipitation, and affinity chromatography have
all been successfully used to sieve pools and
select target-binding aptamers (Conrad et al.,
1996). If filter-binding species predominate in
a population even after appropriate precautions are taken, these alternative selection techniques can be used either to rid the selected
population of the filter-binding species or, better yet, to restart the selection. For example, if
the immunoprecipitation of RNA:protein complexes has been worked out in advance, then
24.3.22
Supplement 88
Current Protocols in Molecular Biology
immunoprecipitation can be interspersed with
rounds of filter binding.
Even though the selection of filter-binding
sequences can be a problem, filter binding is
still generally recommended as the technique
of choice for most selections. Gel mobility
shift experiments tend to be much more sensitive to parameters such as sample preparation, ionic strength, pH, and electrophoresis
conditions than are filter-binding experiments.
Moreover, just as filter-binding species can be
inadvertently selected during filtration selection, RNA species with altered electrophoretic
mobilities (e.g., dimers) can be selected during
gel-mobility shift selections. Immunoprecipitation experiments require an additional protein reagent, and consequently anti-antibody
rather than anti-target aptamers are frequently
selected. Affinity chromatography or similar
techniques generally require that very large
amounts of target proteins be committed to
the preparation of affinity matrices. If affinity elution is to be used, then even larger
amounts of target proteins will be required.
Moreover, aptamers that bind to agarose matrices can be selected almost as easily as aptamers that bind to nitrocellulose or modified
cellulose filters (although the two, thankfully,
do not cross-bind to one another’s matrices).
Finally, microtiter plate panning selections encourage the accumulation of the same sorts of
matrix-binding aptamers that are elicited by
filter-binding selections.
Stringency of selection
Overall, most selection experiments are
generally competitions between specifically
and nonspecifically binding nucleic acid
species. The authors tend to initially choose
conservative binding conditions in hope of
promoting the early establishment of binding
species in the population. While this may mean
that low-affinity species are isolated from the
pool along with high-affinity species, the lowaffinity species can eventually be removed
by increasing the stringency of selection. In
essence, time (the number of cycles required to
purify high-affinity species) can be traded for
the assurance that filter-binding species will
not accumulate and predominate.
A variety of parameters can be modulated
to increase or decrease the stringency of a selection experiment. These parameters should
initially be chosen based on the results of Support Protocol 2, which assays the affinity of
the pool for the target and should be made progressively more stringent based on the results
of Support Protocol 3.
The amount of protein target. The more
protein there is to bind, the easier it is to
capture nucleic acid binding species. Using
low amounts of protein increases competition
among binding species. However, the amount
of protein target available to researchers is
usually limited, and thus it is easier to use
a set amount of protein (usually from 0.1 to
10.0 μM per binding reaction) and to vary the
RNA:protein ratio.
RNA:protein ratio. By increasing the ratio of pool to target, more binding species
will compete for a smaller number of targets.
Typically, after a few initial rounds with an
equimolar pool-to-target ratio, the ratio is increased to between 10:1 and 100:1. This increase can be effected either by increasing the
amount of RNA or by decreasing the amount
of protein. Because of the underlying competition between specifically binding species and
nonspecifically binding species, increasing the
amount of RNA is preferable to decreasing the
amount of protein. For a more detailed treatment of this subject, see Irvine et al. (1991).
However, the general conclusions of these
mathematical models are similar to the empirical advice given here.
Competitors. High concentrations of nonspecific, non-amplifiable competitors such as
tRNA or bulk cellular RNA will compete with
low-affinity binding species that adhere to basic patches on the surface of a protein. Typically, a 100-fold excess of tRNA is used. Similarly, specific competitors can be used to block
the access of low-affinity binding species to a
preferred site. Wild-type nucleic acid ligands
can be used to block the binding sites of nucleic acid binding proteins. For example, during the selection of anti-Rev aptamers, Giver
et al. (1993) included a 10-fold excess of the
wild-type Rev-binding element. The anti-Rev
aptamers that were obtained could bind with
high affinity to the RNA-binding domain of
Rev and could effectively compete with the
wild-type Rev-binding element. Other ligands
or substrates can also be used to block the
binding or catalytic sites of non-nucleic acidbinding proteins. For example, during the selection of anti-bFGF aptamers, Jellinek et al.
(1993) included heparin, a natural ligand for
bFGF. The anti-bFGF aptamers that were obtained could bind with high affinity to the heparin binding site and could effectively compete
with heparin.
Cation concentration. Monovalent cations
(such as Na+ ) and divalent cations such
as Mg2 + stabilize the structure of RNA
molecules and contribute to both specific
Generation and
Use of
Combinatorial
Libraries
24.3.23
Current Protocols in Molecular Biology
Supplement 88
and nonspecific binding. Decreasing monovalent and/or divalent cation concentrations,
therefore, can increase the stringency of the
selection. However, it is unclear, in advance, whether specific or nonspecific binding
species will be more favored by such a change.
Moreover, since binding species that require a
monovalent and/or divalent cation to fold into
shapes that are chemically complementary to
a target may be favored in the early rounds
of selection, potentially high-affinity binding
species may be lost by changing the binding
buffer late in the selection experiment. It is
better to attempt to change the buffer dependency of aptamers by partial randomization
and reselection following the initial selection
experiment, rather than to attempt to change
the buffer dependency during the selection.
Conversely, higher concentrations of
monovalent cations (generally Na+ or K+ ) increase the structural integrity of folded nucleic
acids by neutralizing the close approach of
nucleic acid strands. However, higher monovalent ion concentrations also suppress electrostatic interactions with targets. Thus, paradoxically, both “low” and “high” monovalent
ion concentrations can be used to increase the
stringency of a selection experiments. Higher
concentrations of divalent cations such as magnesium help to maintain the structural integrity
of RNA molecules and potentially facilitate
the formation of salt bridges between acidic
residues and the phosphate backbone.
Equilibration time. Longer equilibration
times give stronger binding species a greater
chance to bind to the target, since weaker
binding species more quickly dissociate from
the target. In general, though, species with
nanomolar dissociation constants or lower can
be readily selected by allowing the reaction to
equilibrate for 5 min or more. The authors usually allow up to 30 min for the binding reaction
in order to permit slow folding or refolding
steps in the presence of the target. However,
longer equilibration times may not be possible for proteins that are inherently unstable
or that themselves undergo slow, buffer- or
temperature-induced conformational changes.
Dilution of binding buffer. Similarly, diluting the binding reaction by 10- to 20-fold just
prior to filtration will favor the selection of
RNA:protein complexes with low dissociation
constants over RNA:protein complexes with
higher dissociation constants. Baskerville et al.
(1995) have successfully used this technique
to select high affinity anti-Rex aptamers.
Amount and composition of wash. Increasing the number of times a filter is washed and
the volume of the buffer used for the washes
should preferentially increase the retention of
high-affinity binding species relative to lowaffinity and nonspecific binding species. It is
generally recommended that the same buffer
be used for selection and for wash steps, in
order to avoid changing the conditions under which aptamers are selected. However, the
stringency of the selection can potentially be
manipulated by changing the buffer used for
the wash steps. For example, if monovalent
cation concentrations are limited in the binding buffer due to requirements for the stability or activity of a protein target, a separate
wash buffer that contains a higher salt concentration can be used to challenge captured
RNA:protein complexes.
Amplification kits
While the authors routinely utilize the kits
described in this protocol, it goes without saying that many commercial kits are available
for reverse transcription, the polymerase chain
reaction, and in vitro transcription. However,
the kits mentioned specifically in the protocols above have been found to be very useful
in the Aptamer Selection Research Stream of
the Freshman Research Initiative at the University of Texas at Austin. The students in this
Stream have systematically assessed a variety
of commercial kits with a variety of selection
conditions. The kits were also evaluated with
respect to cost, ease of use, robustness, and
quality of results. For instance, the authors
often utilize relatively inexpensive NEB Taq
polymerase due to the quantity consumed over
multiple rounds of selection. However, Platinum Taq (Invitrogen), AmpliTaq Gold (ABI),
or Phusion (NEB) have been used to successfully amplify DNA when NEB Taq failed. It is
reasonable to assert that if competent undergraduates can utilize these kits, then more experienced researchers should be able to obtain
positive results with them.
The authors have also compared reverse transcriptases from Invitrogen (SuperScript), Applied Biosystems (MEGAScript),
and Roche (Transcriptor). SuperScript II was
found to be the most convenient to use. Lastly,
the authors have tested a number of kits and
components for transcription, including overexpressed and purified T7 RNA polymerase
versus polymerases and kits from Invitrogen
and Roche. Although relatively expensive for
Selection of RNA
Aptamers
24.3.24
Supplement 88
Current Protocols in Molecular Biology
our purposes, the AmpliScribe High Yield kit
from Epicentre was chosen because of its consistent yield and robustness to template quality
and incubation temperatures.
It should be noted that lot-to-lot variations are more common for “in house” enzyme preparations, and the yields are generally
lower than those obtained with commercial
kits. Troubleshooting homemade preparations
can also be difficult relative to the technical
support capabilities of a good reagent company. If users choose to prepare their own enzymes, a freshly expressed preparation should
be fully tested for activity with controls, and
then the same sample or aliquot should be
utilized throughout the selection.
Parasites
Replication parasites differ from matrixbinding aptamers, but can interfere with the selection of target-binding aptamers in the same
way. Reverse transcriptase, Taq polymerase,
and T7 RNA polymerase all have some preference for which sequences they will copy
or reproduce. These preferences are generally
not obvious when constant-sequence nucleic
acids are being synthesized. However, in
selection experiments, many cycles of amplification are carried out, and differences in the
rates of synthesis are also proportionately amplified, leading to the selection of sequences
that have no function other than to replicate
optimally. For example, during the polymerase
chain reaction, if a primer designed to bind to
a constant sequence region instead recognizes
a partially complementary sequence within a
random sequence region, it can bind and generate a smaller amplicon. The smaller amplicon will generally be amplified more quickly
than the larger amplicon, and thus can potentially out-compete full-length species selected
for binding function. Depending on the relative advantage of the replication parasite relative to an aptamer, even if the replication parasite is partially removed from the population
during each selection step, enough molecules
may remain to over-run the amplification reaction and displace the functionally selected
aptamer. This is especially true if the amplification parasite also happens to be a filterbinding species. It is for this reason that DNA
templates and/or RNA molecules should be
size-selected in each round.
The nascent reproductive differences between nucleic acid species can be grossly
amplified by amplification methods that allow continuous reproduction of the nucleic
acids, such as isothermal amplification or 3SR
(Guatelli et al., 1990). For example, Breaker
and Joyce (1994) generated an extremely robust replication parasite, RNA Z, during a selection designed to generate catalytic variants
of a group II intron. Similarly, the authors
have generated replication parasites of isothermal amplification reactions from completely
random sequence pools (K. Marshall, pers.
comm.). Interestingly, these isothermal amplification parasites were actually larger than the
initial RNA species and represented recombination events between individual members of
the pool. Airborne copies of these replication
parasites can readily “seed” isothermal amplification reactions and overrun pool molecules
that are initially present in even million-fold
excess. In this respect, the replication parasites
of isothermal amplification reactions resemble
the midi-variants or “monsters” of Qβ replicase amplification reactions, and are equally
hard to vanquish, once established. It is for
this reason that the authors strongly recommend the sometimes tedious but inherently
faithful regime of reverse transcription, PCR,
and in vitro transcription for the amplification
of RNA pools. However, successful selections
have been carried out that have relied upon
isothermal amplification (see, for example,
Breaker et al., 1994; Wright and Joyce, 1997;
Wlotzka and McCaskill, 1997), and this admonition can most confidently be challenged
if the starting pool is a partially randomized
binding site or ribozyme. The reason is that
isothermal amplification parasites are more
likely to be found in or derived from a “deep
random” pool than in a pool that centers on a
given functional sequence.
Anticipated Results
Table 24.3.1 shows the progression of
a selection carried out in the authors’ lab
against bFGF using an RNA pool with a 30nucleotide-long randomized region. In order
to evaluate the success of a selection experiment, it was necessary to compare the affinity
of the selected pool versus the affinity of the
unselected pool for the protein target (Support
Protocol 3). When assaying the pool after a
round of selection, it was necessary to validate the fraction of the pool that bound to
the protein by including a no-protein control.
If the accumulation of matrix-binding species
had been evident, more stringent negative selections could have potentially been used to
control or reduce their numbers.
The affinity of the RNA aptamer for the
protein target cannot be anticipated. Affinity typically varies between micromolar and
Generation and
Use of
Combinatorial
Libraries
24.3.25
Current Protocols in Molecular Biology
Supplement 88
sub-nanomolar, depending presumably on the
makeup of the nucleotide pool and on the
targeted protein. However, it might be worth
mentioning that, of the first 100 selections carried out at two commercial entities using the
technology—Gilead Sciences and NeXstar—
just under 80% yield aptamers with affinities
under 10−9 M (Brody et al., 1999). Recent
innovations at Somalogic involving modified
nucleotides have greatly increased both the
rate of success and the affinities of selected
aptamers (Zichi et al., 2008).
Acknowlegements
The authors would like to thank the initial
contributor, Sulay D. Jhaveri, for his original
work. We would like to thank the Welch Foundation for their continued support. Bradley
Hall was partially supported by the National
Institute of Health and the Freshman Research
Initiative at the University of Texas at Austin.
In addition, these methods were refined by undergraduate students from the Freshman Research Institute based on generous funding
from the National Science Foundation and the
Howard Hughes Medical Institute.
Time Considerations
The time required to go from one pool
of selected DNA templates to the next is
∼24 to 72 hr, depending on the researcher
and the demands of the particular selection
experiment. Minimally, a transcription reaction takes ∼4 hr, and the ensuing DNase, heatdenaturation, and gel-purification steps can
take another 2 to 3 hr. Elution for 8 to 10 hr
yields an adequate amount of RNA to be used
in the subsequent binding reaction. After precipitation and quantification of the RNA (1 hr),
the preselection filtration, incubation with target, and selection steps can be performed in
2 hr. Elution of protein-RNA complexes, subsequent extractions, and another precipitation
step take another 2 hr. The amount of time
needed to see a DNA product varies according to the number of PCR cycles needed to
amplify the pool to a certain amount, and that
number is inversely related to the abundance
of target-binding species that survived the selection. Nevertheless, the RT-PCR steps, followed by precipitation of the DNA templates
that can be added to the transcription mix,
should consume ∼3 to 4 hr.
The amount of time it takes to carry out the
entire selection is contingent upon the number
of rounds needed to accumulate target-binding
species. That number, in turn, varies depending upon the initial affinity of the unselected
pool for the target and on the stringency with
which each round of the selection is carried
out. When additional steps such as radiolabeling and assaying unselected and selected pools
are taken into account, an entire selection experiment can take up to 2 to 3 weeks. It is for
this reason that the authors have recently developed automated methods for selection experiments (Cox et al., 1998) that can speed the
entire process by an order of magnitude.
Literature Cited
Baskerville, S., Zapp, M., and Ellington, A.D. 1995.
High resolution mapping of the human T-cell,
leukemia virus type 1 rex-binding element by in
vitro selection. J. Virol. 69:7559-7569.
Bell, S.D., Denu, J., Dixon, J.E., and Ellington, A.D.
1998. RNA molecules that bind to and inhibit
the active site of a tyrosine phosphatase. J. Biol.
Chem. 273:14309-14314.
Breaker, R. and Joyce, G.F. 1994. Emergence of a
replicating species from an in vitro RNA evolution reaction. Proc. Natl. Acad. Sci. U.S.A.
91:6093-6097.
Breaker, R., Banerji, A., and Joyce, G.F. 1994. Continuous in vitro evolution of bacteriophage RNA
polymerase promoters. Biochemistry 33:1198011986.
Brody, E.N., Willis, M.C., Smith, J.D., Jayasena,
S., Zichi, D., and Gold, L. 1999. The use of aptamers in large arrays for molecular diagnostics.
Mol. Diagn. 4:381-388.
Chandra, S. and Gopinath, B. 2007. Methods
developed for SELEX. Anal. Bioanal. Chem.
387:171-182.
Conrad, R.C., Giver, L., Tian, Y., and Ellington,
A.D. 1996. In vitro selection of nucleic acid
aptamers that bind proteins. Methods Enzymol.
267:336-367.
Cox, J.C., Rudolph, P., and Ellington, A.D. 1998.
Automated DNA selection. Biotechnol. Prog.
14:845-850.
Ellington, A.D. and Szostak, J.W. 1990. In vitro
selection of RNA molecules that bind specific
ligands. Nature 346:818-822.
Giver, L., Bartel, D., Zapp, M., Green, M., and
Ellington, A.D. 1993. Selective optimization
of the Rev-binding element of HIV-1. Nucleic
Acids Res. 23:5509-5516.
Gold, L., Polisky, B., Uhlenbeck, O., and Yarus,
M. 1995. Diversity of oligonucleotide functions.
Annu. Rev. Biochem. 64:763-797.
Gopinath, S.C. 2007. Methods developed for
SELEX. Anal. Bioanal. Chem. 387:171-182.
Selection of RNA
Aptamers
24.3.26
Supplement 88
Current Protocols in Molecular Biology
Guatelli, J., Whitfield, K., Kwoh, D., Barringer,
K.J., Richman, D., and Gingeras, T.R. 1990.
Isothermal, in vitro amplification of nucleic
acids by a multienzyme reaction modeled after retroviral replication. Proc. Natl. Acad. Sci.
U.S.A. 87:1874-1878.
Irvine, D., Tuerk, C., and Gold, L. 1991. SELEXION: Systematic evolution of ligands by exponential enrichment with integrated optimization
by non-linear analysis. J. Mol. Biol. 222:739761.
Jellinek, D., Lynott, C., Riata, D., and Janjic, N.
1993. High affinity RNA ligands to basic fibroblast growth factor inhibit receptor binding. Proc.
Natl. Acad. Sci. U.S.A. 90:11227-11231.
Jhaveri, S., Olwin, B., and Ellington, A.D. 1998. In
vitro selection of phosphorothiolated aptamers.
Bioorg. Med. Chem. Lett. 8:2285-2290.
Keene, J.D. 1996. RNA surfaces as mimetics of
proteins. Chem. Biol. 3:505-513.
Kramer, F.R., Mills, D.R., Cole, P.E., Nishihara, T.,
and Spiegelman, S. 1974. Evolution of in vitro
sequence and phenotype of a mutant RNA resistant to ethidium bromide. J. Mol. Biol. 89:719736.
Kulbachinskiy, A.V. 2007. Methods for selection of
aptamers to protein targets. Biochemistry Mosc.
72:1505-1518.
Lato, S.M., Boles, A.R., and Ellington, A.D. 1995.
In vitro selection of RNA lectins: Using combinatorial chemistry to interpret ribozyme evolution. Chem. Biol. 2:291-303.
Shamah, S.M., Healy, J.M., and Cload, S.T.
2008. Complex target SELEX. Acc. Chem. Res.
41:130-138.
Stoltenburg, R., Reinemann, C., and Strehlitz, B.
2007. SELEX: A (r)evolutionary method to generate high-affinity nucleic acid ligands. Biomol.
Eng. 24:381-403.
Tuerk, C. and Gold, L. 1990. Systematic evolution of ligands by exponential enrichment: RNA
ligands to bacteriophage T4 DNA polymerase.
Science 249:505-510.
Uphoff, K., Bell, S., and Ellington, A.D. 1996. In
vitro selection of aptamers: The dearth of pure
reason. Curr. Opin. Struct. Biol. 6:281-288.
Wlotzka, B. and McCaskill, J.S. 1997. A molecular
predator and its prey: Coupled isothermal amplification of nucleic acids. Chem. Biol. 4:2533.
Wright, C. and Joyce, G.F. 1997. Continuous in
vitro evolution of catalytic function. Science
276:614-617.
Zichi, D., Eaton, B., Singer, B., and Gold, L. 2008.
Proteomics and diagnostics: Let’s get specific,
again. Curr. Opin. Chem. Biol. 12:78-85.
Key References
Conrad et al., 1996. See above.
Conrad, R.C., Bruck, F.M., Bell, S., and Ellington,
A.D. 1998. In vitro selection of nucleic acid
ligands. In Nucleic Acid-Protein Interactions: A
Practical Approach (W.J. Christopher, ed.) pp.
285-315. Oxford University Press, New York.
Lehman, N. and Joyce, G.F. 1993. Evolution in vitro
of an RNA enzyme with altered metal dependence. Nature 361:182-185.
Gopinath, 2007. See above.
Levisohn, R. and Spiegelman, S. 1969. Further extracellular Darwinian experiments with replicating RNA molecules: Diverse variants isolated
under different selective conditions. Proc. Natl.
Acad. Sci. U.S.A. 63:805-811.
Fickert, H., Betat, H., and Hahn, U. 2004. Selection of Aptamers. In Evolutionary Methods in
Biotechnology: Clever Tricks for Directed Evolution (S. Brakmann and A. Schwienhorst, eds.)
pp. 65-86. Wiley-VCH, Weinheim, Germany.
Mills, D.R., Peterson, R.L., and Spiegelman, S.
1967. An extracellular Darwinian experiment
with a self-duplicating nucleic acid molecule.
Proc. Natl. Acad. Sci. U.S.A. 58:217-224.
Stoltenburg et al., 2007. See above.
The above papers also describe protocols for the
selection of aptamers via both filter immobilization
and other separation methods.
Kulbachinskiy, 2007. See above.
Generation and
Use of
Combinatorial
Libraries
24.3.27
Current Protocols in Molecular Biology
Supplement 88
Peptide Aptamers: Dominant “Genetic”
Agents for Forward and Reverse Analysis of
Cellular Processes
UNIT 24.4
Peptide aptamers are a new class of dominant “genetic” agents that facilitate the analysis
of cellular processes in diploid and genetically intractable organisms. They are defined
as protein-based recognition agents that consist of a constrained combinatorial peptide
library displayed on the surface of a scaffold protein. Peptide aptamers function in trans,
interacting with and inactivating gene products without mutating the DNA that encodes
them. Combinatorial libraries of peptide aptamers contain aptamers that, in principle, can
interact with almost any gene product.
The dominant combinatorial nature of peptide aptamers makes them useful as genetic
agents for the reverse and forward analysis of cellular processes. Reverse analysis with
peptide aptamers involves isolating aptamers that interact with a specific protein and
monitoring the resulting aptamer-induced phenotype. A two-hybrid system is used to
screen combinatorial libraries of peptide aptamers for those aptamers that interact with a
specific protein. The isolated aptamers are then expressed within an organism to identify
the aptamer-induced phenotype. Forward analysis with peptide aptamers involves expressing combinatorial libraries of aptamers within an organism and screening for
aptamer-induced variations in their phenotypes. The specific protein(s) targeted by the
aptamers are identified using a two-hybrid system.
This unit describes methods to construct and use thioredoxin peptide aptamers as genetic
agents for the analysis of cellular processes. The interaction trap two-hybrid system (UNIT
20.1) is used to isolate peptide aptamers that interact with specific proteins (reverse
analysis) and to identify the proteins targeted by aptamers (forward analysis).
Basic Protocol 1 describes the construction of a combinatorial library of thioredoxin
peptide aptamers. The peptide aptamers consist of a conformationally constrained
twenty–amino acid peptide displayed from the active site of thioredoxin. The peptide
aptamers are subcloned into one of the pJM yeast expression vectors shown in Figure
24.4.1, depending on whether they are used for reverse or forward analysis.
Basic Protocol 2 describes a yeast-based in vivo screening method to obtain peptide
aptamers for reverse analysis of cellular processes. Combinatorial libraries of peptide
aptamers are screened for interactions with a specific protein using the interaction trap
two-hybrid system (UNIT 20.1). The peptide aptamer is expressed as a fusion to a transcription activation domain, referred to as the “prey.” The target protein is expressed as a fusion
to a LexA DNA binding domain, referred to as the “bait.” DNA-binding sites for the LexA
fusion protein are located upstream of the two reporter genes, Leu2 (CD8) and lacZ.
Interaction between a peptide aptamer prey and the bait protein are detected by activation
of these reporter genes.
Basic Protocol 3 describes the use of the yeast mating interaction assay to evaluate the
specificity of peptide aptamers. Haploid yeast exist in two mating types (a or α), where
opposite mating types can mate to form diploids (a/α). The mating interaction assay
detects aptamer/protein interactions by generating panels of aptamer preys in one mating
type and panels of target bait proteins in the opposite mating type. Mating of the haploid
strains forms diploid strains that carry both the bait and prey. Interactions between baits
and preys are detected using the interaction trap reporters. The mating interaction assay
Contributed by C. Ronald Geyer
Current Protocols in Molecular Biology (2000) 24.4.1-24.4.25
Copyright © 2000 by John Wiley & Sons, Inc.
Generation and
Use of
Combinatorial
Libraries
24.4.1
Supplement 52
allows aptamer specificity to be assessed against large arrays of different but related
proteins and against mutants of the same protein.
Basic Protocol 4 describes an affinity maturation strategy for enhancing the affinity of
peptide aptamers to their target proteins. PCR mutagenesis is used to introduce random
mutations into the variable region of a peptide aptamer. Peptide aptamers with enhanced
affinity are isolated using a modified version of the interaction trap that contains a more
TRP1
AmpR
2 µm ori
pJG4-4
pUC ori
PGAL1
TADH1
pJG4-5
pGAL1
nuclear
localization
HA epitope
tag
activation
domain
TADH1
pJM-1
pGAL1
activation
domain
nuclear
localization
HA epitope
tag
TrxA
TADH1
pJM-2
pGAL1
HA epitope
tag
TrxA
TADH1
pJM-3
pGAL1
Peptide Aptamers
nuclear
localization
HA epitope
tag
TrxA
TADH1
Figure 24.4.1 Expression vectors for interaction trap and genetic selection. pJG4-5 is the prey
vector used in the interaction trap (UNIT 20.1). pJM-1 is the peptide aptamer prey vector. pJM-2 and
pJM-3 are used in yeast genetic selections. These yeast-E. coli shuttle vectors are derivatives of
pJG4-4 (Gyuris et al., 1993), and contain one of the following expression cassettes. pJG4-5: yeast
GAL1 promoter (PGAL1), SV40 nuclear localization signal, B42 activation domain, haemagglutinnin
epitope tag, EcoRI and XhoI cloning site, and yeast ADH1 transcription terminator (TADH1) (Gyuris
et al., 1993). See Figure 20.1.3 for a more detailed map of pJG4-5. pJM-1: PGAL1, SV40 nuclear
localization signal, B42 activation domain, haemagglutinnin epitope tag, E. coli thioredoxin (TrxA),
and TADH1 (Colas et al., 1996). pJM-2: PGAL1, haemagglutinnin epitope tag, TrxA, and TADH1 (Geyer
et al., 1999). pJM-3: PGAL1, SV40 nuclear localization signal, haemagglutinnin epitope tag, TrxA,
and TADH1 (Geyer et al., 1999).
24.4.2
Supplement 52
Current Protocols in Molecular Biology
stringent lacZ reporter. The stringency of the lacZ is increased by reducing the number
of LexA operators upstream of the lacZ reporter gene.
Basic Protocol 5 describes a method to use peptide aptamers for the forward analysis of
cellular processes. Combinatorial libraries of peptide aptamers are used as dominant
genetic agents that randomly inhibit gene function. Forward analysis involves: (1)
expressing combinatorial libraries of peptide aptamers in organisms, (2) isolating organisms that display aptamer-induced phenotypes, and (3) identifying peptide aptamer targets
using the interaction trap.
CONSTRUCTION OF A COMBINATORIAL THIOREDOXIN PEPTIDE
APTAMER LIBRARY
BASIC
PROTOCOL 1
Combinatorial libraries of peptide aptamers are constructed by inserting a random
twenty–amino acid peptide into the short disulfide-constrained loop (-CGPC-) in the
active site of E. coli thioredoxin. The active site loop contains a unique RsrII restriction
site that allows the insertion of AvaII-cut DNA, which encodes for random amino acids.
Random peptide libraries are constructed using twenty repeats of the codon NNK, where
N is A, G, C, or T and K is G or C. Using G or C in the third position of the codon reduces
the number of stop codons while maintaining codons for all twenty amino acids.
Depending on the application, the random peptide libraries are subcloned into one of the
pJM yeast expression vectors shown in Figure 24.4.1. pJM-1 is used in the interaction
trap to generate peptide aptamers against specific proteins. pJM-2 and pJM-3 are used in
genetic selections to produce aptamers that alter an organism’s phenotype. All of the pJM
vectors use the gal1 promoter to control the expression of the peptide aptamers. The gal1
promoter induces aptamer expression in the presence of galactose and represses expression in the presence of glucose. The resulting aptamer/thioredoxin vector is transformed
into E. coli by electroporation (also see UNIT 9.3 for electroporation techniques).
Materials
5 U/µl Klenow DNA polymerase and 10× reaction buffer (New England Biolabs)
5 mM 4dNTP mixture: 5 mM each dTTP, dATP, dGTP, and dCTP
10 U/µl AvaII and 2 U/µl RsrII restriction enzymes and 10× reaction buffers (New
England Biolabs)
10 mM Tris⋅Cl, pH 8 (APPENDIX 2)
Nondenaturing loading buffer (see recipe)
DNA elution buffer (see recipe)
Thioredoxin expression vector plasmid: pJM-1, pJM-2, or pJM-3 (Fig. 24.4.1)
10 U/µl calf intestinal alkaline phosphatase (CIP) and 10× reaction buffer (New
England Biolabs)
2000 U/µl T4 DNA ligase and 10× reaction buffer (New England Biolabs)
QIAquick gel extraction kit (Qiagen)
Ultrapure water (sterile water for irrigation preferred; Fisher Scientific)
E. coli MC 1061 (Bio-Rad), electroporation competent (UNIT 9.3)
SOC medium (UNIT 1.8), prewarmed to 37°C
LB plates and liquid medium (UNIT 1.1) containing 50 µg/ml ampicillin
Large-scale plasmid preparation kit (various commercial sources, e.g., Qiagen;
optional)
DNA synthesizer
16° and 95°C water baths
PCR purification column (e.g., Qiagen; optional)
Electroporator (e.g., Bio-Rad Gene Pulser) with 0.2-cm-gap electroporation cells
Generation and
Use of
Combinatorial
Libraries
24.4.3
Current Protocols in Molecular Biology
Supplement 52
Additional reagents and equipment for DNA synthesis; phenol/chloroform
extraction and ethanol precipitation (UNIT 2.1A); polyacrylamide gel
electrophoresis (PAGE; UNIT 2.7); UV shadowing and elution of DNA (UNIT 2.7);
UV spectroscopy (APPENDIX 3D) or ethidium bromide dot quantitation (UNIT 2.6);
bacterial transformation (UNIT 1.8); and ethidium bromide/cesium chloride
gradients (optional; UNIT 2.4)
NOTE: Activity units of enzymes are described for enzymes obtained from New England
Biolabs. Other commercial sources can be used, but units should be confirmed.
Prepare random peptide DNA cassette
1. Prepare the following 91-base random oligonucleotide and 17-base primer using an
automated DNA synthesizer. Dissolve oligonucleotides separately in water to a final
concentration of 1 µg/µl.
Oligonucleotide: 5′-GACTGACTGGTCCG(NNK)20GGTCCTCAGTCAGTCAG3′, where N is A, G, C, or T and K is G or C.
Primer: 5′-CTGACTGACTGAGGACC-3′.
2. Add the following (in order) to a 1.5-ml microcentrifuge tube (final 890 µl):
200 µg primer (10-fold excess)
100 µg random oligonucleotide
490 µl water
100 µl 10× Klenow polymerase reaction buffer.
3. Anneal primer to random oligonucleotide by heating sample to 95°C in a water bath
for 5 min. Slowly cool to room temperature (∼30 min).
4. Add 90 µl of 5 mM 4dNTP mixture and 20 µl (100 U) Klenow polymerase and
incubate 3 hr at 37°C.
5. Phenol/chloroform extract the mixture (UNIT 2.1A) and ethanol precipitate the DNA
(UNIT 2.1A).
6. Dissolve DNA pellet in 0.8 ml water.
7. Add 100 µl of 10× AvaII reaction buffer and 100 µl (1000 U) AvaII. Incubate 4 hr at
37°C.
8. Repeat step 5.
9. Dissolve DNA pellet in 150 µl of 10 mM Tris⋅Cl, pH 8, and add 50 µl vol
nondenaturing loading buffer.
10. Separate DNA on a preparative 10% nondenaturing polyacrylamide gel (UNIT 2.7).
11. Locate the DNA band in the gel by UV shadowing (UNIT 2.7) and cut out the DNA
band.
12. Elute DNA from the gel by shaking in DNA elution buffer overnight (UNIT 2.7).
13. Ethanol precipitate the DNA and dissolve in 200 µl of 10 mM Tris⋅Cl, pH 8.
Determine DNA concentration by UV spectroscopy (APPENDIX 3D), or estimate DNA
concentration using ethidium bromide dot quantitation (UNIT 2.6).
Prepare thioredoxin expression vector
14. Choose one of the thioredoxin expression vectors (pJM) in Figure 24.4.1 and add 12
µg of the chosen vector to 420 µl sterile water.
Peptide Aptamers
24.4.4
Supplement 52
Current Protocols in Molecular Biology
15. Add 50 µl of 10× RsrII reaction buffer and 30 µl (60 U) RsrII. Incubate overnight at
37°C.
16. Dephosphorylate RsrII-cut pJM vector by adding 10 µl (100 U) CIP and incubating
1 hr at 37°C.
17. Purify dephosphorylated, RsrII-cut pJM vector using a commercially available PCR
purification column or by phenol/chloroform extraction.
Ligate random peptide cassette in thioredoxin expression vector
18. Combine 8 µg DNA cassette (step 13) and 12 µg vector (step 17) in water to a total
volume of 860 µl.
19. Add 100 µl of 10× T4 DNA ligase reaction buffer and 40 µl (80,000 U) T4 DNA
ligase. Incubate 16 hr at 16°C.
20. Purify ligated DNA using a QIAquick gel extraction kit according to manufacturer’s
instructions. Elute DNA from the column using 30 µl ultrapure water.
It is important to remove as much salt, buffer, and protein from the ligated DNA as possible
prior to electroporation.
Electroporate ligated DNA
21. Thaw 350 µl electroporation-competent E. coli MC1061 on ice and add 30 µl purified
ligated plasmid. Transfer mixture to a 0.2-cm-gap electroporation cell.
22. Electroporate using the following conditions: 2.5 kV, 200 Ω, and 25 µF.
23. Recover cells in 25 ml prewarmed SOC medium and incubate 1.5 hr at 37°C with
gentle rocking.
24. Determine transformation efficiency by plating serial dilutions on LB plates containing 50 µg/ml ampicillin.
25. Transfer remaining cells to 1 liter LB liquid medium containing 50 µg/ml ampicillin
and incubate overnight at 37°C.
26. Purify plasmid DNA using a commercially available large-scale plasmid preparation
kit or using successive ethidium bromide/CsCl gradients (UNIT 2.4). Determine concentration and bring to 40 µg/ml for screening (Basic Protocol 2).
ISOLATION OF PEPTIDE APTAMERS FOR SPECIFIC PROTEINS USING
THE INTERACTION TRAP TWO-HYBRID SYSTEM
The interaction trap two-hybrid system (Gyuris et al., 1993; UNIT 20.1) is an established
method for screening proteins for interactions with genomic and cDNA libraries (reviewed by Bai and Elledge, 1996; Finley and Brent, 1997). The interaction trap can also
be extended to screen combinatorial libraries of peptide aptamers for interactions with
specific proteins (Yang et al., 1995; Colas et al., 1996). The interaction trap consists of
the following parts: (1) a constitutively expressed target protein fused to a LexA DNAbinding domain, referred to as the “bait;” (2) a galactose-induced combinatorial library
of thioredoxin peptide aptamers fused to an activation domain, referred to as the “prey;”
and (3) LexA-operator-leu2 and LexA-operator-lacZ reporter genes for detecting interactions between the peptide aptamer prey and target protein bait. The bait protein binds to
the LexA operators upstream of the reporters, but does not activate transcription of the
reporters. Interaction between a peptide aptamer prey and target protein bait is detected
by activation of reporter genes in the presence of galactose and not in the presence of
BASIC
PROTOCOL 2
Generation and
Use of
Combinatorial
Libraries
24.4.5
Current Protocols in Molecular Biology
Supplement 52
glucose. Figure 20.1.2 illustrates the isolation of proteins that interact with specific targets
using the interaction trap.
In the first part of this protocol, the bait plasmid (pBait) is constructed by inserting DNA
that encodes for the target protein into the polylinker of pEG202, in frame with LexA. The
chimeric LexA-bait fusion protein is constitutively expressed using the ADH1 promoter.
It is transformed into the appropriate yeast strain (EGY48) by a standard lithium acetate
transformation procedure (UNIT 13.7). To be useful in the interaction trap two-hybrid
system, the bait proteins must enter the nucleus, bind to the LexA operators, and not
self-activate the leu2 and lacZ reporters. After construction, pBait is characterized using
protocols described elsewhere (UNIT 20.1).
The pJM-1 peptide aptamer library is used to select aptamers that bind specific protein
targets using the interaction trap. pJM-1 contains a thioredoxin aptamer fused to a nuclear
localization signal, a transcription activation domain, and an epitope tag under the control
of the gal1 promoter. Peptide aptamer expression is induced in the presence of galactose
and repressed in the presence of glucose. A high-efficiency lithium acetate transformation
procedure (Gietz and Schiestl, 1995; outlined below) is used rather than the standard
procedure (UNIT 13.7) to introduce the aptamer library into the yeast strain EGY48, which
contains an integrated LexA–operator-leu2 reporter gene, LexA-operator-lacZ reporter
plasmid and a bait plasmid. Interactions between the bait protein and the peptide aptamer
prey are initially detected on galactose plates that lack leucine. Galactose induces the
expression of the peptide aptamer and the absence of leucine selects for peptide aptamer/bait protein interactions that activate the leu2 reporter. Interactions are verified by
subsequently testing for galactose-dependent growth on −Leu plates and galactose-dependent blue color on Xgal plates.
The lithium acetate transformation procedure used here typically yields 105 to 106
transformants per µg of plasmid DNA. The protocol should be optimized for individual
strains to achieve maximum transformation efficiency. In particular, variables such as cell
concentration and heat shock time need to be optimized. The highest transformation
efficiencies are obtained with 1 µg plasmid DNA per 50 µl competent yeast cells and
generally do not scale up with similar efficiencies. The protocol below is designed for the
transformation of 50 µg of peptide aptamer library.
Materials
DNA encoding bait protein of interest
Plasmid DNA: pEG202 (Fig. 20.1.3), pSH18-34 (Fig. 24.4.2)
Yeast strain: EGY48 ura3 trp1 his3 3LexA-operator-leu2
Complete minimal (CM) dropout medium (UNIT 13.1) and plates supplemented with
either 2% (w/v) glucose (Glu) or 2% (w/v) galactose and 1% (w/v) raffinose
(Gal/Raf):
Glu/CM −His,−Ura (10-cm plates and liquid medium)
Glu/CM −His,−Ura,−Trp (10- and 15-cm plates)
Glu/CM −His,−Ura,−Trp,−Leu (10-cm plates)
Gal/Raf/CM −His,−Ura,−Trp (liquid medium)
Gal/Raf/CM −His,−Ura,−Trp,−Leu (10- and 15-cm plates)
100 mM and 1 M lithium acetate, pH 7.5, filter sterilized
50% (w/v) polyethylene glycol, mol. wt. 3350 (PEG 3350; Sigma)
2 mg/ml single-stranded carrier DNA (sodium salt Type III from salmon testes;
Sigma) TE buffer (APPENDIX 2)
40 µg/ml peptide aptamer library DNA (pJM-1 aptamer plasmid; see Basic
Protocol 1)
Peptide Aptamers
24.4.6
Supplement 52
Current Protocols in Molecular Biology
2× glycerol storage solution: 65% (v/v) glycerol, 0.1 M MgSO4, 25 mM Tris⋅Cl,
pH 7.4 (APPENDIX 2)
10-cm Xgal plates (UNIT 13.1)
Glu/CM −His,−Ura,−Trp, Xgal
Gal/Raf/CM −His,−Ura,−Trp, Xgal
PCR primers for thioredoxin
30° and 42°C incubators or water baths
Additional reagents and equipment for subcloning DNA (UNIT 3.16); manipulating
yeast (UNIT 13.2); lithium acetate yeast transformation (UNIT 13.7); characterizing
bait plasmids (UNIT 20.1); determination of cell density (UNIT 13.2) and plating
efficiency (UNIT 20.1); replica plating (UNITS 1.3 & 13.2); yeast plasmid preparation
(UNIT 13.11); plasmid sequencing (UNIT 7.3); E. coli transformation (UNIT 1.8);
agarose gel electrophoresis (UNIT 2.5A); and PCR (UNIT 15.1)
Construct bait plasmid (pBait)
1. Using standard subcloning techniques (UNIT 3.16), insert DNA that codes for the bait
protein into the polylinker of pEG202 to create the bait plasmid (pBait).
2. Transform pBait and pSH18-34 (lacZ reporter) into the interaction trap selection
strain (EGY48) by lithium acetate yeast transformation (UNIT 13.7).
3. Plate transformants on Glu/CM −His,−Ura plates and place in a 30°C incubator.
Characterize bait protein
4. Confirm that the bait protein does not self-activate the reporter genes by performing
plate assays for lacZ activation and leucine requirement (UNIT 20.1).
If the bait protein activates the leu2 and/or lacZ reporter genes, variations of the interaction
trap that reduce reporter sensitivity should be tried. Yeast strains and/or plasmids containing less-sensitive leu2 and lacZ reporters reduce the background reporter output to
reasonable levels. Yeast strains (Table 20.1.2) and plasmids (Fig. 24.4.2) with less sensitive
reporters are described in UNIT 20.1. Truncating or separating the protein target can also
eliminate transcription self-activation.
5. Confirm bait protein synthesis using the repression assay described in UNIT 20.1.
Baits that do not repress the expression of β–galactosidase in the repression assay may not
be expressed correctly or may be incapable of entering the nucleus. Expression of
full-length baits can be verified by immunoblotting. If full-length baits are expressed, their
entry into the nucleus can be facilitated by adding a nuclear localization signal (J. Kamens,
unpub. observ.). See Table 20.1.1 for description of plasmid pJK202 (a bait vector that
contains a nuclear localization signal).
Transform peptide aptamer library into pBait-containing yeast
6. Inoculate 20 ml Glu/CM −His,−Ura liquid medium with transformed EGY48 (step
3) and incubate overnight at 30°C with shaking.
7. Take an OD600 measurement and dilute to a concentration of 5 × 10⁶ cells/ml in 250
ml Glu/CM −His,−Ura.
An OD600 of 0.1 corresponds to ∼3 × 10⁶ cells/ml. This value should be confirmed for each
yeast strain used (UNIT 13.2).
8. Incubate cells at 30°C with shaking until they reach an OD600 of 0.6 to 0.8 (∼5 to 6
hr).
This will yield enough yeast for 50 transformations.
Generation and
Use of
Combinatorial
Libraries
24.4.7
Current Protocols in Molecular Biology
Supplement 52
AmpR
pRB ori
2 µm ori
LacZ
Reporters
GAL1-lacZ
URA3
PGAL1
lexA8op
GAL1-lacZ
pSH18-34
lexA2op
GAL1-lacZ
pJK103
lexA1op
GAL1-lacZ
pRB1840
Figure 24.4.2 lacZ reporter plasmids. The lacZ reporter plasmids are derived from a plasmid that
contains a wild-type GAL1 promoter fused to the lacZ gene (Yocum et al., 1984). lacZ reporters
with different sensitivities are constructed by inserting different numbers of lexA operators into a
plasmid (pLR1∆1) that has the GAL1 upstream activating sequences (UASG) deleted (West et al.,
1984). The lacZ reporters pSH18-34 (Gyuris et al., 1993), pJK103 (Kamens and Brent, 1991), and
pRB1840 (Brent and Ptashne, 1985) contain eight, two, or one lexA operator(s). The sensitivity of
the lacZ reporter decreases with the number of lexA operators.
9. Divide culture into five 50-ml conical centrifuge tubes and centrifuge 5 min at 3000
× g, room temperature.
10. Decant supernatant and resuspend each yeast pellet in 25 ml sterile water. Repeat
centrifugation.
11. Decant supernatant and resuspend each yeast pellet in 1 ml of 100 mM lithium acetate.
Transfer to a 1.5-ml microcentrifuge tube and pellet yeast by centrifuging 15 sec at
20,800 × g, room temperature.
12. Remove supernatant with a pipet and resuspend each yeast pellet in 350 µl of 100
mM lithium acetate (final volume ∼500 µl).
13. Split the contents of each tube into ten 50-µl portions and pellet yeast by centrifuging
15 sec at 20,800 × g, room temperature.
Peptide Aptamers
24.4.8
Supplement 52
Current Protocols in Molecular Biology
14. Remove supernatant with a pipet and add the following ingredients to each sample
in the order listed:
240 µl 50% (w/v) PEG 3350
36 µl 1 M lithium acetate
50 µl 2 mg/ml single-stranded carrier DNA (100 µg)
25 µl 40 µg/ml peptide aptamer library DNA (1 µg).
Single-strand carrier DNA needs to be heated to 95°C for 5 min and cooled on ice prior
to use.
15. Vortex the transformation mixture vigorously until the yeast pellet is completely
resuspended and incubate 30 min at 30°C.
16. Heat shock 20 min at 42°C.
17. Pellet yeast by centrifuging 15 sec at 20,800 × g, room temperature.
18. Remove supernatant with a pipet and resuspend pellet in 500 µl sterile water.
19. Plate 48 transformations on individual 15-cm Glu/CM −His,−Ura,−Trp plates.
20. Plate 400 µl of the two remaining transformations on 15-cm Glu/CM −His,−Ura,−Trp
plates.
21. Use the remaining 100 µl to determine the transformation efficiency. Perform a series
of 10-fold dilutions in sterile water and plate on 10-cm Glu/CM −His,−Ura,−Trp
plates.
22. Incubate 2 to 3 days at 30°C (until colonies are ∼1 mm in diameter).
Pool transformants
23. Pool yeast from all 50 transformation plates (steps 19 and 20) in a 50-ml centrifuge
tube.
See UNIT 20.1 for protocol on scraping yeast from plates.
24. Add an equal volume of 2× glycerol storage solution to the pooled yeast cells. Divide
into 1-ml aliquots and store at −70°C.
25. Determine the plating efficiency of the frozen aliquots as described in UNIT 20.1.
Screen for peptide aptamers that interact with target protein
26. Inoculate ten library equivalents of the peptide aptamer library in 2 ml Gal/Raf/CM
−His,−Ura,−Trp liquid medium. Incubate 4 hr at 30°C with shaking.
One library equivalent equals the total number of yeast transformants containing the
peptide aptamer library, as determined in step 21.
27. Centrifuge 4 min at 3000 × g, room temperature.
28. Remove supernatant with a pipet and resuspend yeast in 1 ml sterile water.
29. Spread yeast at a density of 106 yeast cells/plate on 15-cm Gal/Raf/CM −His, −Ura,
−Trp, −Leu plates.
30. Incubate at 30°C and monitor plates daily for growth.
31. Streak colonies onto 10-cm Glu/CM −His,−Ura,−Trp master plates. Incubate 1 to 2
days at 30°C.
Generation and
Use of
Combinatorial
Libraries
24.4.9
Current Protocols in Molecular Biology
Supplement 52
32. Replica plate the master plates on the following indicator plates:
Glu/CM −His,−Ura,−Trp,−Leu
Gal/Raf/CM −His,−Ura,−Trp,−Leu
Glu/CM −His,−Ura,−Trp, Xgal
Gal/Raf/CM −His,−Ura,−Trp, Xgal.
33. Identify colonies that show galactose-dependent growth on −Leu plates and galactose-dependent blue color on Xgal plates.
Isolate peptide aptamers
34. Isolate the desired peptide aptamer expression plasmid (UNIT 13.11).
The plasmid preparation will contain a mixture of the three plasmids used in the interaction
trap (pJM-1 aptamer plasmid, pSH18-34, and pBait).
35. Use plasmids as templates for sequencing the peptide aptamer variable regions (UNIT
7.3).
36. To separate the aptamer plasmid from pBait and pSH18-34, transform E. coli (UNIT
1.8) and identify the appropriate transformants by PCR (UNIT 15.1) using primers that
amplify thioredoxin.
Colonies that contain the peptide aptamer will appear as a bright band on an ethidium
bromide agarose gel (UNIT 2.5A) after 20 cycles of PCR. Colonies that do not contain the
peptide aptamer will appear as a faint band that is 20 base pairs shorter than the aptamer.
This shorter band is due to the presence of native E. coli thioredoxin.
BASIC
PROTOCOL 3
Peptide Aptamers
DEFINING RECOGNITION SPECIFICITY WITH INTERACTION MATING
Interaction mating is a variation of the interaction trap. It allows interactions between
large panels of proteins to be analyzed (Finley and Brent, 1994). Haploid yeast exist in
one of two mating types (a or α). Haploid yeast that contain protein targets or related
protein baits in one mating type and peptide aptamer preys in the opposite mating type
can mate to form diploids that carry both the aptamers and their targets or related proteins.
Interaction between the peptide aptamer prey and protein target bait is detected by the
activation of two reporter genes: LexAop-LEU2 and LexAop-LacZ. Using the mating
interaction assay, panels of related or mutated proteins can be assayed simultaneously for
interactions with panels of peptide aptamers. See Figure 24.4.3 for schematic of the
interaction mating assay.
Materials
Plasmid DNA: pBait(s) (see Basic Protocol 2), peptide aptamer preys (see Basic
Protocol 2), pEG202 (Fig. 20.1.3), pJG4-5 (Fig. 24.4.1), pSH18-34 (Fig. 24.4.2)
Yeast strains:
EGY42: Matα ura3 trp1 his3 leu2
EGY48: Mata ura3 trp1 his3 3LexA-operator-leu2)
10-cm complete minimal (CM) dropout plates (UNIT 13.1) supplemented with either
2% (w/v) glucose (Glu) or 2% (w/v) galactose and 1% (w/v) raffinose
(Gal/Raf):
Glu/CM −Trp
Glu/CM −His,−Ura
Glu/CM −His,−Ura,−Trp,−Leu
Gal/Raf/CM −His,−Ura,−Trp,−Leu
YPD plates (UNIT 13.1)
Xgal plates (UNIT 13.1):
Glu/CM −His,−Ura,−Trp, Xgal
Gal/Raf/CM −His,−Ura,−Trp, Xgal.
24.4.10
Supplement 52
Current Protocols in Molecular Biology
30°C incubator
Additional reagents and equipment for lithium acetate yeast transformation (UNIT
13.7) and replica plating (UNITS 1.3 & 13.2)
1. Transform individual peptide aptamer prey plasmids and a control plasmid (pJG4-5)
into EGY48 (Matα) using lithium acetate transformation (UNIT 13.7). Select transformants on 10-cm Glu/CM −Trp plates.
peptide aptamer preys
in EGY48 (Matα)
target baits
in EGY42 (Mata)
replica
plate
mate on YPD
(a/α diploid)
replica plate on
indicator plates
Gal/Raf/CM -His, -Ura, -Trp, -Leu
Gal/Raf/CM -His, -Ura, -Trp, Xgal
Figure 24.4.3 Mating interaction assay (Finley and Brent, 1994). Peptide aptamer preys in the
yeast strain EGY48 (Mata) are streaked vertically on Glu/CM −Trp plates. Target protein baits and
lacZ reporter (pSH18-34) in the yeast strain EGY42 (Matα) are streaked horizontally on Glu/CM
−His,−Ura plates. The yeast strains are replica plated perpendicular to each other on YPD plates.
The haploid strains carrying the baits and preys mate where the two strains intersect, forming (a/α)
diploids that contain the bait, prey, and lacZ reporter. The YPD plates are replica plated onto the
following interaction detection plates: Glu/CM −His,−Ura,−Trp,−Leu; Gal/Raf/CM −His,−Ura,−Trp,−
Leu; Glu/CM −His,−Ura,−Trp, Xgal; Gal/Raf/CM −His,−Ura,−Trp, Xgal. Interacting baits and prey
display galactose-dependent growth and blue color on −Leu and Xgal plates, respectively.
Generation and
Use of
Combinatorial
Libraries
24.4.11
Current Protocols in Molecular Biology
Supplement 52
2. Transform individual target protein baits (pBaits) with pSH18-34 (lacZ reporter) and
a control plasmid (pEG202) with pSH18-34 into EGY42 (Mata). Select transformants on 10-cm Glu/CM −His,−Ura plates.
3. Streak, in parallel lines, individual peptide aptamers and their control prey strains on
10-cm Glu/CM −Trp plates.
4. Streak, in parallel lines, individual protein targets and their control bait strains on
10-cm Glu/CM −His,−Ura plates.
5. Incubate all plates overnight at 30°C.
6. Replica plate the protein target bait and peptide aptamer prey strains on the same
replica velvet by first replica plating the bait strains and then replica plating the prey
strains perpendicular to the baits (see Figure 24.4.3 for schematic).
7. Transfer the yeast imprint to a 10-cm YPD plate and incubate overnight at 30°C.
8. Replica plate the YPD plate onto a replica velvet. Transfer the yeast imprint to the
following indicator plates:
Glu/CM −His,−Ura,−Trp,−Leu
Gal/Raf/CM −His,−Ura,−Trp,−Leu
Glu/CM −His,−Ura,−Trp, Xgal
Gal/Raf/CM −His,−Ura,−Trp, Xgal.
9. Analyze plates for mating.
Mating occurs at the intersection of the Matα and Mata strains. Diploid colonies should
grow on the Xgal plates. Interactions between the peptide aptamer preys and protein target
baits produce blue color on the galactose Xgal plates and growth on the galactose –Leu
plates at the intersection of the strains.
BASIC
PROTOCOL 4
Peptide Aptamers
AFFINITY MATURATION OF PEPTIDE APTAMERS
The binding affinity between a peptide aptamer and its protein target can be improved by
mutating the peptide aptamer variable region and reselecting for aptamers that bind the
target protein using a more stringent interaction trap. In this protocol, peptide aptamers
are mutated by random PCR mutagenesis as described by Cadwell and Joyce, 1994.
Alternatively, degenerate oligonucleotides that code for the variable region and have
varying degrees of randomness can be synthesized using an automated DNA synthesizer
(UNIT 2.11). The stringency of the interaction trap selection is enhanced by decreasing the
number of LexA operators upstream of the lacZ reporter gene. A series of lacZ reporter
genes containing eight, two, and one LexA operator(s) (Brent and Ptashne, 1985) are used
to select aptamers with increased affinity toward their targets.
Materials
5 U/µl Taq polymerase and 10× buffer (Life Technologies)
1 M MgCl2
100 mM dATP
100 mM dGTP
100 mM dCTP
100 mM dTTP
20 µM primer 1: 5′-CCGCCGCCTGAATTCATGAGCGATAAAATTATTCAC-3′
20 µM primer 2: 5′-CGGGGCGATCATTTTGCACGGACC-3′
Plasmid DNA: peptide aptamer plasmid (see Basic Protocol 2), pBait (see Basic
Protocol 2), pJM-1 (Fig. 24.4.1), pRB1840 (1-LexAop-LacZ reporter plasmid;
Fig. 24.4.2), and pJK103 (Fig. 24.4.2)
24.4.12
Supplement 52
Current Protocols in Molecular Biology
Mg2+/Mn2+ solution: 45 mM MgCl2 and 5 mM MnCl2
PCR purification column (optional; e.g., Qiagen)
Yeast strain: EGY48 Mata ura3 trp1 his3 3LexA-operator-leu2
Complete minimal (CM) dropout medium (UNIT 13.1) and plates supplemented with
either 2% (w/v) glucose (Glu) or 2% (w/v) galactose and 1% (w/v) raffinose
(Gal/Raf):
Glu/CM −His,−Ura (10-cm plates)
Glu/CM −His,−Ura,−Trp (10-cm plates)
Gal/Raf/CM −Ura,−His,−Trp (liquid medium)
Xgal plates (UNIT 13.1)
Glu/CM −His,−Ura,−Trp, Xgal (10-cm plates)
Gal/Raf/CM −His,−Ura,−Trp, Xgal (10- and 15-cm plates)
PCR tubes
Automated thermal cycler
30°C incubator
Additional reagents and equipment for agarose gel electrophoresis (optional; UNIT
2.5A), digesting and cloning peptide aptamer mutants (see Basic Protocol 1),
lithium acetate yeast transformation (see Basic Protocol 2 and UNIT 13.7),
determination of plating efficiency (UNIT 20.1), plasmid rescue (UNIT 13.11), and
plasmid DNA sequencing (UNIT 7.3)
Mutagenize peptide aptamer variable region
1. Prepare PCR premixture (total 3.775 ml):
500 µl 10× Taq polymerase buffer
5 µl 1 M MgCl2
10 µl 100 mM dATP
10 µl 100 mM dGTP
50 µl 100 mM dCTP
50 µl 100 mM dTTP
125 µl 20 µM primer 1
125 µl 20 µM primer 2
2.9 ml water.
2. For each sample, add the following reagents to a PCR tube:
12 µl water
1 µl peptide aptamer expression vector
10 µl Mg2+/Mn2+ solution
76 µl PCR premixture
1 µl Taq polymerase (5 U).
3. Amplify the reaction using the following PCR reaction program:
4 cycles:
30 sec
1 min
1 min
95°C
55°C
72°C
(denaturation)
(annealing)
(extension).
4. Remove 13 µl reaction mixture and add to a new PCR tube containing:
10 µl Mg2+/Mn2+ solution
76 µl PCR premixture
1 µl Taq polymerase.
Amplify using the same PCR program.
5. Repeat for a total of ten rounds of amplification.
Generation and
Use of
Combinatorial
Libraries
24.4.13
Current Protocols in Molecular Biology
Supplement 52
6. Purify the PCR product with a commercially available PCR purification column or
by agarose gel electrophoresis (UNIT 2.5A).
Construct mutagenized peptide aptamer expression vector
7. Digest purified PCR product with AvaII and subclone it into RsrII-cut pJM-1 using
standard subcloning techniques (UNIT 3.16). Electroporate the ligated product as
described above (see Basic Protocol 1, steps 20 to 26).
Select mutagenized aptamers by the interaction trap
8. Transform EGY48 with pBait and pRB1840 by standard lithium acetate yeast
transformation (UNIT 13.7). Select transformants on 10-cm Glu/CM −His,−Ura plates.
9. Using the high-efficiency lithium acetate procedure (see Basic Protocol 2, steps 6 to
22), transform 10 to 50 µg of mutagenized peptide aptamer library into EGY48
containing pBait and pRB1840. Select transformants on 10-cm Glu/CM −His,−Ura,
−Trp plates.
10. Pool transformants and determine plating efficiency as described in UNIT 20.1.
11. Inoculate approximately five library equivalents in 1 ml Gal/Raf/CM −His, −Ura,
−Trp liquid medium. Incubate 4 hr at 30°C with shaking.
One library equivalent equals the total number of yeast transformants containing the
peptide aptamer library as determined in step 9.
12. Centrifuge 4 min at 3000 × g, room temperature. Remove supernatant and resuspend
yeast pellet in 1 ml sterile water.
13. Spread yeast on 15-cm Gal/Raf/CM −His,−Ura,−Trp, Xgal plates and incubate at
30°C until colonies appear (∼2 days).
14. Streak blue colonies onto a 10-cm Glu/CM −His,−Ura,−Trp master plate and incubate
1 day at 30°C.
15. Replica plate the master plate onto 10-cm Gal/Raf/CM −His,−Ura,−Trp, Xgal and
Glu/CM −His,−Ura,−Trp, Xgal plates.
16. Rescue plasmids (UNIT 13.11) from the galactose-dependent blue colonies and reintroduce (UNIT 13.7) the plasmids into the yeast strain EGY48 that contains pBait and
pRB1840 to reconfirm the phenotype.
17. Rescue the plasmids from the galactose-dependent blue colonies and sequence (UNIT
7.3) the variable regions.
BASIC
PROTOCOL 5
FORWARD ANALYSIS OF CELLULAR PROCESSES USING PEPTIDE
APTAMERS
Combinatorial libraries of peptide aptamers can function as dominant agents for the
forward analysis of cellular processes. Peptide aptamers function as “mutagens”, randomly inhibiting gene function and altering the phenotype of an organism. Forward
analysis with peptide aptamers involves expressing combinatorial libraries in organisms
and screening or selecting for aptamer-induced changes in their phenotypes. The peptide
aptamer targets are subsequently identified using the interaction trap. The protein targets
can be identified from panels of proteins using a mating interaction assay (Finley and
Brent, 1994) or by screening for aptamer interactions against genomic or cDNA libraries
using the interaction trap (UNIT 20.1). Currently, complete panels of proteins are not
available for any organisms except yeast. As a result, panels of known proteins will need
Peptide Aptamers
24.4.14
Supplement 52
Current Protocols in Molecular Biology
to be combined with cDNA and genomic libraries of proteins to identify peptide aptamer
targets.
The design of a genetic selection is beyond the scope of this protocol. A typical genetic
selection requires the transformation of an organism selection strain with a peptide
aptamer expression library containing 106 to 107 members. Peptide aptamers are expressed under the control of an inducible promoter, allowing the aptamer-induced
phenotype to be confirmed by comparing the effects of the aptamer expression plasmid
in the presence or absence of the inducer. The protocol described below for a genetic
selection using yeast may be adapted to a variety of organisms.
Materials
Yeast strain for genetic selection
Peptide aptamer library: pJM-2 or pJM-3 (Basic Protocol 1; Fig. 24.4.1)
Complete minimal (CM) dropout liquid medium (UNIT 13.1) and plates
supplemented with either 2% (w/v) glucose (Glu) or 2% (w/v) galactose and
1% (w/v) raffinose (Gal/Raf):
Glu/CM −Trp (10-cm plates)
Gal/Raf/CM −Trp (10-cm plates and liquid medium)
30°C incubator
Additional reagents and equipment for high-efficiency lithium acetate yeast
transformation (see Basic Protocol 2), determination of plating efficiency (UNIT
20.1), isolation of plasmids (UNIT 13.11), plasmid DNA sequencing (UNIT 7.3), and
target identification (see Support Protocol)
1. Transform 50 to 100 µg of the peptide aptamer library (in pJM-2 or pJM-3) into a
yeast selection strain (106 to 107 transformants) using the high-efficiency lithium
acetate transformation procedure (see Basic Protocol 2, steps 6 to 22). Plate transformants on 10-cm Glu/CM −Trp plates and incubate at 30°C until colonies are ∼1
mm in diameter (∼2 to 3 days).
2. Pool yeast cells and determine the plating efficiency as described in UNIT 20.1.
3. Inoculate ten library equivalents in 1 ml Gal/Raf/CM −Trp liquid medium. Incubate
4 hr at 30°C with shaking.
One library equivalent equals the total number of transformants containing the peptide
aptamer library as determined in step 1.
4. Centrifuge culture 4 min at 3000 × g, room temperature. Remove supernatant with a
pipet and resuspend the yeast pellet in sterile water.
5. Plate yeast on 10-cm Gal/Raf/CM −Trp selection plates and incubate under selection
conditions.
6. Streak positive colonies on Glu/CM −Trp master plates.
7. Confirm galactose-dependent phenotype by replicating master plate onto Glu/CM
−Trp and Gal/Raf/CM −Trp plates and incubate under selection conditions.
8. Isolate peptide aptamer expression plasmids (pJM-2 or pJM-3) from the yeast
colonies that show the galactose-dependent phenotype (UNIT 13.11).
9. Reconfirm the peptide aptamer phenotype by transforming the isolated plasmid into
the selection strain and testing for galactose-dependent phenotype.
10. Isolate the peptide aptamer expression plasmids (UNIT 13.11) for sequencing (UNIT 7.3)
and target identification (see Support Protocol).
Generation and
Use of
Combinatorial
Libraries
24.4.15
Current Protocols in Molecular Biology
Supplement 52
SUPPORT
PROTOCOL
IDENTIFICATION OF PEPTIDE APTAMER TARGETS
The protein targets of the genetically selected peptide aptamers (Basic Protocol 5) can be
identified using the interaction mating assay (see Basic Protocol 3) or by interaction hunts
against cDNA or genomic libraries (UNIT 20.1). Genomic and cDNA libraries are constructed as preys since they contain many sequences capable of activating transcription
in the bait configuration. As such, the peptide aptamers need to be transferred to the bait
plasmid pEG202 to identify their targets in these libraries. Protocols for constructing
cDNA and genomic libraries can be found in UNITS 5.7, 5.8A & 5.8B.
Putative peptide aptamer targets identified with either mating interaction panels or hunts
should be verified using genetic tests such as: (1) immunoprecipitation to confirm the
aptamer interactions in vivo, (2) epistasis analysis to confirm that the aptamer functions
in the same area as the target protein, or (3) comparison of the phenotype(s) caused by
deletion and overexpression of target protein with the phenotype caused by the aptamer.
Materials
DNA encoding thioredoxin peptide aptamer (Basic Protocol 5)
Plasmid DNA: pEG202 (Fig. 20.1.3), pSH18-34 (Fig. 24.4.2), pJG4-5 (Fig. 24.4.1)
Yeast strains:
EGY42, Matα ura3 trp1 his3 leu2
EGY48, Mata ura3 trp1 his3 3LexA-operator-leu2
Complete minimal (CM) dropout liquid medium (UNIT 13.1) and plates
supplemented with either 2% (w/v) glucose (Glu) or 2% (w/v) galactose and
1% (w/v) raffinose (Gal/Raf):
Glu/CM −His,−Ura (10-cm plates)
Glu/CM −Trp (10-cm plates)
Prey library (see Table 20.1.3)
Additional reagents and equipment for PCR (UNIT 15.1), standard subcloning (UNIT
3.16), standard lithium acetate yeast transformation (UNIT 13.7), interaction mating
(see Basic Protocol 3), interaction trap (UNIT 20.1)
Transfer peptide aptamers from pJM-2 or pJM-3 into pEG202
1. PCR amplify the DNA encoding the thioredoxin peptide aptamer using primers that
contain restriction sites compatible with the polylinker of pEG202 and in frame with
LexA (Fig. 20.1.3).
2. Using standard subcloning techniques (UNIT 3.16), insert the PCR product into pEG202
to create the peptide aptamer bait.
3. Transform the individual peptide aptamer baits and pSH18-34 (lacZ reporter) into
EGY48 (Matα) by standard lithium acetate yeast transformation (UNIT 13.7). At the
same time transform a control plasmid (pEG202) and pSH18-34 into EGY48.
4. Select transformants on 10-cm Glu/CM −His,−Ura plates.
Identify targets
For mating interaction assay:
5a. Construct a panel of desired proteins by inserting coding regions of proteins into the
polylinker of pJG4-5 (prey plasmid, Fig. 24.4.1).
6a. Transform prey plasmids and a control plasmid (pJG4-5) into EGY42 (Mata) by
standard lithium acetate transformation. Select transformants on 10-cm Glu/CM −Trp
plates.
Peptide Aptamers
24.4.16
Supplement 52
Current Protocols in Molecular Biology
7a. Mate strains containing peptide aptamer baits and target protein preys and score
interactions as described (see Basic Protocol 3, steps 3 to 9).
For interaction trap library hunts:
5b. Transform strains containing individual peptide aptamers and pSH18-34 (step 3) with
a library of genomic or cDNA preys. Follow the protocol in UNIT 20.1 for transforming
cDNA and genomic prey libraries.
6b. Select peptide aptamer target(s) using the interaction trap hunt protocol described in
UNIT 20.1.
REAGENTS AND SOLUTIONS
Use deionized, distilled water in all recipes and protocol steps. For common stock solutions, see
APPENDIX 2; for suppliers, see APPENDIX 4.
DNA elution buffer
10 mM Tris⋅Cl, pH 7.5 (APPENDIX 2)
1 mM EDTA, pH 8 (APPENDIX 2)
50 mM NaCl
Store up to 1 year at room temperature
Nondenaturing loading buffer
50 mM Tris⋅Cl, pH 8 (APPENDIX 2)
50 mM EDTA, pH 8 (APPENDIX 2)
50% (v/v) glycerol
Store up to 1 year at 4°C
COMMENTARY
Background Information
Understanding cellular processes within organisms relies on forward and reverse genetic
approaches to identify genetic network members and connections. In forward genetic analysis, genes are identified by isolating randomly
generated mutants and mapping the genes responsible for their mutant phenotypes. Reverse
genetic analysis, by contrast, involves mutating
individual genes and monitoring the resulting
phenotype. While both approaches are effective, they are difficult to perform, especially in
diploid organisms. In diploid organisms, the
identification of recessive mutations requires
two generations of breeding to generate homozygotes. Consequently, genetic approaches
requiring homozygous recessive mutations can
only be fully applied to organisms with welldeveloped genetics such as phage, bacteria,
yeast, C. elegans, and Drosophila.
Dominant agents that affect gene products
in trans, instead of genes, have been developed
to overcome problems associated with the
analysis of recessive mutations in diploid organisms. A variety of dominant agents exist for
the reverse analysis of cellular processes. These
include: small molecule inhibitors (Mitchison,
1 99 4) , d om inant n eg ative pr oteins
(Herskowitz, 1987), antibodies (Gorbsky et al.,
1998), antisense RNA (Branch, 1998), ribozymes (Bramlage et al., 1998), and nucleic
acid aptamers (UNIT 24.3; Thomas et al., 1997).
These agents have improved the ability to analyze processes in diploid organisms; however,
they too have limitations. For example, forward
analysis requires large-scale generation of
agents that are capable of inactivating the function of almost any gene product, but agents such
as small molecule inhibitors and dominant
negative proteins may not exist for all gene
products. Similarly, although it should, in theory, be possible to generate agents such as
antibodies, ribozymes, nucleic acid aptamers,
and antisense RNA against almost any gene
product, antibodies are not membrane permeable, and large-scale injection is tedious and
impractical for most organisms. RNA agents
are not very stable and it is difficult to predict
sites on RNA that are exposed for inhibition by
antisense RNA and ribozymes. Furthermore,
agents that inhibit at the RNA level (antisense
RNA and ribozymes) are affected by the stability of the protein target, which can affect the
onset and/or the extent of the phenotype.
Generation and
Use of
Combinatorial
Libraries
24.4.17
Current Protocols in Molecular Biology
Supplement 52
The development of combinatorial technologies for obtaining biomolecules with desired properties (UNITS 24.2 & 24.3; Ellington and
Szostak, 1990; Scott and Smith, 1990) presents
new avenues for generating “genetic” agents
for characterizing genetically intractable organisms. This unit describes methods to construct combinatorial libraries of “genetic”
agents referred to as peptide aptamers. Peptide
aptamer libraries consist of scaffold proteins
that display variable peptides constrained at
both ends on their surface. They are designed
to interact and interfere with the biological
function of proteins. Peptide aptamers are well
suited for analyzing cellular processes in diploid organisms because they act in trans to
inhibit gene products without altering their encoding DNA. Moreover, because they are isolated from combinatorial libraries, peptide aptamers can in principle be generated to inactivate almost any gene product.
Peptide Aptamers
Design of intracellular peptide aptamers
Peptide aptamers are designed to interact
with their protein targets through variable peptide regions displayed on the surface of a scaffold protein. To date, only a limited number of
scaffold proteins have been used within organisms to display linear and constrained peptides.
These include: E. coli thioredoxin (Colas et al.,
1996), Gal4 activation domain (Yang et al.,
1995), green fluorescent protein (Caponigro et
al., 1998), and staphylococcal nuclease (Norman et al., 1999). A comparison of the binding
constants of these aptamers shows that constrained variable regions can bind their targets
between 100- and 10,000-fold better than linear
peptides (Geyer and Brent, 2000). Unconstrained peptides are also known to be unstable
in E. coli (Davidson and Sauer, 1994). Constrained peptide libraries are therefore the preferred method for displaying combinatorial
peptide libraries for intracellular applications.
When choosing aptamer scaffolds, they should
also be small, stable, soluble, and expressed at
high levels without toxicity. The scaffold
should be tolerant to the addition of protein
moieties such as localization sequences, epitope tags, and purification tags.
Basic Protocol 1 describes the construction
of a peptide aptamer library using E. coli thioredoxin as the scaffold protein. Thioredoxin was
first used as a scaffold protein for displaying
peptides as fusions to flagellin on the surface
of E. coli (Lu et al., 1995). Thioredoxin possesses many characteristics that make it an
excellent scaffold for intracellular applications.
Structural studies on thioredoxin reveal that its
active site contains a 4–amino acid loop
(-CGPC-) that is constrained by the two terminal cysteines (Katti et al., 1990). This loop is
tolerant to peptide insertion (LaVallie et al.,
1993) and provides a site for displaying variable peptides. Thioredoxin is a small (12 Kd)
cytoplasmic protein that is nontoxic when expressed at high levels (LaVallie et al., 1993).
Thioredoxin is often fused to proteins to enhance their solubility (LaVallie et al., 1993).
This is a useful property for expressing random
sequence libraries where many of the sequences may aggregate. Thioredoxin interacts
with a variety of disulfide-containing protein
substrates (Wetterauer et al., 1992), suggesting
that it may also contribute to the binding interactions between peptide aptamers and their
protein targets.
Reverse “genetic” analysis using peptide
aptamers
Reverse genetic analysis using peptide aptamers involves isolating aptamers that interact
with a specific gene product and monitoring the
aptamer-induced phenotype. Peptide aptamers
that interact with a chosen protein are selected
using yeast two-hybrid systems or a variation
thereof (Chien et al., 1991; Dalton and Treisman, 1992; Durfee et al., 1993; Gyuris et al.,
1993; Vojtek et al., 1993). These systems share
the following features: (1) a DNA-binding domain/target protein fusion, (2) a transcription
activation domain/peptide aptamer fusion, and
(3) reporter gene(s) to record interactions between the peptide aptamer and protein target
(see UNIT 20.1 for a detailed description of the
yeast two-hybrid system).
Basic Protocol 2 describes the interaction
trap two-hybrid system as a method for obtaining peptide aptamers that interact with a selected protein target. The interaction trap is an
effective method for obtaining high-affinity
peptide aptamers that bind specific proteins.
Aptamers obtained using the interaction trap
have dissociation constants greater than the 1
µM detection limit required to activate the interaction trap reporters (Estojak et al., 1995).
To date, the interaction trap has been used
to isolate peptide aptamers against a variety of
protein targets including Cdk2 (Colas et al.,
1996), Ras (Xu et al., 1997), HIV-1 Rev
(Cohen, 1998), and E2F (Fabbrizio et al.,
1999). The dissociation and half-inhibitory
constants of these aptamers range from 10−8 to
5 × 10⁻¹¹ M.
24.4.18
Supplement 52
Current Protocols in Molecular Biology
An advantage of using the interaction trap
to select peptide aptamers is that selection occurs in an intracellular environment. This increases the probability that the aptamers will
retain their function when expressed in the
appropriate organism. Moreover, aptamers isolated using the interaction trap function effectively under a variety of in vivo conditions such
as cell cultures (Cohen et al., 1998; Fabbrizio
et al., 1999) and in Drosophila (Kolonin and
Finley, 1998).
Specificity of peptide aptamers
To be useful for genetic analysis, a peptide
aptamer must interact specifically with its protein target. Peptide aptamer specificity can be
evaluated by analyzing the aptamer’s ability to
interact with related target proteins using the
interaction trap. Basic Protocol 3 describes the
mating interaction assay, an extension of the
interaction trap developed by Finley and Brent
(1994) for determining the specificity of peptide aptamers against a large panel of related
proteins. The interaction mating assay allows
panels of individual aptamers to be simultaneously screened for interactions with panels of
related target proteins. Using this method, Colas et al. (1996) determined the specificity of
aptamers isolated against cyclin-dependent kinase 2 (Cdk2). The majority of aptamers tested
were highly specific for Cdk2 and not other
closely related kinases with one exception:
some of the aptamers also interacted with the
closely related kinase Cdk3. Their results demonstrate that aptamers can be generated against
different epitopes on Cdk2, some of which are
conserved between different members of the
cyclin-dependent kinases.
The mating interaction assay is also used to
determine the specific regions and/or amino
acids that aptamers recognize on the target
protein. For example, Cohen et al. (1998)
showed that one of the aptamers isolated
against Cdk2 (Colas et al., 1996) acts as a
competitive inhibitor of the Cdk2-dependent
phosphorylation of histone H1. Interaction
mating with a panel of mutant Cdk2 proteins
revealed that specific active site residues are
required for aptamer binding, supporting the
competitive inhibition mechanism. In summary, interaction mating assays using panels of
related and mutated proteins can be used to
classify both the specificity and binding interactions of different aptamers targeted to the
same protein.
Affinity maturation
Peptide aptamer selections using the interaction trap are limited to screening ∼106 to 107
unique aptamers per experiment. This is a small
representation (∼9 × 10⁻⁶%) of the entire sequence space available to aptamers containing
20-mer variable regions (2020 possible sequences). In addition to the small sample size,
many of the aptamers will contain stop codons
within the variable region. As a result, it is likely
that aptamers isolated using the interaction trap
do not contain the optimal binding sequences
for their target proteins.
Basic Protocol 4 describes a method to obtain aptamers with increased binding affinity.
The protocol involves mutating the aptamer
variable region and reselecting for binding to
its target protein using an interaction trap that
contains a more stringent reporter gene (Cohen,
1998; Colas et al., 2000). Mutations can be
introduced using mutagenic PCR or by synthesizing degenerate oligonucleotides with varying degrees of randomness (see UNIT 2.11 for a
discussion on the construction of degenerate
oligonucleotides). The stringency of the interaction trap is enhanced by reducing the number
of LexA operators upstream of the reporters.
The interaction trap in UNIT 20.1 contains eight
LexA operators in the LexA-lacZ (pJG4-5) and
LexA-leu2 (EGY48 strain) reporters. These reporters are capable of detecting interactions
with dissociation constants of <1 µM (Estojak
et al., 1995). Other lacZ reporters, developed
by Brent and Ptashne (1985), contain only one
(pRB1840) or two (pJK103) LexA operators
(Fig. 24.4.2). These operators have lower affinity for the LexA DNA-binding domain and
detect interactions with dissociation constants
between 20 nM and <1 µM (Estojak et al.,
1995).
The affinity maturation described in Basic
Protocol 4 has been successfully used to enhance the affinity of aptamers isolated against
Cdk2 (Cohen, 1998; Colas et al., 2000). The
variable region of the anti-Cdk2 aptamer was
mutated by PCR and reselected for binding to
a LexA-Cdk2 fusion using the 1-LexA-operator
lacZ reporter (pRB1840). Isolated aptamers all
contained the same two amino acid substitutions. The dissociation constant of the mature
aptamer was reduced to 5 nM, a 20-fold decrease from the starting aptamer (Kd = 0.1 µM).
Forward “genetic” analysis with peptide
aptamers
Combinatorial libraries of peptide aptamers
can function as dominant agents to randomly
Generation and
Use of
Combinatorial
Libraries
24.4.19
Current Protocols in Molecular Biology
Supplement 52
Table 24.4.1
Degenerate Codons for Designing Combinatorial Peptide Librariesa
Codonb
Properties
NNN
All 20 amino acids
NNS
NNC
NWW
RVK
DVT
NVT
NNT
VVC
NTT
RST
TDK
Amino acidsc
A(4), C(2), D(2), E(2), F(2), G(4), H(2),
I(3), K(2), L(6), M(1), N (2), P(4), Q(2),
R(6), S(6), T(4), V(4), W(1), Y(2)
All 20 amino acids
A(2), C(1), D(1), E(1), F(1), G(2), H(1),
I(1), K(1), L(3), M(1), N(1), P(2), Q(1),
R(3), S(3), T(2), V(2), W(1), Y(1)
15 amino acids
A(1), C(1), D(1), F(1), G(1), H(1), I(1),
L(1), N(1), P(1), R(1), S(2), T(1), V(1),
Y(1)
Charged, hydrophobic D(1), E(1), F(1), H(1), I(2), K(1), L(3),
N(1), Q(1), V(2), Y(1)
Charged, hydrophilic A(2), D(1), E(1), G(2), K(1), N(1), R(1),
S(1), T(2)
Hydrophilic
A(1), C(1), D(1), G(1), N(1), S(2), T(1),
Y(1)
Charged, hydrophilic A(1), C(1) , D(1), G(1), H(1), N(1), P(1),
R(1), S(2), T(1), Y(1)
Mixed
A(1), C(1), D(1), F(1), G(1), H(1), I(1),
L(1), N(1), P(1), R(1), S(2), T(1), V(1),
Y(1)
Hydrophilic
A(1), D(1), G(1), H(1), N(1), P(1), R(1),
S(1), T(1)
Hydrophobic
F(1), I(1), L(1), V(1)
Small side chains
A(1), G(1), S(1), T(1)
Hydrophobic
C(1), F(1), L(1), W(1), Y(1)
No. of
codons
Stop codons
64
TAA(1), TAG(1), TGA(1)
32
TAG (1)
16
None
16
TAA (1)
12
None
9
None
12
None
16
None
9
None
4
4
6
None
None
TAG (1)
aBased on a table described by Sidhu and Weiss (2000).
bAbbreviations: D = A, G, T; K = G, T; N = A, G, C, T; R = A, G; S = C, G; V = A, C, G; W = A, T.
cNumbers in parentheses indicate the number of codons for each amino acid.
inactivate gene products without altering their
genetic material. The forward analysis of cellular processes using peptide aptamers involves
expressing libraries of peptide aptamers within
cells and screening for aptamer-induced phenotypes. The protein(s) and protein interactions
disrupted by the aptamers are then identified.
Basic Protocol 5 describes methods for performing forward analysis of cellular processes
in yeast. Methods are also described for identifying peptide aptamer target(s) using interaction trap hunts with genomic or cDNA libraries
or by mating interaction assays using protein
panels (Support Protocol). Combining aptamer
library screening with interaction trap hunts
and mating interaction assays provides a new
strategy for analyzing processes in diploid organisms and in multicopy gene phenotypes.
Peptide Aptamers
Peptide aptamers have been used for the
forward analysis of phenotypes in yeast
(Caponigro et al., 1998; Geyer et al., 1999;
Norman et al., 1999) and bacteria (Blum et al.,
2000). In yeast, peptide aptamers were isolated
that inhibited mating pheromone response
(Caponigro et al., 1998; Geyer et al., 1999;
Norman et al., 1999) and spindle checkpoint
(Norman et al., 1999) signal transduction pathways. In bacteria, peptide aptamers were isolated that specifically inhibited thymidylate
synthase or that caused growth inhibition
(Blum et al., 2000). The peptide aptamer targets
for forward analysis in yeast were identified
using yeast two-hybrid systems. Mating interaction assays identified protein targets from
panels of proteins known to be involved in the
yeast pheromone response pathway (Caponigro et al., 1998; Geyer et al., 1999) or from large
24.4.20
Supplement 52
Current Protocols in Molecular Biology
panels of proteins containing almost all of the
proteins in the yeast genome (Norman et al.,
1999). Peptide aptamer targets were also identified using interaction trap hunts against a
partial-coverage yeast genomic library (Geyer
et al., 1999). Interestingly, the peptide aptamer
targets identified with the mating interaction
assay were not obtained with the interaction
trap hunt using the partial-coverage yeast
genomic library (Geyer et al., 1999). The inability of the genomic library screen to identify
aptamer targets is partly due to the representation of targets in the partial-coverage library. Nevertheless, the results demonstrate a
better success rate for identifying aptamer targets using mating interaction assays with arrayed panels of protein targets. Mating interaction assays have the following advantages: (1)
they present protein targets as fully normalized
libraries, (2) they allow reporter outputs that
result from interactions to be directly compared
with outputs caused by the bait alone, and (3)
they allow the detection of interaction strengths
independent of the differences in plating efficiencies caused by differential reporter activation (Estojak et al., 1995). Currently, protein
panels that cover an organism’s entire proteome
are not commercially available. Consequently,
the identification of targets for peptide aptamers isolated using genetic screens will consist of limited panels of known proteins complimented with cDNA or genomic libraries.
Inhibitory mechanisms of peptide aptamers
Peptide aptamers inhibit protein function by
a variety of mechanisms. For example, peptide
aptamers can bind to protein targets and disrupt
their interactions with other proteins. They can
disrupt protein interactions within cells (Xu et
al., pers. comm.) and in two-hybrid assays
(Geyer et al., 1999), and they can inhibit enzymes by competing with their substrates for
active site binding (Cohen et al., 1998). In
addition to disrupting protein interactions, peptide aptamers can also inhibit protein function
by mislocalizing protein targets. Peptide aptamers modified with a localization signal can
transport their target proteins into various cellular compartments (Colas et al., 2000). Peptide
aptamers fused to catalytic domains can also
direct the substrate specificity of enzymes.
They can be used to localize enzyme activities
to specific protein targets (Colas et al., 2000)
or locations in the cell.
Peptide aptamers are particularly useful for
the analysis of genetic networks since they can
disrupt specific interactions with protein targets
that have multiple protein interactions (Geyer
et al., 1999). This allows phenotypes caused by
the disruption of individual interactions in a
network to be observed, while leaving other
interactions in the same network intact. Peptide
aptamers can be isolated against allelic variants
of proteins (Xu et al., 1997). Their high specificity can be used to functionally characterize
variants of polymorphic proteins. In addition,
controlling their expression using inducible
promoters allows the penetrance and timing of
the aptamer-induced phenotype to be varied.
Finally, performing genetic selections with
peptide aptamers targeted to different locations
in the cell can provide information on the cellular location of the target protein.
Together, these properties point to the many
ways in which peptide aptamers can be used to
analyze cellular processes. The successful use
of peptide aptamers in the reverse analysis of
processes in cell cultures and in Drosophila,
and in the forward analysis of processes in
yeast, illustrates their potential as “genetic”
agents in the analysis of genetically intractable
organisms.
Critical Parameters and
Troubleshooting
Peptide aptamer libraries
The first critical parameter to consider is the
method for synthesizing peptide aptamer libraries. Preferably, peptide aptamer libraries
are constructed to minimize the amount of stop
codons while maintaining amino acid diversity.
In general, two methods of automated DNA
synthesis are used to generate DNA templates
that code for combinatorial peptide libraries.
The first method generates DNA templates by
sequentially coupling mixtures of the four-nucleotide phosphoramidites. The second method
generates DNA templates by sequentially coupling mixtures of codons.
The sequential nucleotide incorporation
method uses completely random or biased mixtures of nucleosides to construct DNA templates. DNA templates constructed using equimolar mixtures of the four-nucleotide phosphoramidites contain all 64 possible codons,
including 41 redundant codons and three stop
codons. The completely random libraries are
biased for amino acids encoded by multiple
codons. In addition, the presence of stop codons
produces truncated aptamers at a frequency of
3n/64, where n is the length of the peptide
library. The sequential nucleotide incorporation method is improved by restricting the nu-
Generation and
Use of
Combinatorial
Libraries
24.4.21
Current Protocols in Molecular Biology
Supplement 52
Peptide Aptamers
cleotides that are incorporated at the third position in the codon (see Table 24.4.1 for examples of degenerate codons). The third position
of a codon is responsible for most of the redundancy in the genetic code. DNA templates that
contain all four nucleosides in the first two
positions of the codon and only G or C at the
third position consist of 32 codons, which code
for 20 amino acids and one stop codon. Codons
limited to G or C at the third position are biased
for amino acids that are coded by multiple
codons. However, the frequency of a stop codon
is reduced to n/32, where n is the length of the
peptide. The presence of stop codons in a completely random or third position–biased library
limits the complexity that is obtainable with
long combinatorial peptide libraries. The construction of longer peptide libraries requires the
ligation of shorter DNA templates that are prescreened to eliminate sequences that contain
stop codons (Cho et al., 2000). Alternatively,
combinatorial peptide libraries can be constructed that contain no stop codons, but with
reduced amino acid diversity. Table 24.4.1 provides examples of degenerate codons that can
be used to design peptide libraries.
The sequential codon incorporation method
is used to generate DNA templates that contain
20 amino acids and no stop codons. Three
strategies are used to generate codons. The first
strategy involves sequentially coupling individual nucleotide phosphoramidites to generate 20 codons each of which is on a separate
column (Lam et al., 1991). The beads from each
column are subsequently mixed together and
repacked into new columns for the synthesis of
the next codon. The second strategy involves
the synthesis of 20 trinucleotide phosphoramidite codons (Virnekas et al., 1994).
Combinatorial peptide libraries are synthesized
by coupling random or biased mixtures of the
codon phosphoramidites. The third strategy
combines aspects of the first two strategies and
involves sequentially coupling either an A, G,
C, or T phosphoramidite followed by a specific
dinucleotide phosphoramidite to complete the
codon (Neuner et al., 1998). After the completion of each codon, the beads from the columns
are mixed and repacked into new columns for
the synthesis of the next codon. The advantage
of the codon incorporation method is that it
generates unbiased libraries without stop codons. However, there are drawbacks to this
method. For example, the bead splitting can
become extremely laborious for long peptides.
Also, the synthesis of dinucleotide and trinucleotide phosphoramidites is not trivial, and
these phosphoramidites are not currently commercially available.
Once the combinatorial peptide libraries are
constructed and inserted into the scaffold protein, they need to be transformed into E. coli
and amplified. Electroporation is the most efficient method for transforming high-diversity
libraries into E. coli. DNA uptake by E. coli is
maximized under conditions of high field
strength and low current flow (see Sidhu and
Weiss, 2000, for conditions to maximize transformation efficiency in E. coli). To reduce the
current flow, the conducting species must be
removed from the DNA using affinity purification columns.
The number of peptide aptamers that can be
screened is generally limited by the transformation efficiencies of the organism used in the
selection. In yeast, the highest transformation
efficiencies are obtained using the lithium acetate transformation protocol developed by
Geitz and Schiestl (1995). The diversity of
peptide aptamer libraries in yeast are limited to
∼106 to 107 unique aptamers. This is much
lower than the 109 to 1010 libraries typically
obtained in E. coli. Particular care should be
taken to optimize the transformation efficiencies in yeast or other selected organisms. To
obtain optimal transformation in yeast, it is
important to perform trial transformations to
optimize parameters such as heat shock time
and cell density.
Screening peptide aptamers
A second critical parameter is the spontaneous reversion rate in the screen used to isolate
the peptide aptamers. UNIT 20.1 discusses critical
parameters that should be taken into account
when selecting peptide aptamers against specific proteins using the interaction trap. False
positives that occur in either the interaction trap
or other genetic screens can be eliminated more
efficiently using peptide aptamers that are expressed under the control of an inducible promoter.
Identifying protein targets
A third critical parameter is the identification of proteins targeted by peptide aptamers
that have been isolated based on their ability to
disrupt cellular processes. In general, peptide
aptamer targets are more reliably obtained from
panels of known proteins rather than from
genomic or cDNA libraries. Once putative peptide aptamer targets have been identified using
interaction trap hunts and mating interaction
assays, it is important to verify these targets
24.4.22
Supplement 52
Current Protocols in Molecular Biology
using other means. For example, immunoprecipitation can be used to confirm that aptamers
form complexes with their targets under in vivo
conditions. Genetic tests such as epistasis
analysis can be used to identify the location of
the aptamers relative to a known protein. Peptide aptamer targets can be deleted or overexpressed and the resulting phenotype compared
to the aptamer-induced phenotype. Similarly,
whole-genome transcript arrays can test
whether aptamers cause the same response as
known inhibitors or mutations.
Anticipated Results
In general, approximately one out of every
105 peptide aptamers screened using the interaction trap interacts with a given target protein
(Colas et al., 1996; Xu et al., 1997; Fabbrizio
et al., 1999). Based on results using the yeast
pheromone response pathway as a model process, approximately one out of every 105 to 106
peptide aptamers can inhibit a cellular process
(Geyer et al., 1999). These results apply to
20mer combinatorial peptide libraries displayed on the surface of E. coli thioredoxin.
Time Considerations
Basic Protocol 1: Construction of the thioredoxin peptide aptamer library and its subsequent electroporation and amplification in E.
coli will take ∼1 week.
Basic Protocol 2: Isolation of peptide aptamers that interact with a specific bait protein
takes ∼3-4 weeks. The bait plasmid (pBait) and
the pJM-1 peptide aptamer library are constructed during the first week. During the second week the pBait and the lacZ reporter plasmid (pSH18-34) are transformed into EGY48.
The bait protein is also assayed to determine if
it self-activates the reporter genes. During the
third week the peptide aptamer library is transformed into EGY48 that contains pBait and
pSH18-34. The aptamers are screened for their
ability to interact with the bait protein and
putative interacting aptamers are obtained. A
fourth week is required to isolate the aptamer
plasmids from the yeast and sequence their
variable regions.
Basic Protocol 3: Determination of the peptide aptamer specificity using interaction mating takes ∼1-2 weeks. The time required to
construct the bait proteins, which will be used
to evaluate the aptamer specificity, varies depending on the number of baits chosen and
difficulty in cloning the baits. Once the bait
proteins are constructed it takes ∼1 week to
transform both the baits and lacZ reporter into
EGY42 and the peptide aptamer preys into
EGY48. Mating EGY48 with EGY42 and scoring interactions between the peptide aptamer
preys and baits takes an additional week.
Basic Protocol 4: Affinity maturation of
peptide aptamers takes ∼3-4 weeks. The mutagenesis of the peptide aptamer and subsequent cloning into pJM-1 (prey vector) takes
∼1 week. Isolation of mutant aptamers that
interact with the bait protein using the interaction trap with a more stringent lacZ reporter
takes 3 weeks as described above in Basic
Protocol 2.
Basic Protocol 5: Construction of the thioredoxin peptide aptamer library (pJM-2 or pJM3) takes ∼1 week as described in Basic Protocol
1. The time required to isolate peptide aptamers
that disrupt a cellular process varies depending
on the organism and selection or screen used.
Before the targets of the peptide aptamers can
be identified, it is necessary to transfer the
thioredoxin peptide aptamers from the expression vector used in the screen (pJM-2 or pJM-3)
to the bait plasmid (pEG202). This transfer
takes ∼1 week. Identification of the peptide
aptamer target(s) using the interaction trap mating (Basic Protocol 2) or cDNA or genomic
library (UNIT 20.1) hunts takes ∼4 weeks.
References
Bai, C. and Elledge, S.J.M. 1996. Gene identification using the yeast two-hybrid system. Methods
Enzymol. 273:331-347.
Blum, J.H., Dove, S.L., Hochschild, A., and
Mekalanos, J.J. 2000. Isolation of peptide aptamers that inhibit intracellular processes. Proc.
Natl. Acad. Sci. U.S.A. 97:2241-2246.
Bramlage, B., Luzi, E., and Eckstein, F. 1998. Designing ribozymes for the inhibition of gene
expression. Trends Biotech. 16:434-438.
Branch, A.D. 1998. A good antisense molecule is
hard to find. Trends Biochem. Sci. 23:45-50.
Brent, R. and Ptashne, M. 1985. A eukaryotic transcriptional activator bearing the DNA specificity
of a prokaryotic repressor. Cell 43:729-736.
Cadwell, R.C. and Joyce, G.F. 1994. Mutagenic
PCR. PCR Methods Appl. 3:S136-S140.
Caponigro, G., Abedi, M.R., Hurlburt, A.P., Maxfield, A., Judd, W., and Kamb, A. 1998.
Transdominant genetic analysis of a growth control pathway. Proc. Natl. Acad. Sci. U.S.A.
95:7508-7513.
Chien, C.T., Bartel, P.L., Sternglanz, R., and Fields,
S. 1991. The two-hybrid system: A method to
identify and clone genes for proteins that interact
with a protein of interest. Proc. Natl. Acad. Sci.
U.S.A. 88:9578-9582.
Generation and
Use of
Combinatorial
Libraries
24.4.23
Current Protocols in Molecular Biology
Supplement 52
Cho, G., Keefe, A.D., Liu, R., Wilson, D.S., and
Szostak, J.W. 2000. Constructing high complexity synthetic libraries of long ORFs using in vitro
selection. J. Mol. Biol. 297:309-391.
Gietz, R.D. and Schiestl, R.H. 1995. Transforming
yeast with DNA. Methods Mol. Cell. Biol. 5:255269.
Cohen, B. 1998. Selection of peptide aptamers that
recognize and inhibit intracellular proteins.
Ph.D. Thesis, Harvard University.
Gorbsky, G.J., Chen, R.H. and Murray, A.W. 1998.
Microinjection of antibody to Mad2 protein into
mammalian cells in mitosis induces premature
anaphase. J. Cell Biol. 141:1193-1205.
Cohen, B.A., Colas, P., and Brent, R. 1998. An
artificial cell-cycle inhibitor isolated from a combinatorial library. Proc. Natl. Acad. Sci. U.S.A.
95:14272-14277.
Gyuris, J., Golemis, E., Chertkov, H. and Brent, R.
1993. Cdi1, a human G1- and S-phase protein
phosphatase that associates with Cdk2. Cell
75:791-803.
Colas, P., Cohen, B., Jessen, T., Grishina, I., McCoy,
J., and Brent, R. 1996. Genetic selection of peptide aptamers that recognize and inhibit cyclindependent kinase 2. Nature 380:548-550.
Herskowitz, I. 1987. Functional inactivation of
genes by dominant negative mutations. Nature
329:219-222.
Colas, P., Cohen, B., Ferrigno, P., Silver, P., and
Brent, R. 2000. Targeted modification and transportation of cellular proteins. Proc. Natl. Acad.
Sci. U.S.A. In press.
Dalton, S. and Treisman, R. 1992. Characterization
of SAP-1, a protein recruited by serum response
factor to the C-FOS serum response element.
Cell 68:597-612.
Davidson, A.R. and Sauer, R.T. 1994. Folded protein
sequences occur frequently in libraries of random amino-acid-sequences. Proc. Natl. Acad.
Sci. U.S.A. 91:2146-2150.
Durfee, T., Becherer, K., Chen, P.L., Yeh, S.H., Yang,
Y., Kilburn, A.E., Lee, W.H. and Elledge, S.J.
1993. The retinoblastoma protein associates with
the protein phosphatase type 1 catalytic subunit.
Genes Dev. 7:555-569.
Ellington, A.D. and Szostak, J.W. 1990. In vitro
selection of RNA molecules that bind specific
ligands. Nature 346:818-822.
Estojak, J., Brent, R., and Golemis, E.A. 1995.
Correlation of two-hybrid affinity data with in
vitro measurements. Mol. Cell. Biol. 15:58205829.
Fabbrizio, E., Le Cam, L., Polanowski, J., Kaczorek,
M., Lamb, N., Brent, R., and Sardet, C. 1999.
Inhibition of mammalian cell proliferation by
genetically selected peptide aptamers that functionally antagonize E2F activity. Oncogene
18:4357-4363.
Finley, R.L. Jr. and Brent, R. 1994. Interaction mating reveals binary and ternary connections between Drosophila cell cycle regulators. Proc.
Natl. Acad. Sci. U.S.A. 91:12980-12984.
Finley, R.L. and Brent, R. 1997. Understanding gene
and allele function with two-hybrid methods.
Annu. Rev. Genet. 31:663-704.
Geyer, C.R. and Brent, R. 2000. Selection of “genetic” agents from random peptide aptamer expression libraries. Methods Enzymol. 328:171208.
Geyer, C.R., Colman-Lerner, A., and Brent, R. 1999.
“Mutagenesis” by peptide aptamers identifies
genetic network members and pathway connections. Proc. Natl. Acad. Sci. U.S.A. 96:85678572.
Kamens, J. and Brent, R. 1991. A yeast transcription
assay defines distinct REL and Dorsal DNA
recognition sequences. New Biol. 3:1005-1013.
Katti, S.K., LeMaster, D.M. and Eklund, H. 1990.
Crystal structure of thioredoxin from Escherichia coli at 1.68A resolution. J. Mol. Biol.
212:167-184.
Kolonin, M.G. and Finley, R.L. Jr. 1998. Targeting
cyclin-dependent kinases in Drosophila with
peptide aptamers. Proc. Natl. Acad. Sci. U.S.A.
95:14266-14271.
Lam, K.S., Salmon, S.E., Hersch, E.N., Hruby, V.J.,
Katzmierski, W.M., and Knapp, R.J. 1991. A new
type of synthetic peptide library for identifying
ligand-binding activity. Nature 354:82-84.
LaVallie, E.R., Diblasio, E.A., Kovacic., S., Grant,
K.L., Schendel, P.F., and McCoy, J.M. 1993. A
thioredoxin gene fusion expression system that
circumvents inclusion body formation in the E.
coli cytoplasm. Bio/Technology 11:187-193.
Lu, Z., Murray, K.S., Van Cleave, V., LaVallie, E.R.,
Stahl, M.L., and McCoy, J.M. 1995. Expression
of thioredoxin random peptide libraries on the
Escherichia-Coli cell-surface as functional fusions to flagellin – a system designed for exploring protein-protein interactions. Biotechnology
13:366-372.
Mitchison, T.J. 1994. Towards a pharmacological
genetics. Chem. Biol. 1:3-6.
Neuner, P., Cortese, R., and Monaci, P. 1998. Codon-based mutagenesis using dimer-phosphoramidites. Nucl. Acids Res. 26:1223-1227.
Norman, T.C., Smith, D.L., Sorger, P.K., Drees,
B.L., O’Rourke, S.M., Hughes, T.R., Roberts,
C.J., Friend, S.H., Fields, S., and Murray, A.W.
1999. Genetic selection of peptide inhibitors of
biological pathways. Science 285:591-595.
Scott, J.K. and Smith, G.P. 1990. Searching for
peptide ligands with an epitope library. Science
249:386-390.
Sidhu, S.S. and Weiss, G.A. 2000. Constructing
phage display libraries by oligonucleotide-directed mutagenesis. In Phage Display: A Practical Approach (T. Clackson and H.B. Lowman,
eds.) In press. Oxford University Press, Oxford.
Peptide Aptamers
24.4.24
Supplement 52
Current Protocols in Molecular Biology
Thomas, M., Chedin, S., Carles, C., Riva, M., Famulaok, M., and Sentenac, A. 1997. Selective
targeting and inhibition of yeast RNA polymerase II by RNA aptamers. J. Biol. Chem.
272:27980-27986.
that disrupt the pathway. Peptide aptamer targets
were identified using mating interaction assays that
contained panels of known proteins and by using
interaction trap hunts against a yeast genomic library.
Virnekas, B., Ge, L., Pluckthun, A., Schneider, K.C.,
Wellnhofer, G., and Moroney, S.E. 1994. Trinucleotide phosphoramidites–Ideal reagents for
the synthesis of mixed oligonucleotides for random mutagenesis. Nucl. Acids Res. 23:56005607.
Gyuris et al., 1993. See above.
Vojtek, A.B., Hollenberg, S.M., and Cooper, J.A.
1993. Mammalian Ras interacts directly with the
serine/threonine kinase Raf. Cell 74:205-214.
Kolonin and Finley, 1998. See above.
West, R.W. Jr., Yocum, R.R. and Ptashne, M. 1984.
Saccharomyces cerevisiae GAL1-GAL10 divergent promoter region: Location and function of
the upstream activator sequence UASG. Mol.
Cell. Biol. 4:2467-2478.
Wetterauer, B., Veron, M., Miginiac-Maslow, M.,
Decottignies, P., and Jacquot, J.P. 1992. Biochemical characterization of thioredoxin-1 from
Dictyostelium discoideum. Eur. J. Biochem.
209:643-649.
Xu, C.W., Mendelsohn, A. and Brent, R. 1997. Cells
that register logical relationships among proteins. Proc. Natl. Acad. Sci. U.S.A. 94:1247312478.
Yang, M., Wu, Z., and Fields, S. 1995. Protein-peptide interactions analyzed with the yeast two-hybrid system. Nucl. Acids Res. 23:1152-1156.
Yocum, R.R., Hanley, S., West, R.J., and Ptashne,
M. 1984. Use of LacZ fusions to delimit regulatory elements of the inducible divergent GAL1GAL10 promoter in Saccharomyces cerevisiae.
Mol. Cell. Biol. 4:1985-1998.
Key References
Colas et al., 1996. See above.
First article to describe the interaction trap as a
method to isolate thioredoxin peptide aptamers
against a specific protein (Cdk2).
Initial description of the interaction trap.
Finley and Brent, 1994. See above.
Initial description of the mating interaction assay.
Describes the reverse analysis of a cellular process
in Drosophila using peptide aptamers that bind to
Drosophila Cdks.
Lu et al., 1995. See above.
First study to use E. coli thioredoxin as a scaffold
for displaying combinatorial libraries of peptides.
Norman et al., 1999. See above.
Describes the use of staphylococcal nuclease peptide aptamers for the forward analysis of the yeast
pheromone response and the spindle checkpoint signal transduction pathways. Peptide aptamers are
characterized by transcript arrays and by two-hybrid analysis using a protein panel containing almost all of the proteins in the yeast genome.
Sidhu and Weiss, 2000. See above
Review article that describes strategies for designing combinatorial peptide libraries and efficient
methods for transforming E. coli.
Internet Resources
http://www.umanitoba.ca/faculties/medicine/units/
biochem/gietz/Trafo.html
Web site that describes efficient protocols for transforming yeast.
See UNIT 20.1 for Internet resources related to the
interaction trap.
Geyer et al., 1999. See above.
Describes the use of thioredoxin peptide aptamers
for the forward analysis of the pheromone response
pathway in yeast. Peptide aptamers were isolated
Contributed by C. Ronald Geyer
University of Florida
Gainesville, Florida
Generation and
Use of
Combinatorial
Libraries
24.4.25
Current Protocols in Molecular Biology
Supplement 52
Protein Selection Using mRNA Display
UNIT 24.5
mRNA display is an in vitro technique that may be used to search natural or synthetic
DNA libraries for the functional proteins and peptides they encode. mRNA-displayed
proteins are constructs in which a protein is covalently attached to the RNA that encodes
it. This direct covalent association of phenotype (protein) and genotype (RNA) renders
the protein directly amplifiable. This in turn allows successive cycles of selection,
enrichment, and, optionally, mutagenesis, to be performed upon libraries of displayed
proteins. At the end of this process, functional sequences will dominate the library;
cloning and sequencing will reveal the identity of the selected functional proteins. mRNA
display allows new functional proteins to be discovered without resorting to protein
design.
mRNA-displayed proteins are generated by the in vitro translation of mRNA display
templates which are mRNA molecules 3′-terminated in puromycin (Fig. 24.5.1). Puromycin is a translation inhibitor that is able to enter the ribosome during translation and form
a stable covalent bond with the nascent protein. This allows a stable covalent linkage to
be formed between the mRNA display template and the protein it encodes, resulting in
an mRNA-displayed protein (Fig. 24.5.2).
STRATEGIC PLANNING
The first issue that needs to be addressed when embarking upon protein selection using
mRNA display is the design and construction of the library at the DNA level. If the goal
of the selection is the “improvement” of an existing protein aptamer or enzyme, then the
starting point for the selection will be the DNA sequence encoding this protein. If the goal
of the selection is to discover a new class of protein aptamers or enzymes, then the starting
point for the selection will be a DNA sequence in which some or many of the positions
CH3
CH3
N
N
N
O
HO
N
N
OH
HN
O
puromycin
NH2
OCH3
Figure 24.5.1 Puromycin is an antibiotic that functions by inhibiting translation. The molecular
structure of puromycin resembles the acceptor arm of an amino-acylated tRNA. Puromycin is a
nucleotide-amino acid chimera and ultimately forms the nucleic acid-protein junction in the mRNA
displayed protein.
Generation and
Use of
Combinatorial
Libraries
Contributed by Anthony D. Keefe
24.5.1
Current Protocols in Molecular Biology (2001) 24.5.1-24.5.34
Copyright © 2001 by John Wiley & Sons, Inc.
Supplement 53
are randomized. In either case, the DNA library may originate from a fixed natural
sequence (clone) and subsequently be randomized by some process such as mutagenic
PCR (Cadwell and Joyce, 1992) or DNA shuffling (Stemmer, 1994). Alternatively, the
DNA library may be synthetic, in which case it can be synthesized as a fixed sequence
and treated as above, or it may be synthesized in a high-diversity form directly, using
mixtures of nucleotide phosphoramidites on a DNA synthesizer. In a third approach, the
DNA may be isolated from a natural high-diversity source, either cDNA derived from
biological mRNA or genomic DNA using a diverse mixture of PCR primers, or DNA
sampled directly from the environment originating from a multitude of uncultured
organisms. In all of these approaches, the DNA library will ultimately need to encode
terminal constant regions to permit PCR amplification. These may also encode protein
affinity tags that will facilitate the purification of the resulting displayed proteins. It is
also desirable to encode restriction sites close to the random-constant sequence boundary
to enable these constant regions to be changed should reengineering of the library be
necessary.
If the DNA library is to be synthesized in more than one piece, then a strategy of restriction
and ligation of different DNA cassettes needs to be designed. This strategy ultimately
TMV
enhancer
ORF
poly (dA)
A
P
P
puromycin
ribosome
B
P
P
nascent protein
C
P
P
P
P
D
E
P
P
mRNA-displayed protein
Protein Selection
Using mRNA
Display
Figure 24.5.2 mRNA-displayed protein formation. (A) The mRNA display template consists of a
Tobacco Mosaic Virus (TMV) translation enhancer sequence followed by the open reading frame
encoded in RNA. This is followed by poly(dA) that is 3′-terminated with puromycin. (B) The ribosome
initiating the translation of the mRNA display template. (C) The ribosome pausing at the RNA-DNA
junction of the mRNA display template after it has translated the mRNA display template into protein.
(D) The puromycin attached to the 3′-terminus of the mRNA display template entering the A site of
the ribosome and forming a stable amide bond with the nascent protein. (E) The mRNA display
template displaying the protein that it encodes after the ribosome has been released during
purification.
24.5.2
Supplement 53
Current Protocols in Molecular Biology
yields the full-length library, and additionally offers the opportunities of purification and
amplification of the individual DNA cassettes before they are ligated together. Amplification of the cassettes at this stage can greatly increase the library diversity in a
combinatorial sense. Purification of the cassettes at this stage can decrease the proportion
of cassettes that contain deletions, insertions, and stop codons. This “preselection”
strategy can greatly increase the effective diversity of the DNA library since the proportion
of resultant mRNA display templates, which are able to display frameshift-free proteins,
will also increase in a combinatorial fashion once the DNA cassettes are ligated together.
The steps in a preselection strategy are shown in Figure 24.5.3, and a detailed description
is given in Cho et al. (2000).
Once the library has been designed and synthesized, the translation conditions need to be
optimized for the formation of displayed proteins, and the purification strategy also needs
to be optimized and subsequently piloted in a serial manner. However, the most important
part of the strategic planning phase of the project is the design of the selection strategy.
The first selection step needs to be designed to retain as many as possible of the functional
displayed proteins that are present in the library, while discarding the great majority of
those that are not functional. In this manner, the diversity of the library is taken advantage
of to the maximal extent, but the diversity of the library is sufficiently reduced that the
first amplification step is able to give several copies of the selected proteins for input into
the next selection step. Subsequent to the first amplification step, the selection steps need
to be designed to have the maximal possible reasonable discrimination between mRNA
displayed proteins that exhibit the function of interest and those that do not. If at all
possible, the extent of this discrimination should be assayed with positive and negative
controls.
The steps within a single round of selection and amplification are shown in Figure 24.5.4.
Library Design
Library synthesis and preselection
A synthetic DNA library encoding a short open reading frame (ORF; up to ∼35 amino
acids) may be synthesized as a single oligonucleotide. Longer libraries of ORFs will need
to be synthesized in two or more DNA cassettes that are then ligated together. Synthetic
DNA has a deletion rate of ∼0.5% and random regions will contain stop codons. Deletions
will cause parts of the resultant proteins to be out of frame, and stop codons will prevent
translated proteins from being displayed upon the mRNA that encodes them. For example,
if the target ORF is 100 amino acids long, has an equal distribution of all four nucleotides
at every position, and the deletion rate is 0.5%, only 0.18% will be in-frame over their
entire lengths and free of stop codons. Consequently, unless the ORF is very short, one
may wish to preselect the individual cassettes for being in-frame and free of stop codons.
This preselection strategy is most easily accomplished by encoding different protein
affinity tags close to the 3′- and 5′-termini of the cassettes. Synthesizing mRNA-displayed
proteins from each individual DNA cassette, and purifying these upon the basis of the
presence of each of these tags, will enrich the resultant library in those sequences that
have initiated before the 5′ tag, terminated after the 3′ tag, and do not contain stop codons.
These are likely to be in-frame over their entire sequence. The full-length DNA library
should then be constructed from these preselected cassettes using RT-PCR followed by
restriction and ligation. Any reduction in diversity that results from the preselection
process is regained by the combinatorial ligation of the amplified DNA cassettes during
the assembly of the full-length library. The steps in a preselection strategy are shown in
Figure 24.5.3, and a detailed description is given in Cho et al. (2000).
Generation and
Use of
Combinatorial
Libraries
24.5.3
Current Protocols in Molecular Biology
Supplement 53
Step
Synthesis and denaturing PAGE
purification of DNA cassette(s),
which when ligated together will
encode the complete library
Product
ssDNA cassette(s)
PCR amplification of DNA cassette(s)
dsDNA cassette(s)
Transcription of DNA cassette(s)
mRNA cassette(s)
ORF
Denaturing PAGE purification of
RNA cassette(s)
Purified mRNA cassette(s)
ORF
Synthesis and denaturing PAGE of
DNA splint that anneals to and aligns
3′-end of RNA and 5′-end of DNA
linker to encourage ligation
DNA s plint
Synthesis and denaturing PAGE of
DNA linker that terminates in puromycin
DNA linker
P
Kinase (5′-phosphorylation) of DNA linker
Kinased DNA linker
P
Splinted ligation of RNA cassette(s) to
DNA linker terminated in puromycin
mRNA display template(s)
of cassette(s)
ORF
Translation of mRNA display template(s)
of cassettes and high salt incubation
and/or incubation at – 20 C
Protein cassettes with both affinity
tags displayed upon their stop
codon-free and frameshift-free
mRNA display templates
ORF
Misinitiated protein cassettes without
an N-terminal affinity tag displayed
upon partly untranslated mRNA
display templates
Frameshifted protein cassettes without
a C-terminal affinity tagdisplayed upon
mRNA display templates with deletions
KEY:
P
DNA
RNA
protein
puromycin
mRNA display templates with stop
codons not displaying proteins and
untranslated mRNA display templates
Free protein cassettes
P
tag 1 tag 2
P
ORF
tag 2
P
frame -
ORF shifting
tag 1
P
deletion
or
insertion
stop
ORF codon
P
tag 1 tag 2
Reticulocyte lysate mRNA
Reticulocyte lysate
Figure 24.5.3 The steps that comprise the preselection process. A DNA cassette library that, when assembled into a
full-length DNA library will encode a protein library, is enriched in those cassettes that are free of stop codons, insertions,
and deletions. These cassettes are then used to construct the full-length library that is used for protein selection using mRNA
display (continues on next page).
Protein Selection
Using mRNA
Display
RNA polymerase promoter sequence
The library will need a transcription promoter at the 5′-end. This can be added or changed
by PCR. The pr omoter s equences , TAATACGACTCACTATA and
TTCTAATACGACTCACTATA, have both been successfully used. Transcription is most
efficient if the RNA transcript starts with at least two guanines. To avoid pyrimidines (T
or C) in the first few nucleotides of the transcript, it is common for the transcribed RNA
sequence to commence with GGG.
24.5.4
Supplement 53
Current Protocols in Molecular Biology
Step
Product
Oligo(dT) cellulose
purification
Protein cassettes with both affinity tags
displayed upon their stop codon-free and
frameshift-free mRNA display templates
ORF
Misinitiated protein cassettes without an
N-terminal affinity tag displayed upon
partly untranslated mRNA display templates
ORF
Frameshifted protein cassettes without a
C-terminal affinity tag displayed upon mRNA
display templates with deletions
ORF shifting
mRNA display templates with stop codons
not displaying proteins and untranslated
mRNA display templates
tag 1 tag 2
P
tag 2
P
frame -
tag 1
P
deletion
or
insertion
stop
ORF codon
P
Reticulocyte lysate mRNA
N-terminal protein
affinity tag (such as
FLAG) purification
(optionally repeated)
C-terminal protein
affinity tag (such as
His6) purification
Protein cassettes with both affinity tags
displayed upon their stop codon-free and
frameshift-free mRNA display templates
ORF
Frameshifted protein cassettes without a
C-terminal affinity tag displayed upon mRNA
display templates with deletions
ORF shifting
Protein cassettes with both affinity tags
displayed upon their stop codon-free and
frameshift-free mRNA display templates
tag 1 tag 2
u
frame -
tag 1
P
deletion
or
insertion
ORF
tag 1 tag 2
P
(optionally repeated)
Reverse transcription
with the splint
as primer
Protein cassettes with both affinity tags
displayed upon their stop codon-free and
frameshift-free and reverse transcribed
mRNA display templates
PCR amplification
dsDNA cassette(s) that are in-frame at
both their 3′ and 5′-ends and free
of stop codons
Restriction, native
PAGE purification,
ligation, native PAGE
purification, optionally
repeated one or
more times
Full-length DNA library encoding an open
reading frame substantially free of stop
codons, deletions, and insertions
ORF
tag 1 tag 2
P
preselected
cassettes
KEY:
DNA
RNA
P
protein
puromycin
Figure 24.5.3 Continued.
Translation enhancer sequence
The library will need a translation enhancer before the initiating methionine codon; the
truncated 5′-UTR from the Tobacco Mosaic Virus sequence (ACAATTACTATTTACAATTACA) has been used successfully.
Initiating methionine
The initiating methionine (ATG) immediately follows the translation enhancer sequence.
N-terminal constant ORF sequence
It is extremely helpful to have amino acid sequences within the protein that can act as
affinity tags. These are invaluable when purifying the displayed proteins. If two different
affinity tags are used and these are located close to each of the termini of the expressed
Generation and
Use of
Combinatorial
Libraries
24.5.5
Current Protocols in Molecular Biology
Supplement 53
Step
Product
Synthesis and denaturing
PAGE purification of fulllength DNA library (skip
this step if library is already
dsDNA)
Full-length ssDNA library
PCR amplification of DNA
library (skip this step if library
is already amplified)
dsDNA library
Transcription of DNA library
mRNA library
Denaturing PAGE
purification of mRNA library
Purified mRNA library
Synthesis and denaturing
PAGE of DNA splint that
anneals to and coaligns 3′-
DNA splint
ORF
ORF
end of RNA and 5′-end of
DNA linker to allow ligation
Synthesis and denaturing
PAGE of DNA linker that is
5′-terminated with
puromycin
DNA linker
P
Kinase (5′-phosphorylation)
of DNA linker
Kinased DNA linker
P
Splinted ligation of mRNA
library to DNA linker
Library of mRNA display
templates
ORF
Translation of mRNA
display template and high
salt incubation and/or
incubation at – 20 C
Protein library displayed
upon mRNA display
templates
ORF
P
P
Free proteins
KEY:
P
DNA
RNA
protein
puromycin
Free mRNA display
templates
ORF
P
Reticulocyte lysate mRNA
Reticulocyte lysate
Figure 24.5.4 The steps that comprise a single round of selection and amplification in a protein selection using
mRNA display (continues on next page).
protein, then they may be used to ensure that the expressed protein, mRNA-displayed or
not, is full-length and in-frame at both ends. This double purification may optionally be
performed when the DNA library is still at the individual cassette stage in order to increase
the proportion of library members that are full-length, in-frame, and do not contain stop
codons (see Fig. 24.5.3). FLAG and His6-tag sequences are obvious choices.
Protein Selection
Using mRNA
Display
Some constant amino acid sequence is likely to result from the ligation junctions used to
construct libraries from synthetic DNA with long random regions; the identity of these
24.5.6
Supplement 53
Current Protocols in Molecular Biology
Step
Product
Oligo(dT) cellulose
purification
Protein library displayed
upon mRNA display
templates
ORF
Free mRNA display
templates
ORF
P
P
Reticulocyte lysate mRNA
Protein affinity tag (such as
FLAG or His6) purification
Protein library displayed
upon mRNA display
templates
ORF
Reverse transcription with
the splint as primer
Protein library displayed
upon reverse transcribed
mRNA display templates
ORF
Selection step
Selected members of the
protein library displayed
upon reverse transcribed
mRNA display templates
PCR amplification of
selected fraction of library
Input dsDNA library for the
next cycle of selection and
amplification
Repeat procedure from the
start until the proportion of
the library detected in the
selected fraction has peaked
or reached a plateau, at
which point the library
should be sequenced and
individual members should
be assayed for activity.
Individual functional
proteins that pass the
selection test with which
they have been challenged
P
P
ORF
P
KEY:
P
DNA
RNA
protein
puromycin
Figure 24.5.4 Continued.
amino acids and their frame can be adjusted in order to avoid “inappropriate” amino acids
such as several consecutive hydrophobic residues or a proline. What is considered to be
inappropriate will depend upon what the library is to be used for. Regardless of how the
library is to be constructed, having different restriction sites encoded within the 3′ and 5′
ends of the open reading frame will allow for the changing of one or other of the protein
terminal constant sequences if design considerations change, or should reengineering be
required for troubleshooting.
Long stretches of uridines in the RNA sequence should be avoided since these may anneal
to the poly(dA) sequence of the puromycin-terminated linker oligonucleotide. This will
interfere with the ligation used to construct the mRNA display template. Also, the
double-stranded RNA-DNA, which can result from the self-annealing of the resulting
Generation and
Use of
Combinatorial
Libraries
24.5.7
Current Protocols in Molecular Biology
Supplement 53
mRNA display template, will act as a substrate for the RNase H, which is present in
reticulocyte lysate, resulting in degradation of the mRNA display template.
C-terminal constant ORF sequence
All of the considerations described with regard to the N-terminal constant ORF sequence
also apply to the C-terminal constant ORF sequence. There are also additional considerations that are specific to the C-terminal sequence.
In the synthesis of the mRNA display template (see Fig. 24.5.4), the 3′ terminus of the
mRNA encoding the ORF is ligated to a short DNA oligonucleotide, which is itself
3′-terminated with puromycin (the linker). The 3′ terminus of the mRNA and the 5′
terminus of the DNA linker are coannealed to a short DNA oligonucleotide (the splint),
which is complementary to both of them and presents the junction to be ligated as a nicked
double-stranded nucleic acid. Consequently, the secondary structure of the splint, the
mRNA, and the linker should be checked for self-structure likely to interfere with the
assembly of the splinted nicked double-stranded complex. This can most easily be done
using a computer algorithm such as MFOLD (http://www.ibc.wustl.edu/~zuker/rna/form1.cgi).
The mRNA-displayed protein is attached to the mRNA via its C terminus. It seems
appropriate, therefore, to make the last few amino acids at the C terminus “structureless,”
i.e., a stretch of glycines and serines. Incorporating extra methionines into the constant
sequence will increase the signal resulting from the incorporation of 35S-methionine into
the protein. Extra methionines are best placed in the C-terminal constant region downstream of the C-terminal protein affinity tag. Should they result in misinitiation, then the
resultant proteins will not contain either of the protein affinity tags and will not copurify
with the mRNA-displayed full-length proteins. Placing out-of-frame stop codons close
to the C terminus, either before or after the tag, in both the +1 and −1 frames will prevent
those members of the library that are out-of-frame at the C terminus from forming
mRNA-displayed proteins. This is especially useful in the context of a preselection (see
Fig. 24.5.3). Incorporating a protein kinase (phosphorylation) site to allow 32P-labeling
of the protein may assist in assaying the free proteins.
Statistical appearance of different amino acids within the random region
Most DNA libraries designed for protein selection encode a wide range of amino acids
in their random regions. Using a mixture of all four nucleotides at each of the three
positions in the library codons will ensure that all 20 amino acids have some probability
of appearing in every position of the resulting protein sequence. During the library design
process it is helpful to consider the average composition of amino acids that will result
from the chosen nucleotide distribution, the consequent average proportions of hydrophobic and charged amino acids, and whether these proportions are suitable for the library
and its intended target. Additionally, it is useful to consider the frequency with which
certain individual amino acids will appear in the random region. Cysteines can coordinate
transition metal ions or form disulfide bonds, histidines can accept or donate protons or
coordinate transition metal ions, and prolines may disrupt secondary structure. Other
specific amino acids may be suitable for interacting with intended substrates.
Protein Selection
Using mRNA
Display
Frequency of stop codon appearance in random libraries
Using a mixture of all four nucleotides at each of the three positions in the library codons
in the DNA encoding the protein library will also introduce stop codons. This will reduce
the proportion of expressed protein that is displayed because stop codons will cause the
ribosome to release the mRNA before the terminating puromycin is able to react with the
nascent peptide. By altering the proportions of the nucleotides in the DNA synthesis
mixtures, the frequency of stop codons can be reduced, although this will also influence
24.5.8
Supplement 53
Current Protocols in Molecular Biology
the proportions of other amino acids in the library. Alternatively, the DNA cassettes used
to construct the library can be synthesized from mixtures of nucleotides chosen only with
regard to the average amino acid composition they encode. The resultant cassettes can
then be “preselected” as described above in order to enrich the resultant library with those
that do not contain stop codons. As shown in Fig. 24.5.3, if this procedure is done using
two different affinity tags at the different termini of the ORF, then the resultant library
will also be enriched in cassettes without deletions. A nucleotide distribution encoding a
target amino acid composition can be iteratively approached using computer algorithms
that are available on the Internet (e.g., http://gaiberg.wi.mit.edu/cgi-bin/Combinatorial
Codons; Wolf and Kim, 1999).
Codon usage
Statistical studies of sequenced genomes have shown that, for the majority of amino acids
for which more than one codon exists, certain codons appear more frequently than others.
The more frequently used codons tend to end in G or C, which may relate to the extra
stability that results from having three hydrogen bonds in the wobble position of the
tRNA-mRNA complex. Consequently, it may be helpful to design the library so that G
and C are the only nucleotides in the third position of each codon. The symmetry of the
genetic code is such that the composition of the wobble position has very little effect upon
the composition of the resultant protein, so this approach need not affect the amino acid
composition of the protein library it encodes. However, this strategy will amplify the effect
that frameshifts will have upon the resultant proteins.
Periodicity and stop codon avoidance
Some mixtures of nucleotides may result in the total omission of stop codons, (VNN)n
for example (where V is a mixture of A, G, and C) does not encode any stop codons.
Unfortunately, such approaches always result in the loss of some of the 20 amino acids;
(VNN)n also does not encode Cys, Phe, Trp, and Tyr for example. Mixing different such
codons together can give a DNA library that encodes all 20 amino acids but no stop
codons. This approach, however, necessarily introduces an element of design into the
library, since the statistically different codons must be placed at specified points in the
sequence, most usually in a periodic fashion. Periodicity can also result in an increased
tendency for protein structural units to be encoded; for example, alternate hydrophobic
and hydrophilic amino acids will encourage the formation of β sheets, while alternate
pairs of hydrophobic and hydrophilic amino acids will encourage the formation of α
helices. Alternatively, there are nonperiodic nucleotide distributions that reduce the
occurrence of stop codons to ∼1%. For an example of this approach see LaBean and
Kauffmann (1993).
Mutagenesis
Mutagenic procedures such as mutagenic PCR (Cadwell and Joyce, 1992) or DNA
shuffling (Stemmer, 1994) may be used to generate a diverse DNA library from a less
diverse DNA library or a single DNA sequence (a minimum of two homologous sequences
is required for DNA shuffling). Mutagenic procedures may be used to generate the initial
DNA library for an mRNA display protein selection, or to increase the diversity at any
stage between cycles of selection and amplification during an mRNA display protein
selection. In general, in vitro selection proceeds by the gradual loss of diversity as
functional sequences are preferentially amplified and nonfunctional sequences are lost.
Consequently, increasing the diversity of the library at a stage after the first selection step
may appear to be a retrogressive step; however, this is not necessarily the case. Protein
libraries that are generated by stochastic means, such as those generated from DNA made
on a DNA synthesizer using mixtures of nucleotide phosphoramidites, sample protein
sequence space extremely sparsely. For example, a member of a library of 1013 proteins
Generation and
Use of
Combinatorial
Libraries
24.5.9
Current Protocols in Molecular Biology
Supplement 53
each of which is 72 amino acids long, with each amino acid being equally likely to appear
at each position, will, on average, have a sequence with 26 differences (“mutations”) from
the next most similar member of the library. If a solution to a particular problem is chanced
upon using such a library, it is highly unlikely to be the optimal solution. The solution in
question may be a small number of mutations away from many other superior solutions,
but the initial library is extremely unlikely to have contained any of the sequences in
question because the sampling was so sparse. Once a selection strategy has given one or
many such nonoptimal solutions, one or more mutagenic steps will enable the exploration
of the local sequence space around such solutions and, after subsequent selection, is likely
to yield improved solutions closely related to one or more of the originally selected
sequences.
Specific directions for the preparation of a DNA library for an mRNA display selection
vary greatly depending upon the source of the DNA, the selection target, and the precise
assembly strategy chosen. See UNITS 24.2, 24.3, & 24.4 for further details. A more detailed
discussion of both preselection and mRNA display library construction strategy is given
in Cho et al. (2000). A generalized library construction strategy is also shown in Fig.
24.5.5. Once the DNA library has been synthesized, but before the selection has commenced, it is important to sequence some of the individual library members to ensure that
the library sequence is as intended, and that the proportion of error-free sequences is
appropriate for the selection strategy envisaged.
Selection
In vitro selection strategies, such as mRNA display, offer a generalized method for the
discovery of functional molecules, only if the molecules in question can be enriched upon
the basis of their function and subsequently directly amplified. Enrichment upon the basis
of function is termed selection. The appropriate design of the selection step is absolutely
crucial to the success of the project as a whole. Most in vitro selection experiments have
been performed upon libraries of nucleic acids rather than proteins (Wilson and Szostak,
1999), although some protein selection experiments have been successfully performed
using ribosome display (Jermutus et al., 1998) and most recently mRNA display (A.D.
Keefe and J.W. Szostak, pers. commun.). Phage display (Smith and Petrenko, 1997) and
the 2-hybrid system (Fields and Song, 1989; Colas et al., 1996) are similar in vivo
techniques that have also been successfully used for the selection of functional peptides
and proteins.
In vitro selections are divided into two main categories, (1) selections for aptamers (i.e.,
specific binding to a chosen target) and (2) selections for catalysts (i.e., enzymes). This
is not an appropriate place for an exhaustive overview of the various approaches that have
been used to discover new aptamers and catalysts, but some general points can be made.
Protein Selection
Using mRNA
Display
Aptamer selections
Aptamer (specific binder) selections are in general undertaken by incubating the library
with the immobilized target molecule. The target molecule immobilization is by way of
covalent attachment to a solid matrix such as agarose, usually through a spacer molecule.
Many immobilized target molecules are commercially available. After incubation, the
flowthrough is drained away, the immobilized target molecules are washed several times,
and then an elution fraction is collected by incubating the matrix and the immobilized
target molecules with an elution buffer that contains the dissolved target molecule. Those
library members that are contained in the elution fraction are amplified, and the process
is repeated until functional molecules dominate the library. At this stage, the functional
molecules are identified by cloning and sequencing. It is important to realize that in the
early rounds of selection, the vast majority of the library members contained in the elution
24.5.10
Supplement 53
Current Protocols in Molecular Biology
fraction are nonspecific binders or nonbinders. Consequently, several rounds of selection
and amplification will be required before the functional (specific binding) sequences
dominate the library.
The composition of the selection binding and selection elution buffers is likely to
influence the aptamers that are ultimately discovered using this system. It may be
important to use a buffer that promotes protein folding, but discourages aggregation. The
use of high concentrations of cosmotropic compounds such as ammonium sulfate will
promote folding, while the use of nonionic detergents such as Triton X-100 will discourage aggregation. The oxidation potential of the buffer should also be considered. The
inclusion of a reducing agent such as DTT is likely to lead to the selection of protein
aptamers active under reducing conditions, while the inclusion of oxidizing agents such
as glutathione disulfide is likely to lead to the selection of protein aptamers active under
oxidizing conditions. It is important to ensure that the binding and elution buffers are as
similar as possible. Changes in ionic strength and/or pH between these buffers will
increase the proportion of nonspecific binders in the elution fraction, possibly to such an
extent that the specific binders will never dominate the library and consequently will never
be identified. Obviously the binding and elution buffers cannot be identical since the
elution buffer contains the target molecule. In order to make the selection binding and
BbsI
T7 TMV FLAG
BbvI
BbvI
random library
His6 linker
BbsI
restrict
+
ligate
BbvI
BbsI
restrict
+
ligate
Figure 24.5.5 Assembly of a full-length mRNA display template library from DNA cassettes that
result from the RT-PCR amplification of pre-selected mRNA display cassette templates. In this
example, the cassettes are divided into 2 aliquots that are restricted with either BbvI or BbsI,
subsequent ligation with T4 DNA ligase gives a new cassette in which the DNA between the
restriction sites doubles in length while the flanking regions remain the same. The doubling of the
length of this region may be repeated any number of times by repeating the restriction and ligation
process.
Generation and
Use of
Combinatorial
Libraries
24.5.11
Current Protocols in Molecular Biology
Supplement 53
selection elution buffers as similar as possible, it may be desirable to balance the effect
of the target molecule upon the elution buffer by adding a similar molecule to the binding
buffer. If the target molecule interacts with one of the buffer components, such as a
nucleotide with magnesium, it may be desirable to add back an extra amount of this
component to maintain the free concentration of the component in question at the
concentration of that in the binding buffer. It is also possible to collect the elution fraction
by disrupting the binding with denaturant or extremes of pH, although the background is
likely to be higher.
Catalytic (enzyme) selections
Catalytic (enzyme) selections are a little more complex in a conceptual sense—although
carefully designed, they can have lower intrinsic background rates than aptamer selections, and consequently be quicker and easier to perform in the laboratory. Enzyme
selections must be performed in such a manner that those sequences which catalyze a
reaction are separated from those that do not. The most obvious way to achieve this
separation is to arrange the selection so that library members that catalyze the desired
reaction covalently attach themselves to the substrate. If the substrate is in turn covalently
attached to a tag (such as biotin), then the attachment of the tag to library members that
catalyze the reaction can be used as a basis for the separation of these library members
from those that do not catalyze the reaction (such as by binding to immobilized streptavidin). Alternatively the substrate may be immobilized before it is incubated with the
library. Since both of these approaches effectively turn the catalysis selection into a
binding selection, there will still be a background rate of isolation of sequences that do
not catalyze the desired reaction. Consequently it may still be necessary to perform several
rounds of selection and amplification before functional sequences dominate the library.
Similar catalytic selection strategies can be envisaged in which all of the library members
are immobilized, and those that successfully catalyze the desired reaction cut themselves
free.
It should be noted that since the successfully selected library members are required to
modify themselves in some respect, they are not acting as catalysts in the true sense of
the word. However, molecules selected using such a procedure are usually easily reengineered to give true catalysts by detaching the active site part of the selected construct from
the substrate part. One consequence of this limitation is that it is difficult to select for
catalysts that act faster than the rate with which they can be manipulated in the laboratory,
and it is not possible to select for catalysts with high turnover rates at all. Strategies in
which the library member is encapsulated along with several substrate molecules may
lead to systems in which the selective pressure is directly for the turnover rate.
Selection controls
The importance of selection controls cannot be emphasized strongly enough. mRNA
display selection protocols in which functional library members are enriched much less
than ten-fold over nonfunctional library members are unlikely to lead to the isolation of
functional library members in the laboratory. Biases are present in many steps of the
mRNA display amplification protocol, especially translation and protein display efficiencies, and these can overwhelm the enrichment in functional members that results from
the selection step. Suitable positive controls are molecules known to catalyze or bind to
the intended substrate, and need not be proteins, although the best control will usually be
a similar functional protein displayed upon its reverse-transcribed mRNA display template.
Protein Selection
Using mRNA
Display
24.5.12
Supplement 53
Current Protocols in Molecular Biology
Nomenclature
mRNA-displayed proteins are referred to by a variety of names in the literature, such as
“RNA-protein fusions” and “profusions.”
PREPARATION AND PURIFICATION OF mRNA-DISPLAYED PROTEINS
This protocol describes the preparation of the mRNA display template from an appropriate DNA template, DNA splint, and DNA linker 3′-terminated with puromycin, the use
of the mRNA display template to prepare mRNA-displayed proteins and their subsequent
purification, and an example selection. The protocol steps are also shown in Figure 24.5.4.
For additional details see Liu et al. (2000).
BASIC
PROTOCOL 1
Materials
DNA library
1 M MgCl2
100 mM nucleotide triphosphate solutions
10× transcription buffer (see recipe)
Deionized, ultrafiltered water
10 U/µl T7 RNA polymerase
Solid EDTA
Urea
0.5× TBE buffer (APPENDIX 2)
3 M NaCl
100% and 70% ethanol
100 mM EDTA
Puromycin-terminated DNA linker
100 mM ATP
T4 polynucleotide kinase buffer
T4 polynucleotide kinase
10× T4 DNA ligase buffer
10 U/µl T4 DNA ligase
3 M potassium acetate solution, pH 5.3
Rabbit reticulocyte lysate translation kit (e.g., Red Nova Lysate kit, Novagen)
Control RNA
12.5× methionine-free translation mix
2.5 M potassium chloride
25 mM magnesium acetate
Nuclease-free water
Rabbit reticulocyte lysate
35
S-methionine
Electroeluter (VWR or Schleicher & Schuell)
Denaturing PAGE gel (UNIT 2.12)
Gel filtration columns (Pharmacia)
Additional reagents and equipment for preparative denaturing PAGE purification
(UNIT 2.12), determining nucleic acid concentration by spectrometry (APPENDIX
3D), synthesis of oligonucleotides (UNIT 2.11), and SDS-PAGE in Tris-tricine
buffer systems (UNIT 10.2A)
Generation and
Use of
Combinatorial
Libraries
24.5.13
Current Protocols in Molecular Biology
Supplement 53
Transcribe DNA
1. Make up a 1-ml transcription reaction on ice as follows. Add the T7 RNA polymerase
last.
DNA library (add volume sufficient for 5 to 50 nM final concentration)
35 µl 1 M MgCl2
50 µl each 100 mM nucleotide triphosphate (final 5 mM each NTP)
100 µl 10× transcription buffer (final 1×)
Up to 980 µl deionized, ultrafiltered water
20 µl 10 U/µl T7 RNA polymerase (final 200 U/ml).
Incubate the transcription reaction for 3 to 16 hr at 37°C. Halt the reaction by cooling
on ice, or by adding solid EDTA to a final concentration of 50 mM.
The size of the transcription reaction can be adjusted to give an appropriate amount of
RNA, but care should be taken to ensure that the diversity of the DNA used is several times
larger than the diversity of the displayed proteins that will ultimately result. The effect of
varying the concentration of MgCl2 should be explored in pilot transcriptions.
Purify RNA
2. Purify resultant RNA using denaturing PAGE (UNIT 2.12). Add solid urea to the
transcription reaction to give a final concentration of 5 M and solid EDTA to give a
final concentration of 50 mM, heat for 2 min at 90°C, and load onto a denaturing
PAGE gel.
3. After the gel has been run, visualize by UV-shadowing and excise the band containing
the purified RNA. Extract the RNA into 300 mM NaCl by passive elution or into 0.5×
TBE buffer in an electroeluter according to the manufacturer’s instructions.
4. Precipitate the RNA by adding 3 M NaCl (final concentration 300 mM) and 2.5
volumes of 100% ethanol. Cool for 20 min at −80°C or overnight at −20°C.
5. Centrifuge for 10 min at 12,000 × g, 4°C. Decant the supernatant, wash the pellet
with 70% ethanol, dry under reduced pressure, bring up to 0.5 ml with deionized,
ultrafiltered water, and measure the concentration by UV-visible spectroscopy at 260
nm.
Further instructions may be found in UNIT 2.12.
This purification step separates truncated RNA molecules and PCR primers from the
full-length RNA transcripts. It is important to remove the PCR primers from the transcribed
RNA since they will inhibit the formation of the mRNA displayed proteins in the translation
step.
Synthesize linker
6. Synthesize the linker, a DNA oligonucleotide 3′-terminated in puromycin, that is ∼30
nucleotides long and “unstructured” (e.g., according to one of the following examples; see UNIT 2.11 for oligonucleotide synthesis):
Example a. AAAAAAAAAAAAAAAAAAAAAAAAAAACCP.
Poly(dA) is the most obvious choice.
Example b. AAAAAAAAAAAAAAAAAAAAA999ACCP.
In example b, “9” is phosphoramidite spacer 9 (Glen Research) and “P” is puromycin,
derived from CPG-puromycin (Glen Research). This linker may give a higher yield
of displayed proteins.
Protein Selection
Using mRNA
Display
24.5.14
Supplement 53
Current Protocols in Molecular Biology
Linkers much longer or shorter than 30 nucleotides will give greatly reduced yields of
displayed proteins, or none at all.
The puromycin-terminated DNA oligonucleotide is gel purified by denaturing PAGE (UNIT
2.12), extracted from the gel, and precipitated as described earlier. Dissolve the DNA linker
in deionized water and measure the concentration using UV-visible spectroscopy at 260
nm.
Each of the spacer 9 units result in the incorporation of a triethylene glycol phosphate
ester; this adds extra flexibility to the region of the template close to the puromycin and
may result in a higher proportion of the resultant mRNA display templates displaying
protein.
7. Kinase (5′-phosphorylate) the DNA linker using polynucleotide kinase by making
up the following 1-ml kinase reaction mixture:
300 µl 100 µM DNA linker (final 30 µM)
10 µl 100 mM ATP (final 1 mM)
100 µl 10× T4 polynucleotide kinase buffer (final 1×)
490 µl water
100 µl 10 U/µl T4 polynucleotide kinase (final 200 U/ml).
8. Incubate the reaction mixture for 2 hr at 37°C, add 200 µl of 100 mM EDTA, heat
for 5 min at 90°C, and desalt on a gel-filtration column.
It is important to heat-denature the polynucleotide kinase to prevent it from acting in the
subsequent ligation reaction. The size of the kinase reaction should be adjusted to give an
appropriate amount of 5′-phosphorylated DNA linker.
Synthesize splint
9. Synthesize the splint, a DNA oligonucleotide with a sequence (reading from the 5′
end) of ≥10 nucleotides complementary to the 3′ end of the RNA library and ≥10
nucleotides complementary to the 5′ end of the linker, usually T10 (see UNIT 2.11 for
oligonucleotide synthesis methods). Purify by denaturing PAGE (UNIT 2.12).
10. Extract DNA from gel as in step 3 and precipitate as in step 4.
11. Dissolve the purified splint in deionized water and measure the concentration using
UV-visible spectroscopy at 260 nm (see step 5).
Prepare mRNA display template
12. Ligate the linker and RNA template with T4 DNA ligase in the presence of the splint
to give the mRNA display template. Set up the following 1-ml ligation reaction:
100 µl 100 µM 5′-phosphorylated DNA linker (final 10 µM)
100 µl 100µM RNA library (final 10 µM)
100 µl 100 µM splint (final 10 µM)
580 µl water.
13. Heat this mixture for 2 min at 95°C, then add 100 µl of 10× T4 DNA ligase buffer
(final 1×).
14. Vortex the resultant mixture and cool on ice for 10 minutes, allow to warm to room
temperature, then add 20 µl of 2000 U/µl T4 DNA ligase (final 40 U/ml).
15. Incubate the reaction for 20 min at room temperature. Add 150 µl of 100 mM EDTA
and 500 mg of solid urea, and heat for 5 min at 90°C.
Generation and
Use of
Combinatorial
Libraries
24.5.15
Current Protocols in Molecular Biology
Supplement 53
Table 24.5.1
Translation Reactions for mRNA Display Proteins
Final
concentration
Reagent
Control RNA
5 µM mRNA display template
5 µM unligated RNA
12.5× Met-free translation mix
8.6 µM labeled methionine
2.5 M KCl
25 mM magnesium acetate
Water
2.5× rabbit reticulocyte lysatea
Total
—
2/4/800 nM
400 nM
1×
0.69 µM
100 mM
500 µM
—
1×
A
B
C
D
E
F
1 µl
0 µl
0 µl
2 µl
2 µl
1 µl
0.5 µl
8.5 µl
10 µl
25 µl
0 µl
0 µl
0 µl
2 µl
2 µl
1 µl
0.5 µl
9.5 µl
10 µl
25 µl
0 µl
0 µl
2 µl
2 µl
2 µl
1 µl
0.5 µl
7.5 µl
10 µl
25 µl
0 µl
1 µl
0 µl
2 µl
2 µl
1 µl
0.5 µl
8.5 µl
10 µl
25 µl
0 µl
2 µl
0 µl
2 µl
2 µl
1 µl
0.5 µl
7.5 µl
10 µl
25 µl
0 µl
4 µl
0 µl
2 µl
2 µl
1 µl
0.5 µl
5.5 µl
10 µl
25 µl
aEnsure that the rabbit reticulocyte lysate is added last.
16. Gel purify ligated mRNA display template by denaturing PAGE (UNIT 2.12), extract
from gel (see step 3), and precipitate as in step 4, except use 3 M potassium acetate,
pH 5.3, in place of 3 M sodium chloride.
17. Dissolve the purified ligated mRNA display template in deionized water and measure
the concentration by UV-visible spectroscopy at 260 nm.
If the template is <500 nucleotides long, it should be possible to resolve the ligated and
unligated RNA on the PAGE gel, which will give some idea of the yield of the ligation
reaction. Otherwise, the unresolved bands will have to be co-excised from the gel and
optionally further purified using oligo(dT) cellulose as described below. It is important to
perform this gel purification even if it is not possible to resolve the ligated and unligated
RNA, since the presence of the splint in the translation reaction will greatly reduce the yield
of displayed proteins, and RNase H in the reticulocyte lysate will cause degradation of the
mRNA display template if it is annealed to the splint. It should be noted that this splinted
RNA-DNA ligation is far less efficient than the ligation of sticky-ended pieces of DNA.
Translate mRNA display template and prepare mRNA displayed proteins
Before the mRNA display template is used for large-scale translation, a small-scale
translation should be attempted alongside various control translations to aid the identification of the band on the protein gel that corresponds to the mRNA-displayed proteins.
18. Set up the translation reactions in Table 24.5.1 on ice, adding the rabbit reticulocyte
lysate last.
19. Incubate for 1 hr at 30°C, then add 1.7 µl of 1 M MgCl2 and 7.8 µl of 2.5 M KCl to
each of the reactions and allow them to stand for 5 min at room temperature.
The reaction mixtures may be optionally stored for up to 1 week at −20°C at this point.
20. Analyze the different translations using Tris-tricine SDS-PAGE as described in UNIT
10.2A, Alternate Protocol 1.
Protein Selection
Using mRNA
Display
The SDS-PAGE analysis should show a number of bands in lane A, which is the control
RNA supplied by the manufacturer; this is the positive control and demonstrates that the
translation reaction was set up correctly. Lane B is the no-template control, and may show
no bands or may show a band corresponding to tRNA charged with methionine; in either
case it should show no bands with mobilities equal to those assigned to the free protein
and to the displayed protein. Lane C should show a band of high mobility that can be
24.5.16
Supplement 53
Current Protocols in Molecular Biology
assigned to the free protein. Lanes D, E, and F should also show bands that can be assigned
to the free protein, but also bands of much lower mobility that can be assigned to the
mRNA-displayed protein. If the density of the band assigned to the displayed protein in F
is of equal or lesser density to the equivalent band in E, then the mRNA display template
is likely to be of high quality.
For better proof that the band assigned to the mRNA displayed proteins is done so correctly,
add splint (final 1 ìM) and MgCl2 (final 10 mM) to an aliquot of the translation mixture
before the salt incubation, and incubate for 30 min at 37°C. RNase H within the lysate will
cause the RNA part of the mRNA-displayed proteins to be digested and leave the protein
displayed upon the DNA linker alone, consequently the original displayed protein band
will disappear and a new band will appear of intermediate mobility between the mRNA
displayed protein and the free protein.
21. Once the displayed proteins have been observed by SDS-PAGE, optimize the
magnesium acetate and potassium chloride concentrations in the translation reaction.
Perform a succession of translations in parallel with added magnesium acetate
concentrations ranging from 0.5 mM to 2 mM and added potassium chloride
concentrations ranging from 50 mM to 200 mM.
The relative proportions of the mRNA display templates that end up displaying proteins
will be readily apparent when the samples are run out on a gel together, and the optimal
concentrations of both magnesium acetate and potassium chloride can be chosen.
If a preselection procedure is being used to synthesize the full-length mRNA display
template library, the translation magnesium acetate and potassium chloride concentrations
will have to be optimized separately for each cassette used in the preselection protocol,
and then again for the full-length library. Despite the fact that the 3′-terminal region of
each of the cassettes and the full-length library are the same, the optimal magnesium
acetate and potassium chloride concentrations for the formation of mRNA-displayed
proteins are likely to be different.
22. Prepare a 1-ml translation reaction on ice as follows, adding the reticulocyte lysate
last.
80 µl 5 µM mRNA display template (final 400 nM)
80 µl 12.5× methionine-free translation mix (final 1×)
20 µl 8.6 µM [35S]methionine (final 0.17 µM)
2.5 M KCl (as optimized)
0.5 µl magnesium acetate (as optimized)
Water to 600 µl
400 µl 2.5× rabbit reticulocyte lysate (final 1×)
Total, 1000 µl.
23. Incubate for 1 hr at 30°C, then add 65 µl of 1 M MgCl2 and 235 µl of 2.5 M KCl to
each of the above reactions and allow them to stand for 5 min at room temperature.
The translation reaction mixtures may be optionally stored for up to a week at −20°C at
this point.
One may wish to decrease the concentration of mRNA display template if there is concern
about sequence-dependent bias in translation and protein display efficiencies affecting the
distribution of different sequences in the library. As the concentration of the mRNA display
template is reduced, the proportion of this template that ends up displaying protein
increases, with a concomitant increase in the fidelity with which the mRNA library sequence
distribution is represented in mRNA-displayed protein sequence distribution. This is an
advisable precaution at all stages in which the library is of relatively low diversity.
Generation and
Use of
Combinatorial
Libraries
24.5.17
Current Protocols in Molecular Biology
Supplement 53
BASIC
PROTOCOL 2
PURIFICATION AND REVERSE TRANSCRIPTION OF THE
mRNA-DISPLAYED PROTEINS
It is extremely advisable to pilot each of the following protocol steps before attempting
the large-scale treatment of translation reaction mixture containing mRNA-displayed
proteins.
In order to separate the mRNA display templates that display proteins from those that do
not, it is necessary to use a purification step upon the basis of a protein affinity tag. In this
protocol the His6 tag is used, although other protein affinity tags may be utilized.
Materials
Oligo(dT) cellulose (Amersham Pharmacia Biotech)
Oligo(dT) binding buffer (see recipe)
1.3-ml translation reaction mRNA displayed proteins (see Basic Protocol 1)
Oligo(dT) wash buffer (see recipe)
Ni-NTA agarose (Qiagen)
Ni-NTA binding buffer (see recipe)
2-Mercaptoethanol
Ni-NTA wash buffer 1 (see recipe)
Ni-NTA wash buffer 2 (see recipe)
Ni-NTA elution buffer (see recipe)
10 mg/ml salmon sperm DNA (Life Technologies)
1 mg/ml BSA
200 µM DNA splint
5× Superscript II reverse transcriptase buffer (NEB)
0.1 M DTT
30 µl (each) 25 mM deoxynucleotide triphosphates (final 0.5 mM)
200 U/ml Superscript II reverse transcriptase (NEB)
25 mM deoxynucleotide triphosphate solutions
ATP-aptamer selection binding buffer (see recipe)
ATP-aptamer selection elution buffer (see recipe)
Chromatography columns (Bio-Rad)
Gel filtration columns (e.g., NAP-5, Amersham Pharmacia Biotech)
For additional reagents and equipment for preparative denaturing PAGE
purification (UNIT 2.12) and SDS-PAGE in Tris-tricine buffer systems (UNIT 10.2A)
Purify mRNA displayed proteins
1. Wash 20 mg of oligo(dT) cellulose repeatedly with deionized water in the chromatography column within which it will be used. Resuspend the cellulose several times
and apply positive pressure to force it to drain rapidly. Finally, wash once with
oligo(dT) binding buffer.
Oligo(dT) cellulose contains fine particulate matter that can drastically reduce the flow
rate of aqueous solutions. These fine particles can also pass through the frit during use of
the chromatography column, which will result in the loss of mRNA-displayed proteins. This
step forces the finest particles through the frit, and is especially important with the use of
larger amounts of oligo(dT) cellulose.
2. Dilute the 1.3-ml translation reaction containing the mRNA-displayed proteins with
added KCl and MgCl2 (from Basic Protocol 1) into 8.7 ml of oligo(dT) binding buffer
and incubate with the washed oligo(dT) cellulose for 15 min at 4°C with rotation.
Protein Selection
Using mRNA
Display
Retain an aliquot of the undiluted translation reaction for SDS-PAGE and scintillation
counting analyses.
24.5.18
Supplement 53
Current Protocols in Molecular Biology
3. Allow the diluted translation reaction mixture and the oligo(dT) cellulose to pass
through a chromatography column so that the oligo(dT) cellulose is retained on the
frit, and retain the flowthrough.
4. Wash three times with 1 ml oligo(dT) binding buffer.
5. Wash once with 1 ml oligo(dT) wash buffer.
6. Elute three times with 0.5 ml deionized water.
7. Analyze the undiluted translation reaction mixture, the flowthrough, and all of the
washes and elutions using Tris-tricine SDS-PAGE as described in UNIT 10.2A, Alternate
Protocol 1, and by scintillation counting.
The volume of the oligo(dT) eluate may be reduced by lyophilization by up to a factor of 5.
The oligo(dT) cellulose purification step anneals the poly(dA) region of the mRNA display
template to immobilized oligo(dT) cellulose. Consequently, mRNA display templates not
displaying protein and other mRNA molecules present in the lysate will co-purify with the
displayed proteins. Long stretches of adenines in the RNA region of the mRNA display
template should be avoided since they will also anneal to the oligo(dT) and present a
substrate for RNase H which is present in the reticulocyte lysate; this will cause mRNA
display template degradation.
The oligo(dT) cellulose purification step also presents a quick approximate method for the
absolute measurement of the concentration of mRNA displayed proteins in the translation
reaction mixture. The scintillation counter readings give the proportion of 35S-methionine
that is contained in the oligo(dT) eluates by counting equal proportions of the whole
translation mixture and the oligo(dT) eluate and dividing one by the other. The ratio of the
intensities of the bands corresponding to mRNA-displayed proteins in these two samples
on the SDS-PAGE gel gives the yield of the oligo(dT) purification.
8. Calculate the concentration of mRNA displayed proteins in the translation reaction
mixture with the following equation:
[mRNA-displayed proteins] = Y−1 × C × [methionine] × N−1
where Y is the yield of the oligo(dT) cellulose purification determined by SDS-PAGE;
C is the number of counts in the combined oligo(dT) elution fractions divided by the
number of counts in an equal proportion of the translation reaction mixture determined by scintillation counting; [methionine] is the total concentration of hot and
cold methionine in the translation reaction mixture before the high salt incubation;
and N is the average number of methionines in a single displayed protein.
This calculation assumes that the initiating methionine is still present on the protein and
that the concentration of methionine in the reticulocyte lysate is known (∼5 ìM before
addition to the translation reaction); this last error can be reduced by adding a known
amount of cold methionine to the translation reaction mixture.
A potentially more accurate method for the direct measurement of the concentration of
mRNA displayed proteins is to construct the mRNA display template using a mixture of
DNA linker that has been kinased (5′-phosphorylated) with labeled ATP as well as the cold
kinased (5′-phosphorylated) linker. This labeled template can then be translated in the
presence of only cold methionine. It is generally not possible to observe the difference in
mobility on a SDS-PAGE gel between the mRNA display template displaying protein and
the mRNA display template alone. The addition of a DNA oligonucleotide, complementary
to a region of the RNA part of the mRNA display template close to but not right at the 3′
end of the RNA, to the translation reaction mixture, as well as magnesium chloride to 10
mM, will cause the RNA part of the mRNA-displayed proteins to be digested away by RNase
H, which contaminates reticulocyte lysate, leaving proteins displayed upon the 32P-labeled
DNA linker only. These may easily be resolved from the DNA linker not displaying protein
using SDS-PAGE. The ratio between these two bands gives a more direct measurement of
Generation and
Use of
Combinatorial
Libraries
24.5.19
Current Protocols in Molecular Biology
Supplement 53
the proportion of mRNA display template that displays protein, and using this the concentration of mRNA-displayed proteins in the translation reaction mixture may easily be
calculated. The proportion of mRNA display template that ends up displaying protein can
vary from <1% to 40% depending upon the sequence, the myc epitope sequence is at the
upper end of this range.
Ni-NTA purification
The Ni-NTA purification is upon the basis of the His6 tag and is only appropriate if this
is present in the library sequence (see also UNIT 10.11).
9. Wash 100 µl of Ni-NTA agarose three times with 1 ml deionized water.
10. Mix 0.5 ml of the oligo(dT) eluate with 2× Ni-NTA binding buffer, vortex to dissolve,
add 0.7 µl of 2-mercaptoethanol, incubate with the washed Ni-NTA agarose for 1 hr
at 4°C with rotation.
The 2× Ni-NTA binding buffer is the solid residue obtained by evaporation to dryness of
1× Ni-NTA binding buffer.
11. Allow the Ni-NTA binding buffer and the Ni-NTA agarose to pass through a
chromatography column so that the Ni-NTA agarose is retained on the frit, retain the
flowthrough.
12. Perform the following washes on the chromatography column:
a. Wash two times with 500 µl Ni-NTA wash buffer 1.
b. Wash once with 500 µl of a 4:1 solution of Ni-NTA wash buffer 1:Ni-NTA wash
buffer 2.
c. Wash once with 500 µl of a 3:2 solution of Ni-NTA wash buffer 1:Ni-NTA wash
buffer 2.
d. Wash once with 500 µl of a 2:3 solution of Ni-NTA wash buffer 1:Ni-NTA wash
buffer 2.
e. Wash once with 500 µl of a 1:4 solution of Ni-NTA wash buffer 1:Ni-NTA wash
buffer 2.
f. Wash once with 500 µl Ni-NTA wash buffer 2.
g. Wash two times with 500 µl of a 19:1 solution of Ni-NTA wash buffer 2:Ni-NTA
elution buffer.
h. Elute for 30 min at 4°C with rotation two times with 250 µl Ni-NTA elution buffer.
EDTA should be added to the eluate to give 5 mM to bind to eluted Ni2+.
13. Analyze the starting material, the flowthrough, and all washes and elutions using
Tris-tricine SDS-PAGE as described in UNIT 10.2A, Alternate Protocol 1, and by
scintillation counting.
The volume of the eluate may be reduced by lyophilization by up to a factor of 5.
If the mRNA-displayed proteins are prone to aggregation, then it may be necessary to
maintain denaturing conditions throughout the Ni-NTA agarose purification process by the
addition of urea or guanidinium hydrochloride to the wash and elution buffers in addition
to that which is in the binding buffer.
If it is not desired to completely denature the mRNA-displayed proteins, the denaturant can
be omitted from all buffers including the binding buffer; using such a native Ni-NTA agarose
purification procedure is likely to result in decreased yields compared to the denaturing
Ni-NTA agarose purification procedure described above.
Protein Selection
Using mRNA
Display
The Ni-NTA agarose purification is upon the basis of the His6 tag. Alternatively, other
protein-affinity tags may be encoded within the protein sequence and used as a basis for
24.5.20
Supplement 53
Current Protocols in Molecular Biology
purification, such as the FLAG tag (see Support Protocol 1). The Ni-NTA purification will
separate the mRNA-displayed proteins from the mRNA display templates not displaying
proteins and other mRNA molecules that were not purified away in the oligo(dT) purification. The Ni-NTA agarose eluate will, however, contain contaminating free library protein
if this is present in the input mixture; in this protocol this is removed in the preceding
oligo(dT) purification. If it is desired to purify the free library protein, then it is best to
purify the translation mixture initially upon the basis of a FLAG tag, with the Ni-NTA
agarose purification subsequent to this. Additionally, a denaturing His6 tag purification
may be used to purify selected mRNA-displayed proteins away from the selection binding
buffer if more than one selection step is to be used between amplification steps and the
denaturing and renaturing of the mRNA-displayed proteins is desired.
Strong chelating agents such as EDTA, EGTA, and DTT must be avoided in Ni-NTA binding
and wash buffers since they will compete with the immobilized NTA for complexation of
the Ni2+, and may elute it from the agarose.
Purify on gel filtration column
14. On a NAP-5 gel filtration column, exchange the elution buffer into water by allowing
10 ml of deionized water to flow through the gel-filtration column.
15. Add 100 µl of 10 mg/ml salmon sperm DNA and 10 µl of 1 mg/ml BSA to 890 µl of
deionized water, vortex, and allow this to flow through the gel filtration column.
16. Allow 10 ml of deionized water flow through the gel filtration column.
17. Allow 0.5 ml of sample to flow through the gel filtration column.
18. Add 1 ml of deionized water to the column and collect the 1-ml eluate issued from
bottom of column.
19. Analyze the starting material and the elution fraction using Tris-tricine SDS-PAGE
as described in UNIT 10.2A, Alternate Protocol 1 and by scintillation counting.
Imidazole does not inhibit reverse transcription, so this buffer exchange is optional, it may
be possible to reverse transcribe the mRNA display templates by diluting the Ni-NTA eluate
directly into the reverse transcription reaction mixture. Reverse transcription may not
proceed if denaturants are present in the reaction mixture.
Reverse transcribe mRNA-displayed proteins
20. Set aside a small sample of the mRNA-displayed proteins that are not reverse-transcribed for use in the no-RT control PCR amplification.
21. Make up the following reverse transcription reaction mixture on ice. Mix mRNA
displayed proteins and DNA splint (functions as the RT primer) together first before
adding RT buffer, and add reverse transcriptase last:
900 µl mRNA-displayed proteins
15 µl 200 µM DNA splint (final 2 µM)
300 µl 5× reverse transcription buffer (final 1×)
150 µl 100 mM DTT (final 10 mM)
30 µl (each) 25 mM deoxynucleotide triphosphates (final 0.5 mM)
5 µl water
10 µl 200 U/µl Superscript II reverse transcriptase (final 1333 U/ml)
Total, 1500 µl.
Incubate the reverse transcription reaction for 50 min at 42°C.
22. Analyze the starting material and the product of the reverse transcription using
Tris-tricine SDS-PAGE as described in UNIT 10.2A, Alternate Protocol 1, and by
scintillation counting.
Generation and
Use of
Combinatorial
Libraries
24.5.21
Current Protocols in Molecular Biology
Supplement 53
The volume of the eluate may be reduced by lyophilization by up to a factor of 5. The
reverse-transcribed mRNA-displayed proteins have greater mobility on the SDS-PAGE gel
compared to those that have not been reverse transcribed. This difference in mobility
provides a simple method for the accurate assay of the proportion of the mRNA displayed
proteins which have been reverse transcribed. However, this change in mobility may only
be observed if the cDNA-RNA association is preserved during the treatment of the sample
during gel loading, which may not be the case if it is heated too strongly (much above
90°C).
It is common practice in reverse-transcription reactions to heat denature the primer and
RNA template before the addition of the reverse transcriptase; this may influence the
conformation of the mRNA displayed proteins, and depending on the project may not be
advisable. Mixing the primer and the mRNA display template together under low-salt
conditions, before the addition of the buffer, should promote their association.
The use of mRNA displayed proteins in selection experiments may yield functional RNA
sequences unless the mRNA display template is reverse transcribed before the selection
step. This will also reduce the likelihood that the mRNA display template will disrupt the
structure of the protein that it displays. Free proteins originally selected using mRNA
display may need to be incubated under reverse transcription conditions in order to achieve
their active conformations.
Purify RT products
23. Exchange the buffer into selection buffer on a NAP-5 gel filtration column according
to the manufacturer’s instructions.
24. Allow 10 ml of selection binding buffer to flow through the gel filtration column.
25. Add 100 µl of 10 mg/ml salmon sperm DNA and 10 µl of 1 mg/ml BSA to 890 µl of
selection binding buffer, vortex, and allow this to flow through the gel filtration
column.
26. Allow 10 ml of selection binding buffer to flow through column and 0.5 ml of sample
to flow through column.
27. Add 1 ml of selection binding buffer to the top of the gel filtration column and collect
the 1-ml eluate issued from bottom of column.
28. Analyze the starting material and the elution fraction using Tris-tricine SDS-PAGE
as described in UNIT 10.2A, Alternate Protocol 1, and by scintillation counting.
The selection binding buffer used here is specific to the selection being performed.
Alternatively, a protein-folding step may accompany the buffer exchange into selection
buffer. In this approach a denaturant such as guanidinium hydrochloride or urea is added
directly to the mRNA-displayed proteins after reverse transcription, and this is dialyzed
away over several hours into selection buffer. It is important to ensure that the denaturing
conditions are not so denaturing that the association between the cDNA and the mRNA
display template is broken; this may be assayed using SDS-PAGE.
BASIC
PROTOCOL 3
Protein Selection
Using mRNA
Display
SELECTION AND AMPLIFICATION OF THE mRNA-DISPLAYED
PROTEINS
Selection protocols are highly project-dependent. The following protocol was successfully used to select ATP-binding proteins from a random sequence library and is included
as an example. Cycles of selection and amplification, as described in this protocol, should
be repeated until the proportion of the resultant mRNA-displayed proteins in the selected
fraction is no longer increasing—typically, 8 to 12 cycles are required. At this point the
selected library sequences should be determined by cloning and sequencing (see Chapters
24.5.22
Supplement 53
Current Protocols in Molecular Biology
1 and 7), and individual clones should be assayed for activity under the selection
conditions both as mRNA-displayed and free proteins.
Materials
ATP agarose (Sigma)
ATP-aptamer selection binding buffer (see recipe)
Purified mRNA-displayed proteins (see Basic Protocol 2)
ATP-aptamer selection elution buffer (see recipe)
100 mM EDTA (APPENDIX 2)
1 M NaOH (APPENDIX 2)
1 M HCl
10 mg/ml salmon sperm DNA
1 mg/ml BSA
100 µM 3′ primer (specific for cDNA library)
100 µM 5′ primer (specific for cDNA library)
25 mM (each ) deoxynucleotide triphosphates
10× PCR buffer containing 15 mM MgCl2 (Boehringer Mannheim)
5 U/µl Taq DNA polymerase (Boehringer Mannheim)
25:24:1 (v/v/v) phenol/chloroform/isoamyl alcohol
Chloroform
1-Butanol
3 M NaCl
100% ethanol
Gel filtration columns (e.g., NAP-25, Amersham Pharmacia Biotech)
Additional reagents and equipment for butanol extraction (UNIT 2.1A)
Select for ATP-binding proteins
1. Wash 10 mg of ATP-agarose three times with 1 ml of deionized water followed by
two times with 1 ml of ATP-aptamer selection binding buffer.
2. Incubate 1 ml of the purified mRNA-displayed proteins, from Basic Protocol 2, with
the washed ATP-agarose for 1 hr at 4°C with rotation; drain for flowthrough.
3. Wash six times with l000 µl ATP-aptamer selection binding buffer at 4°C; allow to
stand 10 min between washes.
4. Elute six times with 250 µl ATP-aptamer selection elution buffer at 4°C; allow to
stand 10 min between elutions.
5. Assay all fractions using scintillation counting.
If the proportion of mRNA-displayed proteins in the elution fraction is high (>5%), it may
be helpful to perform more than one selection step between amplification steps. In the case
of an aptamer selection, this will necessitate the purification of the selected mRNA-displayed proteins away from the elution buffer. This purification can be performed while
preserving native conditions, and often directly in the selection buffer, upon the basis of
the FLAG tag, as described in Support Protocol 1. Alternatively, this purification can be
performed with a denaturing and renaturing step, optionally upon the basis of the His6 tag
under denaturing conditions, as described above.
Purify selected cDNA sequences that encode selected mRNA-displayed proteins
6. To 1.5 ml of eluted mRNA displayed proteins, add 200 µl of 100 mM EDTA and 200
µl of 1 M NaOH, heat for 10 min at 90°C, cool on ice, and add 200 µl of 1 M HCl.
7. Exchange the buffer into deionized water on a NAP-25 gel filtration column according to the manufacturer’s instructions.
Generation and
Use of
Combinatorial
Libraries
24.5.23
Current Protocols in Molecular Biology
Supplement 53
8. Allow 25 ml of deionized water to flow through the column.
9. Add 200 µl of 10 mg/ml salmon sperm DNA and 20 µl of 1 mg/ml BSA to 1780 µl
of deionized water, vortex, and allow this to flow through column.
10. Wash with 25 ml of deionized water and allow water to flow through the gel filtration
column.
11. Measure the sample volume and pass through column, then add a volume of deionized
water to the column such that the total volume added to the column is 2.5 ml.
12. Add 3.5 ml of deionized water to the top of the gel filtration column and collect the
3.5-ml eluate issued from the bottom of column.
With the exception of the hydrolysis step, this buffer exchange procedure may be optionally
repeated after the volume of the sample has been reduced to ≤2.5 ml by evaporation under
reduced pressure.
Amplify selected sequences by PCR
13. Amplify selected sequences by PCR (see also
mixture on ice as follows:
UNIT 15.1).
Make up a PCR reaction
3500 µl selected cDNA library (from step 12)
100 µl 100 µM 3′ primer (final 2 µM)
100 µl 100 µM 5′ primer (final 2 µM)
40 µl (each) 25 mM deoxynucleotide triphosphates (final 0.2 mM)
500 µl 10× PCR buffer containing 15 mM MgCl2 (final 1×)
735 µl water
25 µl 5 U/µl Taq DNA polymerase
Total, 5000 µl.
The number of cycles, temperatures, and durations of the incubation periods within each
cycle need to be determined for the specific library being used (UNIT 15.1). The PCR
amplification of DNA libraries should be piloted, and care should be exercised not to
over-PCR amplify DNA libraries since they will not reanneal once denatured. If PCR is
continued upon a denatured DNA library, rare sequences will be amplified to a greater
extent than common sequences, which will reduce the enrichment factor of the selected
functional sequences.
14. Perform a no-RT control (set aside in Basic Protocol 2, step 20) alongside this PCR
reaction.
In this control a small amount of the mRNA display template that has not been reverse
transcribed is used in place of the selected cDNA library. This should not give any
observable product after an equivalent amount of amplification. If it does, then either the
buffers are contaminated or the purification of the mRNA-displayed proteins is not stringent
enough. In either case the problem must be addressed or the selection is unlikely to give
the desired result. It is also often useful to perform an additional no-template control in
which no template, reverse transcribed or otherwise, is added. If this gives observable
product after an equivalent amount of amplification, then this is usually a sign of
contaminated reagents.
Mutations will be introduced into the DNA library during PCR amplification. The mutagenic rate can be decreased by using a high-fidelity DNA polymerase such as Pfu DNA
polymerase (e.g., Stratagene). The mutagenic rate can be increased by using the mutagenic
PCR protocol described in Support Protocol 2. Mutagenic procedures such as mutagenic
PCR may be used to increase library diversity by exploring parts of sequence space
proximate to the starting sequence(s).
Protein Selection
Using mRNA
Display
24.5.24
Supplement 53
Current Protocols in Molecular Biology
Purify double-stranded PCR product
15. Add 1:1 molar equivalents of 100 mM EDTA to chelate the Mg2+.
16. Vortex the PCR reaction mixture with an equal volume of 25:24:1 (v/v/v) phenol/chloroform/isoamyl alcohol, centrifuge for 1 min at 10,000 × g, room temperature, remove and retain upper aqueous phase.
17. Re-extract aqueous phase with an equal volume of chloroform three times; centrifuge
to clear on each occasion, remove and discard lower organic phase after each
centrifugation.
18. 1-Butanol extract the aqueous phase to 20% of the initial volume at minimum (UNIT
2.1A, Support Protocol 2), remove and discard the upper 1-butanol phase.
Perform extraction in a polypropylene tube, as butanol will damage polystyrene.
19. Add 3 M NaCl to final 300 mM (include the salt that originates from the PCR buffer
in calculating concentration) and 2.5 volumes of 100% ethanol.
20. Cool for 20 min at −80°C or overnight at −20°C. Centrifuge for 10 min at 12,000 ×
g, 4°C. Decant and discard the supernatant.
21. Centrifuge the pellet for 1 min at 12,000 × g, remove remaining supernatant with a
plastic pipet tip, make up in 30 mM NaCl, and measure the concentration by agarose
gel (more explicit instructions may be found in UNIT 2.12).
The dsDNA library will not re-anneal if denatured, so care should be taken not to expose
it to low-salt or high temperature conditions.
22. Transcribe the DNA into RNA, (see Basic Protocol 1) and repeat the entire procedure
(see Basic Protocols 1, 2, and 3).
FLAG TAG PURIFICATION
The FLAG tag purification may optionally be used in place of or in addition to the His6
tag purification in the purification of mRNA-displayed proteins. The FLAG tag purification is usually performed in addition to the His6 tag purification during the preselection
of individual cassettes during the library construction process. In this instance, the FLAG
tag and His6 tag are placed at opposite protein termini; purification upon the basis of the
presence of both tags ensures that the protein is full-length and in-frame at both termini.
This in turn ensures that the mRNA cassette that encodes the protein is free of insertions,
deletions, and stop codons, and is suitable for the preparation of the full-length library by
restriction and ligation of the resulting PCR-amplified cDNA sequences. In addition,
FLAG tag purification may be used to purify selected mRNA-displayed proteins away
from the selection binding buffer if more than one selection step is to be used between
amplification steps and the denaturing and renaturing of the mRNA-displayed proteins is
not desired.
SUPPORT
PROTOCOL 1
Alternatively, FLAG tag purification may be used to purify free proteins away from
reticulocyte lysate.
The FLAG purification is upon the basis of the FLAG tag sequence (DYKDDDDK) and
is only appropriate if this is present in the library (see Strategic Planning).
Additional Materials (also see Basic Protocol 1)
Anti-FLAG M2 agarose (Sigma)
FLAG clean buffer (see recipe)
FLAG binding buffer (see recipe)
FLAG peptide (Sigma)
Generation and
Use of
Combinatorial
Libraries
24.5.25
Current Protocols in Molecular Biology
Supplement 53
1. Wash 100 µl of anti-FLAG M2 agarose three times with 1 ml of FLAG clean buffer,
and then three times with 1 ml of FLAG binding buffer.
2. Exchange sample buffer into FLAG binding buffer according to the directions
presented in Basic Protocol 1 for other buffer exchanges.
Optionally, dilute the sample buffer into the FLAG binding buffer or attempt purification
directly from selection elution buffer.
3. Place 1 ml of the sample containing the mRNA-displayed proteins onto the washed
anti-FLAG agarose and incubate for 1 hr at 4°C with rotation, drain, and retain
flowthrough.
4. Wash the anti-FLAG agarose three times with 1 ml of FLAG binding buffer.
5. Elute from the anti-FLAG agarose two times with 0.5 ml FLAG binding buffer
containing 10 µM of the FLAG peptide, 30 min for each elution at 4°C with rotation.
If the FLAG tag purification is to be followed by a denaturing His6 tag purification, then
the elution fraction may be added directly to the 2× Ni-NTA binding buffer.
SUPPORT
PROTOCOL 2
MUTAGENIC PCR
Mutagenic PCR may be used to increase the diversity of the DNA library that encodes
the protein library. Mutagenic PCR may be used to generate the initial library, or to explore
parts of sequence space proximate to the starting sequence(s). A broader discussion of
the use of mutagenic PCR may be found in Cadwell and Joyce (1992).
Before the entire mutagenic protocol is enacted, it is important to pilot the PCR conditions
to ensure that primer dimers are not taking over, and that the amplification per cycle is at
least 1.7 to 1.8. The optimum PCR amplification conditions may be different from
non-mutagenic PCR amplification performed upon the same library. One may wish to
redesign the primers, since the part of the template sequence they anneal to will not be
mutagenized.
Additional Materials (also see Basic Protocol 3)
2.5 M KCl
100 mM MnCl2 solution
100 mM Tris⋅Cl, pH 8.3 (APPENDIX 2)
100 µl PCR tubes (Sarstedt)
Additional reagents and equipment for agarose gel electrophoresis (UNIT 15.1)
1. Make up the following PCR reaction mixture on ice:
Protein Selection
Using mRNA
Display
100 µl 100 µM 3′ primer (final 2 µM)
100 µl 100 µM 5′ primer (final 2 µM)
60 µl (each) 25 mM dCTP and dTTP (final 1 mM)
12 µl (each) 25 mM dATP and dGTP (final 0.2 mM)
30 µl 2.5 M KCl (final 50 mM)
10.5 µl 1 M MgCl2 (final 7 mM)
7.5 µl 100 mM MnCl2 (final 0.5 mM)
150 µl 100 mM Tris⋅Cl, pH 8.3 (final 10 mM)
943 µl water
15 µl 5U/µl Taq DNA polymerase
Total, 1500 µl.
24.5.26
Supplement 53
Current Protocols in Molecular Biology
2. Pipet 16 90-µl aliquots of PCR reaction mixture into 100-µl PCR tubes and label
them 1 to 16.
These may be stored for up to a few hours at 4°C.
3. Add the DNA library or sequence to tube 1 to give 10 nM, make up to 100 µl with
PCR reaction mix.
4. Perform 4 cycles of PCR amplification. During the final extension incubation, place
the next-numbered tube alongside the current one in the PCR block. Before the final
extension is complete but ensuring that the next-numbered tube is at the extension
temperature, transfer 10 µl of PCR reaction mixture. Retain the amplified PCR
reaction mixture at 4°C.
5. Repeat step 4 fourteen times. Every four transfers, analyze the PCR reaction using
agarose gel electrophoresis (UNIT 15.1), quantitate the bands in successive PCR
amplifications, and adjust the transfer volume in order to maintain the concentration
of amplified DNA at a constant level.
It is important not to over-PCR the DNA. If PCR amplification ceases before a concentration of 100 nM is reached, then the initial DNA concentration should be reduced accordingly.
If the initial DNA was of one or a small number of known sequences, then it is possible to
directly measure the average mutagenic rate by sequencing some of the individual library
members from the final mutagenic PCR amplification sample. Assuming that the mutagenic
rate is constant throughout the procedure allows for the direct control of the extent of
mutagenesis by choosing one, or a mixture of more than one, of the successive mutagenic
PCR amplification mixtures to serve as the source of the new DNA library. This sample
may then be further amplified with PCR, optionally with further mutation. It is expected
that the mutagenic rate will be about 0.2% per nucleotide per transfer (ten-fold amplification).
REAGENTS AND SOLUTIONS
The water used to make the following buffers should be deionized, ultrafiltered and subsequently tested for
the absence of RNase by incubation with 32P-labeled RNA and denaturing PAGE analysis. All buffers
should be analyzed similarly. For common stock solutions, see APPENDIX 2; for suppliers, see APPENDIX 4.
ATP-aptamer selection binding buffer
39.0 mg MgCl2 (mol. wt. 95.2; 4.1 mM final)
2.92 g KCl (mol. wt. 74.6; 392 mM final)
476 mg HEPES (mol. wt. 238; 20 mM final)
3.07 mg glutathione (mol. wt. 307; 2 mM final)
3.06 mg glutathione disulfide (mol. wt. 612; 1 mM final)
3.72 mg EDTA⋅2Na+ (mol. wt. 372; 100 µM final)
250 µl Triton X-100 (0.25% final)
Bring up to 100 ml with water
Store at −20°C
Deoxygenate the buffer before the addition of the glutathione by bubbling an
oxygen-free grade of an inert gas such as argon or nitrogen through it, and adjust
the pH to 7.4.
ATP-aptamer selection elution buffer
285 mg ATP⋅2Na+ (mol. wt. 569; 5 mM final)
84.7 mg MgCl2 (mol. wt. 95.2; 8.9 mM final)
2.92 g KCl (mol. wt. 74.6; 392 mM)
476 mg HEPES (mol. wt. 238; 20 mM final)
continued
Generation and
Use of
Combinatorial
Libraries
24.5.27
Current Protocols in Molecular Biology
Supplement 53
3.07 mg glutathione (mol. wt. 307; 2 mM final)
3.06 mg glutathione disulfide (mol. wt. 612; 1 mM final)
3.72 mg EDTA⋅2Na+ (mol. wt. 372; 100 µM final)
0.25 g Triton X-100 (0.25% w/v final)
Bring up to 100 ml with water
Store at −20°C
Deoxygenate the buffer before the addition of the glutathione by bubbling an
oxygen-free grade of an inert gas such as argon or nitrogen through it, and adjust
the pH to 7.4.
FLAG binding buffer
877 mg NaCl (mol. wt. 58.4; 150 mM final)
1.19 g 50 mM HEPES (mol. wt. 238; 50 mM final)
0.25 g Triton X-100 (0.25% w/v final)
Adjust the pH to 7.4 with NaOH/HCl
Bring up to 100 ml with water
Store at −20°C
FLAG clean buffer
751 mg glycine (mol. wt. 75.1; 100 mM final)
0.25 g Triton X-100 (0.25% w/v final)
Bring up to 100 ml with water
Store at −20°C
Adjust pH to 3.5 with NaOH/HCl.
Ni-NTA binding buffer
57.4 g guanidine hydrochloride (mol. wt. 95.5; 6 M final)
2.93 g NaCl (mol. wt. 58.4; 500 mM final)
1.42 g Na2HPO4 (mol. wt. 142; 100 mM final)
121 mg Tris(hydroxymethyl)aminomethane (mol. wt. 121; 10 mM final)
0.25 g Triton X-100 (0.25% w/v final)
701 µl 2-mercaptoethanol (mol. wt. 78.1; 10 mM final)
Adjust the pH to 8.0 with NaOH/HCl
Bring up to 100 ml with water
Store at −20°C
In order to prepare 2× Ni-NTA binding buffer, the 1× Ni-NTA binding buffer should
be evaporated to dryness under reduced pressure. Upon using the resultant 2×
Ni-NTA binding buffer, the 2-mercaptoethanol will have to be added again.
Ni-NTA elution buffer
2.93 g NaCl (mol. wt. 58.4; 500 mM final)
121 mg 10 mM Tris(hydroxymethyl)aminomethane (mol. wt. 121; 10 mM final)
0.25 g Triton X-100 (0.25% w/v final)
1.70 g imidazole (mol. wt. 68.1; 250 mM final)
701 µl 2-mercaptoethanol (mol. wt. 78.1; 10 mM final)
Adjust pH to 8.0 with NaOH/HCl
Bring up to 100 ml with water
Store at −20°C
Protein Selection
Using mRNA
Display
Ni-NTA wash buffer 1
48.1 g urea (mol. wt. 60.1; 8 M final)
2.93 g NaCl (mol. wt. 58.4; 500 mM final)
1.20 g NaH2PO4 (mol. wt. 120; 100 mM final)
121 mg Tris(hydroxymethyl)aminomethane (mol. wt. 121; 10 mM final)
0.25 g Triton X-100 (0.25% w/v final)
continued
24.5.28
Supplement 53
Current Protocols in Molecular Biology
701 µl 2-mercaptoethanol (mol. wt. 78.1; 10 mM final)
Adjust the pH to 6.3 with NaOH/HCl
Bring up to 100 ml with water
Store at −20°C
Ni-NTA wash buffer 2
2.93 g NaCl (mol. wt. 58.4; 500 mM)
121 mg Tris(hydroxymethyl)aminomethane (mol. wt. 121; 10 mM final)
0.25 g Triton X-100 (0.25% w/v final)
701 µl 2-mercaptoethanol (mol. wt. 78.1; 10 mM final)
Adjust the pH to 8.0 with NaOH/HCl
Bring up to 100 ml with water
Store at −20°C
Oligo(dT) binding buffer
7.46 g KCl (mol. wt. 74.6; 1 M final)
1.21 g Tris(hydroxymethyl)aminomethane (mol. wt. 121; 100 mM final)
372 mg disodium EDTA (mol. wt. 372; 10 mM final)
0.25 g Triton X-100 (0.25% w/v final)
Adjust the pH to 8.0 with NaOH/HCl
Bring up to 100 ml with water
Store at −20°C
Oligo(dT) wash buffer
746 mg KCl (mol. wt. 74.6; 100 mM final)
121 mg Tris(hydroxymethyl)aminomethane (mol. wt. 121; 10 mM final)
0.25 g Triton X-100 (0.25% w/v final)
Adjust the pH to 8.0 with NaOH/HCl
Bring up to 100 ml with water
Store at −20°C
Transcription buffer, 10×
255 mg spermidine trihydrochloride (mol. wt. 255; 10 mM final)
4.84 g Tris(hydroxymethyl)aminomethane (mol. wt. 121; 400 mM final)
770 mg DTT (mol. wt. 154; 50 mM final)
0.1 g Triton X-100 (0.1% w/v final)
Adjust the pH to 8.0 with NaOH/HCl
Bring up to 100 ml with water
Store at −20°C
COMMENTARY
Background Information
In vitro selection experiments were first successfully performed upon nucleic acid libraries,
for reviews see Szostak and Ellington (1993),
Gold et al. (1993), and Joyce (1993). Nucleic
acids are the only molecular systems that are
capable of being replicated directly in vitro and
which also can contain more than trivial
amounts of amplifiable information. Nucleic
acid selections have the advantage that the
target functional entity, and the information
encoding the functional entity, are the same.
Within nucleic acid selections, large libraries
(i.e., up to 1017 different molecules) are sub-
jected to successive cycles of selection and
amplification until functional sequences dominate the library, at which point they may be
identified by cloning and sequencing. The idea
of extending the in vitro selection approach to
proteins was an obvious one; what was not
obvious, however, was how to extract the sequence information from selected proteins in
order to permit their amplification and ultimately their identification.
One way to extract the sequence information
from selected proteins is to covalently attach
each of them to the mRNA sequence that encodes it (Roberts and Szostak, 1997; Roberts,
Generation and
Use of
Combinatorial
Libraries
24.5.29
Current Protocols in Molecular Biology
Supplement 53
Protein Selection
Using mRNA
Display
1999; Roberts and Ja, 1999). In this manner the
function (phenotype) and amplifiable sequence
information (genotype) are part of the same
molecule. Selection may be performed upon
the basis of the function of the protein, while
the protein may be amplified upon the basis of
the mRNA that encodes it and is attached to it.
The problem was how to arrange things so that
proteins may be attached to the mRNA that
encodes them in parallel while mixed within
one reaction mixture. The molecule that makes
this possible is puromycin (Fig. 24.5.1).
Puromycin is an antibiotic that functions by
inhibiting translation. It sufficiently closely resembles a charged tRNA that it is able to enter
the A-site of the ribosome and react with the
activated C-terminal of the nascent peptide.
Since this reaction results in the formation of a
stable amide bond, rather than the hydrolyzable
ester bond that connects the tRNA to the amino
acid in an amino-acyl tRNA, translation is
halted. If the puromycin is already attached to
the mRNA that is being translated, a stable
covalent linkage results between a protein and
the mRNA that encodes it and the ribosome
may be purified away.
In a conceptual sense, the most similar systems to mRNA display are phage display
(Smith and Petrenko, 1997) and ribosome display (Jermutus et al., 1998). All three systems
may be used to search nucleic acid libraries for
the functional proteins or peptides they encode.
In phage display, the protein library is encoded
within the phage genome and is expressed upon
the surface of the phage as a fusion with the
phage coat protein. Phage may be selected upon
the basis of the functionality of their surface
proteins, and the protein may then be amplified
by allowing the selected phage to replicate. The
diversity of phage display selection experiments is limited to the numbers of phage that
may reasonably be transformed or packaged,
which is ∼108 to 109. Recent advances have
shown that it is possible to display libraries of
proteins upon the surface of phage (Sche et al.,
1999), but phage display has yet to be used to
discover a new protein from an entirely random
sequence library, as distinct from a library derived from a known folded protein. In ribosome
display, paused ribosomes display the protein
library in a ternary complex with the mRNA
that encodes the displayed protein. In order to
synthesize this ternary complex, an mRNA library is prepared without a stop codon. Upon
translation of this template the ribosomes will
pause at the end of the open reading frame.
Because the ribosome is unable to release itself
from the message, it displays both the nascent
protein and the mRNA that encodes it. These
constructs may be used for in vitro selection
experiments upon the basis of the function of
the displayed nascent protein. Selected proteins
may then be amplified using RT-PCR amplification of the associated mRNA. The ribosome
display constructs are relatively large, and selections can only be performed under conditions that preserve the ribosome-mRNA-nascent protein association. Also, since the ribosome display constructs also display a
single-stranded mRNA, there is a possibility
that functional RNA sequences may be selected
in place of the desired functional proteins. This
problem can be avoided by reverse transcribing
the mRNA associated with the ribosome.
Critical Parameters
After designing and synthesizing the mRNA
display library, it is important to have it sequenced in order to ascertain the proportion of
the library which is error-free and appropriate
for the selection. If the proportion of library
members with insertions, deletions, or stop
codons is too high, the library may have to be
resynthesized with extra purification steps incorporated at the DNA cassette stage (pre-selection, see Fig. 24.5.3). Alternatively, considerable library quality improvement may result
from the careful denaturing PAGE purification
of small amounts of the DNA cassettes.
The various purification steps performed
after the initial synthesis of the mRNA-displayed proteins should be individually optimized, with assays performed by SDS-PAGE
to ascertain that the mRNA displayed proteins
are still attached to full-length mRNA. Subsequent to this, a pilot (“round zero”) purification should be performed in which the various
optimized purification steps are applied sequentially to the same sample. Only upon the
satisfactory completion of round zero should
the large-scale translation reaction be made up
for the first round of selection (“round one”).
The various purification steps that form part
of each cycle of the selection of mRNA displayed proteins must be assayed by SDS-PAGE
in order to confirm that the mRNA display
template has not become degraded at any stage
in the process.
Both positive and negative controls need to
be used to assay the selection step; this should
then be optimized to discriminate between the
two controls to the maximum possible reasonable extent. This maximal discrimination selection protocol should be adopted after round two
24.5.30
Supplement 53
Current Protocols in Molecular Biology
or three; at this stage the absolute yield of the
selection step is no longer a concern owing to
the high copy number of selected sequences
that have passed through ≥1 amplification step.
Alongside the PCR amplification that follows each selection step, a no-RT control
should be performed. In this control a small
amount of the mRNA display template that has
not been reverse-transcribed is used in place of
the selected cDNA library. This should not give
any observable product after an equivalent
amount of amplification. If it does, then either
the buffers are contaminated or the purification
of the mRNA-displayed proteins is not stringent enough. A no-template control PCR amplification will distinguish between these two
possibilities. In either case, the problem must
be addressed or the selection is unlikely to give
the desired result.
Troubleshooting
Problems that may be encountered with this
procedure are detailed in Table 24.5.2.
Anticipated Results
The results of a selection largely depend
upon how many of the initial library members
can perform the task for which they are being
selected and how well they can perform it under
the selected conditions. Ideally, the observed
activity in each round of selection will exponentially rise to a high value and then plateau.
Assuming that there are a relatively small number of members of the initial library with activity that causes them to be selected, it is likely
that several rounds of selection and amplification will have to be performed before any significant increase in activity is observed.
Once the selection activity has peaked or
reached a plateau, then the library members
should be sequenced. If there were relatively
large numbers of members of the initial library
with activity that causes them to be selected,
then the library at this stage may still be fairly
diverse. Since the cycles of selection and amplification preferentially amplify the most active members, a high-diversity library at the end
of the selection is likely to indicate a failed
selection or a selection that is not yet finished.
Successful selections are likely to yield one or
a small number of families of very closely
related protein sequences each of which has
diverged from a single ancestral protein sequence owing to errors accumulated during the
many cycles of PCR amplification to which
they have been subjected. Assays of individual
members of these selected families of se-
quences should yield mRNA-displayed proteins with the desired function; these are also
likely to be functional as free proteins, unless
the mRNA display template greatly interferes
with the conformation of the displayed protein
that it displays.
Early indications are that proteins selected
using mRNA display may fold into multiple
conformations, only some of which have the
desired functionality. This behavior causes the
proportion of the selected library observed to
demonstrate the desired activity to rise by a
factor of much less than might be expected
during successive rounds of selection. The individual selected proteins behave similarly,
whether mRNA displayed or not. Mutagenesis
and reselection of such selected individual library members, or libraries of them, has given
large families of related proteins with greatly
improved characteristics in this respect (A.D.
Keefe, G. Cho, and J.W. Szostak, pers. commun.).
It should always be borne in mind that selections will give a solution to the problem that
is set; it is up to the experimenter to arrange the
selection conditions sufficiently carefully to
ensure that this solution is a consequence of the
desired functionality.
The range of acceptable yields of various
parts of the mRNA-displayed protein selection
protocol are listed in Table 24.5.3. Observed
yields falling at the lower end of these ranges
may or may not be increased upon optimization.
Time Considerations
The construction of the library may take
anywhere between 2 weeks and 2 months. Doing pilot preparative and purifying experiments
on mRNA displayed protein may take ≥1
month. A single round of selection and amplification will take 2 to 4 days and the initial
rounds of selection may take 1 to 2 months.
Mutagenesis will take 1 to 2 weeks and subsequent rounds of selection and amplification
will take 1 to 2 months. Sequencing and assays
of selected proteins may take ≥1 month.
Literature Cited
Cadwell, R.C. and Joyce, G.F. 1992. Randomization
of genes by PCR mutagenesis. PCR Methods
Appl. 2:28-33.
Cho, G., Keefe, A.D., Liu, R., Wilson, D.S., and
Szostak J.W. 2000. Constructing high complexity synthetic libraries of long ORFs using in vitro
selection. J Mol. Biol. In press.
Generation and
Use of
Combinatorial
Libraries
24.5.31
Current Protocols in Molecular Biology
Supplement 53
Table 24.5.2 Troubleshooting Guide to Problems That May Be Encountered In Protein Selection Using
mRNA-Displayed Proteins
Problem
Possible cause
Solution
Sequencing of initial library or
library cassettes reveals many
insertions and/or deletions
Synthetic DNA is of low quality
Repeat synthesis and/or careful
denaturing PAGE purification to resolve
n from n+1 and n−1 oligonucleotides
Sequencing of initial library or
library cassettes reveals many
insertions and/or deletions and/or
stop codons
Synthetic DNA is of low quality
and/or stop codons appear in random
region as a consequence of library
design
Perform “preselection” in which mRNA
displayed proteins are synthesized at the
cassette stage; these are purified upon
the basis of the presence of both
terminal tags, and the resulting cDNA is
used to construct the full-length library
(see Fig. 24.5.3)
mRNA-DNA ligation does not yield
any/enough mRNA display template
3′-end of mRNA and/or splint have
self-structure arising from internal
complementarity
Redesign mRNA and/or splint sequences
Puromycin-terminated linker was not Repeat 5′-phosphorylation, optionally
sufficiently 5′-phosphorylated
with extra enzyme
Too much salt in the ligation reaction Desalt mRNA, splint and linker
mixture
No mRNA-displayed proteins
observed on gel
RNA is degraded
Repeat transcription and gel purification
Ligation failed
See above
mRNA display template is degraded
Repeat ligation
Redesign protein library with more
No methionines present in library
except initiating methionine which is methionines
degraded away in lysate
Oligo(dT) cellulose purification
low-yielding
Elution buffer not sufficiently
denaturing
Further deionized water washes are
needed to wash away residual salt
Ni-NTA purification low-yielding
His6 tag not accessible
Use more denaturing conditions for the
binding step or redesign library
Product precipitates
Add denaturant to the wash and elution
buffers
EDTA, EGTA, DTT, or other
chelating agents present in the
binding buffer
Redesign protocol to exclude chelating
agent
Library DNA observed in
no-template control PCR
amplification
PCR amplification components
contaminated with library DNA
Determine which PCR amplification
components are contaminated and
replace them
Library DNA observed in no-RT
control PCR amplification
Library DNA has not been purified
away from mRNA displayed
proteins, or mRNA displayed protein
purification buffers are contaminated
Increase the stringency of the mRNA
displayed protein purification protocol,
or determine which mRNA displayed
protein purification components are
contaminated and replace them
Activity does not rise through
selection
There are no functional sequences in
library
Redesign or mutagenize library and
reselect
Selection step not designed
appropriately
Test selection step with positive and
negative controls, redesign to maximize
distinction
continued
24.5.32
Supplement 53
Current Protocols in Molecular Biology
Table 24.5.2 Troubleshooting Guide to Problems That May Be Encountered In Protein Selection Using
mRNA-Displayed Proteins, continued
Problem
No families observed in sequencing
data at end of selection
Selected sequences not active as
mRNA-displayed proteins
Possible cause
Solution
Biases in PCR, transcription,
translation, or protein display
overwhelming selection bias
Adjust conditions so that biases are
reduced, especially in low-yielding
steps; e.g., reduce mRNA display
template concentration in translation
Immobilized target not accessible to
mRNA-displayed proteins
Repeat selection with different matrix
and/or linker and/or target linkage point
Not enough cycles of selection and
amplification performed
Continue with cycles of selection and
amplification
There are many sequences in the
selected library that are active
Assay individual selected sequences
Not enough cycles of selection and
amplification performed
Continue with cycles of selection and
amplification
There are no functional sequences in
library
Redesign or mutagenize library and
reselect
Selected sequences active as
Assay does not treat free proteins in
mRNA-displayed proteins, but not as exactly the same mannner as
free proteins
mRNA-displayed proteins
Selected mRNA-displayed proteins
have mRNA-dependent
conformations
Repeat assay, treating free proteins in
the same manner as mRNA-displayed
proteins, for example include the reverse
transcription step
Redesign or mutagenize library and
reselect
Table 24.5.3 Results Obtained During mRNA-Displayed Protein Selection Procedure
Step
5′-phosphorylation of DNA linker
Splinted RNA-DNA ligation
Proportion of mRNA display template displaying protein
Oligo(dT) cellulose purification
Denaturing Ni-NTA purification
Anti-FLAG purification
Gel filtration chromatography (NAP column)
Reverse transcription
Proportion of mRNA displayed proteins in initial elution
phase of aptamer selection
Proportion of mRNA displayed proteins in final elution
phase of aptamer selection
Other statistics relating to mRNA display protein selections
Number of rounds of selection until activity peaks or plateaus
Initial diversity of mRNA display library
Final diversity of mRNA display library
Range of acceptable yields
90%-100%
20%-60%
1%-40%
30%-90%
30%-90%
50%-80%
85%-100%
80%-100%
0.01%-1%
3%-60%
8-12
1012-1013
≥1-104
Generation and
Use of
Combinatorial
Libraries
24.5.33
Current Protocols in Molecular Biology
Supplement 53
Colas, P., Cohen, B., Jessen, T., Grishina, I., McCoy,
J., and Brent, R. 1996. Genetic selection of peptide aptamers that recognize and inhibit cyclindependent kinase 2. Nature 380:548-550.
Fields, S. and Song, O. 1989. A novel genetic system
to detect protein-protein interactions. Nature
340:245-246.
Gold, L., Allen, P., Binkley, J., Brown, D.,
Schneider, D., Eddy, S.R., Tuerk, C., Green, L.,
MacDougal, S., and Tasset, D. 1993. The shape
of things to come. In The RNA World. (R.F.
Gesteland and J.F. Atkins, eds.) pp. 497-509.
Cold Spring Harbor, New York.
Jermutus, L., Ryabova, L., and Plückthun, A. 1998.
Recent advances in producing and selecting
functional proteins by using cell-free translation.
Curr. Opin. Biotechnol. 9:391-410.
Joyce, G.F. 1993. Evolution of catalytic function.
Pure & Appl. Chem. 65:1205-1212.
LaBean, T.H. and Kauffman, S.A. 1993. Design of
synthetic gene libraries encoding random sequence proteins with desired ensemble characteristics. Protein Sci. 2:1249-1254.
Liu, R., Barrick, J., Szostak, J.W., and Roberts, R.W.
2000. Optimized synthesis of RNA-protein fusions for in vitro protein selection. Methods Enzymol. 317:268-293.
Roberts, R.W. 1999. Totally in vitro protein selection using mRNA-protein fusions and ribosome
display. Curr. Opin. Chem. Biol. 3:268-273.
Roberts, R.W. and Ja, W.W. 1999. In vitro selection
of nucleic acids and proteins: What are we learning? Curr. Opin. Struct. Biol. 9:521-529.
Roberts, R.W. and Szostak, J.W. 1997. RNA-peptide
fusions for the in vitro selection of peptides and
proteins. Proc. Natl. Acad. Sci. U.S.A. 94:1229712302.
Sche, P.P., McKenzie, K.M., White, J.D., and Austin,
D.J. 1999. Display cloning: functional identification of natural product receptors using cDNAphage cloning. Chem. Biol. 6:707-716.
Smith, G.P. and Petrenko, V.A. 1997. Phage display.
Chem Rev. 97:391-410.
Stemmer, W.P.C. 1994. Rapid evolution of a protein
in vitro by DNA shuffling. Nature 370:389-391.
Szostak, J.W. and Ellington, A.D. 1993. In vitro
selection of functional RNA sequences. In The
RNA World. (R.F. Gesteland and J.F. Atkins,
eds.) pp. 551-533.Cold Spring Harbor, New
York.
Wilson, D.S. and Szostak, J.W. 1999. In vitro selection of functional nucleic acids. Annu. Rev. Biochem. 68:611-647.
Wolf, E. and Kim, P.S. 1999. Combinatorial Codons: A computer program to approximate
amino acid probablilities with biased nucleotide
usage. Protein Sci. 8:680-688.
Key References
Roberts and Szostak, 1997. See above.
The first demonstration of the formation of mRNA
displayed proteins (RNA-protein fusions).
Liu et al., 2000. See above.
Describes the optimization of the synthesis and purification of mRNA displayed proteins (RNA-protein
fusions).
Cho et al., 2000. See above.
Describes the use of mRNA display and in vitro
selection to construct various types of high quality
library for use in mRNA display protein selections.
Internet Resources
http://gaiberg.wi.mit.edu/cgi-bin/
CombinatorialCodons
Combinatorial Codons is an extremely useful tool
for the design of protein libraries; it generates a
nucleotide distribution that iteratively approaches
an input amino acid distribution.
http://xanadu.mgh.harvard.edu/szostakweb/
orf.html
This site is a database of exact oligonucleotide
sequences that have been successfully used in the
construction of random, patterned, and structurebased mRNA-displayed protein libraries.
http://paris.chem.yale.edu/extinct.html
The Biopolymer Calculator is a very useful general
tool for molecular biology.
http://sun2.science.wayne.edu/%7Ejslsun2/servers/
seqanal/
A nucleic acid secondary structure prediction algorithm is given by mfold.
Contributed by Anthony D. Keefe
Massachusetts General Hospital
Boston, Massachusetts
Protein Selection
Using mRNA
Display
24.5.34
Supplement 53
Current Protocols in Molecular Biology
Directed Evolution of Proteins In Vitro
Using Compartmentalization in
Emulsions
UNIT 24.6
Eric A. Davidson,1 Paulina J. Dlugosz,1 Matthew Levy,2 and
Andrew D. Ellington1
1
2
University of Texas at Austin, Austin, Texas
Albert Einstein College of Medicine, Bronx, New York
ABSTRACT
This unit describes a protocol for the directed evolution of proteins utilizing in vitro
compartmentalization. This method uses a large number of independent in vitro transcription and translation (IVTT) reactions in water droplets suspended in an oil emulsion
to enable selection of proteins that bind a target molecule. Protein variants that bind the
target also bind to and allow recovery of the genes that encoded them. This protocol
serves as a basis for carrying out selections in emulsions, and can potentially be modified
to select for other functionalities, including catalysis. This selection method is advantageous compared to alternative selection protocols due to the ability to screen through
very large-size libraries and the ability to express and screen or select for functions that
would otherwise be toxic or inaccessible to in vivo selections and screens. Curr. Protoc.
C 2009 by John Wiley & Sons, Inc.
Mol. Biol. 87:24.6.1-24.6.12. Keywords: directed evolution r in vitro compartmentalization r emulsion
Directed evolution (e.g., generation of a diverse initial library of molecules followed by
selection for a desired function, typically carried out over iterative cycles or “rounds”
of selection and amplification) of DNA, RNA, and proteins, can be carried out using
many different methods. The goal of a directed evolution experiment is to identify one or
few members of the starting library which perform the desired function at a high level.
RNA and DNA selections can be performed in bulk solution by capturing molecules
based on binding affinity or catalytic activity, and then directly amplifying the nucleic
acids. Proteins, on the other hand, must be evolved under conditions in which genetic
material is physically or spatially linked to the translated protein product. This can be
carried out in several different ways. For example, a library can be cloned into a cell,
and the expression of a particular, functional protein can lead to selection of both the cell
and the cell’s DNA. Similarly, phage display technologies link coding DNA to proteins
displayed on the phage surface. Finally, mRNA display (Roberts and Szostak, 1997) uses
the antibiotic puromycin to create a physical link between genetic material and protein
during in vitro translation.
Most recently, methods have been developed for carrying out enzymatic reactions in the
aqueous phase of an oil/water emulsion, including DNA replication (via PCR), transcription, and translation (Tawfik and Griffiths 1998; Ghadessy et al., 2001; Agresti et al.,
2005; Levy et al., 2005). Transcription and translation can be coupled so that the entire
pathway from DNA template (containing a protein-coding gene and the necessary regulatory sequences to initiate transcription and translation) to protein can be recapitulated
ex vivo. These methods have served as the basis for selecting proteins from libraries,
one of which is described in this unit. In addition, emulsion methods can be used for
Current Protocols in Molecular Biology 24.6.1-24.6.12, July 2009
Published online July 2009 in Wiley Interscience (www.interscience.wiley.com).
DOI: 10.1002/0471142727.mb2406s87
C 2009 John Wiley & Sons, Inc.
Copyright BASIC
PROTOCOL
Generation and
Use of
Combinatorial
Libraries
24.6.1
Supplement 87
the selection of functional ribozymes (Agresti et al., 2005; Levy et al., 2005; Zaher and
Unrau, 2007).
In general, individual proteins or ribozymes can be expressed in individual compartments by distributing genes within stable, aqueous microdroplets such that the
gene:microdroplet ratio is less than 1:1. While this method is functionally similar
to traditional bacterial cloning schemes (with the aqueous compartments serving as
“artificial cells”), there can be around 1010 unique compartments per milliliter of oil
phase, which is larger than is often possible for libraries expressed in E. coli. Because
emulsion selections are carried out completely in vitro, it may also be possible to specify
reaction conditions that would otherwise be unattainable in or toxic to cells.
Once a protein or ribozyme is produced from its DNA template, functional variants can
be selected after further modification and/or amplification of the template, either before
or after de-emulsification (Tawfik and Griffiths 1998; Ghadessy et al., 2001, 2004; Doi
et al., 2004; Zheng and Roberts, 2007). For example, Taq polymerase variants have been
selected based on the selective amplification of the Taq gene by translated polymerases
within individual emulsion bubbles (Ghadessy et al., 2001). Alternatively, it has proven
possible to selectively capture a protein phenotype and the genotype that encodes it
(Sepp et al., 2002; Griffiths and Tawfik, 2003; Aharoni et al., 2005; Levy et al., 2005;
Mastrobattista et al., 2005). For example, functional β-galactosidase enzymes have been
selected by sorting emulsion bubbles containing larger amounts of fluorescent reaction
products from emulsion bubbles containing smaller amounts of these products, and
then subsequently amplifying the genes that were captured along with the fluorescence
(Mastrobattista et al., 2005). Instead of sorting emulsion bubbles, it is also possible to sort
beads that hold both gene and phenotype. For example, genes encoding a ribozyme ligase
were immobilized on beads and emulsified. Those templates that encoded functional
ribozymes were able to ligate fluorescent tags to the beads, which could be sorted from one
another following de-emulsification (Levy et al., 2005). In the method described herein, a
binding target is covalently attached to each DNA template. Following transcription and
translation, the reaction is de-emulsified, and the translated protein is captured. Functional
protein variants mediate recovery of their DNA templates by binding the target molecule
through the protein-capture step. The ultimate goal of this protocol is the identification
of protein sequences that bind the target molecule. For example, functional streptavidin
variants that bind their biotinylated templates can be selected (Levy and Ellington, 2008;
Fig. 24.6.1).
Directed
Evolution of
Proteins In Vitro
Figure 24.6.1 (figure appears on next page) Scheme for binding selections in in vitro compartments. (A) A generic template for binding selections (top), and the template for streptavidin
selections (bottom) as further described in Levy and Ellington (2008). The leftmost triangle represents the target molecule attached to the template (e.g., biotin). The promoter (T7 RNA polymerase
promoter) is required for transcription initiation while the ribosome binding site (RBS) enhances
translation initiation. The “tag” is part of the protein sequence (a hexahistidine or His6 tag in the
current example) and enables affinity purification of the translated protein. (B) Selection schema
showing recovery of a desired template and protein (light gray) and removal of inactive template
(dark gray). From top to bottom: Compartments are formed containing no more than 1 gene.
The templates are transcribed and translated to produce proteins. Some proteins will bind the
target molecule conjugated to their templates. The translated proteins must retain their templates
throughout the recovery and wash process. While nonbinding proteins will also be captured, they
will not carry their corresponding templates with them. Captured templates will be amplified by
PCR and used in subsequent rounds of selection.
24.6.2
Supplement 87
Current Protocols in Molecular Biology
A
promoter
RBS
tag
PT7
RBS
6×His
protein coding sequence
B
streptavidin
B
tag
promoter
RBS
tag
tag
protein coding sequence
promoter
RBS
tag
protein coding sequence
transcription and translation
tag
tag
tag
tag
tag
tag
promoter
RBS
tag
promoter
protein coding sequence
RBS
tag
PCR to regenerate
captured genes
protein coding sequence
protein recovery
tag
promoter
tag
RBS
tag
protein coding sequence
tag
tag
wash to remove
non-bound gene
promoter
promoter
Figure 24.6.1
RBS
RBS
tag
tag
protein coding sequence
protein coding sequence
(legend appears on preceding page)
Generation and
Use of
Combinatorial
Libraries
24.6.3
Current Protocols in Molecular Biology
Supplement 87
While setting up and incubating biological reactions contained within emulsions is surprisingly straightforward and only requires readily available molecular biology equipment, generating viable selection schemes takes very careful planning and troubleshooting. Not all proteins are amenable to emulsion selections, and for those that are, care must
be taken to ensure that the mode and stringency of selection are appropriately matched
to the capabilities of the system.
Materials
DNA of interest
Mineral oil (molecular biology grade, RNase-, DNase-, protease-free; Sigma,
cat. no. M5904)
Span-80 (sorbitane monooleate; e.g., Sigma, cat. no. S6760, or Fluka, cat. no.
85548)
Tween-80
Triton X-100
Cell-free transcription and translation system, e.g., Roche RTS 100 E. coli HY Kit
including:
E. coli lysate
Reaction mix
Amino acid mixture without methionine
Methionine
Reconstitution buffer
Tris-buffered saline (TBS; APPENDIX 2)
Quenching agent, e.g., 100 μM D-biotin (Sigma-Aldrich, cat. no. 47868) in TBS
Diethyl ether, H2 O-saturated
Tris-buffered saline/Tween 20 (TTBS; APPENDIX 2)
Anti-polyhistidine antibody bound to agarose beads (Sigma, cat. no. A5713)
Elution buffer (see recipe)
95 × 16.8 mm polypropylene (13-ml) Sarstedt tubes
1.5 and 2-ml microcentrifuge tubes
Spinplus 9.5 × 9.5 mm Teflon stir bars (VWR Scientific)
Stir plate (Corning Stirrer/Hot Plate PC-420)
90 × 50–mm (or similarly sized) glass beaker (to hold the test tube containing the
emulsion)
Positive-displacement pipettors (e.g., Microman from Gilson)
30◦ C water bath
End-over-end rotator
Additional reagents and equipment for ethanol precipitation of DNA (UNIT 2.1A), the
polymerase chain reaction (PCR; UNIT 15.1), real-time PCR (optional; UNIT 15.8),
and agarose gel purification of DNA (UNIT 2.6)
Create DNA library
1. Create a gene construct that can undergo selection for binding.
An example is given here using the gene for the streptavidin protein, which is modified to
contain a T7 RNA polymerase promoter and a ribosome binding site (RBS). In addition,
the amino terminus of the protein contains a hexahistidine tag that will allow subsequent
recovery of the translated protein. The entire expression construct is amplified with a
primer containing a biotin, so that the translated streptavidin protein can bind to its
biotinylated template.
For examples of other schemes in which proteins directly capture their own genes see
Background Information.
Directed
Evolution of
Proteins In Vitro
24.6.4
Supplement 87
Current Protocols in Molecular Biology
Table 24.6.1 Cell-Free Translation Mixtures in Emulsionsa
Lysate
Emulsion composition
References
S30 E. coli lysate
Mineral oil
4.5% Span-80
0.5% Tween-80
Tawfik and Griffiths (1998)
Mineral oil
4.5% Span-80
0.5% Tween-80
0.1% Triton X-100
Levy (2008)
Mineral oil
4.5% Span-80
0.5% Triton X-100
Griffiths (2003)
Mineral oil 4%
Abil EM90b
Chen (2008)
Mineral oil
4.5% Span-80
0.1% Triton X-100
Zheng (2007)
PUREc E. coli lysate
Rabbit reticulocyte lysate Mineral oil 4%
Abil EM90b
Ghadessy et al. (2004)
Wheat germ extract
Yonezawa (2003)
Mineral oil
4.4% Span-85
0.6% Tween 20
a A summary of the lysates used in in vitro compartmentalization experiments and the reagents used to
emulsify them.
b Evonik Degussa North America (http://www.degussa-nafta.com).
c Protein synthesis Using Recombinant Elements (New England Biolabs).
2. Create a sequence library for the protein of interest.
This is commonly done through mutagenic PCR (e.g., UNIT 8.3), but can also be done
by synthesizing a gene or primer with randomized sequence positions. For example, in
Fig. 24.6.1A, particular positions within a streptavidin gene were randomized via PCR
with a primer containing a randomized region.
The extent of mutagenesis should be confirmed by sequencing random clones from the
unselected population. Approximately ten random clones is a good starting point. More
or fewer can be sequenced at the user’s discretion.
Set up the emulsion
3. For each emulsion reaction, set up a Sarstedt tube containing 1 ml of the oil-surfactant
mixture described below with a Spinplus stir bar, and place on ice:
949.5 μl mineral oil
45 μl Span-80
5 μl Tween-80
0.5 μl Triton X-100.
This oil-surfactant mixture is optimized for an E. coli S30 transcription translation lysate;
for other lysates refer to Critical Parameters and Table 24.6.1. Because of the viscosity
of the oil, pipetting accuracy at this step is improved by using a positive-displacement
pipettor (e.g., Microman from Gilson).
4. Prepare a 50-μl in vitro transcription and translation reaction using, e.g., the Roche
RTS 100 E. coli HY Kit:
12 μl E. coli lysate
10 μl reaction mix
Generation and
Use of
Combinatorial
Libraries
24.6.5
Current Protocols in Molecular Biology
Supplement 87
12 μl amino acid mixture without methionine
1 μl methionine
5 μl reconstitution buffer
Template DNA
H2 O to 50 μl.
It is common to set up one experimental sample (containing the randomized library for
selection) plus any relevant controls, as described in Troubleshooting, below. Keep all the
reagents on ice to prevent premature initiation of transcription and translation. Proceed
to step 5 as soon as possible. Other in vitro translation kits can also be used; in each
instance, the amount of protein produced and the activities of proteins produced should
be assayed both in solution and in emulsion (see also Troubleshooting). The amount of
template DNA that should be added to the emulsion reactions differs depending on the
experiment (see Critical Parameters). In general, between 108 and 1011 genes will be
added to a 1-ml emulsion selection. These values correspond to 0.1 to 10 templates per
aqueous compartment.
5. Move the tube containing the oil-surfactant mixture (from step 3) into a beaker
containing ice water. Position the beaker so that the tube in the beaker is in the center
of the magnetic stir plate and stir the mixture at 1150 rpm (“high” setting) for 1 min.
6. While stirring the oil-surfactant mixture, slowly add (drop-by-drop over 1 min) the
50-μl in vitro transcription/translation reaction from step 4 to the mixture. Continue
to stir for an additional 3 min.
Accumulate protein
7. Transfer the emulsion to a 2-ml tube and incubate at 30◦ C for 1 to 4 hr.
The emulsified translation reaction is viscous and difficult to pipet without significant
loss of material when using normal air-displacement pipettor. For this reason, we suggest
using positive-displacement pipettors (e.g., Microman from Gilson) to ensure complete
transfer of the reaction.
The extent of protein accumulation should be monitored by gel electrophoresis (UNIT 10.2A)
and staining (UNIT 10.6) or immunoblot analysis (UNIT 10.8).
Break the emulsion
8. Add 500 μl of TBS containing 100 μM biotin (for streptavidin).
This step should stop any further transcription and translation. Addition of the (biotin)
quenching agent will ensure that (streptavidin) proteins will not bind additional
(biotinylated) genes after the emulsion has been broken. The increase in the volume
of the aqueous phase also makes the solution easier to work with in subsequent extraction
steps.
100 μM free biotin is a reasonable starting concentration. The effect of a range of
concentrations (typically from micromolar to millimolar) of quencher can be tested prior
to the first round of selection to more accurately determine the effect on a round of
selection. As the selection progresses through multiple rounds of selection, recovery,
and reamplification, with functional genes being enriched within the library, it may be
desirable to increase the stringency of selection (see discussion of Selection, enrichment,
and stringency under Troubleshooting). Increasing the concentration of quencher in this
step is a way in which the selection stringency can be increased.
9. Add 1 ml of water-saturated diethyl ether. Vortex the reaction, then microcentrifuge
5 min at 13,000 × g, room temperature. Remove and discard the solvent (upper)
phase. Repeat ether extraction two more times.
Directed
Evolution of
Proteins In Vitro
The ether is used to break the emulsion and remove the surfactants. Since ether is a
denaturant for some proteins, the robustness of the binding protein to de-emulsification
should be assayed in advance.
24.6.6
Supplement 87
Current Protocols in Molecular Biology
10. Remove any excess ether by vacuum centrifugation for 5 min at room temperature.
Recover translated proteins and bound genes
11. Add 500 μl of TTBS containing 100 μl of an anti-polyhistidine antibody agarose
resin.
The beads are listed as capable of binding 5 nmol of polyhistidine-tagged protein per 1ml
of settled resin.
The amount of resin required may have to be optimized based on how much protein is
produced in the reaction and on the capacity of the resin. While the guidelines provided by
suppliers are a reasonable starting point, preliminary capture experiments should always
be carried out.
12. Incubate at room temperature for 30 min on an end-over-end rotator.
End-over-end rotation may facilitate the binding of the His6 -tag to the anti-polyhistidine
antibody. Stringency can be increased at this step by increasing the incubation time and
thus the time during which each protein must continuously bind the target molecule attached to its template. Release and rebinding is reduced by the presence of a competitor—
in this case, excess biotin.
13. Microcentrifuge the reaction 5 min at 13,000 × g, room temperature. Carefully
remove and discard the supernatant without disturbing the agarose resin pellet.
14. Add 1 ml of TTBS to the resin. Wash the resin by gently inverting or flicking the
tube. Microcentrifuge the reaction 5 min at 13,000 × g, room temperature. Carefully
remove and discard the supernatant without disturbing the agarose resin. Repeat this
wash step three times.
15. Add 400 μl of elution buffer to the agarose resin pellet. Vortex the reaction. Microcentrifuge the reaction 5 min at 13,000 × g, room temperature. Remove the
supernatant and place it in a clean 1.5-ml microcentrifuge tube. Repeat this step once
and combine the two elution fractions.
This step denatures the anti-polyhistidine antibody and results in the release of the
captured product.
16. Ethanol precipitate the recovered DNA as described in UNIT 2.1A and amplify the gene
product by PCR as described in UNIT 15.1.
In order to monitor the progress of the selection, it may be useful to carry out realtime PCR reactions relative to standards (for details on this method, see UNIT 15.8). As the
selection progresses, fewer cycles should be required for amplification, the Ct value should
be lower, and/or the total amount of recovered product should increase. The primers for
PCR amplification should re-establish the promoter and other sequences required for
expression, i.e., the entire template, as described under step 1. If additional rounds of
selection are to be carried out, the binding target should again be added to the template.
In the streptavidin example, this is done through PCR with a biotinylated primer.
17. Gel purify the PCR products (UNIT 2.6).
18. Amplify the pool of gel-purified products by PCR (UNIT 15.1).
19. Ethanol precipitate the amplified PCR products (UNIT 2.1A).
The PCR products can be used in subsequent rounds of selection or can be cloned into
vectors for sequencing and analysis. While the initial library may contain only one or
a few copies of each variant, in subsequent rounds there should be multiple copies of
successful variants.
Generation and
Use of
Combinatorial
Libraries
24.6.7
Current Protocols in Molecular Biology
Supplement 87
REAGENTS AND SOLUTIONS
Use deionized, distilled water in all recipes and protocol steps. For common stock solutions, see
APPENDIX 2; for suppliers, see APPENDIX 4.
Elution buffer
7 M urea
300 mM sodium acetate (add from stock of 3 M sodium acetate, pH 5.2; e.g.,
Sigma)
Filter through 0.2-μm filter
Store up to 6 months at room temperature
COMMENTARY
Background Information
Selections for binding proteins are only one
of several different types of selections that can
be carried out using the emulsion technique
described in this unit. Binding proteins have
been selected using two different methods. In
the method described above, the binding target is covalently linked to the DNA template.
Recovery of each template is dependent upon
the ability of the protein it encodes to capture
its gene through the target. Besides streptavidin, other binding proteins that have been
selected by this method include zinc finger or
p53 binding to DNA (Sepp and Choo, 2005;
Fen et al., 2007). In a second approach, the
emulsion is used to create template:protein
linkages, which are subsequently selected for
binding following de-emulsification (Doi and
Yanagawa, 1999; Yonezawa et al., 2003, 2004;
Bertschinger and Neri, 2004). For example,
a fusion protein between a zinc finger and
U1A binds to its template. Following deemulsification, these DNA:protein chimeras
were selected for their ability to bind to the
U1A RNA hairpin (Chen et al., 2008). This latter method is conceptually similar to the evolution of functional proteins via mRNA display
(Roberts and Szostak, 1997).
Critical Parameters
Directed
Evolution of
Proteins In Vitro
Choice of binding protein
Not all proteins are amenable to selection
in emulsions, in large measure because not all
proteins acquire function following translation
in vitro, but also because both the emulsion and
the procedures used for de-emulsification may
lead to denaturation. Therefore, it is important
to ensure that the wild-type protein is functional following in vitro translation, and that
the protein retains function following emulsification. If a protein proves to not be particularly robust to emulsion selections, it may be
possible to produce a more robust variant that
is more suitable for selection by neutral drift
(Bershtein et al., 2008).
Translation yield
Even when a protein can be actively translated, the yield may be too low for selection.
This will be especially true for longer proteins, as cell-free translation is relatively inefficient and mRNAs can degrade in many cell
lysates. While many of the critical parameters described below suggest how the amount
of translation product can be improved, most
successful selections will of necessity involve
shorter, stable proteins. It is strongly suggested
that an entire cycle of selection be carried out
with the wild-type template and that yields
be determined prior to undertaking a more arduous selection experiment. If only a small
fraction (<10%) of the wild-type protein is recovered, then either the recovery must be optimized (see Troubleshooting) or the selection
should not be attempted.
Template sequence and preparation
Protein yields are greatly affected by both
the template DNA sequence and the template purification methods used. The DNA sequences required for proper translation will
vary depending on the lysate type. Most lysates
use a phage RNA polymerase for transcription,
so the incorporation of an appropriate phage
promoter is required. T7 is the most common
RNA polymerase used in E. coli-based systems, while SP6 is more common in rabbit
reticulocyte and wheat germ extracts.
Similarly, translation initiation sequences
are heavily dependent on the translation system used. In E. coli, a Ribosome Binding
Site (RBS) directs translation. In rabbit reticulocyte and wheat germ extracts, a small
“Kozak” sequence can direct moderate protein expression levels. Fortunately, RBS and
Kozak sequences can coexist, and thus the
same template can potentially function across
different translation platforms. Viral-derived
24.6.8
Supplement 87
Current Protocols in Molecular Biology
Internal Ribosome Entry Sites (IRES) can lead
to higher expression levels in eukaryotic systems, but these sequences are typically ∼10
to 100 times longer than RBS and Kozak sequences (which would require them to be ordered or assembled, rather than simply designed into PCR primers), and in addition may
be very specific for a particular extract. If a
Kozak sequence does not provide the protein
expression levels desired, the EMCV IRES has
been used to increase protein production in
rabbit reticulocyte lysate (Bochkov and Palmenberg, 2006) and the TMV IRES (Gallie
et al., 1988; Yonezawa et al., 2003) in wheat
germ lysate.
The method used for purification of PCR
products can have a pronounced effect on
translation yields. The authors’ method of
choice is phenol extraction and ethanol precipitation with sodium acetate. Other methods
typically yield significantly less translation
product—e.g., gel-purified PCR templates
translate very poorly (∼0 to 10% the yield of
phenol-extracted templates) and silica membrane spin column DNA purification yields
transcription templates with only modest
translation efficiency (∼25% that of phenolextracted templates; unpub. observ.).
While plasmids may prove to be better templates for translation, the capture method must
be appropriately modified. For example, a zinc
finger protein could capture a plasmid containing a corresponding binding site.
Capture method
Following de-emulsification, the protein
product must be captured. In the example protocol described in this unit, capture is mediated
by a hexahistidine tag on the protein. A FLAG
tag is another common sequence that can be
substituted for the hexahistidine tag. Both systems rely on commercially available affinity
purification reagents. During selections not involving the directed evolution of streptavidin,
the streptavidin:biotin couple can potentially
be used to affinity purify proteins following
de-emulsification, in place of the His tag. For
each of these systems, the key will be to ensure
that the capture and retention of the protein
product is efficient. The procedure should be
performed with the wild-type protein prior to
setting up a selection experiment.
Cell-free translation
There are a variety of translation lysates
available that are compatible with protein production in emulsions. The most commonly
used lysates are extracts from E. coli (so-called
S30 extracts), from rabbit reticulocytes, and
from wheat germ. The PURE system (Protein
synthesis Using Recombinant Elements) contains individually purified transcription and
translation components from E. coli (Shimizu
et al., 2005), and has also been used to synthesize proteins in emulsions (Zheng, 2007).
However, it is critically important that each
lysate be used with an emulsion protocol that is
appropriate for it (Table 24.6.1). The protocol
described in this unit is very specific for E. coli.
Other literature should be consulted for emulsion selections in rabbit reticulocyte lysate
(Ghadessy and Hollinger, 2004) or in wheat
germ (Yonezawa et al., 2003). Regardless of
type, commercial or freshly prepared lysates
should be aliquotted and stored at −80◦ C.
Freeze/thaw cycles quickly cause inactivation
of the lysate and should be avoided for best
results.
Emulsion technique
The procedure used to form the emulsion
will greatly affect the lysate activity. The viscosity of the reagents used to create emulsions
makes it difficult to pipet accurately with standard air-displacement pipettors, and thus the
use of positive displacement pipettors (such as
the Microman series from Gilson) is strongly
suggested. Care should be taken to set up
the lysate reaction on ice and to immediately
emulsify the reaction. This will prevent transcription and translation in solution prior to
emulsification. This is important because, if
functional genes are produced outside of compartments, they can potentially capture templates that are not their own.
The number of genes per compartment is a
variable that will affect the course of the selection. Multiple genes per compartment will
allow a great population of variants at the
outset, but will slow the overall progress of
the selection. An average of one gene or less
per compartment should allow for greater enrichment per round. Therefore, a strategy in
which the number of genes per compartment is
progressively decreased may allow the largest
number of variants to be efficiently plumbed.
If the stringency of selection is increased as
the number of genes per compartment is decreased, the overall enrichment may be synergistically enhanced.
Troubleshooting
The success of emulsion protein selections
can be affected by a variety of problems,
but assuming that the experiment has been
Generation and
Use of
Combinatorial
Libraries
24.6.9
Current Protocols in Molecular Biology
Supplement 87
designed properly (see Critical Parameters),
these are almost always related to problems
with either translation or emulsion. For example, it is not possible to select for activity if
there is a problem with protein expression or if
the expressed protein is inactive. Therefore, it
is critical to not only verify expression and activity prior to initiating a selection experiment,
but also during the course of the selection in
order to ensure that “futile cycles” are not being performed. Selections can also fail when
there is inefficient or nonspecific recovery of
genes.
Real-time PCR assays
The only signal that will generally be apparent following a round of selection is the PCR
product that arises. In order to ensure that this
PCR product is indeed due to the selection, it is
always recommended to carry out control reactions. A negative control might be a template
encoding a nonfunctional (truncated) protein,
while a positive control might be a template
encoding the wild-type protein.
Directed
Evolution of
Proteins In Vitro
Protein production
If little or no DNA is recovered from an
emulsion (as determined by real-time PCR),
it is possible that little protein has been produced. Unfortunately, there is usually too little
protein produced in the context of an emulsion
selection to assay directly. If a given round of
selection has failed, then the quality of the
template should be assessed by carrying out
in vitro transcription and translation in solution (i.e., in the absence of emulsification)
and confirming the presence of a protein product by gel electrophoresis and staining or immunoblot analysis. If very small amounts of
protein are produced or if there is no tag that
can be used for immunoblot analysis, proteins
can be labeled with radioactive amino acids
(such as [35 S]methionine) during translation.
If adequate protein is produced in solution,
but not in the emulsion, it is possible that
the emulsion reaction itself is poisoning protein production or that protein is lost during
de-emulsification. It is possible to determine
whether this is the case by performing three
translation reactions in parallel. The first reaction is a standard translation in solution. The
second is the same as the first, but emulsified following translation. The third reaction
is translation in emulsion. Following ether extraction of reactions 2 and 3, the amount of
protein produced in each reaction can be compared by immunoblotting or by comparing the
amount of radiolabeled protein produced.
In order to increase protein production, it
may be necessary to try different lysate sources
and different emulsification techniques (see
Table 24.6.1). If little or no protein is carried through the aqueous phase following ether
extraction, alternative methods for breaking
the emulsion can be used. Chloroform, hexanes, and other organic solvents can be used
to break emulsions, and their efficiency can
be compared to that of ether. The protein activity remaining after breaking the emulsion
decreases with every additional ether extraction, and so it may be beneficial to use fewer
ether extractions. However, residual amounts
of emulsifying agents can interfere with subsequent amplification.
Even if a protein is translated, it is often unclear whether the protein is active, especially
in emulsion relative to aqueous solution. Protein activity in emulsion can be difficult to assess. Often, the most effective assay involves
just testing DNA recovery and amplification
in the selection scheme itself, especially since
real-time PCR is often much more sensitive
than many enzyme assays.
Emulsion formation
While emulsions are extremely easy to
prepare, they can also be heterogeneous and
idiosyncratic. Individual published methods
have variations in the emulsion composition
and the mechanics of emulsion formation. Inspecting the emulsion under a microscope can
help establish the size and size distribution of
the aqueous compartments generated. Unfortunately, it is unclear what the optimum size
of an aqueous bubble is for the production and
activity of a given protein. A general measure for determining the activity of the transcription and translation reaction within an
aqueous compartment is to translate a fluorescent protein such as eGFP and verify protein
production by fluorescence microscopy or a
fluorimeter.
Selection, enrichment, and stringency
The identification of functional variants
from a large and diverse starting library by directed evolution can be a powerful method, but
specific implementations inherently differ due
to differences in function selected for. Because
of this, testing the selection procedure prior to
attempting selection with a randomized library
is important both to ensure that the designed
scheme works as intended and to determine the
likely enrichment per cycle of selection, and to
evaluate the stringency of selection. To verify
that protein activity in emulsion leads to an
24.6.10
Supplement 87
Current Protocols in Molecular Biology
enrichment of active variants in a population,
it is common to perform a “mock selection”
using a population of only two variants: one
variant with normal activity and one (truncated
or mutated) variant with low or nonexistent
activity. The active variant is mixed with the
inactive variant at various ratios (e.g., 1:10,
1:100, 1:1,000), and a single cycle of selection
is carried out. The level of enrichment relative
to standards is determined by real-time PCR
or by cloning and sequencing. If substantial
(>10-fold) enrichment is not readily apparent
and active protein is being produced in emulsion (see above), individual steps of the recovery and reamplification procedure should be
investigated for either false negative signals
(through unintended loss of active variants) or
false positive signals (through the nonspecific
retention or amplification of inactive variants).
For example, to test whether the recovery of
genes following de-emulsification is efficient,
a wild-type protein can be added prior to emulsification and the fraction of genes recovered
can be quantified by real-time PCR. A lack
of enrichment could also be due to initially
overloading aqueous compartments with multiple variants, most of which may be inactive.
Therefore, it is prudent to verify whether that
there are only a small number of genes (0 to
2) per compartment.
The stringency of a selection refers to
the level of function required for an individual member of the library to be propagated
through the selection cycle for characterization
and/or further cycles or rounds of selection.
If a round of selection cannot separate functional from nonfunctional variants, it is not sufficiently stringent, and there cannot be enrichment. If a functional variant cannot be propagated through a round of selection, the selection is too stringent. The appropriate level of
stringency and the mechanisms by which stringency can be modulated will depend on the
specific selection. As a selection progresses
and the diverse starting library becomes less
diverse and more functional, it may be necessary to increase the selection stringency to
allow the variants with the highest function to
be further enriched from those with moderate
function. In the context of streptavidin binding to biotin, selection stringency was set by
the time required after de-emulsification for
protein recovery prior to amplification (Basic
Protocol, steps 11 through 14). Stringency is
increased by increasing the incubation time
during which binding must be maintained and
through the presence of binding competitors.
Anticipated Results
For the selection described in this unit,
where only a few amino acids were randomized (Levy and Ellington, 2008), the entire
selection was completed within only a few
(two to seven) rounds. For rarer phenotypes
or less robust selections, more cycles may be
required. In general, though, it is anticipated
that the real-time PCR signal (Ct) will decrease over the course of several rounds. If
no decrease is seen or if the signal is highly
variable, then some action is likely required
(see Troubleshooting). As has previously been
seen for phage-display selections, another indication of the success of the selection is winnowing of the pool, which can be determined
by sequencing. However, in the absence of
a decrease in real-time PCR signal, such a
narrowing of the pool is suspect.
Time Considerations
Because each new emulsion selection generally requires the development of new protocols, the time required for initial optimization
and troubleshooting is generally quite large
(on the order of months). However, once the
selection scheme has been optimized, each
round of selection can be performed in less
than 2 days. The number of rounds of selection
necessary will depend on the relative abundance of the desired protein phenotype, the
size of the pool, the enrichment per round, and
the stringency of selection.
Literature Cited
Agresti, J.J., Kelly, B.T., Jäschke, A., and Griffiths,
A.D. 2005. Selection of ribozymes that catalyse multiple-turnover Diels-Alder cycloadditions by using in vitro compartmentalization.
Proc. Natl. Acad. Sci. U.S.A. 102:16170-16175.
Aharoni, A., Amitai, G., Bernath, K., Magdassi,
S., and Tawfik, D.S. 2005. High-throughput
screening of enzyme libraries: Thiolactonases
evolved by fluorescence activated sorting of single cells in emulsion compartments. Chem. Biol.
12:1255-1257.
Bershtein, S., Goldin, K., and Tawfik, D.S. 2008.
Intense neutral drifts yield robust and evolvable consensus proteins. J. Mol. Biol. 379:10291044.
Bertschinger, J. and Neri, D. 2004. Covalent DNA
display as a novel tool for directed evolution of
proteins in vitro. Protein Eng. Des. Sel. 17:699707.
Bochkov, Y.A. and Palmenberg, A.C. 2006. Translational efficiency of EMCV IRES in bicistronic
vectors is dependent upon IRES sequence and
gene location. Biotechniques 41:283-290.
Generation and
Use of
Combinatorial
Libraries
24.6.11
Current Protocols in Molecular Biology
Supplement 87
Chen, Y., Mandic, J., and Varani, G. 2008. Cellfree selection of RNA-binding proteins using in
vitro compartmentalization. Nucleic Acids Res.
36:e128.
Levy, M., Griswold, K.E., and Ellington, A.D.
2005. Direct selection of trans-acting ligase ribozymes by in vitro compartmentalization. RNA
11:1555-1562.
Doi, N. and Yanagawa, H. 1999. STABLE: ProteinDNA fusion system for screening of combinatorial protein libraries in vitro. FEBS Lett.
457:227-230.
Mastrobattista, E., Taly, V., Chanudet, E., Treacy,
P., Kelly, B.T., and Griffiths, A.D. 2005.
High-throughput screening of enzyme libraries:
In vitro evolution of a beta-galactosidase by
fluorescence-activated sorting of double emulsions. Chem. Biol. 12:1291-1300.
Doi, N., Kumadaki, S., Oishi, Y., Matsumura, N.,
and Yanagawa, H. 2004. In vitro selection of
restriction endonucleases by in vitro compartmentalization. Nucleic Acids Res. 32:e95.
Fen, C.X., Coomber, D.W., Lane, D.P., and
Ghadessy, F.J. 2007. Directed evolution of p53
variants with altered DNA-binding specificities
by in vitro compartmentalization. J. Mol. Biol.
371:1238-1248.
Gallie, D.R., Walbot, V., and Hershey, J.W. 1988.
The ribosomal fraction mediates the translational enhancement associated with the 5 -leader
of tobacco mosaic virus. Nucleic Acids Res.
16:8675-8694.
Ghadessy, F.J. and Holliger, P. 2004. A novel
emulsion mixture for in vitro compartmentalization of transcription and translation in the rabbit reticulocyte system. Protein Eng. Des. Sel.
17:201-204.
Ghadessy, F.J., Ong, J.L., and Holliger, P. 2001.
Directed evolution of polymerase function by
compartmentalized self-replication. Proc. Natl.
Acad. Sci. U.S.A. 98:4552-4557.
Ghadessy, F.J., Ramsay, N., Boudsocq, F., Loakes,
D., Brown, A., Iwai, S., Vaisman, A., Woodgate,
R., and Holliger, P. 2004. Generic expansion of
the substrate spectrum of a DNA polymerase
by directed evolution. Nat. Biotechnol. 22:755759.
Griffiths, A.D. and Tawfik, D.S. 2003. Directed evolution of an extremely fast phosphotriesterase by
in vitro compartmentalization. EMBO J. 22:2435.
Levy, M. and Ellington, A.D. 2008. Directed evolution of streptavidin variants using in vitro
compartmentalization. Chem. Biol. 15:979989.
Roberts, R.W. and Szostak, J.W. 1997. RNApeptide fusions for the in vitro selection of peptides and proteins. Proc. Natl. Acad. Sci. U.S.A.
94:12297-12302.
Sepp, A. and Choo, Y. 2005. Cell-free selection of
zinc finger DNA-binding proteins using in vitro
compartmentalization. J. Mol. Biol. 354:212219.
Sepp, A., Tawfik, D.S., and Griffiths, A.D. 2002.
Microbead display by in vitro compartmentalisation: Selection for binding using flow cytometry. FEBS Lett. 532:455-458.
Shimizu, Y., Kanamori, T., and Ueda, T. 2005.
Protein synthesis by pure translation systems.
Methods 36:299-304.
Tawfik, D.S. and Griffiths, A.D. 1998. Man-made
cell-like compartments for molecular evolution.
Nat. Biotechnol. 16:652-656.
Yonezawa, M., Doi, N., Kawahashi, Y.,
Higashinakagawa, T., and Yanagawa, H.
2003. DNA display for in vitro selection of
diverse peptide libraries. Nucleic Acids Res.
31:e118.
Yonezawa, M., Doi, N., Higashinakagawa, T., and
Yanagawa, H. 2004. DNA display of biologically active proteins for in vitro protein selection. J. Biochem. 135:285-288.
Zaher, H.S. and Unrau, P.J. 2007. Selection of
an improved RNA polymerase ribozyme with
superior extension and fidelity. RNA 13:10171026.
Zheng, Y. and Roberts, R.J. 2007. Selection of
restriction endonucleases using artificial cells.
Nucleic Acids Res. 35:e83.
Directed
Evolution of
Proteins In Vitro
24.6.12
Supplement 87
Current Protocols in Molecular Biology