1
HELP METAGRAF
USER'S MANUAL FOR METAGRAF
INDEX
WORKING IN 2-D.
UNDERSTANDING METAGRAF:
●
●
●
●
●
●
●
Objects Description.
Possible Operations Description.
Controls Description.
Objets Buttons Description.
Sliders Description.
Editor's Use and Capabilities Description.
Screen Information Description.
WORKING WITH METAGRAF:
●
●
●
●
Objects Creation.
Transformming Objects
Manipulating Objects
Use of Files
TEXT CREATION :
●
●
●
Text Possibilities.
Use of Text Controls.
Text on Paths.
GENERAL AND LAST-MINUTE ITEMS :
●
●
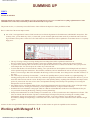
Summing up.
Geometrical attachments.
ayuda.html [5/30/2002 10:08:34 PM]
OBJECT DESCRIPTION
INDEX
LISTING OF AVAILABLE OBJECTS:
Generally speaking, we can assert that METAGRAF includes any necessary element for making any kind of drawing. In
some cases, these elements, named OBJECTS, are repeated just for funtionality or user friendliness reasons, for example,
OVAL and CIRCLE. The latter can be drawn by four different ways.
Afterwards, we'll explain the reasons of this "overwealth".
●
●
●
●
●
●
●
●
●
●
●
●
●
●
●
Here comes the listing:
Point
Line
PolyLine
Rectangle
Oval
Circle
Arc
Polygon
Curve
Spiral
Arrows
Postscript Text
LaTeX Text
Curved Text
Pictures and Images
And now, yet at an alpha stage but usable, there are a couple of new objects:
●
●
Import of external Postscript drawings
Mathematical functions written in a standard way
All these objects can be transformed with the usual afine transformations.
On the other hand, the thickness, type of line, color and fill are modifiable.
Here are some examples:
●
●
●
Point.
Spiral.
Text.
des_obj2.html (1 of 3) [5/30/2002 10:08:34 PM]
●
●
Big Arrow.
Closed Cubic Curve.
The above images show some interesting particularities not very common. That is, in the text image we've included a math
formula which has suffered the following transformations:
- 50% increase of vertical scale over the horizontal one,
- To all the image a 30% slope has been applied, so they resemble italics.
Now, we will explain every object construction in detail.
POINT.
The object is just a pair of coordinates that define it, the same definition as MetaPost. Besides, on the fly, METAGRAF
allows to choose the thickness and color trough the color dialog.
LINE.
Similarly, the object line is drawn very easily. It's done the same way as MetaPost, with typical variables: thickness, color
and type of line (dotted thick, dotted thin,...summing up seven different types to select).
POLYLINE.
This object is the same as the POLYGON but not (necessarily) closed.
RECTANGLE.
This is a special object. But now, we'll state that is a closed cycle made of four lines that link four points. The possibilities
of thickness, color, type of line,... are the same that LINE possibilities.
Nonetheless, the METAGRAF rectangle is not necessarily 90 degrees from the start, it may get to a not rectangle
paralelogram. Afterwards we will say more about.
OVAL.
In MetaPost the oval is made of four cubic curves, that start from the middle points of the sides of a rectangle and end in
the points of the neighbour side. The control points are choosen following D. Knuth "algorithm". The OVAL, because of
being built from a rectangle, has the same transformations as rectangles, so that it can be circumscribed into a non
rectangular paralelogram.
CIRCLE.
There're four kinds of circles available in METAGRAF. The first and easier one is the oval we've seen in the previous
section. We just choose a rectangle that is a square. This is a very common trick of graphic programs, but it's not
comfortable for the user, because require grid adjusting all the time, to get a real circle. Even at that conditions, it's not
"comfortable".
The standard circle used in METAGRAF is in fact a modified oval. The only difference is that in this case, the rectangle is
a square and the relationship among sides has been fixed. A complex routine allows the drawing of the circle with most
ease as we'll later see.
On the other hand, the system devised for the arc drawing, allows 360 degrees arcs, that is, a circle.
Finally, there's a special circle designed for generating spirals, that uses the MetaPost function "fullcircle". It can be used
also as a circle.
ARC.
The arc of circle, which is translated into a MetaPost limited "full circle", is built drawing a first line that marks the origin,
des_obj2.html (2 of 3) [5/30/2002 10:08:34 PM]
radius and slope respect the start of the arc. Marking another point, this point and the origin of the first line are joined
creating the second line that limits the arc. This one can be modified or adjusted in the simplest way, just by moving any of
the three basic points, as is done with LINE or any other object.
POLYGON.
The polygon is a classical element, very useful and easy to create and modify. Once it's been drawn the first side, the rest
is done automatically clicking with the mouse wherever we want to place a vortex. The number of sides has been limited
to 64, never reached in practice.
Metapost deals with it like a closed cycle of straight paths. It's fully modifiable in 2-D and 3-D as we'll see.
CUBIC CURVE
This object is only found at METAGRAF, Its management resembles polygon, but, when we click the mouse in the second
point after creating the first line, the cubic line appears, it's a Bezier's. Its control points are the middle points between
extrems. If a curve line that is not limited to one element is wished, new points can be added as is done with polygons. The
curve is adjusting itself every two clicks, so that it is tangent in the middle point of the sides of the circumscribing
polygon. Metapost handles it the same way Java does on the screen, applying Bezier curves with the same control points,
marked with the mouse clicks.
ARROWS.
Arrows are extremely important in any technical drawing. So, all their capabilities have been exploited. They have a
special panel. It appears when we press the specific button and we can choose between 5 arrow sizes, each one with 5
different angles with the sides of the arrow, and there are five different shape of arrows to choose from. Moreover you can
soften the point or leave it pointed and the the arrow can be filled or just drawn the contour. Straight, double or reverse ...
no detail has been forgotten.
TEXT.
Finally, we end this description with the most important of all. It's the link with typesetting systems like TeX/LaTeX,
PDFTeX,... It's possible to use raw PostScript and use the fonts available in the system. METAGRAF has a nice and
original management of texts. You can change shape, shearing, placings,... in such a way that is unknown till today. This
issue will be dealt later
IMAGES
A new and totally original way to include any image in standard JPEG or GIF mode is now possible with METAGRAF.
And, what is more, the image can be manipulated in color, brightness, special effects... etc. This is a kind of "small
revolution" for MetaPost, unable up to now to use these possibilities. MG is bringing new life to MP overcoming old
frontiers of this one.
INDEX
des_obj2.html (3 of 3) [5/30/2002 10:08:34 PM]
RETURN.
ayu_pun2.html [5/30/2002 10:08:35 PM]
ESPIRAL
RETURN.
ayu_espiral2.html [5/30/2002 10:08:36 PM]
TEXTO
RETURN.
ayu_text2.html [5/30/2002 10:08:36 PM]
Flecha2
RETURN.
ayu_fle22.html [5/30/2002 10:08:37 PM]
BEZIER
RETURN.
ayu_any2.html [5/30/2002 10:08:38 PM]
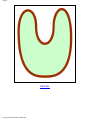
OVALO
RETURN.
ayu_f12.html [5/30/2002 10:08:38 PM]
METAGRAF'S MANUAL
DESCRIPTION OF OPERATIONS
INDEX
POSSIBLE OPERATIONS
In this section, we'll present the operations related with objects, once these have been created. Some operations can't be
applied to certain objects. So some objects have more operations than others. Even, some operations are specific of a
unique kind of object. First, we'll present the operations available for the user. Afterwards, we'll present an abstract of the
operations available for each object. But, previous to that, we must state a not so obvious thing: an object, usually, needs to
be selected before any operation can be performed on it. To select an object, after pressing the right button of the mouse,
that is, in "neuter" state, the mouse is clicked once over the created object. That makes the color of the object to turn red.
Moreover, in most cases, if it is filled with color, after selecting it, it turns transparent. Later on, we'll explain in a greater
extent the selection of objects, which is important indeed. The ongoing discussion is about selected objects.
COPY or CLONE.- Every object can be cloned as many times as you like just clicking a button. This copy is made
retaining all the atributes of the object in the moment of cloning and can be done in the same way with groups.
GROUPING AND UNGROUPING- We can group either objects or groups, even we can group a single object, a very
interesting feature sometimes. A group of objects acts like a single object, that can undergo new transformations. This
opens many possibilities, because a very same transformation applied to two equal objects doesn't produce always the
same result. For example, if we have two circles, side by side, we select them and we apply the "Perpendicular to screen
(that is, Z axis ) Rotation" transformation, we'll see no change, because rotation takes as center of rotation the center of the
object (the center of each circle). But if we group them before the transformation, if the rotation angle is 90, the circles will
change its position, because the rotation center of the compound "two-circles-grouped" object is the center of the group.
LINE THICKNESS CHANGE- The line-thickness-change-operation is done by pressing the button "+" (increasing
thickness) or the button "-" (decreasing thickness). Buttons are by side. An small window let us know which is the actual
value of the selected line. There's no other options than increase and decrease. The increasing/decreasing is done by steps
of 50 %. It can't be lower than 0.1 pt (METAGRAF ignores further decreasings).
OBJECTS MOVEMENT.- Pressing over the objects and dragging. It's as easy as that, no further explainations. Groups
behave the same way. Besides with afinne transformations (specially in 3-D ) it's possible to move objects too. Finally
with the rules (if present) it is possible to move horizontally or vertically all the objects in the canvas, selected or not. This
is useful, for example, when we deal with a real big drawing, then we can scroll and continue drawing. It's like the
"scrolling function" but without moving the screen, only the drawings, like a transparent paper.
SHAPE TRANSFORMATION-All selected objects that have "marked" points in the corners and borders can be modified
at any time, just clicking and dragging these points. This is very useful in certain objects. It's a "must" for adjusting curves.
TYPE LINE CHANGE- Sometimes we may wish dotted lines or special lines. Pressing the button, a window will appear
where we'll be able to choose among six different types of lines.
FILLING AND COLOR CHANGE-Pressing the corresponding buttons the color dialog panel is dispayed. This buttons
can be the "fill" one, a circle filled in red, or the "contour" one, a palette of colors. Finally, a third button empties the filling
des_ope2.html (1 of 2) [5/30/2002 10:08:39 PM]
METAGRAF'S MANUAL
of a colour. Such button is necessary because there's not a transparent colour. Alpha channels are troublesome ( and not
only in METAGRAF)..
AFINE TRANSFORMATIONS.-There's a whole series of transformations of this kind. All afine transformations allowed
by MetaPost and some other that are interesting for 3-D work. They sum up 14, available for the user and the functioning
is almost the same always. Most objects can be used with them. These are the available afine transformations that appears
when the selecting button is pressed:
●
●
●
●
●
●
●
●
●
●
●
●
●
●
X ROTATION.
Y ROTATION.
Z ROTATION
ANY-PREDEFINED-AXIS ROTATION
X SHEAR
Y SHERA
Z SHEAR
GENERAL SCALING
X SCALING
Y SCALING
Z SCALING
X TRANSLATION
Y TRANSLATION
Z TRANSLATION
The origin (0,0) is at upmost-leftmost corner of the canvas. The X axis goes from left to right, horizontally. The Y axis
goes from top canvas to the bottom. The Z axis goes from origin towards the wall behind the monitor /CRT screen, that is,
in the opposite direction of user. It's a right-turning (dextrogirum) axis.
(The text processing operations will be dealt in its own section, not here).
All transformations (with the exception of the rotation around a special axis) use the center of the object as its center, that
is , that center behaves like the origin of coordinates. It's like the origin would move into the center of the object and the
transformation is done in the axis, and then the axis return back to their corner. (in fact METAGRAF does that internally).
Only the PREVIOUSLY-DEFINED-AXIS ROTATION doesn't take such center as has been said.
INDEX
des_ope2.html (2 of 2) [5/30/2002 10:08:39 PM]
HELP METAGRAF
CONTROLS DESCRIPTION
INDEX
LISTING OF AVAILABLE NON-SPECIFIC-USE
CONTROLS.
In this section we will describe one by one the widespread use controls of MG, such as close and opening of files,
saving,...
The six icons in the lower leftmost part are used for this sort of non-specific controls. So from top to down, left to right we
have:
1- Open portfolio, that represents, as usual, the opening of files. Clicking this button we can see the file chooser,
with the existing files on the "files" directory, but that can be used to choose any other directory or file. The file
must end in .bmg to retrieve a graphic from disk. If the file is opened, it will be "pasted" in the screen. but If the CTRLkey id pressed before, when clicking this button and opening a file, this one will replace everything on screen. (Some
buttons in the "file-chooser" haven't been bound to a function, they're in the top-right side).
2- Below the open portfolio, there's a button with the icon resembling two sheets. This is the button to paste
postscript files translated to *.mg files. It is at an alfa stage but in the tests made, everything has gone
straightforward. The translation of *.ps files to *.mg files can be done trough the use of the "ps2mg" program included in
directory "metagraf*" of the distribution. (Later on, the way of doing will be explained.)
3- The last button at the left is the "clear_all" button. If we click it, and then we click at any place of the working
panel, everything is deleted, everything visible and also unvisible. Once done, the right button must be clicked to
continue working. (Besides, it's important to say, that some internal counters of METAGRAF are not reset, which is
specially useful, as we'll see afterwards.)
4- At the right, the first of the three last buttons resembles a diskette; this is the button for saving files. Whenever
you press this button, a "chooser" appears where the name of the file to save WITHOUT EXTENSION must be
written. A couple of files with extension ".mp" and ".bmg" will be created in the directory choosen. .
5- The next button is the "cut&paste" button, used for inserting pictures or images after having clicked the "Place"
green button of the image-panel. (See the file "Introduction.html").
6- Finally, a small honour to Java language when we use his mascot to say goodbye. This is the classic "exit"
button.
We've finished the review of buttons of general use. There're more buttons, these other buttons have some specific
functions. (Really, it's difficult to determine what is useful for all the people or just for part of the people.)
OTHER BUTTONS, NOT SO GENERALLY USEFUL
7- This button is in the top of the toolbox at the left, it's used for running "gv" (Linux) or "gsview32" (Windows),
for seeing the "real" result of the work. At the same time, a couple of new files, with extension ".mp" and ".bmg"
are created in directory "files" as it is explained in "Introduction.html".
des_man2.html (1 of 2) [5/30/2002 10:08:39 PM]
HELP METAGRAF
8- At the left of the previous button it's the button used for including special fonts, that is , PostScript fonts.
Clicking it, a font dialog pops up for the usual choosing. Afterwards, these fonts can undergo afins
transformations, like the ones used with standard LaTeX/TeX texts, including math formulae.
9- Button for raw MetaPost. It's used with the editor. METAGRAF is at the same time: a graphic editor and a text
editor. At any time, it is possible to mix a drawing with a text written in raw MetaPost. Using the editor to write a
MetaPost text and clicking the button labelled "MP", and then clicking anywhere in the working panel, the text
will be included in the resulting file. This Metapost included in the drawing behaves as a special MG object. It is not seen
but "it is there...".
INDEX
des_man2.html (2 of 2) [5/30/2002 10:08:39 PM]
HELP METAGRAF
OBJECTS BUTTONS
INDEX
AVAILABLE BUTTONS:
In the next lines we will look at the available buttons for creating objects and we will speak about the way of using them.
Nevertheless, before, we have to say a couple of words in relation with two buttons that appear at the top part of the
principal button-box, at left. From left to right and from top to bottom we find what follows:
1- The "thick vertical arrow" is the button for transforms. If we want to manipulate an image through affine
transformations, we have to use it. If it is clicked, the "Select Transform" window will appear. This button is in
close relation with the principal Slider, in such a way that before clicking on it and depending on the
transformation choosen, it is necessary to move the Slider to the place needed. Once the button is clicked, the Slider is
locked.
2- The second button is just a "making-life-easier" button. If clicked, all the objects on the screen are grouped and
then selected. As this is something that usually is done many times, with this button the whole operation is done
quicker and simpler. Suppose that we want to "rotate" an image. There is no specific rotation-button in MG but
we can do as follows:
●
●
●
We click this "second" button.
Then, move the Slider to the value choosen for the angle of rotation. No limitations.
Then, click the "thick_Arrow" button, select the kind of rotation and accept (click O.K.) The whole drawing will
be rotated (Not TEXT. BEWARE!!).
The next four buttons have been already explained or correspond to 3-D functions, so lets continue with the one after
those. .
3- The first one in this series is the "Text" button, easily identifiable through the big "T" on its face. Although
"text" will be explained with big detail later on, in another chapter, we will say already a couple of words. To put
some text in a draw the process is as follows: First, something must be written in the upper Text Field. Anything
according with TeX/LaTeX rules -if some PostScript font is not choosen- anything can be written, including
"$math_symbols$". Once finished the "T" button must be clicked and with the mouse pointer a line must be drawn in the
screen. The written text will appear over the line, left justified, as soon as the right button is clicked. Nevertheless, in the
final MP figure, the text will be "center_justified" and the horizontal and vertical center will be the origin of the line just
drawn. As will be seen, the line can have any direction, not necessarily horizontal.
des_bot2.html (1 of 4) [5/30/2002 10:08:40 PM]
HELP METAGRAF
4- The next button is the "oblique_arrow" button, and this is a "real" arrow button. Its function is to place arrowheads of many different kinds over the end of open lines or curves. Once clicked, the "arrow_panel" will be
visible. This is a quite simple window as it is, in some way, self-explaining. So, at left we find six "radio" buttons
related with the shape of the arrowhead. In second place, there are also five small buttons to choose the size of the
arrowhead, and in third place there are six other buttons to choose the angle of the arrow. On the upper part we can choose
between a typical MetaPost arrow -the round one- or a totally acute one (Beware! the length of the total arrow increases
slightly, breaking the extremely precise joints usually found in MP. We will find a solution someday.). At right-top there is
a "big" button to "unfill" arrows and the other small buttons to choose from a single arrowhead at the last point drawn of a
line, or a double arrow at both limits. Downward, it is possible to change the point where the arrowhead has been "placed",
and place it over the beginning of the line. As can be seen, quite a lot of possibilities.
Once the kind of arrow choosen, the line where we want it placed must be selected (so, in red). Then it is enough to
CLICK A SECOND TIME THE SAME BUTTON (sometimes a third time is also needed) that has launched the arrowpanel and the line will have an arrow in one or both extremes (it will be seen in the canvas, just a small blue point at the
point where the arrow is placed). Some interesting points must be mentioned: the placement of arrows will be done on all
the objects selected when we click. This is very convenient when we want to put arrows on many lines; we do not need to
place one arrow a time. On the contrary, we select all the lines which we want to have an arrow and place it at the same
time on all those lines, just clicking once. Another important issue is that if we make a mistake and place the wrong arrow,
it is extremly simple to correct it. The only thing to do is to click the radiobuttons needed on the arrow-panel and place
once more the arrows on the line/s. The first arrows will be deleted and the new ones will appear in due places. Finally, we
can delete any arrow on any line: to do it, we must click the big upper-left button on the arrow-panel, the one with the title
"Clear". This is the same as selecting the arrow: "no-arrow". So, placing it will erease any arrow over the line. We must
not forget to click once more the "Clear" or the "Unfill" button to let the fonction of the panel in the original state. On
METAGRAF's screen, the arrows will appear as a single blue point where we have placed them.
5- This button must be clicked to create a rectangle-object that, if transformed, can be converted to any kind of
parallelogram, although modifying its "attributes". When "NOT" transformed, we are in front of the typical
rectangle found in so many programs that has its sides parallels to horizontal and vertical axis. Just with the
pointer of the mouse it is possible to change its dimensions, size...and so on. It is very simple to use and convenient for
many applications. That's the reason why I have maintained it. But, sometimes, this simple rectangle is "too simple". If
working in 3-D -but also in 2-D- if we want to rotate our objects or just to look at them from another point of view, the
"simple-rectangle" is useless as it has no permission to change its axis-parallel behavior. The solution (versatility once
more) is to do an affine transformation. Once transformed, our simple rectangle changes to a sophisticated one. Now it can
be rotated through any one of the three Cartesian axis or change its dimensions and/or orientation...anything,
BUT....everything must be done through affine transformations, so we will see how our four points in the corners (before,
presents), disappear and we can only translate it in the usual way. I repeat, any other modification to its size and/or shape
must be done with affine transformations. Quite sophisticated our rectangle object!
6- The oval or ellipse object is just the "sister" of the rectangle and has the same attributes. The same change
from Dr.Jekyll to Mr.Hyde if we transform it and the same capabilities to satisfy all our pretensions.
7- The right line is probably (with the sole exception of the point) the simplest object to manipulate. Just by
clicking on this button, and then clicking and dragging over the screen a line is created. Once done, to modify it
is as simple as has been its creation. To translate it, it is enough to click on any part of the rectangle limited by its
extreme points; and to change its orientation and/or length is just a matter of selecting one of the extreme points with the
special mouse cursor and move it in any direction. This object accept any kind of transformation without changing its
"peculiarities". Moreover, it is the base of the written text, as we have said before, and the positioning of this last is based
on the line. The only characteristic that doesn't matter for the text, is the length of the line.
des_bot2.html (2 of 4) [5/30/2002 10:08:40 PM]
HELP METAGRAF
If the button is clicked after pressing the CTRL-key, the object choosen is the poly-line. It behaves like a polygone but is
not necessarily closed.
8- We have spoken already about the standard circle of METAGRAF. It is an extremely versatile object that
maintains all its initial properties submitted to any kind of direct or affine changes, as well in 2-D as in 3-D. As
we know, the big advantage of Bezier curves is that submitted to affine transformations, the image has the same
control points as those produced by the same transform over the initial ones. Just to mention it, we have to say that there is
only a very small drawback in this object. And this "point-faible" is that it does not accept to be too small. For those cases,
we have another object as will be seen.
9- This other version of Circle has two special reasons to be included in MG. The first one is to serve as the basis
for the creation of the all-new object "spiral" from which we will speak later on. The second is to represent the
simplest way of drawing circles according with MetaPost command "full circle", so with no limitations in small
sizes and extremely simple to use as it is controlled like a right line. The price is the big limitations in relation with
transforms, although a few are allowed to be used with the spiral.
10- In close relation with the button at its side it has been included the one represented here for the creation of
spirals. This is a new object extremely versatile and simple to use. A must for this kind of figure. It is possible to
draw spirals that go clockwise or anticlockwise, with the number of spires desired. It is also possible to select the
final point in any position or angle. The spirals can be included inside a circle or an ellipse with the axis parallels to
coordinates axis or rotated any angle. And, finally, this curve can serve also as the base of a written text in the same way as
any other curve in METAGRAF.
11- This button corresponds to the general Bezier curve, open or close. It has been explained before and we will
say more afterward, so we will not extend our comments as the users of METAGRAF know very well this nice
approach to one of the strongest points of MetaPost. Nevertheless it must be said that this object maintains all its
capabilities in 2-D and 3-D transformations.
12- The polygon is the typical object already known in other design applications and MG uses it in a standard
way. In this BETA version, its ease of use has been increased from 2-D to 3-D, in such a way that the retouching
of its shape through the corner points has been maintained in any situation. Everything related with this object
can be applied to the Poly-Line one.
13- The simplest object is the point. Although simple it is useful in certain situation as will be explained later on
in relation of positioning of final images. Also, changing the pen thickness it is possible to draw nice totally filled
small circles absolutely perfect as we have shown in a chapter before.
14- The object ARC has suffered a certain modification to simplify its use. This new version is just what we
were looking for. Simple and very intuitive with no limitations if the user tries it he will be convinced of its
simplicity and incredible capability regarding edition of the figure, placements of arrows and so on. The
interesting point is that the arc is always drawn from the second point to the third in an anticlockwise direction. Knowing
that, any arc can be drawn quickly and easily and if arrows are wanted, the direction is known.
des_bot2.html (3 of 4) [5/30/2002 10:08:40 PM]
HELP METAGRAF
We finish here this chapter in which all the MG-standard object-buttons has been explained and its relationship with the
available functions clarified..
INDEX
des_bot2.html (4 of 4) [5/30/2002 10:08:40 PM]
METAGRAF'S MANUAL
THE SLIDERS
INDEX
USING THE SLIDERS
In what follows it will be explained in detail the way of working with the Sliders and specially with the principal one. This
one is the biggest, over the drawing-panel with four small buttons at its right.
As has been said before, this slider is connected with the "transformation-button", the one with the thick, short, vertical
arrow. The way of using the slider is very similar for all the transformations with some exceptions to make the work easier
and simpler. So, lets see how the slider must be used with every transformation, and according with the order that appears
in the "transformation-panel" as it is launched.
ROTATIONS
The first four transformations available are related with rotations. For those, the use of the slider is very simple as it is
graduated by default in degrees, from 0 to 180. Nevertheless, this values can be extended without limitations. For doing
that, it is necessary to use the four small buttons at right, so now the function of this four buttons will be explained:
●
●
●
●
From top to bottom we find these four buttons:
First, the one with the icon "plus-minus" over it. Each time this button is clicked, the effective value selected
changes from positive to negative, as can be seen in the small window at right under the name "SCALE". To come
back to the original value of the slider, it is enough to move it or, simpler, to click on it. As long as this is not done,
the negative value (for instance) will be maintained.
The second button represents a multiplication by 2, so the double of the value chosen manually. Once more, this
new value will be shown in the window "SCALE" and it can be deactivated in the same way as before.
The next button represents a multiplication by 10 and the last one, a division by 10.
Any combination of these buttons is allowed and the result at any moment represented in the window mentioned.
At any moment, everything can be deactivated as explained.
With what has been said it seems that no doubt must remain about Rotations values. Lets continue with other
transformations:
SHEAR.
For this kind of transformation, the value introduced with the slider is the "percentage" of shear in the direction choosen
related with the perpendicular one. So, if the value "X_Shear" is selected and the slider is placed over the number 30, the
transformation will be a shear in the X-direction of a 30% of the value of the Y coordinate (referred to the center of the
object or group of objects) at every point. Now, it is needed to clarify that, unless in special situations, all the affine
transformations are done considering the geometrical center of the object or group of objects as the origin of coordinates
(which is the only reasonable way of doing it).
The "Y_Shear" as can be thought, is exactly the same idea, changing their coordinates. The "Z_Shear" has no meaning in 2D.
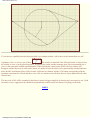
We can see the result of a "X_Shear" of a value equal to 30% now. Here, is the object before shearing it, and here is the
des_sli2.html (1 of 2) [5/30/2002 10:08:40 PM]
METAGRAF'S MANUAL
object after the transformation.
We can see that in the upper part of the image (negatives "Y-coordinates") the "X-coordinate" has been moved a 30% of its
Y-Coors. value to the left. The same, but opposite, at the bottom part. SHEAR is a fine transformation and very interesting
for matters related with text.
CHANGE OF SCALE
Without any doubt, this is the most used transformation. It is extremely versatile as it serves for many purposes. It is of
continuous use with "special" text but also when we want to make some use of a "zoom" function or when our drawing is
small and difficult. In this last case, the best solution is to work at a bigger scale and, when finished, to reduce the image.
For all those reasons, it is the transformation chosen by default when the "transform-panel" appears. The Zoom-button,
lately implemented, just uses this capability to zooming objects. (Nevertheless something must be said related with
zooming. In its present state, zooming is NOT a strong point in METAGRAF, and it must be used with care. A big problem
is that the lines that support text will not be changed in position, so zooming drawings with text can have not very nice
results. BEWARE!).
The big Slider works in the same way as with SHEAR, so in percentage. If the slider-button is placed over the number 100
and then the transformation is done, nothing changes. As the biggest number in the scale is 180, it is usual to make use of
the buttons at right (most of all in 3-d). Those buttons works in a cumulative way. So if an increase of four times is wanted,
after placing the ruler over the number 100 the button "x2" must be clicked twice. Over the small window SCALE can be
seen the real value; in this case 400.
It is possible to use the change of the scale only in one direction, for instead the X or Y (the Z direction has no meaning in
2-D). In that case, the object or group of objects will be distorted in the direction choose my the corresponding percentage.
TRANSLATION.
This is not a very useful transform in normal use. It is a lot simpler to move the objects directly selecting them and
dragging the mouse. The work of the slider is the simplest as the objects are moved by default the same amount in unities
as it is written on the scale. On another cases, as working in 3-D it can be useful when moving in directions perpendicular
to the screen, but we will speak about that later on. One thing must be said about "unities". The METAGRAF unity is the
pixel, and working with a resolution of 1024x768, it means that one pixel is 0.25 mm.
We will finish this short chapter with a reference to the other smaller sliders, vertical and horizontal (not present in the
800x600-screen version).. Those, also in 2-D have a limited utility, being a kind of "scrollbars". To understand the way
they must be used, it can be imagined that when we are drawing a figure, between the screen and the pointer of the mouse
there is a thin transparent layer. When we move the slider, what we are moving is this "transparent layer" with the drawing
over it. This is useful when it is wanted to make a drawing bigger that the screen. In those cases, for instead if we want to
draw a complete A4 sheet, we need to move the first part of the drawing to be able to fill the total page. It is important to
know that, although not visible to the eyes, everything drawn in the "positive" part of the screen will be saved in its totality,
so we have to increase the size of our drawing to the bottom part and, eventually, to the right. The unities written in the
scales of the screen represents "real" cm's. of paper. A DIN-A4 sheet has approximately, 21x29 cm's., so we have the whole
width always visible but in the vertical dimension we have only a little bit more than one half, working at 1024x768. .
INDEX
des_sli2.html (2 of 2) [5/30/2002 10:08:40 PM]
RETURN
shear12.html [5/30/2002 10:08:40 PM]
RETURN
shear22.html [5/30/2002 10:08:41 PM]
METAGRAF'S MANUAL
THE EDITOR
INDEX
WORKING WITH THE EDITOR
MG's Editor has a couple of functions clearly determined. One of those is the modification of the final metapost file
obtained with MG by hand, and saving it with the name choosen.
The other "function" of the editor correspond to the capability of introducing direct MP code in any draw, what is useful
not only to write complicated macros outside the scope of Metagraf, but also to introduce a part of a picture already done
in the past. It is enough to copy and paste (both instructions work o.k., and also Ctrl C and Ctrl V) the file to the editor and
then put it in the drawing with the use of the "MP" button. The advantage of this way of doing is the fact that this part of
the image does interact as a single quick object and so, it does not affect the speed of MG screen.
To launch the editor's panel, the button at right with the tittle "EDIT" must be clicked. Immediatly, the panel editor will
appear with a quite reduced size. This size can be modified at will, being the default small to permit to let it in some part of
METAGRAF's screen without disturbing. The editor has only three options to make it as simple as possible. The first one
is CLEAR and serves to let the screen blank after something has been written in the quickest way. The other two, OPEN
and SAVE correspond to the usual ones. Any text file can be opened in the editor, modified and saved with the same or
different name. Particularly this is useful when, at the end of a drawing it is desirable to change a small detail, and easy to
do it by hand. Care must be taken if we modify in some way a file with the editor, then continue working in the usual way
and finally the file is saved. This last file will not have the modifications done already. For that reason it is convenient to
wait until the end or to paste the whole modified figure as a metapost file in the screen, but this need a good knowledge of
METAGRAF.
For the reasons just mentioned, it is very convenient to delete all files in "files" directory begining with "graf_..." (this is
done automatically from version 1.1.1) when a session is finished. The file with the bigger number after "graf_.." is the last
saved file.
Related with the pure application of texts, in next chapters we will come back to the editor or the TextField but then it will
be about its use as a pure "base" for texts.
INDEX
des_edi2.html [5/30/2002 10:08:41 PM]
METAGRAF'S MANUAL
SCREEN INFORMATION
INDEX
SCREEN INFORMATION
METAGRAF has been thought to help with much important information on the screen to be viewed at any moment with
no need to click any button or launch any auxiliary panel.
All this information is given continously in the column at right where some buttons are allocated, as EDIT, HELP and
others. In what follows we will make a detailed explanation of this column and the way everything in it works.
To begin with, we will say that the buttons in this column, and also the titles, have two kind of color, one being a kind of
blue and another redish. The blue ones correspond with actions-buttons, so the usual ones. The redish are not really buttons
but labels and there are no external actions to be done with them. They are there to inform us. Lets see the whole column
to understand all its items:
●
●
●
●
●
●
●
●
●
●
At top we see the HELP button. which is there to launch the Java visualizer and let us read this chapters.
Then it comes the EDIT button. We know enough about this button from chapter before.
The third button is the Correct one, that is used to modify the text written on the screen.
The fourth title is not a button but a label. We see on it JAVA. Under this label, two small windows show all the
time the coordinates (or what is the same, the pixels) where is placed the pointer of the mouse according with the
axis used by java: center of coordinates in the top-left part of the screen.
Label META that shows exactly the same as the window above it but now the coordinates correspond with the
ones writen in the MetaPost files produced by METAGRAF. This data are very important to add any writen part to
the drawing, or some kind of macro. The way of doing is by placing the pointer over the reference point that we
want to use, and read the coordinates in the small window.
Label SCALE. Under this label we find the real value taken into account by the application in relation with the
positioning and buttons clicked of the principal slider. We can see this value change if we move the slider, but also
if we click the "+/-" or any other of the buttons at right of the slider.
Labels "vSlide" and "hSlide". Not present in the 800x600 version, they show the situation of the smaller vertical
and horizontal sliders.
Double button "+" and "-". This double button substitutes the two buttons in the left column in versions olders
than this 1.1.0. Their function is related with the thickness of lines: once an object is selected, its thickness appear
on the smal window under the buttons. Clicking the "+" or "-" part of the double button, the change in thickness
can be seen in the window. It is important to note that this actions (in the same way as it can be done with the
arrows) are acomplish over ALL the objects or group of objects SELECTED when the buttons are clicked. This
means a big economy in time and work.
Button with the title "La/TeX". The effect of this button is to determine the way in which the final metapost file
will be writen by METAGRAF. The default mode is LaTeX, that is what can be seen in the small window under
the button. If we click the button, this will change to "TeX" and the metapost file will be written as a standard
metapost-tex file. In this case, all the text -math or standard- included in the figure must be writen according with
the TeX (and not LaTeX) rules.
GV-PS button. This button serves to choose the way of postprocessing the last file created after saving it, when we
want to see the drawing through Ghostview. By default the very simple scripts included in the distribution at this
moment works in Linux and Windows 9*/2000. The default position of this button lets us see in the small window
below, "gv-tex". If we see "gv-ps" than the last file graf_*.mp saved will be processed with just the instruction
des_inf2.html (1 of 2) [5/30/2002 10:08:41 PM]
METAGRAF'S MANUAL
●
●
●
●
"mpost" and then viewed with "gv". This can be used with any drawing without LaTeX/TeX text. So any figure
without text can be viewed in this way. Not so if we include some simple text or math text or if we use the
capability to write curved text. In all those situations, we must and read in the small window below "gv-tex" to be
able to launch "gv". The file will be processed trough "mpost" and then "latex" and after "dvips". For the user is
little difference. The only one is that when processing just with MPOST the drawing will be placed in the same
position as it was in the screen. Processing with "latex" will put the figure in the upper left corner. If we do not
want this, the simple solution is to place two points objects in the upper corners and make their thickness small.
Doing that, the figure will appear in the same place in both cases.
"TxPth" button. This button is used when writing curved text or text over a line and we will explain its way of
working in the chapters related with text.
"TxPar" button. We can say the same as in the case before. This button will launch a small screen to choose all the
parameters related with writing text on the path.
Next button is the one with the title "CurvEq". This is a new button in distribution 1.1.2 and is used to draw lines
which mathematical formulae are written on the Text Field. Below are two small text fields where the minimum
and maximum value of the variable used in the formula (always a big "X") must be written.
The three final buttons are "Attach", "Un-Gr" and "Image". They are well explained in the file Introduction.html
With that we will finish what we have call help and control on screen and also the first group of chapters.
INDEX
des_inf2.html (2 of 2) [5/30/2002 10:08:41 PM]
OBJECT CREATION
INDEX
OBJECTS CREATION
Standard objects in METAGRAF are created acording with a sequence of steps that almost always begins clicking the
corresponding button for the object and then clicking and dragging the mouse on the screen. This is so for all geometric
objects (exception: the Point object). Now we will see some peculiarities that must be known in relation with every object.
RECTANGLE.- This object is a typical example. As we dragg the pointer of the mouse IN ANY DIRECTION we can see
the shape of the object as it is created. When we click the right mouse button we can see that the red color that had the
object as it was created, changes to black. A black color means that the object "is there" and that it is not selected, We can
also observe that the mouse cursor has changed from a little crosshair to a small hand one. This is the cursor for the
RESET situation, so the first thing to do is to click the right mouse button. As soon as we do that, the cursor changes to its
reset shape that lets us do any other activity.
The steps done for the rectangle are the usual ones for any other object in relation with the creation and the need to click
the right mouse button, so we will not come back to this point. Once the object is created, it is possible that it has the
dimensions and is located at the exact position that we wanted. Usually this is not so, so a small precission work must be
done. To translate the object in any direction it is enough to select it (to click on its boundary or the inner part) and
clicking and dragging the pointer mouse we will see that the original object moves at the same time and in the same
direction. Alternatively, when one or more objects are selected, they can be translated with the arroweys on the keyboard.
The selected object or its boundary must be always of red color. This system of translating objects is the same for all
objects or groups of objects at any moment.
If we want to change its dimensions, we select it to have it of red color and small bullets on the corners. Then is the
moment to select with precission one of this corners. Once this is acomplished, clicking and dragging the mouse pointer
we will see that the object changes its dimensions. The rectangle object, and exactly the same the oval one (before any
afine transformation) change their size maintaining its axis parallel to the coordinates axis.
One aspect to be mentioned is the fact that when we create an object with any grid on the screen, the coordinates of the
object work in the socalled "snap-to-grid" mode. Depending on the grid used, this coordinates will be millimeters, double
millimeters, and so on. All the corners of the object will be placed in intersection points of the grid.
This is so at the time of the creation, and if we translate the object with the mouse, it will be translated from the original
intersection point of the grid to another intersection point. This can be very important if we want our final drawing with
perfect joints. Nevertheless, it is very simple to change this behaviour as it changes accordind with the grid on the
background. If we prefer continous positioning the simplest thing is to choose the "white paper" as the background or the
"pixel grid". When changing the grid, the object will remain in the same place as it was, althought now it can be in a place
where its corners are not situated on the intersection points of the new grid. Anyway, the possibles mouvements will
follow the new grid.
What we have explained lately is the "simple" way of working and will remain like that for all objects as long as we don't
transform them. (From now on, when the word "transformation" is writen it must be understood "affine transformation").
When we transform an object, its behaviour changes in some way. Technically, the transformation changes the original
gen_obj2.html (1 of 4) [5/30/2002 10:08:42 PM]
coordinates of the points that define the object from "integers" to "double" or "float". Apart from that, in some cases the
effect of the transformations is deeper as in the case of the rectangle and the oval. For this two objects, when we transform
any one of them it is changed into a totally different object defined in a totally different way. So, once one of those objects
is transformed, if we select it we will not see anymore the points in the corners and we can not modify its shape with the
mouse. We can do everything with it but in a different way and always trough transformations, with the sole exception of
translations movements that can be done as always.
It can be convenient to say some words about the "right line". It is a very simple object but some properties must be
mentioned. It is created as usual. Once done, for selecting it, it is convenient to know that it is enough to click in any part
of the rectangle with sides parallel to the coordinate axis and which diagonal is our line. This seems very simple, but
sometimes it can be a little bit tricky, most of all with vertical and horizontal lines. We know that another way of selecting
an object is just by clicking and dragging the mouse pointer in such a way as to include our object in the red rectangle
produced by this mouvement. Another one would be to click in the "one-up/one-down arrow button" that selects
consecutively all the objects (the same is obtained pressing the "q" key). Also, if little movement is required, the best way
to proceed is to select the line and move it with the key arrows on the keyboard. Each click moves the object one pixel in
the direction of the arrow. If a finger is maintained over the key, the mouvement is not too slow. Finally, we will say that
by selecting one of the extrems of the line, this one can be modified in length and position regarding rotation, and that this
object is an exception to the general rule in the sense that it does not chage its behaviour when transformed. (A point must
be mentioned. If an object is translated using the arrow-keys, and there is a mesh as background of the drawing panel, the
object can be put in an "out-of-the-grid" state. Then, selecting one of its corners, for examaple, will be impossible. So care
is recommended. The solution always is to change to the "white-paper" background.
BEZIER-CIRCLE.- This is the usual and recomended circle to use when no very small sizes are required. It has also the
advantage of little change in behaviour after transformation, so, for example, the size can be increased or decreased with
the mouse. When we create it in the same way as always (clicking and dragging) the red circle appears with a point in the
center (just for reference) an another one at the righr extreme. This last one can be used lately to change the diameter of the
circle clicking the mouse on it and dragging to the outside (increase the diameter) or to the inside (diminish the diameter).
When transformed trough rotation around x or y axis, the circle changes to an oval or ellipse, but the point will remain and
the size can be modified at any moment, always in the same controlling way.
SPIRAL-CIRCLE.- This object has been implemented specifically for creating spirals, but it is also recommended when
very small circles are needed and the aproximation of Bezier curves is not very good. It is created in the standard way. At
the time of creation we will see a red line where we dragg the mouse that correspond to the radius and a black circle
around it. If the extrem of the radius is changed in position but not in lenght, the circle will be the same, but not the spiral
created if we do it. First of all it must be said that at present this object as a circle does NOT accept transformations. The
spiral created with it, admits SOME transformations. In what follows we will go into spirals.
SPIRAL.- Once created the circle-support for the spiral in the way just explained, to create the spiral there are a few very
simple steps to do it. First, the big slider must be placed in some value that will be the number of spires that the final object
will have. To make it easier, the scale is divided by ten, so a value of 80 means 8 spires. Once the slider is in place the
button with the spiral over it must be clicked. And that's all. Our spiral has been created. After clicking the right mouse
button, as ALWAYS MUST BE DONE AFTER THE CREATION OF AN OBJECT, the original circle will change to a
series of concentric circles, usually the same in number as spires created. This is just to remind us that this object is an
spiral but the final draw is quite diferent, obviously. Now, some precissions about the spiral created: it begins always in the
center of the circle and runs, by default, in clockwise fashion. It finish in the last point where we have draw the original
radius of the circle. That is the reason why this radius can be changed in position without afecting the circle but changing
the position of the spiral. If after placing the slider in place we click the corresponding "minus" button of the slider, so the
value choosen appear in the small window "SCALE" as a negative number, the spiral created will go from the center to the
extrem of the radius in an anticlockwise way. We will continue explaining other caratheristics of this object in the chapter
gen_obj2.html (2 of 4) [5/30/2002 10:08:42 PM]
related with transformations.
BEZIER CURVES.- Bezier curves are piecewise, smooth curves. We have already writen quite a lot about this object. It
is created in the same way as the poly-line, with the only difference that in this case when clicking the forth time a curve
will appear from the first point to the last one in black color. This is our Bezier curve. If we want to finish here, we can
click the right mouse button (AS ALWAYS) and the curve is saved. BUT, if we continue and before touching the right
mouse button we click a fifth time, something happens. On the one side the red polygon circumscribed to the curve will
increase in one more side, and the curve will move to the middle point of the one before the last segment of the polygon.
Then, cliking a new time, the curve will continue from the last point where it ended to this last point clicked, and so on.
The reason for this "peculiar" behaviour is simple (Here some maths). What usually is searched with this kind of curves is
to obtain a smooth one. A good way to achieve this is with the method used by METAGRAF. Smooth Bezier curves can
have two kinds of continuyty: in mathematical terms, it can have continuity of the type G1, and this is the case when a
"piece" of the curve continues with the next one having the same tangent, or continuity of the type C1, and this correspond
to the case when having the same tangent, the distance from the second control point to the last point of the first piece is
the same as the distance from the first control point to the first point of the second piece. In METAGRAF it is assured that
our Bezier curves have continuity C1.
If we continue clicking, we will observe the same behaviour: every odd click will modify the already existing curve
making it shorter and every even click will finish the smooth curve to the point just clicked. Usually the curve will be an
open one, but if our last point is the same as the first, the curve will transform to a closed curve. If not care is taken, the
closed shape will have a clear discontinuity in this last point. The way to close the curve smoothly is to click the one
before the last point in a virtual line that will be the prolongation of the first one drawn and at the same distance in the
opossite direction, as the first control point is from the begining. Doing that, when clicking the last point above the first
one, the curve will close in a totally smooth way. A last improvement has been the capability to close the curve when this
one has been already drawn as an open one. The way of doing that is to select and dragg the first/final point to joint it with
the last/first point. Then one of them will disappear and the curve will be closed. The point where the curve has been
closed, can be moved in such a way as to make the curve smooth, or a big angle can be created. Angles can be created at
any point of our Bezier curves just joining two nodes after the curve is drawn.
POLYGON.- The polygon is created in the same way as the curves just explained. It has the peculiaruty of "not having
peculiarities", so little explanation, if any, is needed. It is enough to test it clicking a few times after the first segment is
created and the behaviour of the object is immediatly understood. Exactly the same can be said about the poly-line.
ARC.-The arc of circle is an object quite simple to use. A few concepts must be well understood. The arc is created in the
standard way: first a segment and then one more click. It is defined by three points: the center point (where we click for the
first time), the length of the radius that is the second point of our first segment, and the third point clicked that represents
the direction from the center point that limit the arc. Sometimes it can be a little bit tricky to construct the arc that we are
looking for. For doing it in the right way, one point must be remembered: The arc begins always at the second point and
goes in a counterclock way until the direction created with the third point. This is very important to remember not to have
any trouble. One big advantage of METAGRAF's arc is the unlimited capability of graphical edition. Once created and
clicked the right mouse button (AS ALWAYS), the arc can be modified in any way by moving any one of the three
definition points. Just playing with it will show his unlimited capabilities. It is important also to mention that being the
translation to MetaPost language a "full circle" limited by two lines, it is also possible to create perfect circles with this
object. At the moment it has only limitations in the aspects related with transformations.
POINT.- And last (and also least) we have the point. Just clicking once in the screen, it is created. The interest of this
object is related strongly with the capability of increasing its size increasing the value of the pen used, so with the "couple
+-" button.
INDEX
gen_obj2.html (3 of 4) [5/30/2002 10:08:42 PM]
gen_obj2.html (4 of 4) [5/30/2002 10:08:42 PM]
OBJECT TRANSFORMATION
INDEX
OBJECTS TRANSFORMATION
We will begin with a detailed explanation of the affine transformations, althought some lines have been written already in
relation with this item.
In total, there are 14 possible affine transformations, that can be grouped in four unities: rotations, scaling, shearing and
translations. They will be explained in this order.
There are four possible rotations, three around any of the coordinate axis and one more around an axis created by the user.
This last one is very important, so its "way of working" will be explained already. First of all, it is needed to know how to
create an axis. For doing so, the second button from top and left side in the general toolbar, must be clicked. Then the
mouse must be clicked over the canvas and dragged as if it were a normal right line. It will be seen a blue line appear that
correspond to the "selected" axis. When the right mouse button is clicked, the blue line changes to a green one, that
correspond to "non-selected" axis. One point must be mentioned: When the "axis-button" is clicked the cursor of the
mouse will not change to a cross-hair until the screen is clicked.
Once the axis is created, any "rotable" object on the screen, can be selected and choosing the amount of rotation with the
"big" slider, rotated in the usual way, clicking in "Axis rotation" on the transformation window.
Done in this way, the rotation will be a "real" 3-D rotation, but as long as the 3-D capabilities are not used, what will be
obtained is the projection of the object in space over the screen. This is useful as it is very easy to change a bezier-circle to
an ellipse knowing that the big axis of this last will be in the direction of the rotation axis. The small axis of the ellipse will
be the product of the radius of the original circle multiplied by the cosine of the angle rotated. For example, if an axis at 45
degrees wiht the horizontal is drawn and an angle of 60 degrees is chosen for the rotation, and if a circle is rotated it will
be obtained an ellipse with its bigger axis equal to the one of the circle and forming an angle of 45 degrees with the
horizontal. The smaller axis, perpendicular to the bigger, will have a length of "cos(60)=1/2" times the bigger one. So, one
half.
This behavior of rotations is exactly the same for rotations around the "X" and "Y" axis, the only difference being their
directions and the fact that those last are performed around the center of the objects or groups. Not so in the former case if
the "special" axis doesn't cut the center. A rotation around the "Y" axis of 60 degrees will change a circle to a vertical
ellipse with the same vertical axis as the circle and the same directions but one half in length, of the horizontal axis. But
there will be no translation. On the contrary, a "special-vertical-axis" at the side of a circle will create the same ellipse but
translated. One final point about affine rotations must be mentioned: they cannot be applied to text althought they could
be, so, this is something to be stablish in the future. For normal, usual rotations of text the "direct" method is employed:
rotate by hand their support line.
Probably, the most interesting or useful rotation is the one around the "Z" axis, so, in the plane of the canvas. It is the
"typical" rotation in 2-D and it must be remembered that the positive rotation in METAGRAF's axis is clockwise.
The second group of affine transformations includes the general scaling, the horizontal or vertical one and the scaling
tra_obj2.html (1 of 2) [5/30/2002 10:08:42 PM]
acording with the perpendicular direction to the screen of no practical use in 2-D. Those transformations are really straight
forward and almost nothing must be said about them. Nevertheless, there is a very important point that must be mentioned
and it is related with text. All changes in text size are done trough scaling. And this is true for tex fonts and/or postscript
fonts, in all their possible aspects, so, including mathematical symbols and formulae. A few test with some written text
will show how it works and the results. (It will be explained in detail in due chapter).
The third group of affine transformations is related with shear. Any "transformable" object , including text, can be shared
in the "X", "Y" or "Z" directions (the last one without practical interest). Any other shear can be made superimposing a
shear trough the first two axis. The shear is produced in such a way that with positive amounts of shear in "X" direction,
will produce a rotation of a vertical line in counterclockwise way. So, it is usual, if forgotten this point, to have some
surprise when looking trough ghostview the picture created. And, specially, if some "slanted-text" was tried. It must not be
forgotten to click the "+/-" button of the slider when doing this. (Anyway, to correct it is the easiest thing).
Finally, the last group of affine transformations is the simplest one: translations. Usually of little use in 2-D they are very
important if some object is wanted with some special position with respect to the "Z" axis. In 2-D, practically all
translations are done by direct manipulation with the mouse or arrow-keys.
Before ending this chapter some precissions are needed. The first one is that it is NOT recommended to try any scaling of
text before reading the specific chapters. The scale is different as for other objects and inconsistent results will be obtained.
Another point is the need to mention that some objects dont accepts affine transformations. Special mention must be made
of the ARC object. It accept some simple transformations, as general scaling and rotation around the "Z" axis, but not 3-D
involved transformations. The same can be said regarding the spiral object, although significant transformations can be
done (only to be seen with ghostview or in final draw but not in screen). It will be mentioned the possibility of scaling
along "X" or "Y" axis and rotate around "Z" axis.
INDEX
tra_obj2.html (2 of 2) [5/30/2002 10:08:42 PM]
METAGRAF'S MANUAL
MANIPULATING OBJECTS
INDEX
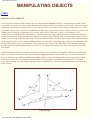
MANIPULATING OBJECTS
The first point to mention in this chapter is the one related with the selection of objects. Selecting objects in MG can be
very simple or, in some way, tricky; and it depends on the number and the type of objects on the screen. Once used to the
application, all difficulties desappear, but, I must confess that I have been criticized in relation with this item. So, a clear
explanation seems needed. It must be said that there are three ways of selecting an object, and one of them never fails. The
simplest way of selection, as has been said, is to click on the object. If this one is "alone" it will change to "red"
immediately, so, no trouble. BUT, if the object is "inside" another one, bigger and more recent, its selection by the direct
method is not possible. In this last (and only important) case, there are two option. Once more the simplest is to click the
"double-arrow" button. Each time this button is clicked, a different object is selected. Theoretically, this would be enough
for the goal, but if the screen is plenty of different objects, it is needed to click many times, what can be cumbersome and
boring. And, what is worse, it is possible to click too quickly and "overpass" the right object. Then the whole operation
must be repeated. A small improvement is to use the "Q" key instead of the button. The effect is the same but it is easier
and simpler.
A third possibility, and the one used by myself almost always, is to use the "mouse-dragging" method. As has been said
before, it is possible to select an object by clicking and dragging the mouse -in reset state- over it in such a way that the
object is included in its totallity inside the red rectangle visible as long as the button of the mouse is not released. With
some short practice, it is very simple to use this method. The only point to remember is to include ONLY the object
wanted in its totallity. So, some simple technique must be acquaired. The sequence of operations proposed can be seen in
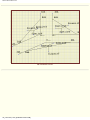
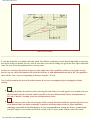
those pictures:
Final drawing.
tra_man2.html (1 of 6) [5/30/2002 10:08:43 PM]
METAGRAF'S MANUAL
METAGRAF screen.
tra_man2.html (2 of 6) [5/30/2002 10:08:43 PM]
METAGRAF'S MANUAL
Text to be modified.
tra_man2.html (3 of 6) [5/30/2002 10:08:43 PM]
METAGRAF'S MANUAL
Rectangle created by clicking and dragging the mouse.
tra_man2.html (4 of 6) [5/30/2002 10:08:43 PM]
METAGRAF'S MANUAL
Line of text selected
To use this method is very simple and really quick. Nevertheless, sometimes it seems almost impossible to select just
one object as there is another one very close to it. In those cases, the best thing is to group the close object with some
other far away. Then the problem doesn't exist any more.
In short, for selecting objects there is always a quite simple way if the capabilities and way of using MG are well
known. Anyway, the actual situation will not be the final one, as with implementation in full of the 3-D capabilities,
there will be "true" layers corresponding to distance along the "Z" axis.
Now it will be explained in short which other buttons do we have to manipulate objects changing its default
settings.
●
Clicking this button the small screen for selecting the kind of line to be used appears. It is needed to have an
object already selected -as ususal- and it is possible to choose a different kind of lines, from plain ones to
five other "models" acording to the size and separation of traits.
●
With this button a clone of the selected object will be created. Extremely useful for repeated objects it is one
of the buttons that I use almost continually. It must be said that groups can also be cloned and this is
something not possible in first distributions. It is not recommended for cloning the all new "geometricallyattached" objects, a new feature in this first version of the 1.2 series. Some of them, will not be cloned.
tra_man2.html (5 of 6) [5/30/2002 10:08:43 PM]
METAGRAF'S MANUAL
●
,
Those buttons serves for grouping and ungrouping the selected objects or groups. Very useful they simplify
a lot some activities inside MG.
●
Button for giving any color wanted to points, lines, contours...etc. It is possible to come back always to the
original color -black- just by selecting it and chossing black.
●
,
Those buttons are for filling and unfilling colors in closed objects. Now, its capabilities have been expanded
so it is possible to fill with color non-closed objects, as polylines and bezier curves. The color will fill the
open object supossing that the last line correspond to the join of the first and last point of the polyline. This
capability is very interesting when doing "compound-objects", for example a rectangular base done with a
polyline and a curved top done with a bezier, and everything filled with the same color.
The second button unfills any filled selected object.
●
With this button it is possible to eliminate any selected object by clicking it once the object has been
selected.
INDEX
tra_man2.html (6 of 6) [5/30/2002 10:08:43 PM]
METAGRAF'S MANUAL
USE OF FILES
INDEX
WORKING WITH FILES
METAGRAF is an application to create MetaPost files in a simple, straight forward and quickly way without the need to
write by hand the different steps of the drawing, as was necessary before. It is a must for some people that need the
exceptional quality of metapost but don't have the time to create by hand all their drawings, as myself. Inasmuch MG gives
some new capabilities to MP making use of facilities outside MetaPost scope but available for other programming
languages, in particular Java. Nevertheless, it must be emphasized the fact that MG will never subtitute MP as a whole. For
very special drawings, the need to "write by hand" will be always maintained. And, what is more important, many people
find a special joy in doing that. (MG has not been created to distroy any kind of human joys).
Having stated the goal of MG it is time now to know how the final drawings, the files with the drawings at medium or
final state, are manipulated: saved, named, recovered...etc. This chapter is about all that.
As MG is NOT a WYSIWYG graphical editor, (althought it could be, always with some differences to the final
"product"), the usual way of working with it is using quite frequently the "GV"/"GHOSTVIEW" application. And this is so
to see the aspect of the "real" drawing at any stage. (Having been written in Linux, the use of "gv" is extremely simple and
very quick. Sometimes, testing MG in Win* it has been remarked a not so quick launching of ghostview. This problem is
out of our scope and it would be a nice service if "someone" could improve that). As, by the time, MG has not an "undo"
capability, the system used is to save the drawing everytime the ghostview application is called. In this way, there will be
enough stages of the drawing saved to recover it if something wrong has been done after one of the savings.
When a drawing is saved in MG, it is "totally" saved and so, it can be "totally" recovered. The way that all that works is as
follows:
●
●
●
●
●
The tree of directories created when installing METAGRAF is very simple: A principal one where it is included
the "launcher" called MG, that has the name "metagraf". Inside "metagraf" there are some other directories. For
our present interest, there are two of special interest: One called "files" and another called "scripts".
When "gv" is invoqued (the small-ghost-button is clicked), two effects are produced. One of those is the launching
of ghostview screen where the up-to-the-moment drawing can be seen. The other is the saving of the metapost and
java files corresponding to this drawing and this is saved in directory "files". The name of those files will always
be "graf_(number).mp" and the same with extension "bmg". The first correspond to the metapost file. The second
to the java file. The (number) will be some number corresponding to the number of times that ghostview has been
invoqued.
The metapost file is just the transcription of the drawing to MP language and its graphical translation is what is
shown in ghostview screen. The java file is the metagraf file that can be recovered at any moment.
There are two ways of recovering a drawing. The first one is "pasting" the drawing with what is already in screen.
This is usefull for create a macro-library that can be used at any time. The second way of recovering an image is
by "substituting" what is in the screen by the imported file. This is used when some mistake has been done after
the (usually) last saving.
Recovering a file and pasting or substituting it with the actual drawing is done as follows:
1. Click the "open-file" button (besides the "diskette-save" one). A file-chooser will appear open in the
directory "files". If our drawing to be pasted is inside this directory (as it must), clicking on its name and
tra_fin2.html (1 of 2) [5/30/2002 10:08:43 PM]
METAGRAF'S MANUAL
●
●
●
then the OK button will put the drawing on the screen in exactly the same position as it was when saved.
(To group the whole drawing before saving is a good habit. Just clicking on the top, red-border button).
2. If the file is in another directory the only difference is to "go" to this directory with the file-chooser, select
the file and click OK.
3. When the goal is tu substitue, not to paste, the only difference is that before clicking the "open" button,
the CTRL-key must be pressed. The rest is exactly the same.
One point to remark is that when closing METAGRAF using the "exit" button, all the files in the directory "files"
and with the name "graf*" will be erased. (So, BEWARE!). Not so with files with other names, as "files" is the
right place to save the eventual macros. In short, if the session is closed with the exit button, MG "guess" that the
files created along the session are not needed anymore and delete them. If for some reason it is preferred to
maintain those files, MG can be closed closing the principal window. In that case, everything will be maintained
untouched in directory "files", but if another session begun, the existing graf_1.* , graf_2.* ...etc., files will be
overwritten when the ghost button is clicked.
Once the drawing is finished it must be saved with the name wanted in the directory chosen. For doing that, the
"save" button must be clicked and the file chooser will open in our home directory.
If for some reason, this last step is forgotten and MG closed, don't panic. There is always a copy of the last
metapost file in the "scripts" directory under the name "graf.mp" and another of the same file after compilation
trough mpost in the same directory with the name "graf.1", ready to be included in any latex file (using "
\includegraphics{graf.1}" for example.) Those files will be overwritten in next session with MG.
Before the end of the chapter, some remarks must be done in relation with the launching of ghostview/gv and the button
"GV-PS" at right. Clicking this button the small window below will show alternatively "gv-tex" or "gv-ps". The former,
default one, means that the metapost file will be processed trough "mpost" and then trough "latex", "dvips" and shown the
resulting "ps". It is the right position if some text is included in the drawing. Otherwise, the position "gv-ps" is preferred as
in this case the file is processed only trough "mpost" and the drawing will be in the same position as in the screen
INDEX
tra_fin2.html (2 of 2) [5/30/2002 10:08:43 PM]
TEXT POSSIBILITIES
INDEX
USING TEXT
The use of text on METAGRAF can be discussed acording with two "big" classifications. On one side there is the usual,
standard straight text; on the other there is one of the "strongest" points of MG: the capability to write and include in any
metapost drawing, curved text in the simplest and easiest way. The former will be explained in what follows and
afterwards there will be a complete revue of curved text.
To begin with, it will be included a listing of the possibilities allowed by METAGRAF with "normal" text.
●
●
●
●
●
●
●
●
●
●
●
Text can be used trough the standard tex fonts, so, from the computer modern family.
Also the usual postscripts fonts included in most of the TeX distributions, that is, "Times", "Palatino", "Helvetic",
"Utopy", "AvantGarde", "ZapChancery", "Bookman", "NewCentury" and "Charter", are allowed without
restrictions.
New fonts can be implemented in a simple way, or, at least, with no greater difficulty as installing them for use
with TeX/LaTeX.
All kind of mathematical text allowed by TeX is also allowed in MG.
The use of postscript fonts don't create any difficulty if compared with the computer modern fonts. They can be
visualize trough ghostview in the same way and included in drawings to be used in a LaTeX file with no
differences.
Using any kind of fonts, text can be scaled with no practical limits. And this as a general scaling or a horizontalonly or vertical-only or mixed (different-horizontal-vertical-scale) way.
It is possible to create any type of "slanted" text with any of the mentioned fonts.
It is possible to create "special-effects" fonts, as, for example, transforming an italic font in a vertical, roman, one,
obtaining curious shapes.
All the above capabilities can be used also with mathematical fonts.
Any straight text can be rotated to any angle with a simple rotation of the its support-line. From 0 to 360 degrees.
Any color is allowed for its use with any font, including math ones.
Any of this possibilities can be used in the simplest way, just clicking a couple of buttons or choosing from a clear menu.
Regarding curved text, there is also a big amount of possibilities to choose from with just one restriction. This last is clear:
No mathematical text can be curved (how will be a square root of a big fraction curved 90 degrees along its
axis?...althought, why not?, perhaps some day...).
Text along a curved path has in MG the possibilities that follows:
●
●
●
●
Everything mentioned about straight text and related with the different family of fonts, applies equally to curved
text.
Exactly the same applies in relation to scaling or slanting of fonts.
Also, the same possibilities regarding colors.
Once the curved text created and visualized trough ghostview, the support curve can be modified in the simplest
way to improve the final result.
tex_pos2.html (1 of 3) [5/30/2002 10:08:44 PM]
●
●
●
●
The path along which the text is placed -usually a curve open or closed- can be placed at the level of the textmiddle-line or this late can be placed over the curve or under it, with different and interesting consequences.
The beginning of the text can be the same as the beginning of the curve or not. It is possible to choose where the
text begin.
It is possible to modify the distance between the glyphs as much as wanted.
It is also possible to show the support line or to hide it. So, it is possible to give a curved name to a curved line in a
drawing with nice effects.
Finally it must be said that it is possible to use different fonts in the same drawing, straight or curved, scaled or not...etc.
Hereby this example of a draw done exclusively with fonts.
tex_pos2.html (2 of 3) [5/30/2002 10:08:44 PM]
INDEX
tex_pos2.html (3 of 3) [5/30/2002 10:08:44 PM]
METAGRAF'S MANUAL
TEXT CONTROLS
INDEX
CONTROLING TEXT
For putting some text on a drawing the first thing to do is to write this text. The place reserved by MG to write text is the
small text field in the upper left of the screen. Althought small, it accepts any length of written text. If longer than the
small window, the words will scroll to the left. Once done, to place the text in due place, the button with the big "T" at left
must be clicked and then clicking and dragging the mouse on the screen a red line will appear. This is the support line for
text. When selected, only a red line will be visible. If unselected, the text will appear. The length of the line has no
influence of any kind. The "critical" point of the line is the origin, as the text will be placed in the final drawing around this
point in such a way as to make the point the center of the theoretical box containing this text. So, it will be center-justified
horizontally and vertically. When selected, the support line can be manipulated as a simple straight line. It can be
translated or rotated in the same way, and the text will follow exactly this movement. When not selected and if the line is
not horizontal, it can be seen sometimes a certain difference between the angle of the line and that of the text. In the final
drawing it will be positioned exactly acording to the line-support position.
By default MG uses LaTeX as the "standard language", so, care must be taken in creating the needed environment for
using MetaPost with LaTeX. If some user prefer to use TeX, the button at right with the title "La/TeX" must be pressed so
as to read "TeX" in the small window below. When writing math expressions, these must be enclosed between dollar signs
"$", as usual. Also the standar expressions can (and must) be used; for example "\displaystyle" if high glyphs or not
reduced fractions are wanted.
If postscript fonts are used the process is the same with just one step more to be done. Once the line drawn and selected,
the button with the three letters "A,B,C" must be clicked. A window will appear where the type of font can be chosen in
the usual way. All modifications in scaling, shearing (slanting) and rotating will be done in the same way for any kind of
font.
For the more precise control of text when scaling it, the big slider used to choose the scale, works in a different way as
usually. The difference is that the "neutral" point, that's mean, no scaling, is obtained for a value of 100. If the size wanted
is double the standard, the slider must be placed over number 20 and then the small right button with "x10", clicked, so as
to read 200 in the small "SCALE" window at right.
More graphical details will be given in the last, general chapter.
INDEX
tex_ima2.html [5/30/2002 10:08:44 PM]
METAGRAF'S MANUAL
TEXT ALONG A PATH
INDEX
TEXT ON CURVED PATHS
It has been explained already what kind of curved text can be created with MG, and the different modifications that are
allowed. Now it is time to explain how to do all that in practice and using the tools provided.
To put some curved text on a drawing the first thing to do is the same as with normal, straight text: to write what is wanted
on the text field provided for it.
Then the "text-button" must be clicked and with the mouse cursor over the screen, click and dragg. Doing that, as usually,
will let appear a red line. So, up to this moment, everything is exactly de same as with "normal" text.
The first big difference begins now: when writing curved text the place where the "old_support_line" and the size, shape or
angle of this last, have no influence of any kind on the final result. It is suggested to put the text in some place, visible but
not disturbing, so as to be able to read what has been written and that it has been done in the right way. Otherwise, it can
be modified at any moment in the standard way using the "correct" button.
Once this first step finished it must be chosen the font to be used, so, usually, the postscript window must be opened and
the font selected. (In the actual situation, the standard computer-modern fonts have not been implemented for curved text,
although there is no special difficulty in doing it. Contact me if it is wanted).. The usual scaling and/or slanting of text
using the big slider has no meaning in this situation.
Once the font chosen and with the support line selected -red- the button at right with the title "Tx.Pth" must be clicked. On
the small window below, the word "False" will change to "True". It is recommended to unselect the support-line and click
once more the same button to change the display to "False" once more.
Having finished the text preparation, now the curve to be used must be created. All curved objects can be used, althought
they must be understood first. For example, the bezier circle begin in the right extrem and goes in a clockwise way. The
oval begin at left and continue to the right, also in clockwise sense. It is much more convenient, usually, to use this last
than the former, but it must not been forgotten that any object can be rotated to place the origin where it is desired.
The bezier curve is the most convenient as anything can be done. It begin where the first click has been made and goes in a
natural sense, point by point.
Some precissions must be made. It is absolutly necessary to prepare the text BEFORE creating the curve OR, if the curve
already exist on the screen when the text is placed, after the preparation of the text, the curve must be grouped, alone, and
ungouped immediatly. Doing that, the curve will be the last object in the internal list of MG, and this is needed to place the
text over it.
Now it is time to select the curve and to click once more the "Tx.Pth" button to be able to see the word "True" in the small
screen. The steps done up to now, constitute the standard routine to create curved text. Always the same, to be used to it
doesn't take more than a couple of days; afterwards, it is done almost "mechanically".
tex_cur2.html (1 of 2) [5/30/2002 10:08:44 PM]
METAGRAF'S MANUAL
To finish the process, the button at right with the title "TxPar" must be clicked. Immediatly a small window with some
radio-buttons will appear. There are tooltips for all those buttons. The first two serve to choose the horizontal and vertical
scale for the glyphs. The third permits slanting. With the fourth the curve or path, can be also scaled, althought its
usefulnes is not very clear. The fifth radio-button permits to place the text more or less close to the curve in a "vertical"
sense. With the next , it is possible to choose the separation from the beginning of the curve. The seventh is quite
important as it serves to set up the separation between the glyphs. The other two buttons are only for the curve itself: if
nothing is done, the curve will not appear in the final drawing. If it is wanted to let it shown, the last button must be used
after writing the thickness of the line in the small text field. The other button only serves to change the color of the curved
line.
When al details have been finished, it is IMPERATIVE to click once more the button "TxPar". Having done that, the
curved text is ready to be seen trough ghostview, so the "small-ghost" button can be clicked to launch it.
Althought it would be nothing to be done with the window launched by clicking "TxPar", it is imperative to click this
button at least twice, the first time to launch the window and the second to hide it.
Usually, when the text shown in ghostview is looked in detail, there must be done some adjustment of size and/or position
of the glyphs or the curve. This is done in the simplest way. The curve can be modified at will at any moment without the
need to click any button and the same is true for the type of font of the text. It can be changed as many times as wanted,
and launching ghostview the different aspects controlled.
To finish with this item I must emphasize the need to practice a little bit as the reward is worthwhile.
INDEX
tex_cur2.html (2 of 2) [5/30/2002 10:08:44 PM]
METAGRAF'S MANUAL
SUMMING UP
INDEX
GENERAL REVIEW
Althought this file was written a few months ago, I have not changed it as it serves as a resumé off everything explained before. Some
small differences could exist, but basically, in the items mentioned, it is up to date.
The present version (1.1.1) has many new useful features. Some will show the impressive future possibilities of MG.
Here is a short list of the newest improvements:
●
One of the ``least appreciated'' features of MG was the need to click the big button at left with the name "SET/RESET" many times. This
is history. Now, you can hit the key "ESC", or, better still, you can click the right mouse button on the fly to obtain the same result. The
big left button is always there -with a nice icon of MG- but it has a new function as will be explained in "Last-minute items". Is everybody
happy now?
❍
❍
❍
❍
❍
❍
❍
The way of saving-viewing-recovering drawings has been changed and will be explained in detail later on.
Now it is possible to save "anything anywhere" and to open "anything from anywhere". There are not many restrictions.
To "paste" macro drawings there is no need to look for special files and click 3 or 4 times here and there. Now, just open a file
with a simple click. You can also press the "CTRL" key at the same time.
To create and edit lines of text included in a drawing, a new system has been developed that is much simpler and convenient. It
will be explained in greater detail below. The old editor, nonetheless, has been maintained in order to write lines of program by
hand or "secret messages" that will be included in the drawing, but not seen in MG. So no changes to the old editor of little use -if
any- now.
One "small step for us but huge for man kind"..., is the all new capability that we present, from the very "alpha-beginning", of
inserting postscript files on the screen of MG. They can then be graphically edited and saved as metapost files. However, you can
not do this with text in the current version. We hope to have this capability shortly. Anything related with lines and shapes works
quite well, at least in the few tests we have done. One important advantage of this facility is the possibility of recovering old
metapost files as will be explained.
One smaller step for us and much smaller for the "not windowed" human kind is the inclusion in this version of the right scripts
for Windows users for working in a normal way. For the sophisticated users, we hope to obtain some help.
Scrollbars have been included as some people asked for it. But the old standard MG's sliders have been maintained as they are
very convenient for moving the drawing, centering it or many other things.
Finally and to maintain the size of this summup to a reasonable size, we have to mention one other "important" new feature. This
is the one related with the inclusion of pictures or similar images in metapost files, thereby increasing the versatility of MG.
Unfortunately, this has been cataloged as a "sophisticated" feature, so it is not as simple to use in Windows as in Unix.
Nevertheless, although at an alpha stage, we have had some success with a couple of Unix instructions used in Windows trough
cygwin.
And now it's time to begin with the detailed explanations of how to use MG and how to exploit its capabilities to the maximum.
Working with Metagraf 1.1.1
Introduction.html (1 of 10) [5/30/2002 10:08:46 PM]
METAGRAF'S MANUAL
The importance of grouping
It is very important to understand the preferred way of working with MG. The capability to group objects has been improved in this latest version.
Working with groups is now a lot quicker and safer. This means that if some optimization is wanted it is recommended to group objects as soon as
they are finished. Working with groups simplifies a lot some common tasks. For example, we can create "composite objects" that, once finished,
will not be modified any more. For those cases I have included the button "ATTACH" on the right. Once a few objects are "attached" in a group
they can not be ungrouped anymore. (So be cautious.) It is possible to draw new objects, text, etc. over or under the attached group, but this kind of
group will be maintained as it is "forever and ever...." as it really is a new object.
Before beginning a drawing in MG, one or two minutes of reflection can be quite useful. The advantage of this is not to be underestimated. One or
two minutes can save one or two hours of modifying lines, changing text and so on, as is common with other well known programs. The incredible
simplicity for moving, cloning or resizing objects and groups in MG, makes it child's play to finish a part of a drawing in a few minutes. Then,
group and view. (More about viewing later on). Once the drawing is grouped and viewed, it is safe and we can continue with the next step.
As we have given so much importance to groups in MG, let's find out what the tools are for working with them:
●
First of all we have the two general buttons for grouping:
●
In addition, there is the "group and select everything" button:
and ungrouping:
that we know from past versions.
and the new "ungroup everything" button:
at right
(exception: the attached groups).
●
Finally, there is this "famous" attaching button:
at right.
Those buttons work in a straightforward way. They do what they promise to do. However, there are some subtle differences that must be
explained. For the two general buttons to work, the objects must be selected (selected objects are red color). To use the ungroup, we first select a
group. Then, clicking the ungroup button will ungroup the objects and leave them in a selected state, thus colored red.
The third one works just by clicking it. All the objects on the screen, singles or groups, selected or not, will be grouped and the group then
selected.
The fourth doesn't care about selections of any kind. It is the same It is the same to whether some groups are selected and not. It will ungroup
everything -with the exception noted. But, it will ungroup all the objects and leave them in a NOT selected state. Finally, for attaching objects it is
necessary to group them and immediately to click the attach button. The group will be converted to a new object (so, be careful).
One last thing to be said about groups is that their use makes it easier to select objects. In fact, when a new group is created, it is placed over the
last object created on the screen ( as it is the last object). One way to change the order of objects and to make one of them the "last one" is simply
to select it, to group itself alone and to ungroup it. It will be placed over all the rest on the screen. The user should experiment with this mechanism
as it is useful with selection (one of the points to improve in the TO DO list of MG).
A new way of saving, viewing and recovering files
This has been totally changed. The new way is very simple and convenient. When something is drawn on the screen and we want to see it "the real
way" or to save it, both things are done just by clicking the ghost button:
When this button is clicked two things takes place: on one side the
file is processed and the "ghostview" screen launched (more precisely, gv in Unix and gsview32 in Windows). It will appear on the screen with the
drawing done "up to the moment". Adotionally, a couple of new files with the general name: graf_num.mp and graf_num.bmg are created in the
directory files, where "num" is a number beginning with 1 and increasing one unit every time the ghost button is clicked. (More about the
distribution of directories in this release later on).
In this way just by viewing the drawing, we save a copy of it. However, when exiting MG by clicking the "bye bye" button:
, all the files
saved with the name graf_num.* in directory files will be erased. If we begin another MG session and open this directory, it will be empty of those
files. So, our drawing is safe temporarily. To save it "forever and ever" we must click the save button:
and choose a name and a directory to
put it. Sometimes, it is convenient to give it a name and save it in the directory files. This will not be erased upon exiting via the bye button if its
name does not begin with "graf". We must mention that if MG is closed by clicking the closing button on the external window, no files will be
deleted.
Introduction.html (2 of 10) [5/30/2002 10:08:46 PM]
METAGRAF'S MANUAL
It is a good practice to group the drawing before saving it. Many times you will also find that once a part of a drawing is finished and saved , you
can delete leaving your screen less cluttered, and then continue working.
All the points related with "saving" are in a close relationship with those related with "recovering" or opening
To recover a part of a picture already saved and deleted from screen, we have to click the open button:
and choose the file to paste. Just by
clicking open, the drawing will be pasted on the screen in the same place, and exactly as it was when we saved it. (The old bug when recovering
files with text written in TeX/LaTeX, has been fixed.). If you want to substitute a drawing for the current one (that is, not paste a drawing onto the
drawing on the screen), then press CTRL key before clicking the open button. The drawing on the screen will disappear and the saved one will
take its place.
In both cases, saving and opening, it is possible (and simple) to open any directory to save or open the file.
Writing and editing text
A new way for writing and editing simple text in drawings has been developed. The upper left part of MG's screen with the label with the name of
the program has been replaced by a relatively small text field. Although small, the text scrolls at the end of the visible text field, so text of any
length can be written.
To place text in the drawing it is not necessary to launch the editor as before. Just click on the text field to place the cursor and write anything.
Then click the "place text" button:
and click and drag on the screen. A red line will be visible and as before the text will have its center on
the first point clicked.The length of the line drawn doesn't matter. Just a point is enough (but you will have difficulties in moving or selecting it
afterwards).
After clicking the right mouse button, your text will appear, and if you continue to work, you will see that the text field has been cleared. You can
write as many texts as you want and place them anywhere. To edit any text already inserted in a drawing, click a couple of times over the line of
the text. Then you will see this text appear once more on the text field where you can edit it. Once done and before any other action, the correct
button:
, at right must be clicked. You will see that the text on the screen has changed to the new one.
So, to modify any written text on screen the steps are:
●
●
●
click the text
modify it on the text field
click the correct button.
Using the small text field window for this action has been chosen for reasons of simplicity, as it is much easier to see the clean text than be
required to work on the screen with grids, lines of other objects, etc.
Introduction.html (3 of 10) [5/30/2002 10:08:46 PM]
METAGRAF'S MANUAL
The old editor has been maintained for two reasons. First, it is needed if we want to input some lines of written text on the drawing. As it is known,
we can write direct metapost code in the editor and then place it in the file just by clicking the metapost button:
and then over the
screen. Second, it allows one to modify a final file by hand (some details, text .... and so on) and to save it in this modified state.
Mouse cursor
We have decided to let "nature as it is" and did not change the standard cursors. After designing the "perfect cursor" for every need, we have
realized that it changed not only with every O.S., but also with many window managers in Linux. So, back to the standard used by Java. Let's say a
couple of words about them.
In Windows, the standard cursors are the cross-hair (not very small) one and the vertical hand closed but one finger extended. In Unix, the same
cross-hair (but smaller) while the hand is horizontal and also smaller and with a finger extended.
Anyway, when we see the cross-hair cursor it means that if we click on the screen a new object will be created. We must be careful about that.
Often times we just want to select an object to move or resize/reshape it but we have forgotten to go from the "create objects state". Then, just as
we are about to click the mouse button, we realize our mistake and click the right button of the mouse. The little hand with extended finger is there
and clicking once more we see our object selected (red) as we wanted. The work continues; we are happy with it and at some moment we want to
see/save it. We click the ghost button and ... nothing happens. Let's see why.
Suppose that the last object created was a rectangle. We have not deactivated the "create object state" and we have done a very short click with it
before correcting the mistake. But this "very short" click has been enough to create a problem. The object has been created, but with width and
hight zero, so we don't see it on the screen. Nevertheless it is there, and it has been translated to MetaPost when saving the file. Then to view the
drawing, the file is processed but metapost does not tolerate such errors and does not finish compiling the file. Hence, no postscript output.
A good practice is to always return to the "hand-state" of the cursor as soon as we have created anything. Just click the right button. Other
programs use all three mouse buttons and you must know what to do every moment looking to your right at to try to break the code of the small
drawing. MG only asks you to click the right button every time you create an object. That's all.
Just in case you make this mistake and you realize it, the best thing to do is to try to select the point of the unwanted, minimal object and delete it,
since it will be clearly seen if selected even though a minimal point. If you remember exactly where you have clicked and you are working in
"snap-to-grid" mode, it can be possible (although difficult) to select it. An easier way is to click and drag the mouse (little hand with extended
finger) in a small rectangle around the zone where our short click has been done. The point will appear clearly if it is inside. Finally, if there is a
mess of lines, curves, text and everything, the best thing to do is to select and group everything and immediately ungroup with the standard button.
Doing that, all the objects will be selected, so in red, and we will be able to see our point.
A button to understand
Now let's say something about the structure of directories used by the present MG's distribution. The entire MG program, including the Java virtual
machine, can be downloaded and installed directly from the Web. Once the installation is completed, you will find a master directory with the
name "metagraf". In this directory there will be one file and five directories that make up the MG system. Moreover, there will be some other
files/directories created by the installer. The core of MG is the file metagraf.jar where all the Java classes are included. The five directories that
come with MG are: "images", "src", "manual", "scripts" and "files".
In the scripts directory we have included all the scripts needed to use the facilities for visualizing, writing, launching the helping applications
(ghostview...) and so on. These scripts can be edited, if needed, in order to to suit the user's environment better. However, before doing so, it is
necessary to understand how they work. When the ghost button is clicked, depending on the state of other buttons and/or variables, Java gives
instructions to run some script to create a couple of new files and put them in the directory "files".
What matters now are the scripts, in particular the pair va and go, with or without ".bat" extension (Windows or Linux). If we look at them we will
see that, basically, they do one or two tasks. In the case of "va" it simply runs metapost (mpost) on the file created at this very moment and
launches ghostview (gv) to see the drawing created by metapost. If we compare it with "go", we will see that ``go'' does the same as "va" but the
file created is run trough LaTeX, then through "dvips". The final postscript file is viewed with ghostview as before. So, in some cases LaTeX is
used and in some others it is not.
The reason for all that is the fact that we can include text written or not. One of the strongest points of MG is it's impressive capability of using text
Introduction.html (4 of 10) [5/30/2002 10:08:46 PM]
METAGRAF'S MANUAL
in so many ways as will be seen. We can write mathematical formulas or curved text or use standard postscript fonts ( we have included just a few
), we can scale this text in horizontal or vertical sense, or make the text slanted...etc. But if our drawing has no text, it is not necessary to run the
final file trough Latex. There is a special button to let Java know which choice to make. This is the GV-PS button:
This must be
clicked if we want to use text. Otherwise, we will not be able to see our files, although the mp files created will be o.k. If we forget which state we
are in, there is a small window that indicates the current state, tex or latex. Specifically, if we don't need LaTeX, then we must see this label:
. But if we need to process the file trough LaTeX, this other label must been:
Finally, another point to mention is that if you use the simple "va" script, you will have your drawing in the same place as it is on MG's screen.
But, if you want to process trough LaTeX, the drawing will be displaced to the top-left of the screen. (If you do not like that, you can always place
a couple of minimal points in the upper corners of MG's screen.)
Cloning
Copying (cloning) and moving objects and/or groups is simple in MG. For cloning, there is the copy button:
. Everytime you click over it, an
exact copy with all the attributes of the objects/groups selected is made. The original remains selected so if you click a second time another copy is
done, and so on. Let's see how you can use this capability.
Suposse that you want to draw an image like this one:
. One way of doing is to draw a
right line and put an arrow at the end, change the color to blue and click the copy button 15 times. Then, by placing the end of the extended finger
of the cursor over the line and clicking and dragging the mouse, we can posotion each copy as desired. However, it is a lot quicker to make a first
copy of the arrowline, move it to its place, click the "group and select everything" button and once more click the copy button. Moving the group
is easier than movin a single arrowline. Now, move the group (it is easier to move a group than a single arrowline) and after putting the second
group in place we repeat the operation. In the end we need only four operations instead of 15.
Here is another example with the same arrows. We will create the following figure:
One way of doing would be to go through the same steps as in the previous example, and then rotate the figure and the lines ..etc. That would be
involved and probably not give the best results.
A better way is to rotate the first arrowline (in this case 30 degrees) and then make copies by groups as above and then rotate the whole group.
This will only take a couple of minutes and the quality of the final drawing will be outstanding, as can be seen in the picture bellow. This is a x8
zoom of the beginning of the other one.
Introduction.html (5 of 10) [5/30/2002 10:08:46 PM]
METAGRAF'S MANUAL
Important details
Now, a few comments to bring to attention a couple of features that are important, but not always clear for the user.
1. When an object is selected and you want to select more objects, the way to do it is to press the SHIFT key and click with the mouse on the
others objects being selected.
2. If you want to move an object very precisely, the best thing to do is to select the object and to hit the arrow keys on the keyboard. Each hit
moves the object one pixel.
3. Most of the buttons in the toolbox, can be clicked with the mouse but also have a letter associated that can be used from the keyboard. The
key can be seen when putting the mouse over the button and looking at the tooltip that appears. This is quite useful, for example, when
there are many objects on the screen and we want to select one of them. Instead of many mouse clicks on the change layer button:
it
is easier to hit the "Q" key a few times.
4. For putting arrow-heads over any line, usually it is necessary to click the arrow button:
TWICE. The first time to launch the small
arrow-panel and the second for "transferring" the type selected to the line. However, if we have many lines selected and want to put
arrowheads at the end of each, we need only to select all the lines and click just once.
5. Sometimes and depending on the O.S. the click over the button seems to do nothing. If this happens, you need to click once more. The last
buttons included in the toolbox are "transparent". So, if the click works o.k., the button will have a darker color at the time of clicking.
Moreover, some important buttons will "beep" when clicked o.k. This is the case for the arrow button, for the save button, for the copy
button, and some others.
Beautiful things
Now few lines about pictures or images and some examples. To begin with, let's look at a couple of nice, simple pictures (done a few moments
ago). We have used our "linuxed" friend, TUX. Here they are:
Introduction.html (6 of 10) [5/30/2002 10:08:46 PM]
METAGRAF'S MANUAL
Introduction.html (7 of 10) [5/30/2002 10:08:46 PM]
METAGRAF'S MANUAL
The interest of the last one is that it has been done in Windows with no help from anything else other than MG distribution. All the pictures have
been opened with Gimp and saved as JPEG with it. The same could be done with Photoshop or any other similar program. The pictures are
obtained as the special postscript files produced by MetaPost and can be included directly in any LaTeX document if wanted.
Now, let's see how to include JPEG or GIF images in our MG's screen and output the correponding metapost file.
First of all, we strongly recommend to read the User's Manual included in the Web page dedicated to MpFot, that can be found at
"http://w3.mecanica.upm.es/metapost/mpfot.html". In the manual is an explaination of how to use the different buttons and sliders. Although
different in external aspect, in MG identical concepts are used. When the image button:
is clicked the image-panel will appear:
Clicking the open button an image-chooser will appear trough which we can select the picture. Choosing the file and clicking the OPEN button in
the chooser will launch the image chosen in another panel. Then, we can modify the image in the way explained in MpFot's page.
These are the important steps to remember.. Once the picture is as we want with regard to size, colors ... etc., we must click the button with the
green title "Place" (see picture above). Then, immediatly, the panel with the image will disappear. Then you must clik the paste image button:
. Doing so will change the cursor to the crosshair type (In some cases you will need to click twice this button. This depend on the O.S. or the
Window Manager), the image-panel will disappear and clicking at any place on the screen, the picture will appear having as the left-top corner the
Introduction.html (8 of 10) [5/30/2002 10:08:46 PM]
METAGRAF'S MANUAL
point clicked. After clicking the mouse right button, you can move the image in exactly the same way as any other object. When the picture is
selected a red rectangle will countour it.
We will discuss more on images, later on.
Text over curves
Text over curves has been a favorite topic of discussion in the metapost's newsgroups. But, with MG, this is an easy matter, if some important
points are kept in mind.
Usually, the written text is placed over a curve, but the curve is not shown. The way to procced is as follows:
Let's suposse that we want to place curved text in our drawing. The first thing to do is to write the text, that is, the paragraph or title or whatever.
We do this in the usual way.The only special point in this case is that the place where we put the text has no importance at all. You can put it in the
upper middle part, as I do, or as others would prefer, put it at the bottom of the page. When the text is placed and the right button clicked, the line
of the text must be selected and the font chosen. For doing that, the "choose postscript font" button:
must be used and from the small panel
shown, the font selected and accepted. Then, maintaining the text selected (line in red), the text-on-the-path button:
must be clicked.
Under the button there is a small window where we can read: "false" until clicked. Then it will change to "true". There is nothing more to do with
the text. Next, we draw a line, perhaps a curved bezier line, or an oval or a circle...Once the line is drawn and selected as usual, we must click once
more the "text-on-the-path" button and then the "text parameters" button:
. A small panel will appear trough which we can choose
almost everything related to our text. If we put the cursor over the radio-buttons a tooltip will explain the purpose of that button.
Radio buttons "XS" and "YS" control the x-scale and y-scale of the fonts. Remember that in this case x-scale means "scale along the tangent to the
curve in the point", and y-scale refers to the perpendicular to the curve.
Radio button "SL" (from "slanted") means the shear in the glyphs. "PS" represents the scale for the curve. "HL" controls the position of the glyphs
in a line perpendicular to the curve. If this value is apprx. "-3" the letters will be placed in the middle of the curve, which is the standard setting.
Radio button "SB" controls the position of the string of text related with the origin of the curve. If the standard null value is accepted, the text will
begin at the origin of the curve. "SG" controls the separation between the glyphs.
"CL" controls the color of the curve if this one is drawn and "TH" the thickness. If this last value is null, the standard, no curve will be drawn. Any
other reasonable value will make appear the curve.
The way to proceed is to write a value (number 2, for example) on the text field and click the button chosen, for example "XS". Upon doing this, a
new value appears on the text field and if we agree with it for another button, we can click immediately this other button. Usually, the best thing is
to delete this new value and write the desired one. In normal, not extremly sophisticated conditions, only buttons "XS", "YS" and "SG" are clicked,
accepting the default values for the others.
Once given the values we must click once more on the text parameter button what makes the Parameter Adjuster Panel to disappear. Our work is
finished and if we want to see the result, the way of doing is to make sure the small window under the GV-PS button displays "gv-tex", click the
ghost button and ghostview will appear and display our text on the path. If we want to readjust some value, then select the curve, click once more
to see the Parameter Adjuster and modify any value. It is not necessary to repeat clicks on buttons that we don't want to modify.
Postscript recovering
This is a feature added in the very last minute and has not been tested much. It will be explained what must be done and I hope to receive some
feedback from the users.
In the "scripts" directory there is a file with the name "ps2mg". You can move this file to any place on your path or to let it where it is. It is an
Introduction.html (9 of 10) [5/30/2002 10:08:46 PM]
METAGRAF'S MANUAL
executable file in Linux. A modification of the well known "pstoedit" from Wolfgang Glunz, in a really alpha stage. (I have not sent anything yet
to Wolfgang as it seems not terribly serious as it is :-)
If you have a postscript file that is a drawing with lines curved or not, you can run "ps2mg" over it (in a standard Linux console) and try to paste
the result on MG's screen. Having "ps2mg" on your path or on the directory where you are working, just write on the Linux console:
ps2mg -f mgraf yourFile.ps yourFile.mg
and press ENTER. If the file is created without error messages on the console, go to MG and click the "open postscript" button:
. Choose the
new file and press "O.K.". You will see appear (hopefully) a new object on MG's screen. From this moment on, this object is a bezier curve or a
polyline of MG and works in the same way.
A first test which demonstrates the precission of this approach is to draw any figure in MG (without text). Then, view and save it. Then, without
closing MG, use "ps2mg" on the "graf_1.1" created and expanding MG recover "graf_1.mg". Compare the pasted image with the original as it will
be placed in exactly the same place.
Apendix
This file will be continued/revised with new additions in the future with clarifications of points that can be difficult to understand. To do this, I
need some feedback from the users telling me, simply, what is not clear or what does not work in their computers. Everyone can collaborate.
NOTE: This file has been corrected graciously and with a lot of patience by our dear friend Richard Noel Fell. We thank him for his great
job.
Copyright
Permission to use, copy, modify, and distribute this software and its documentation for any purpose and without fee or royalty is hereby granted, in
the terms of the GPL license.
SANTIAGO MUELAS. August 2001 (This revision on April 2002)
[email protected]
INDEX
Introduction.html (10 of 10) [5/30/2002 10:08:46 PM]
METAGRAF'S MANUAL
NEW CAPABILITIES
INDEX
OBJECTS GEOMETRICALY ATTACHED
I feel very proud to be able to present a new and very important capability of METAGRAF. I have called it "Geometrical
attachments". The idea is not new at all, but his use mixed with MetaPost is totally original. Moreover, few graphics
programs not specialised on this subject have it. (To my knowledge, no one, appart MG now.)
The idea, as has been said, is simple, and to explain it I will use an example. If in the middle of a drawing it is wanted to
draw a line from one point perpendicular to another line, now MG lets do that just by clicking a button. The object created,
the new line, has "special" caracteristics apart from the standard ones, that it maintains. This new line will go from the
point and will be perpendicular to the other line always. That's mean, if the position of the point or the one of the line is
changed, the created line will change accordingly to acomplish the two conditions mentioned. What is not possible is to
modify the line created modifying its behavior. It can be deleted at any time. Otherwise, and with respect to metapost it
will be a normal, usual line, colored or not, with arrow or without it. Plain or not, and with its thickness modified or not. It
will be seen when launching ghostview as any other line.
At present there exist the possibilities that follow for geometrically attached objects
●
●
●
●
●
●
●
●
●
●
Line that joins two existing points.
Line perpendicular to another from a point.
Line that joins the midle point of another from a point.
Point of intersection of two existing lines.
Line that bisecs two others.
Point of intersection between a line and a circle (Attention: spiral circle only).
Line tangent to a circle in clockwise or counterclockwise way, from a point.
Same as two last but with the "oval" object.
Circle which radius is equal to the length between two points, taking one of them as the center.
Intersecting point between a vertical and a poly lines.
One interesting point is that the points or lines created, serves also to create new geometrical attached objects in such a
way that is possible to have a whole drawing in wich all the objects are related and moving just one point the whole figure
will change acording with the conditions stablished.
Usually, if one "mother" object is selected and moved with the mouse, the effect will be seen only when deselecting the
object. Nevertheless, if a point is selected and displaced with the use of the arrow-keys on the keyboard, the whole
movement is visible (and can be quite astonishing).
Hereby is an example of a figure where everything is "connected"
newthings.html (1 of 2) [5/30/2002 10:08:46 PM]
METAGRAF'S MANUAL
To use this new capability there has been provided a new buttons-window, with icons over the buttons there are self.This window is launched if the MG-icon-button is clicked. Once
explanatory. Here we can see one of them.
the window in view it can be placed anywhere, depending also on the window-manager used. One recommended site is
just over the tools panel with the standard buttons. When clicking the central screen of MG, the new window will
desappear and the objects to be used can be drawn. It is neede to select the objects to be geometrically attached and once
done, the MG-Icon-button can be clicked to make visible the new buttons window. The button corresponding with the
operation wanted must be clicked and then, a new click on central screen will show the new object and deselect the other
selected ones.
This new tool of MG will be expanded in the future to permit a bigger simplicity in drawing and a more precise one. I look
forward to receive suggestions on which kind of attachments could be useful as (almost) everything can be done.
INDEX
newthings.html (2 of 2) [5/30/2002 10:08:46 PM]