1
OMNIMET ENTERPRISE
--f
h
MA861000-4.0
8117/99
"
BUEHLER,Ltd.
41 Waukegan Road
Lake Bluff, Illinois 60044
Manufacturer
Of:
Declares the following product:
OMNIMET ENTERPRISE
To be in accordancewith EC Directive(s);
Safetyof Machinery:
89/392/EEC and 91/368/EEC and 93/44/EEC
according to the following standards:
EN 292
PART 1 1991
EN 292
PART 2 1991
EN 60204 PART 1 1993
Position:
Director of Engineering
Name
ChuckMotley
Signature
MA861000-4.0
EMC Directive:
89/336/EEC and 92/231/EEC according to the
following standards:
EN 50081-1: 1992
EN 50082-1: 1992
Date
1/1/98
8117/99
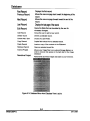
Table of Contents
Description
Page
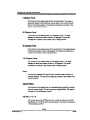
Section 1
~
Overviewof System Functionality
Main Features of the Omnirnet Enterprise
Warranty
Unpacking
System Components
1-1
1:"2
1-3
1-3
1-3
Section 2
Computer Assembly
Stage Control System
Installation
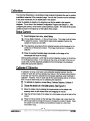
Before You Use the Omnimet Enterprise system
Software Installation for New System
Upgrade Procedure from releases prior to 4.0
Steps on Installing Pixera Camera and Software
Steps on Installing Polaroid DMC Ie Digital Camera and Software
Mitsubishi CP700DU Video Printer Installation
2-1
2-3
2-4
2-5
2-6
2-9
2-12
2-16
2-18
Section 3
,
Hardware Configuration
Video Input Configuration Program
Introduction
Getting Started: 1 Camera and 1 Microscope
Open Hardware Configuration Program
Set Camera Name
Set Microscope Objectives
Confirm Other Factory Settings
Adding Color Analog Cameras
Condfiguration for Adding Color Camera's
Close Hardware Configuration Program
Adding Digital Cameras
Confirm Configuration
Advanced: 2 Cameras and 2 Microscopes
Set Microscope Objectives
Confirm Other Factory Settings
Close Hardware Configuration Program
Confirm Configuration
Advanced: Multiple Cameras and Microscopes
..
Advanced:Only 1 Camerabut 2 Microscopes
Stage Control Configuration Program
Introduction
Open Stage Configuration Program
Add a Record
Delete a Record
Edit a Record
Undo
Edit Stage Setting Window
Set the X, Y, Z Pitch
Set the Inverse Settings
Set the Maximum Speed
Select Cameras
Select Comm Ports
Set the Focus Axis, Backlash, & Interval
MA861000-4.0
3-1
~1
3;';1
3-1
~1
3-2
3-4
3-4
3-4
3-5
3-5
3-6
3-6
3-7
3-7
3-7
3-8
3-8
3-8
3-8
3-9
3-9
3-9
3-10
3-10
3-10
3-11
3-11
3-12
3-13
3-14
3-15
3-16
3-17
8/17/99
Table of Contents
Description
Page
Section 4
BasicCommands
Startingthe Enterprise
ImageFunctions
RoutineFunctions
ResultsWindow
Exitingthe Program
4-1
4-1
4-1
4-3
4-5
4-5
Section 5
Calibration
SetupCamera
CalibrateX Objective
CalibrateXV Objective
CalibrateImage
CalibrateX Image
CalibrateXV Image
ShadingCorrection
ShadingCorrectionSetup
ClearShadingCorrection
5-1
5-1
5-1
5-2
5-3
5-4
5-4
5-5
5-5
5-5
Section 6
Descriptionof Menus
Detailed Description of menus (with Database view minimized)
File
Edit
Annotation
View
Operation
Routine
Setup
Window
Help
Database View Menu Options
File
Database
VIeW
Setup
6-1
6-2
6-2
6-2
6-3
6-3
6-4
6-4
6-5
6-6
6-6
6-7
6-7
6-8
6-9
6-9
Section 7
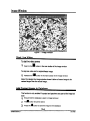
Image Window
Start Live Video
Add Current Image to Database
Grayscale
Black
'M1ite
Pseudocolor
Saturation
Bitplanes
New Image
Open Image
Undo
-
7-1
7-1
7-1
7-2
7-2
7-2
7-2
7-3
7-3
7-3
7-4
7-4
-
MA861000-4.0
8/17/99
Table of Contents
Description
Printing an Image
Copy an Image
Save an Image
Exporting an Image
Image PropertyWindow
Page
7-4
7-4
7-5
7-5
7-6
Section 8
Routine Window
Undo Routine Step
Edit Routine Step
Delete Routine Step
Execute Routine Step
Execute Routine to a Step
Execute All Steps in a Routine
Manual Multifield
Auto Multifield
Guard Frame
Focus
Create a New Routine
Save a Routine
Print a Routine
Stopping Execution of a Routine
Routine Execution Sequence
Routine Property Window
Setup Auto Multifield
Stage Pattern Definition Window
Auto Multifield Run Options Window
Rectangle
User Defined From File
Set Origin Window
8-1
8-2
8-2
8-2
8-3
8-3
8-3
8-4
8-5
8-5
8-5
8-6
8-7
8-7
8-7
8-7
8-8
8-9
8-9
8-10
8-11
8-11
8-11
Section 9
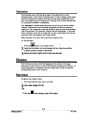
Operations
DisplayingOperationWindow
Acquisition
AverageGrab
Grab
Load Image
RestoreImage
Grayscale
ColorThreshold
Color HLS Threshold
Pause,Color HLS Threshold
Color RGB Threshold
Pause,Color RGB Threshold
GrayscaleThreshold
Pause,Threshold
ThresholdWindow
ThresholdBitplaneSetting
BinaryOperations
Measurement
Frame
9-1
9-1
9-1
9-1
9-1
9-2
9-2
9-2
9-3
9-3
9-4
9-5
9-6
9-6
9-6
9-7
9-7
9-8
9-8
9-9
Table of Contents
Description
ProcessFrame
Guard Frame
RoutineOperations
Add Comments
Pausea Routine
Save Image
Clear Anntations
Add Scale Bar
Page
9-9
9-9
9-11
9-11
9-11
9-11
9-12
9-12
Section 10
Results Window
Print Report
Copy Result
Export Results to Excel
Clear Results
Results Graph Parameter Window
10-1
10-2
10-2
10-2
10-2
10-3
Section 11
Image Edit Toolbar
AnnotationText
Pt to Pt Measure
CurvilinearMeasure
Angle Measure
Line Scan Histogram
Pan
Zoom
Change Annotation Property
Move to Front
Move to Back
Move Forward
Move Back
Undo Edit
Copy Annotation
Clear Annotations
Add Scale Bar
11-1
11-3
11-3
11-3
11-4
11-4
11-4
11-4
11-5
11-6
1106
11-7
11-7
11-8
11-8
11-8
11-8
Section 12
CustomToolbar
DisplayingCustomToolbar
HidingCustomToolbar
Customize ToolbarWindow
Add new buttons
Removea button
Move a button
Preferences
Units
Database
ReportFormat
ReportSelection
RoutineShortcuts
Annotations
Changingthe Routinesassociatedwith the Shortcuticons
."A_"nl1l1..A"
12-1
12-1
12-1
12-1
12-2
12-2
12-2
12-3
12-3
12-4
12-5
12-8
12-7
12-8
12-9
aH'7~
Table of Contents
Description
Standard Toolbar
Displaying Routine Window
Displaying Results Window
Displaying/Hiding Annotations
Displaying/Hiding Guard Frame
Displaying/Hiding Process Frame
Using Process Frame and Guard Frame with a live image
Shortcut Toolbar
Using Shortcut Toolbar
Using and Modifying the eight supplied shortcut application solutions
Guidelines for the modification of the eight supplied shortcut application solutions
Page
12-10
12-10
12-10
12-10
12-10
12-11
12-11
12-11
12-12
12-12
12-13
Section 13
The Image Database and Automatic Report generator
Overview
Getting Started
Saving Images to Image Database
Generating Reports using the Database
Generating a Single Image Report
Generating a Multiple Image Report
Standard Supplied Templates
Creating New Report Templates
Image Database in more detail
Projects Tab
Specimens Tab
Images Tab
Analysis Tab
Fields Tab
Image Gallery
Overview
Accessing the Gallery View
Image Gallery in Detail
Image Record Information
Opening a Record from the Image Gallery
Gallery Configuration
Archiving Databased Images
Archiving Databased Config under User Preferences
Database Configuration Utility
Database Filters
Filter Functionality
13-1
13-1
13-1
13-3
13-4
13-4
13-6
13-7
13-8
13-9
13-9
13-11
13-13
13-15
13-16
13-17
13-17
13-17
13-18
13-19
13-19
13-19
13-21
13-21
13-22
13-23
13-24
Section 14
Creating Reports with Image Analysis Results
Modifying the Template
14-1
14-3
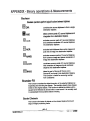
Appendix
Binary Operations
Feature Measurements
Field Measurements
Area Fraction Plane Measurement
MA861000-4.0
A1-1
A1-6
A1-10
A1-13
8/17/99
Table of Contents
Description
Area FractionSampleMeasurement
CriteriaMeasurements
Accessories
Page
A1-13
A1-13
A1-14
MA861D00-4.0
8/17/99
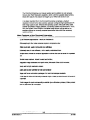
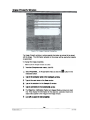
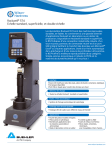
QUANTITATIVE IMAGE ANALYZER FOR
MATERIALS SCIENCE APPLICATIONS
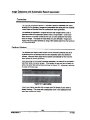
Overview of System Functionality
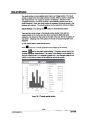
The Buehler@Omnimet@ Enterprise is the latest evolution of the Omnimet Image
Analysis family.
With Buehler's vast experience in the preparation and microstructural analysis of
materials in general, we have over many years, been able to launch Omnimet
products that surpass our users expectations, the Omnimet Enterprise is no
exception to this.
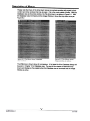
The Omnimet Enterprise, like all true image analysis systems allows for the
'Quantitative Analysis' of the sample image, rather than the technician having to
make a subjective 'Qualitative' assessment. In order to be able to accomplish
this, the image from the sample must exhibit sufficient contrast between the
features to be measured and the background. It should also be realized that, like
any other image analyzer, the Enterprise can only provide spatial measurements
of the image, it cannot of itself provide identification of the phases or compounds
present.
Quantitativeimage analysis then, is the quantification of the features within the
sample image, and these features are identified by the contrast difference they
have to their surroundings. Mostly, this contrast difference can be seen as a
difference in gray level in a monochrome image, it may also be seen as a
difference in the hue and intensity of a color in the color image. The Omnimet
Enterprise in its standard form, works with the grayscale of an image by digitizing
it into 256 levels (8 bit) between the video levels 0 (black) and 255 (white).
Monochrome is usually sufficient for most metallurgical applications. For
applications where color is used to identify one feature as being different to
another, such as in Petrography, then Omnimet Enterprise Version 2.0 and higher
gives this capability.
1-1
MA861000-4.0
8/17/99
The Omnimet Enterprise is a modular system and in addition to color analysis
there is also 'High Resolution capability', which, with the supplied digital camera,
allows the capture and analysis of images up to 1600x1200 pixels in size.
In its basic standard form, the Omnimet Enterprise comprises a medium
resolution monochrome video camera, specially configured high specification PC
with image capture card, Windows 98 operating system, Microsoft Office 2000,
Buehler proprietary imaging software, connecting cables and instructions. In this
form, the system, when linked to a suitable image source, will be able to run
analysis routines on correctly prepared specimens that exhibit the necessary
opticalcontrasl
Main Features of the Omnimet Enterprise:
32 bit Windows applications - works in Windows 98
Will accept up to four video camerasinputsin compositevideo
Video inputs are easily configured and calibrated
.
Extremelyeasyto usesoftware.rich in easily understood Icons
Simple menuchoicesto constructapplicationroutinesthat can be savedfor repeated
use
Simple image capture. importI exportand printing
Integratedimagedatabaseand reportwriter (MicrosoftOffice 2000 included)
Easily add a high resolutioncamera
Easily
add a color camerafor true color analysis
Stageand focus automation packages for most microscopes available
Printsdata to most commerciallyavailableinkjet or laser printersthat are Windows98
supported
Prints imagesto most commerciallyavailabledye sublimationprinters(Videoprinters)
that are 'Nindows98 compatible.
~MA861000-4.0
~=:=:r-~-1=2
--
'
&117199
Warranty
This unit is guaranteed
against defective material and workmanship
for a
period of two (2) years from the date of receipt by customer. Warranty is
void if inspection
shows evidence of abuse, misuse or unauthorized
repair. Warranty covers only replacement
of defective materials.
If, for
any reason, this unit must be returned to BUEHLER for warranty service,
please apply for prior authorization
with shipping instructions,
and include
the following information:
Customer
Purchase Order Number, Buehler
Ltd. Invoice Number and Date, Serial Number, and reason for return.
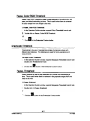
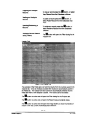
Unpacking
Carefullyunpackand check contents.If any componentsare missingor
damaged.save the packinglist and materialand advisethe carrier and
Buehler@Ltd. of the discrepancy.
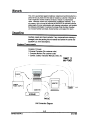
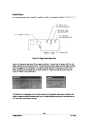
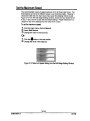
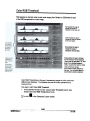
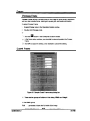
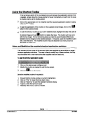
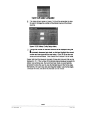
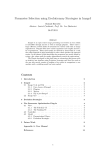
System Components
Consists of 3 boxes:
1-Personal Computer (Per customer order)
1- Computer Monitor (Per customer order)
1- Camera, Cables, Instruction Manuals, Disks, etc.
C~CT
TO
MAIN POWER
~
CAMERA
\ ,~ =fl~::=~J
C5oo-6l
rI
CAt.E:RA
POWER SlFPL Y
OJ
C(».,f)UTER
I
KEYBOARD
I
MOUSE
Unit Connection Diagram
1-3
MA861000-4.0
8117/99
~
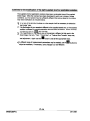
Com puter Assem bly
,=,.~
AC~PlOO
~
~
~
~
~~1
PARAl.1a ~
1
+0-, ""-'
,-
r\~§~~:~~R
I
BLANK
~
BLANK
:
~
vao~-~~
~.
~
~
vuo~
---~CA8LE.-IT
1'~TO4~
~
p~-
y~ -.uT
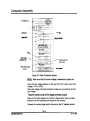
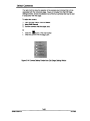
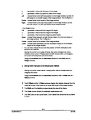
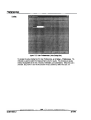
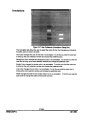
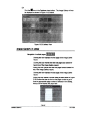
Figure 2-1 Rear Connection picture
NOTE:
Make sure that the correct voltage is selected for proper use.
Checkthat the voltageselectoron the rear of the PC is set to your local
voltage(110Vor 220V).
Check
the voltagecommandconsoleto makesure you havethe one for
your voltage.
Placethe monitor on top of the voltage command console.
Placethe PC either adjacent to monitor or below table, there are cable
extensions for the keyboard and mouse for this purpose.
Connectthe monitor signal cord to the port on the PC marked monitor.
2-1
MA861D00-4.0
8/17/99
Connect keyboard to the PS/2 port marked keyboard
Connectmouseto the PS/2 port on the rear of the PC markedmouse.
Attachthe camera to the C-mount adapter on the microscope. Connect
the 12 foot BNC video connection cable between the camera and the
video port 1 on the PC (the red connector). Connect the power cable
from the camera power supply to the other connector on the camera.
Plug the pcYNersupply into either accessory 1 or accessory 2 outlet at the
rear of the command console and make sure the switch on the power
supply is on.
Insert a power cord into the monitor and plug the other end into voltage
command console socket marked monitor.
Insert power cord into the PC and plug into voltage command console in
the socket marked computer.
Tum on the master switch of voltage command console The master
switch will light up.
Switchon the sub-switch of the voltage command console marked
monitor. you will see each of these sub-switches light up.
Press the power on button on the front of the monitor.
Turn on PC. You will see PC boot up through BIOS to Windows 98
Selectsystemshut down in Windows98.
\'\'hen the power light on the PC shuts off, turn off the masterswitchof
Voltagecommandconsole. This will turn off powerto the monitorand
otherconnecteddevicessuch as the camera.
For systemswith the motorizedstage option:
Placethe joystick box (if purchased)on eitherside of the monitor(to suit
user). Connectthe suppliedserial cablesto commport 1 on the rear of
the OmnimetEnterprisePC, and the other end to the serial port of the
joystickto one of the spare auxiliaryoutputson the voltagecommand
console. With the commandconsoleon, switchingthe rear powerswitch
on the back of the joystick box shouldilluminatethe red LED called
Field/Step. on the front panelof the joystick.
.
Pleasenote that your Omnimetsystemis preconfiguredwith Windows98,
Office2000, and BuehlerOmnimetSoftware. It is not necessaryto load
any of this softwareagain.
Please note that if your system has a Millennium II VGA card installed.
the system has two connectors. one blue 15 pin connector for the monitor
and one black connector that is not used. If your system has a G200
VGA card installed, it only has one blue 15 pin connector for the monitor.
2-2
-MA861~:O
8117/99'
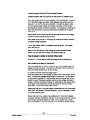
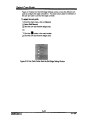
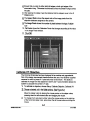
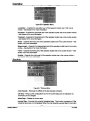
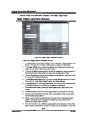
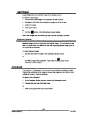
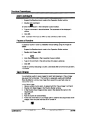
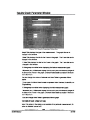
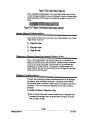
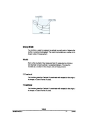
STAGE CONTROL SYSTEM
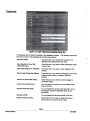
Figure 2-2 StageControl Front Panel
On the front of this panel you will find all of
the control buttons. For instance, the
stage controller has a RUN, SET ORIGIN,
GO TO ORIGIN, AUTO FOCUS, X, Y, Z,
and STEP/FIELD buttons. The stage
control box also comes equipped with a
joystick to control the movement of the
stage.
RUN is used to run a routine. Set origin
will set the X,Y origin from the stage
controller. GO TO ORIGINwill set the
microscopeback to the X,Y origin that was
selected. AUTO FOCUSwill makethe
Enterprisesoftwareautomaticallyfocus
the imagewith the stage controller. The
X, Y, Z radio buttonswill movethe stage in
each directioneither by step or by field.
The joystick enablesthe user to move
aroundthe sampleplacedon the
microscope.
2-3
MA861000.4. 0
8/17/99
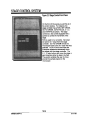
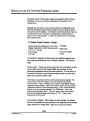
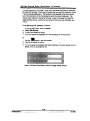
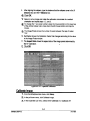
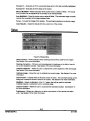
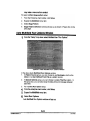
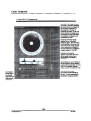
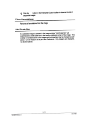
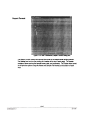
Installation
Figure
2-3 StageControl Rear Panel
Figure 2-3 shows the rear panelof the stagecontrol box. Connectthe AC powercord from the
stagecontrollerbox to the poweroutlet. Connectthe three motorcables from the stagecontroller
box to the stage on the microscope.Connectthe serial port to the computeron comm 1 port.
'M1eneverythingis connectedturn the powerswitch on. Makesure that the powerswitch is
turnedon before runningEnterprise.
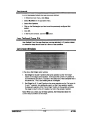
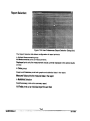
If the above error messages come up while trying to run Enterprise. close down Enterprise and
check to make sure that the power switch is on or check that the comm port is the same one set
up in the stage configuration program.
-
-
MA861000-4.0
2-4
at17/99
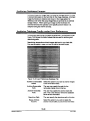
The earlier portionof this section details the assembly of the Omnirnet
Enterprise. it does not cover the configuration of the system, this is
covered here.
Basicallythe user need not worry about setting the configuration as all
Omnimet Enterprise Image Analysis Systems leave the Buehler factory
with optimal system settings. It is therefore recommended that these are
not adjusted since this may lead to a degradation in performance or
worse, a non working system. In case of accidental loss of the settings
they are given here:
PC Desktop Display Properties - Settings:
Display Resolution Millennium II VGA card:
Display Resolution for G200 VGA card with
a 19" or 21" monitor:
Color Palette:
Font Size:
1152x864
160Ox1200
True Color (32bit)
Large
The additionor executionof otherdevicesand softwareprogramsmay
also impair the performanceof the OmnimetEnterprise. The following
apply:
Screen savers - These must not be used under any circumstance as they
have a higher priority for the Pentium MMX resource than do other
demanding applications like the Omnimet Enterprise. This can lead to a
diminution of resource for the Enterprise software when a screen saver
starts up and cause a system crash.
The energy saving feature for the monitor should also be disabled. This
can be found under the "Display. icon in the Windows 98 Desktop
"Control Panel., Click on "Display. icon to get the multi-tabbed "Display
Properties. dialog window. Click on the "Screen Saver" tab, then click on
"Settings to show the" Power Schemes Dialog. At the" Power Schemes
Dialog", go to the drop down labeled "Turn Off Monitor", click on the
down arrow and select" Never". Click the" Apply" button, then confirm
and close all Dialog Windows with clicking on "OK". Finally, close
Windows 98 Control Panel,
Virus detectionsoftware- 'Nhile these are recommended,it is advised
that they are disabledduring longanalysisruns, especiallywith motorized
stage operationon multiplefields - again due to resourceconflicts.
2-5
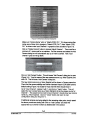
Software
Installation
for
-
New
System
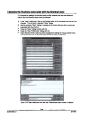
All Enterprise systems are now shipped with the Win98 and MS Office and Enterprise 4.0
software preinstalled on your system by Buehler. The following procedure is provided here in
case of hard drive failure.
Install Windows 98
2.
Install MS Office
3.
Install Enterprise V4.00. Insertthe V4.00 CD ROM into CD ROM drive - DO NOT RESTART
PC AT END OF INSTALLATION!!
4.
Install VGA driver for Windows 98. If the system has a Millennium II VGA card go to \Mga
directoryof the CD-ROM and run Setup, select English, select Typical, click on Next, at end
click Finish, then close matrox diagnostic. If the system has a G200 \fGA card go to
\G200\w9x_513directoryof the CD-ROMand run Setup, select English, selectTypical,
click on Next, at end click Finish, then close matrox diagnostic Do not register.
5. Right mouse click
6.
SelectProperties
7.
Clickon Settings tab
8.
VerifyColor is True Color 32 bit
9. Verify Screen Resolution is 1152 X 864 for a Millennium II VGA card or 1600 X 1200 for a
G200VGA card.
10. Click on Advanced
11. In General tab verify that it has Large Font
12. Click on Monitor tab and verify that the correct Monitor is set.
13. Click OK
14. Click OK
15. Go to Start, Settings, Control Panel
16. Double click on System icon
17. Click on Device Manager tab
18. Click on Matrox Imaging Adapter
2-6
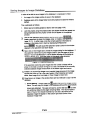
19. SelectMeteor PCI Frame Grabber or if it does not appear,selectother devices,PCI
Multimedia Video Device.
20. Click on Remove
21. Click OK
22. Click Close to exit and exit out of Control Panel
23. Go to Start
24. Click Find
25. Select File or Folders
26. Click on Browse
27. Select C:\Windows
28. Input meteor.vxdinto the Name input box
29. Click FindNow
30. Click on the file found and make sure it is highlighted.
If not found, skip the next two steps.
31. Press DEL on the keyboard to delete the file
32. Click Yes
33. Input dmapage.dll in the Name input box
34. Click FindNow
35. Click on the file found and make sure it is highlighted. If not found, skip the next two steps.
36. Press DEL on the keyboard to delete the file
37. Click Yes
38. Exit out of Find
39. Restart PC
40. Windows will display a message stating that new hardware was found.
41. A dialog box will be displayed called Install From Disk
42. Select Browse, Program Files\Buehler\Enterprise\ocx\Driver95\Meteor.inf
or Meteor2.inf
(depending on hardware)
43. Click OK
~'?~
MA861000-4.0
8117/99
44. Insert Disk messageis displayed.If Insert Disk messagebox is not displayed,skip the next
three steps
45. Click OK
46. Copying Files dialogbox is displayed
47. SelectBrowse, Program Files\Buehler\Enterprise\ocx\Driver95\dmapage.dll
48. Click OK
49. System asks if you would like to restart the computer, Click Yes
50. OpenWindowsExplorer
51. Doubleclick on ProgramFiles
52. Double click on Buehler
53. Double click on Enterprise
54. Double click on ReportTemplate
55. Right mouseclick on EnterpriseTemplate2
56. Click Rename
57. Remove 2
58. Press Enter
59. Close Explorer
60. Run Enterpriseand make sure that the live image is ok with no errors.
;;;.,.
MA861000-4.0
---::;
".,.--
,-,-"-,,~~,
-
_c- .2.;;a~:"'-~
"~---""-'-'
-
.~-
8/17199
UpgradeProcedurefrom releases prior to 4.0
-
---
--
- -
-
If you purchased your Enterprise system before 4.0 release, you can purchase an upgrade
package including the Enterprise 4.0 software CD and the User's Manual, please follow the
upgrade procedure below. Note: it is not necessary to run the uninstall for Enterprise when
upgrading to newer versions. Doing so will delete previous configurations and settings, such as,
objective database. If it is necessary to uninstall the Enterprise Software be sure to remove the
Meteor driver from the system. It is highly recommended that all third party peripheral devices be
removed from the system before starting the following upgrade procedure. The Windows 95/98
device drivers for these third party devices should also be removed from .Control Panel",
.System", then "Device Manager". The network cards, Iomega Zip drive and "SCSI" driver for
printer port based Zip drive may cause problems in the upgrade process.
InstallEnterprise V4.00. Insertthe V4.00 CD ROM into CD ROM drive- DO NOT RESTART
PC AT END OF INSTALLATION!!
2.
.
Install VGA driver for Windows 95/98. If the system has a Millennium II VGA card go to
\Mga directory of the CD-ROM and run Setup, select English, select Typical, click on Next,
at end click Finish, then close matrox diagnostic. If the system has a G200 VGA card go to
\G200\w9x_513directoryof the CD-ROMand run Setup, select English, click on Next,
select Matrox
Millennium
G200 AGP, click on Next, click on Next, click on Next, at end click
Finish. The system will be rebooted.
3.
Right mouse click
4.
SelectProperties
5.
Click on Settings tab
6.
Verify Color is True Color 32 bit
7.
Verify Screen Resolution is 1152 X 864 for a Millennium II VGA card or 1600 X 1200 for a
G200VGA card.
8. Click on Advanced
9.
In General tab verify that it has Large Font
10. Click on Monitor tab and verify that the correctMonitor is set.
11. Click OK
12. Click OK
13. Go to Start, Settings,ControlPanel
2-9
14. Double click on System
15. Click on Device Manager tab
16. Click on Matrox Imaging Adapter
17. Select Meteor PCI Frame Grabber
18. Click on Remove
19. Click OK
20. Click Close to exit and exit out of Controlpanel
21. Go to Start
22. Click Find
23. Select File or Folders
24. Click on Browse
25. Select C:\Wndows
26. Input meteor.vxd into the Name input box
27. Click FlndNow
28. Click on the file found and make sure it is highlighted
29. Press DEL on the keyboard to delete the file
30. Click Yes
31. Input dmapage.dll in the Name input box
32. Click FlndNow
33. Click on the file foundand makesure it is highlighted
34. Press DEL on the keyboard to delete the file
35. Click Yes
36. Exit out of Find
37. Restart PC
38. Windowswill displaya messagestatingthat new hardwarewas found
39. A dialog box wiH be displayed called Install From Disk
40. Select Browse, Program Files\Buehler\Enterprise\ocx\Driver95\Meteor.infor Meteor2.inf
2-10
-MA861 000:4. 0
8/17/99
(depending on hardware)
41. Click OK
42. Insert Disk message is displayed.
If not displayed, skip the next three steps.
43. Click OK
44. Copying Files dialog box is displayed
45. Select Browse, Program Files\BuehlenEnterprise\ocx\Driver95\dmapage.dll
46. Click OK
47. System asks if you would like to restart the computer, Click Yes
48. Run Enterprise and make sure that the live image is ok with no errors.
2~11
)
Steps on Installing Pixera Camera and Software
After Install Omnimet V4.0 Software, shutdown system.
2.
Turn off the power to the PC
3 Connectthe Pixeracamerato the Pixeracard
4
Rebootthe PC. 'l'JhenMessageaboutnew PCI multimediadevice is displayedpressCancel.
5. Install PixeraVCS 2.0 by running setup.exe from root directory of Pixera CD-ROM.
6.
Click Next.
Click Ves
8.
Click Next.
9.
Click Next.
10. Click Next.
11. Click Ves when message about Videofor Windows is displayed
12. Click No when message aboutRelease notes is displayed
13. Select No, I will restart my computer later when messageabout restartingof PC is
displayedand click Finish
14. Go to Start, Settings, Control Panel
15. Doubleclick on System
16. Click on Device Manager
17. Click on Other Devices
18. Ren'K>vePCI Multimedia Device if it exists
19. Reboot the system with Pixera CD-ROM
20. W1en the display messagesays it detectednew PCI MultimediaDevice.click on Next
21. SelectDisplay a list of all drivers in specific location...
22. Click Next
23. Select Other devices
24. Next
2-12
MA~
0()0..4.
0
8/17/99
25. Have Disk
26. Browse to CD-ROM drive
27. Click on the PCI folder
28. Click on OK
29. Another message will be displayed to make sure the right drive and file are selected.
30. Click on OK
31. Next
32. Next
33. Finish
34. Reboot the system
35. Checkthe Display Resolution of PC. It should be 1152x864 for a system with the Millennium
II VGA card, True Color 32 bit, Large Font.. It should be 1600 x 1200 for a system with a
G200 VGA card and a 19" or 21" monitor, True Color 32 bit, Large Font
There are two ways to use the Pixera camera:
A
Using it with a Twain interface viewfinder:
Run Omnimet Config program
2.
Select Setup
3.
SelectInterface
4.
Select Twain Color
5.
Click on OK
6.
SelectSetup pull down menu
7.
Click on CameraTable
8. Click on Add Camera
9. Type in the cameraname
10. Click on OK
11. Set the X size to 1260 and the Y size to 960
2-13
12. ChangeInput Channel to 1
13. Click on Apply
14. Click on Close
15. Add a few objectives
16. Exit Config program
17. Run OmnimetProgramand make sure the live imageis fine without error message.
18. Capture an image and make sure that the image is 1260 x 960 and color.
19. Exit Omnimet Enterprise System
20. Shutdown system
Bo
Usinga RS-170b\w video cameraas the viewfindercamerain conjuctionwith the Pixera
camera:
1
Run Omnimet Config program
2
Select Setup
3
SelectInterface
4.
SelectPlxera and Meteor RS-170
5. Click on OK
6.
SelectSetup pull down menu
7.
Click on Camera Table
8.
Click on Add Camera
9.
Type in the camera name
10. Click on OK
11. Set the X size to 1260and the Y size to 960
12. Change Input Channel
to 1
13. Click on Apply
14. Click on Close
15. Add a few objectives
2-14
MA861D00-4.0
8/17/99
16. Exit Config program
17. Run Omnimet Program and make sure the live image is fine without error message.
18. Capturean imageand makesure that the image is 1260 x 960 and color.
19. Exit Omnimet Image Archive System
20. Shutdownsystem
21. Go into Windows Explorer
22. Double click on the Windows folder
23. Scroll down to Imageocx.ini and double click on it
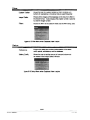
24. Make the following settings according to the light source used. The table below lists the
different possible light source and their settings.
Example settings for a Halogen light source:
[Pixera]
we Red = 100
we Green = 170
WB Blue = 190
Orientation = 0
The following are the settings for Orientation options to be used in order to make the image
from Pixera camera match with the image from the View Finder camera:
Orientation
=0 - this is the default setting.
Orientation = 1 - this will flip the image
Orientation = 2 - this will mirror the image
Orientation= 4 - this will cause the image to rotate 1800
The following are the possible light sources:
we Green we Blue
Light Source
we Red
Daylight
Fluorescent
100
100
100
88
91
115
Tungsten
100
150
150
2-15
MA861000-4.0
8/17/99
Steps on Installing Polaroid DMC Ie Digital Camera and Software
1
Go to Start
2.
Click Find
3. SelectFileor Folders
4. Click on Browse
5. Select C:\Windows
6. Click OK
7. Type asc.mpd into the Name input box
8. Click Find Now
9. Click on the file found and makesure it is highlighted
10. Press F2 on the keyboardto renameit.
11. Renamethe file to asc.mpd1 and press Enter
.
12. Insert Advansys SCSI CO into CD-ROMdrive
13. Click "Superlnstall Drivers"
14. Click "Finish"
15.Shut down the computerthen installAdvansys SCSI Card in the second PCI slot
from top.
16. Rebootthe PC. When Message"Insert Windows 98 Second EditionCD- is
displayed,insert AdvansysSCSI CD into CD-ROMdrive and click OK.
17.When asked for asc.mpdfile click "Browse". Select the CD-ROMdrive. Click OK.
18. Shut down the computer.
19. Connectthe OMC_lecamerato the Advansys card outside connector.
20. Turn on the camera ( it will producesome noise ).
21. Insert OmnimetCD into CD-ROMdrive
22. Turn on the PC.
23. When message about "New device found" is displayed, click "Browse'
CD-ROM drive.
24. Select DMC_le \ V1.21 on Omnimet CD.
25. Click OK.
26. Click Next.
27. Open Windows Explorer.
28. Explore Omnimet CD. Explore DMC_le. Explore V1.21
29. Double Click on setup.exe to run setup.
30. Click Next
2-17
Select the
31. Click Yes
32. Click Next
33. UncheckView Readmefile. Click Finish
34. Click Start
35. Click Programs
36. Select PolaroidDMC_le
37. Click DMC_leto run it
38. Check if the cameraworks properly in previewwindow.
39. Exit the program.
40. Run the Config program(for the Omnimet).
41. Select Setup
42. Select Interface
.
43. Select Twain, Color
44. Click on OK
45. Setup pull down menu
46. CameraTable
47. Click on Add Camera
48. Type in the camera name
49. Click on OK
50. Change Input Channelto 1
51. Click on Apply
52. Click on Close
53. Add a few objectives.Click add. In objective name enter 10X click OK. Repeat use
100Xfor objectivename OK.
54. Exit Config program
55. Run OmnimetProgramand make sure the live image is fine withouterror message.
56. Capturean image and make sure that the image is 1600 x 1200and color.
57. Exit Omnimet
58. Shutdown system
MA861000-4.0
&117/99
Mitsubishi CP700DUVideo Printer Installation
1
Place Dongle in LPT1
2.
Connect the Mitsubishi printer in LPT2
3.
Install the Rainbow driver by placing the Enterprise V4.00 CD in the CD-ROM drive
4. Go to Windows Explorer
5.
Open the D drive
6
Double click on the Rainbow folder
7,
Doubleclick on Setup.exe
8.
Click Next
9.
Click Ves to agree to the License Agreement
10. Put a check in the box for "Sentinel System Driver-English"
11. Click Next
12. Click Next
13. Click Finish to end setup
14. Restart the PC
15. Go to Windows Explorer, C:\Rainbow\English\Driver\Wln_95\Sentw95.exeto configure
Rainbowto only use LPT1
16. Click on Functions pulldown menu
17. SelectConfigure Sentinel Driver
18. Doubleclick on Physical Address 378
19. In .Use this port" check Ves
20. Click OK
21. Click OK to accept changes
22. Double click on Physical Address 278
23. In .Use this po~ check No
24. Click OK
25. Click OK to accept changes
2-19
MA 861 00()..4.0
8/17/99
26. Click OK to restart PC
27. Go to Functions pulldown menu and Quit Program
28. RestartPC
29. Insert the SuperPrtnt CD in the CD-ROM drive and the setup disk in drive A
30. Click Install SuperPrint
31. Click Next
32. Click Yes to agree to the LicenseAgreement
33. Type in the Users Name. Company Name. and Serial Number
34. Click Next
35. Click Yes to verify the information is correct
36. Select Typical and click Next
37. Click Next to begin the installation
38. Under Manufacturers select Mitsubishi
39. Under Printer select Mitsubishi CP700DU
40. Verify that the correct port is selected
41. Click on Have Disk
42. Click Browse
43. Click Open
44. Click OK
45. Click Done
46. Click Finish
47. Close all programsand restartPC
48. Start Enterprise
49. Print an Image
Note: Beforeyou print an imagemakesure that the papersettingsare set to L Size
2-20
MA861CXX).4.0
8I17mg
Hardware Configuration
Video Input Configuration Program
Introduction
If you have ordered the standard resolution package, your image analysis system
comes with a CCIR 756X570 pixel array black and white camera. If you have
ordered either of the high resolution packages your image analysis system will
come with a 1260X960 pixel array Pixera camera or a 1600X1200 Polaroid DMC
Ie camera. Altematively you may have ordered a color camera which are dealt
with later in this section. This section of the Chapter 3 deals with CCIR 756X570
B&Wcamera installation.
Your image analysis system will come with the appropriate camera, factory
installed in this configuration program.
.
The followingtable shows the color connectorto hook the cameracable to for
each inputchannelin the case of the CCIR camera.
Getting Started: 1 Camera and 1 Microscope
The following procedure assumes you are using the image analysis system for
the first time. You will need to undertake the following steps to configure the
system hardware to customize your system for your microscope.
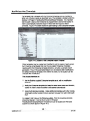
Open HardwareConfiguration Program
To open the hardwareconfigurationprogram,doubleclick on the
a
..~.
icon on
the desktop. If this icon is not present, the config program can be found in the
Omnimet Enterprise group in the Start menu. After opening, you will see the
hardware configuration main dialog box (Figure 3-1).
3-1
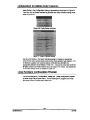
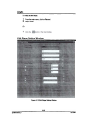
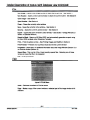
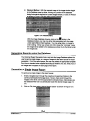
Set Camera Name
Under "Camera Name. you should see "Hitachi CCIR, Ch1." Make sure the
camera is connected
to the red camera cable (channel 1). Select "Setup. pull
down menu choice "Camera Table. (Figure 3-2) This will result in .Camera
Setup" Dialog box appearing (Figure 3-3).
Figure 3-2 Setup pull d<7Nnmenu
~-.-" -",~""~,,,-.,
MA861000.4.0
-. .-34:-
---
,
,~--&/17/99
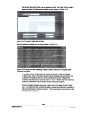
Make sure "Camera Name" entry is "Hitachi CCIR, Ch1." If it shows some other
name use pull down list to change to "Hitachi CCIR, Ch1.. Note" Hitachi CCIR.
Ch1" is shown under Input Channel 1 in grayed out box at bottom (Figure 3-3).
Click on "Delete Camera" button to remove Hitachi Camera 1. There must be a
minimum of 1 camera set for an interface. If all the cameras are deleted the Add
Camera dialog box will automatically pop up to insert a camera. Note: Input
channel 1 gray box will go blank.
Click
on .Add Camera" button. This will cause. Add Camera" dialog box to open
(Figure 3-4). Type the name of the new camera source (e.g. Nikon Epiphot) and
click OK. This will close. Add Camera" dialog box.
The new camera source (e.g. Nikon Epiphot) will be shown in Camera name box.
Check that the camera settings are Buehler standard Hitachi CCIR B&W camera
default setting (Figure 3-3) except for Input channel which should show O.
Go to "Input Channel", replace 0 with 1, and click on "Apply" button. This will
select the new Camera Name (e.g. Nikon Ephiphot) to be the chosen source for
Channel 1. The grayed out box next to Input Channel 1 should show new camera
name (e.g. Nikon Epiphot). Click on "Close" button and return to main
configuration dialog box (Figure 3-1).
If additionalcamerasare beingaddedto the remainingvideo ports,simplyrepeat
theaboveprocedures
startingwithClickon ..AddCamera"andinsertthe
appropriateinput channelnumberas detailedlater in this section.
3-3
Set Microscope Objectives
The "Configuration"Dialog box will show the new cameraname(e.g. Nikon
Epiphot). Objectivename will show "New Name8highlightedin black (no
microscopeobjectiveswill be listed yet). Type in first microscopeobjectivename
such as 10X.
Clickingon the .Add-buttonwill causeCameraNameto begrayedout,and
"New Name-to be highlightedin black in "ObjectiveName-box. Type in next
objectivenameand then click OK button. This will storethe new objective.
Repeatuntilall objectiveson microscopehave beenadded. Click on horizontal
arrowsat top of dialog box (Figure 3 -1). You will see .ObjectiveName- toggle
throughall the objectivesyou havejust added. You can also movethroughthe
list of objectivesby using the choices under the Objectivesmenu. The objective
namesare sortedalphabetically. If it is necessaryto havethem in a specific
order, placea letter,startingwith A. in front of the objectivename. For instance,
insteadof 10X,20X namethem A-1OX,8-20x. The maximumlimit of characters
for the objectivename is 8 characterslong. If the objectivename is larger than 8
characterslong it will cause a problemwhen trying to archivean imageto the
database.
Confirm Other Factory Settings
.
'M1ileyou are still in Configuration-dialog box. check"Objectivelabel- box,
factorypresetsshouldbe 0 for all. Do not changethis. Check.Calibration-box,
factorypresetsshouldbe 1. Systemis not yet calibrated.
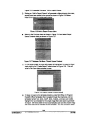
Go to .Set Up' pull down menu (Figure3-2) and click on .Select Interface
will bring up .Camera Interface- Dialog Box (Figure 3-5)
. This
Figure 3-5 Camera Interface Dialog Box
Your unit will be factory preset to Current camera type (Meteor CCIR) as shown
in Figure 3-5. Click on OK button to accept. If it is set on anything else, click the
drop down box where Meteor, CCIR is to select it, and then click on OK button.
Adding Color Analog Cameras
Buehler supplies several options of color CCD cameras that may be used with the
Omnimet Enterprise. Alternatively you may wish to attach an existing camera.
Currently, color cameras of either composite or S video format are supported.
Composite (NTSC. PAL) may be attached via the BNC connectors detailed in
-
MA861000.4. 0
3-4
8/17/99
Configuration for Adding Color Camera's
Select Setup in the Configurationdialog to generate the drop down in Figure 3-6.
From this. click on Select Interface to generate the Select Interface dialog shown
below in Figure 3-7
Figure 3-6 Config Setup pull down
Figure 3-7SelectInterfacedialog
Use the scroll buttonin the Select Interfacedialog to changean appropriate
format for the color camerabeing used and the frame grabbertype (Meteor). For
the Buehlersuppliedcolor cameraoptionsof 86-0800and 86-0900the
appropriateselectionwill be Meteor,NTSCY/C. It shouldbe notedthat while the
86-0900camerais an RGB modelit has to be used in Y/C mode. Add objectives
for the new cameranameas detailedin page 3-4.
Close
HardwareConfiguration Program
You will be returnedto .Configuration.dialog box. Closeconfigurationprogram
by either using File pull down menu- Exit or clickingon X programicon in top
right hand comer of configurationdialog box.
MA861000-4.0
I
3-6
8/17/99
Adding Digital Cameras
The OmnimetEnterprisecurrentlysupportsthe Pixeraand PolaroidDMC Ie
digitalcameras. The installationof the interfacecards and driversfor these units
is given in section2, this sectiongives detailson setting up the Configuration
utilityfor both camera's.
For either camera, follow the steps given previously to open the Select Interface
dialog.
For the Pixeracamera make the followingselectionin the dialog:
Pixerawith a b/w view finder camera: SelectPixeraand Meteor, RS-170
Pixerawith its own view finder:
SelectTwain Color
For the Polaroid DMC Ie digital camera make the following selection in the dialog:
Polaroid DMC Ie I monochrome mode:
Twain, 8/W
Polaroid DMC Ie I color mode:
Twain, Color
Add objectives to the new camera name for this interface as detailed on page 3-7.
Figure 3-8SelectCameraInterface with Twain Selection
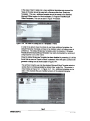
Confirm Configuration
The Enterprise program is opened by clicking on the.
icon. Calibration of the
individual microscope objectives occurs inside the Enterprise program.
Click on the capture image icon .8 to freeze the image. Select pull down menu
Setup-select camera and verify your new camera source is listed (e.g. Nikon
Epiphot). Use objective pull down menu at top right hand comer of Enterprise
screen and verify that the objectives stored match what were just entered.
Proceedto Section5 of the manual for the procedures to calibrate objectives.
~1
Advanced: 2 Cameras and 2 Microscopes
Follow the previous procedure for installing 1 camera and 1 microscope.
Then,
after calibrating the first microscope in the Enterprise. close Enterprise and reopen Hardware configuration program by clicking on icon. Add second camera to
new microscope source (#2) and plug into the green camera cable.
In Configuration dialog box go to "Setup" pull down menu and click on "Camera
Table." This will open up "Camera Setup" dialog box.
Go to Cameranamepull down list and select (highlightin black) "HitachiCCIR
Ch2. . It should list input channelas "2.. Click on "Delete. buttonto deletethis
cameraname. The gray Inputchannel2 box in the lower half of the Camera
Setupdialog box shouldnow be blank.
Click on . Add Camera" button. This will cause" Add Camera" dialog box to open
(Figure 3-4). Type the name of the new camera source (e.g. Versa met) and click
OK. This will close. Add Camera"dialogbox.
The new camera source (e.g. Versa met) will be shown in Camera name box.
Check that the camera settings are Buehler standard Hitachi CCIR B&W camera
default setting (Figure 3-3) except for Input channel which should read O.
Go to -Input Channel",replace0 with 2 and click on -Apply" button. This will
selectthe new CameraName(e.g.Versamet)as the chosen sourcefor Channel
2. The grayed out box next to InputChannel2 shouldshow new cameraname
(e.g. Versamet). Click on -Close" buttonand return to main configurationdialog
box (Figure 3-1).
Set Microscope
Objectives
The "Configuration"Dialogbox will showthe new cameraname (e.g. Versamet).
The Objectivenamewill show "New Name"highlightedin black (no microscope
objectiveswill be listedyet). Type in the first microscopeobjectivenamesuch as
1OX.
Clickingon the. Add"buttonwillcauseCameraNameto be grayedout,and
"New Name"to be highlightedin black in "ObjectiveName" box. Type in the next
objectivename and then click OK button. This will store the new objective.
Repeatuntil all objectiveson microscopehave been added. Click on horizontal
arrowsat top of dialog box. You will see .Objective Name"toggle throughall the
objectivesyou havejust added. You can also look at the current microscope
objectivesby usingthe Objectivespull down menu.
Confirm Other Factory Settings
You are still in .Configuration.dialogbox. Check.Objective label- box, factory
presetsshould be 0 for all. Do not change. Check.Calibration"box, factory
presetsshould be 1. Systemis not yet calibrated.
Go.to .Set Up' pull down menu (Figure 3-2) and click on .Select Interface." This
will bring up .Camera Interface" Dialog box (Figure 3-5)
3-8
MA861000.4.0
'c.~~"--~.~=
_:::_._~
-~
&'17/99
Your unit will be factory preset to Type (Meteor CCIR) as shown in Figure 3-5.
Click on OK button to accept If it is set on anything else, click the radio button
next to Type to select it, and then click on OK button.
You will be returned to "Configuration" dialog box. Close configuration program
by either using File pull down menu -Exit or clicking on X program icon in top right
hand comer of configuration dialog box.
Confirm Configuration
The Enterprise program is opened by C;iCking on the icon. Calibration of the
individual microscope objectives occurs inside the Enterprise program.
Click on the capture image icon
to freeze the image. Select pull down
menu Setup-select camera and change to your new camera source (e.g.
Versamet). Use objective pull down menu at top right hand comer of Enterprise
screen and verify the objectives stored match what you just entered.
.
Proceedto Section 5 of the manual for procedures to calibrate objectives.
Advanced: Multiple Cameras and Microscopes
Followtheearlierprocedure for adding second camera and microscope, but
delete HitachiCCIR,Ch3 and add third camerato InputChannel3. Physically
connect3rd camera to the blue camera cable.
Add 4th cameraby deletingHitachiCCIR, Ch4 and adding4th camerato Input
channel 4. Physically connect 4th camera to the black camera cable.
Advanced:
Only
1 Camera
but
2 Microscopes
-
You may want to configure your system for 1 camera but multiple microscopes.
Use the same procedure as adding second camera and camera source, but
rather than physically attaching a new camera to the green cable simply move
camera 1 from the red cable to the green cable when doing calibration.
3-9
Stage Control Configuration
Program (for use with motorized stages)
Introduction
The stageconfigurationprogramallowsthe additionof a new stage configuration.
or the deletionof an old one. The user is ableto set the x. y. z pitch. set inverse
settings.set maximumspeed. select cameras.selectcom ports. set focus axis.
set backlash.and set the focusing interval.
Open Stage Configuration
Program
To openthe stage configurationprogram,doubleclick on the
icon on the
desktop. If this icon is not present,the stage programcan be found in the
OmnimetEnterprisegroup in the Start menu.After opening,you will see the
stageconfigurationmain dialog box (Figure3-9 below).
MA861000..4.0
ri
.
3-10
-
8117/99
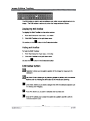
Add a Record
To add a new record to the database:
1. From the main menu, click on Record.
2. Select Add Record.
3. Type in new record in the Edit Stage Setting window.
Or
1.
2.
[)
Click the
buttonin the maintoolbar.
Type in new recordin the Edit Stage Setting window.
Adding a record will generate default values for the stage parameters, the
user is free to change these.
Delete a Record
To deletea recordin the database:
1. Click on the record that you wish to delete.
2. From the main menu, click on Record.
3. Select Delete Record.
Or
1
Click on the record that you wish to delete.
2.
Click the .button
in the main toolbar.
Edit a Record
To edit a record in the database:
1. Click on the record that you wish to edit.
2. From the main menu, click on Record.
3. Select Edit Record.
Or
1.
Click on the record that you wish to edit.
2.
Click the .utton
in the main toolbar.
Please note that it is not possible to edit the stage name since this is a "key.
heading in the stage database.
3-11
MA861000-4.0
8/17/99
Undo
To undo the last action:
1. From the main menu, click on Record.
2. Select Undo.
Or
1
Edit Stage Setting Window
Figure 3-10 Edit Stage Setting Window
3-'12'
MA861000.4.0".1'
8/17199
Set the X, Y, Z Pitch
The X Pitch is the distance per pulse that the step motor can travel in X-axis.
The unit is ~m/pulse.
The Y Pitch is the distance per pulse that the step motor can travel in Y-axis.
The unit is ~m/pulse.
The Z Pitch is the distance per pulse that the step motor can travel in Z-axis.
The unit is ~m/pulse. Figure 3-11 from the Edit Stage Setting Window, shows the
input boxes for the X Pitch, Y Pitch, and the Z Pitch.
To set the X, Y, Z pitch:
1. From the main menu, click on Record.
2. Select Edit Record.
3. Change the value in the input box.
Or
1
2.
Click the
button in the main toolbar.
Change the value in the input box.
Figure 3-11 Pitch SettingsPortionof the Edit Stage SettingWindow
The X. Y and Z Pitch settingsshouldbe calibratedfor the particularmicroscope
and stage used. The pulsesof X, Y and Z motorsare displayedon the statusbar
at the bottomof the Enterpriseapplication.User can move the stage by the
joystick on the stage controllerand measurethe distance movedwith a ruleror
micrometer.The X Pitchcan be calculatedby dividingthe distancein X by the
changesof X motor pulses.The Y and Z Pitchcan be calculatedin the same
manner.For rectangularXY stage,the Z motor is used for autofocus.A larger
autofocusmovementcan be obtainedby usinga smallervalue of Z Pitchsetting.
3-13
Set the Inverse Settings
The inversesettingsportion of the Edit Stage Setting Window allows the user to
configure the Enterprise so that the motorized stage and focus is driven correctly
for the microscope in question. Figure 3-12 shows the check boxes that may be
selected. Inverted optics will drive the X Y motor in the opposite directions to
default thus allowing for microscopes with optical inversions, invert Z will allow the
user to ensure that the focusing direction is correctlyset
To set the inverse settings:
From the main menu,click on Record
SelectEdit Record.
Changethe value in the input box.
1
2.
3.
Or
Click the buttonin the main toolbar
2. Change the value in the input box.
Figure3-12 Inverse Settings Portion of the Edit Stage Setting Window
3-14
MA861000-4.0
&117/99
Set the Maximum Speed
The recommended maximum speed setting is 24 for all three input boxes. The
three options can be set to different values to suit individual needs. However it
should be noted that very high values may cause the stepping motors to stall.
Figure 3-13 from the Edit Stage Settings window, shows the input boxes for the
X-axis. Y-axis, and the Z-axis with the default settings. Please note that if 0 is
chosen for any of the settings then the value of 24 is used.
To set the maximumspeed:
1.
2.
3.
From the main menu, click on Record.
Select Edit Record.
Change the value in the input box.
Or
1.
2.
Click the (8 button in the main toolbar.
Changethe value in the input box.
Figure 3-13 Maximum Speed Settingfrom the Edit Stage SettingWindow
3-15
Select Cameras
The radio buttonsallow the selectionof the camerainput channelthat is to be
associatedwith the motorizedstage. Figure3-14 belowfrom the Edit Stage
Settingswindow.showsthe selectionbox of the four camerasthat may be used
in conjunctionwith the stage.
To select the camera:
1.
2.
3.
From the main menu, click on Record
Select Edit Record.
Click the camera that the stage uses.
Or
1. Click the.
button in the maintoolbar.
2. Click the camerathat the stage uses.
Figure 3-14 Camera Setting Portion from Edit Stage Setting Window
3-16
MA861D00-4.0
8/17/99
Select Com Ports
Figure 3-15 belowfrom the Edit Stage Settingswindow,showsthe differentcom
ports to configure the stage controller to. The radio buttons allow the selection of
the com port usedto connectthe stage controller.
To select the com ports:
1. From the main menu, click on Record.
2. Select Edit Record.
3. Click the com port that the stage uses.
Or
1.
Click the.
2.
Click the com port that the stage uses.
buttonin the maintoolbar.
Figure 3-15 Com Ports Portionfrom the Edit StageSettingWindow
~1'7
MA861000-4.0
8/17/99
Set the Focus Axis, Backlash,
& Interval
The radio buttonsfor the X-axis, Y-axis,and Z-axisallow the choice of other than
the Z-axisfor focusing. The Z-axis is normallythe one used,the choicesof X and
Y are for specialapplications. The backlashis the backlashof the focus motor
and of the mechanicsof the microscopeto whichthe motoris attached. The
intervalis the maximumintervalfor focusing. Figure3-16 belowfrom the Edit
StageSettingswindow.shows the input boxesfor the focus axis, backlash,and
interval.
To set the focus axis, backlash,& interval
From the main menu,click on Record.
2. Select Edit Record.
3 Z-axis is the default for focus.
4 You can change the backlash and interval settings in the input boxes.
Or
2.
3
Click the.
button in the main toolbar.
Z-axis is the default for focus.
.
You can change the backlash and interval settings in the input boxes (0 is the
default, which is equivalent to 15).
Figure 3-16 FocusAxis Portionof the Edit StageSettingWindow
-
MA861000-4.0
3-18
'
- -~---'~'--"~
~-
8117199
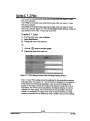
Basic Commands
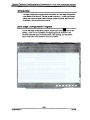
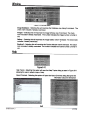
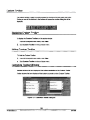
Starting the Enterprise
In order to start the Enterprise,double-clickon the icon on the desktopor
click on Enterprisein the Start Menu. The graphicuser interfaceseen belowin
Figure4-1 with the databaseview will appearafter Enterpriseis launched. \"'Jhen
an imageis openedit will generatean imagewindowover the databaseview.
Below are some of the basic functions necessary for getting started with the
Enterprise.
Figure4-1 EnterpriseMain Screenwith databaseview
Image Functions
Open an existing image
1,
From the main menu, click on File.
2.
Select Open Image in the pull down menu
3.
Navigate to the folder that contains the image to be opened
-
MA861~.O
4-1
\
c,
8117199
4.
Selectthe image.
5.
Click Open button
Steps 1 and 2 can be skippedby clicking on
~
in the Enterprise toolbar
Save an image
1
The Image window must be active (Highlighted title bar) and frozen
2. From the main menu, click File.
3.
Select Save (CtrI+S) or Save As
4
Use Save As to save the image to the specified folder with a specific name
for the image.
5
Use Save to save the image to the original image file. If a new image to be
saved. Save works exactly the same as Save As.
.
Or click
18 in the Enterprisetoolbar.
Printing an image
1
The Image window must be active (Highlighted title bar) and frozen
2.
From the Enterprisemain menu,click File.
3.
Select Print (Ctrl+P) in the pull down menu
Or click the
(8
buttonin the Enterprisetoolbar.
Start live video
To start live video camera:
1
Push in the
[8
-
buttonin the main toolbar of the Imagewindow.
To stop live video and to capture/freezeimage:
Release the
button in the main toolbar of the Image window.
4-2
MA861D00-4.0
8117/99
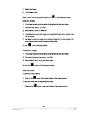
Routine Functions
Open an existing routine
1 From the main menu, click File.
2.
3.
SelectOpen Routine in the pull down menu.
Navigate
to the drive. directoryand folderthat containthe desired routineto
beopened.
4. Click on the routine to be opened
5. Click Open
Save a routine
1
.
The Routine Window must be the active window (Highlighted title bar)
2. From the main menu, click File.
3. SelectSave (Ctrt+S)or Save As.
4.
Use Save As to save the routine to the specified folder with a specific name
for the routine.
5. Use Save to save the routine to the original routine file. If a new routine has
been saved. Save works exactly the same as Save As.
Or
Click
1M in the Enterprisetoolbar.
Print a routine
The Routine Window must be the active window (Highlighted title bar)
2. From the Enterprise main menu, click File.
3. Select Print (Ctrl+P) in the pull down menu.
Or click the
18 buttonin the Enterprisetoolbar.
4-3
Execute routine step
This function is used to executethe routineone step at a time. However,this
function can only be used to execute the routine sequentially. Otherwise the
Execute step button in the Routine window toolbar or the Execute Step menu
item in the Enterprise main menu will be disabled.
To use Execute step:
1. Make sure the step that you plan to apply the Execute Step function to, is
highlighted.
2,
From the Enterprise main menu. click Routine
3.
Select Execute Step in the pull down menu.
Or
1.
Make sure the step that you plan to apply the Execute Step function to, is
highlighted.
2
Click the
(i8 buttonin the Routinewindowmain too;bar
Repeat the above proceduresfor the next highlightedstep in the Routinewindow
Execute all steps in routine
To execute all of the steps in a routine:
1. From the Enterprise main menu, click Routine.
2.
Select Execute All in the pull down menu.
Or click the
B
button in the Routine window main toolbar
Execute routine to step
This function allowsyou to executemultiplesteps in a routine.
To execute multiplesteps:
1. Click any step that you'd like to executeto in the Routinewindowto highlight
it.
2. Fromthe Enterprisemain menu,click Routine.
3. Select Execute to Step in the pull down menu.
4. All steps prior to the highlightedone will be executed.
Or
1. Click any step that you'd like to execute to in the Routine window to highlight
it.
2. Click the Ci1 buttonin the Routinewindowmain toolbar
4-4
$. All steps prior to the highlighted one will be executed.
Results Window
Print report
1
The Result window has to be active (Highlighted title bar).
2.
Fromthe Enterprisemain menu,click File.
3. In the pull down menu, click Print Preview to preview document.
4.
In the pull down menu, click Print.
Print Option setup
1. Fromthe Enterprisemain menu,click SetUp.
Select Preferences in the pull down menu.
3.
Choosethe desired options by clicking on them.
4.
Click OK.
Exiting the Program
1. Click File from the Enterprisemain menu.
2.
SelectExit in the pull down menu.
4-5
MA861 000-4.0
8/17/99
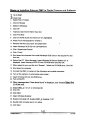
Calibration
The Omnimet Enterprise is a Quantitative Image Analyzer that allows the user to conduct
quantitative measures of the presented image. As such the Omnimet must be calibrated
to the users microscope, this is detailed later in this section.
In order to calibrate an objective, the objective must first be added to the objective
database. This is done in the Hardware Configuration Program (see Section 3). After
configuring the camera, verify that the correct camera is chosen. The name of the current
camera is shown in the status bar on the bottom of the screen.
Setup Camera
1
From Enterprisemainmenu,select Setup.
2
ChooseSelect Camera... in the pull down menu. The image must be frozen
to select the camera. Verify that the radial button selected matches the
camera of interest and click OK.
-
3.
4.
The objectives associated with the selectedcamera will be displayed in the
combo box of Enterprise's tool bar. The image must be live to change the
objective.
Place the supplied traceable stage micrometer on the stage of the
microscope and focus the rulings.
Before startingcalibration,verify that the correct objective is shown in the list box
on the Enterprise toolbar. If not, clicking on the arrow to the right of the box will
cause a list of all the objectives available for this microscope to be displayed.
Select the appropriate objective
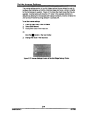
Calibrate X Objective
If calibrationis being under taken using a Buehler supplied camera,then the
correctXY pixel ratio will have already been setup in the hardware setup (Section
3) and the user may then calibrate the microscope objectives using 'Calibrate X
objective". However, if the XY pixel ratio for the camera being used is not known,
then it must be determined prior to calibrating the objectives.
l'
To calibratean objective,chooseSetup, Calibrate Objective, Calibrate X.
2. Choosethe desired unit in the Units window. (See Figure 5-1)
3.
Move the caliper ruler by placing the mouse pointer on the caliper ruler,
pressing down the left mouse button and dragging the mouse.
4
Align the left hand blade of the caliper to a micrometer ruling at left side of the
screen.
5.
Place the mouse pointer on the right leg of the caliper ruler, press down the
left mouse button and drag the mouse to change the number of pixels. Open
the caliper to as wide a distance as possible and align to a right most
micrometer ruling.
5-1
6.
Ensure that you align to either both left edges or both right edges of the
micrometer ruling. Otherwise the thickness of the micrometer rulings comes
into play.
7.
After aligning the caliper, type the distance that the calipers cover in the X
Distance box.
8. The Aspect Ratio shows the aspect ratio of the image pixels from the
objective database assigned to the camera.
9.
The Image Pixels shows the number of pixels between the legs of caliper
ruler.
10. Cal Factor shows the CalibrationFactorthat changesaccordingto the value
in the ImagePixels window.
11. Click OK.
Figure 5-1 ObjectiveX Calibration
Calibrate XV Objective
The OmnimetEnterprisehas been designedto be modular and upgradeable.
Part of this designrequirementthereforeallowsthe use of non-Buehlersupplied
camerasfor which a presetX-Y pixel ratio may not be known. The ability to
calibratethe imagefrom the objectivein both X and Y axis'sthereforeallows the
systemto calculatethe correct X-Y ratio.
1 To calibratean objective,choose Setup,CalibrateObjective,CalibrateXV.
2. Choosea desired unit in the Units window. (See Figure 5-2)
Move the caliper rulers by placing the mouse pointer on the caliper rulers,
pressing down the left mouse button and dragging the mouse.
4.
To change the X axis pixel number: place the mouse pointer on the right leg
of the horizontal caliper ruler, press down the left mouse button and drag the
mouse.
5-2
MA861000-4. 0
~9
5.
After aligning the calipers. type the distance that the calipers cover in the X
Distance box and the Y Distance box.
6.
Click OK.
7
Return to a live image and rotate the calibration micrometer to a vertical
orientation and repeat steps 1, 2, and 3.
8~
To change the Y axis pixel number: place the mouse pointer on the lower leg
of the vertical caliper ruler. press down the left mouse button and drag the
mouse.
9. The Image Pixels shows the number of pixels between the legs of caliper
ruler.
10. Cal Factor shows the Calibration Factor that changes according to the value
in the Image Pixels window.
11. The Aspect Ratio shows the aspect ratio of the image pixels determined by
theXY Calibration.
.
12. Click OK.
Figure 5-2 X-V ObjectiveCalibration
Calibrate Image
1.
From the Enterprise main menu, click Setup.
2.
In the pull down menu, click Calibrate Image.
3.
rn the expanded sub menu, select either Calibrate X or Calibrate XV.
5-3
MA861000-4.0
8117/99
Calibrate X Image
This function is usedto calibratea saved image that hasno calibration,
butwas
capturedwith a knownaspectratio.
1. To calibratean image,chooseSetup, CalibrateImage,CalibrateX.
2. Choosethe desiredunit in the Units window.(See Figure5-1)
3. Move the caliperrulerby placingthe mousepointeron the caliperruler,
pressingdown the left mousebuttonand draggingthe mouse.
4. Placethe mousepointeron the right leg of the caliperruler, pressdown the
left mousebuttonand drag the mouseto changethe numberof pixels.
5. After aligningthe caliper,type the distancethat the caliperscover in the X
Distancebox.
6. Type in the Aspect Ratio of the image pixels.
.
7. The Image Pixels showsthe numberof pixels betweenthe legs of caliper
ruler.
8. Cal Factor showsthe CalibrationFactorthat changesaccordingto the value
in the ImagePixelswindow.
9. Click OK.
Calibrate XV Image
This function is used to calibrate stored images where either the calibration or the
aspect ratio of the images pixels is unknown or corrupted.
1.
To calibrate an image, choose Setup, Calibrate Image, Calibrate XY.
2.
Choose a desired unit in the Units window. (See Figure 5-2)
3.
Move the caliper rulers by placing the mouse pointer on the caliper rulers,
pressing down the left mouse button and dragging the mouse.
4.
To change the X axis pixel number: place the mouse pointer on the right leg
of the horizontal caliper ruler. press down the left mouse button and drag the
mouse.
5.
To change the Y axis pixel number: place the mouse pointer on the lower leg
of the vertical caliper ruler, press down the left mouse button and drag the
mouse.
6.
After aligning the caliper, type the distance that the calipers cover in the X
Distance box and the Y Distance box.
7.
The Image Pixels shows the number of pixels between the legs of caliper
ruler.
8.
Cal Factor shows the Calibration Factor that changes according to the value
in the Image Pixels window.
9.
The Aspect Ratio shows the aspect ratio of the image pixels determined by
. the XY Calibration.
10 Click OK.
5-4
MA861000.4.0
8/17/99
Shading Correction
The shadingcorrectionis used to correct minor lighting differences in the
microscope when capturing images. Before setting the shading correction for an
objective. make sure that the correct microscope and objective are set and that
the illumination is optimally adjusted (i.e. that the microscope is set up for Kohler
illumination). Pseudocolor is a useful tool for detecting uneven illumination and is
a valuable aid in correctly adjusting the microscope illumination (see Section 7 for
more information on Pseudocolor). Shading correction is only used for
monochrome input.
Shading Correction Setup
Place
a mirroredsurfaceon the microscopestage and view its surface
through the Enterprise.
2
Click on the Saturationicon and adjust the level illumination until the blue
pixels are just extinguished.
3
FromEnterprisemain menu, click Setup
4
In the pull down menu. click Shading Correction
5
Select Set Shading Correction in the expandedmenu
The shadingcorrectionwill be stored in objectivedatabase. After this point,when
an imageis captured,the shadingcorrectionwill be appliedto the image. Please
notethat the use of shadingcorrectionwill causea generalbrighteningof the
image.
Note:Shadingcorrectionwill only be activefor blackand white images. This
optionwill be grayed out when there is a color cameraset in the interface.
Clear Shading Correction
To clear shading corrector in objective database:
1. Make sure that the correct objective and camera are selected
2
FromEnterprisemain menu.click Setup
3. In the pull down menu, click Shading Correction.
4 Select Clear Shading Correction in the expanded menu
5-5
Description of Menus
Pleasenote that many of the drop down menus are context sensitive with regard to their
content and other windows that may be open. File is the most notable of these. With the
Database view as the active window, the File drop down is as below in Figure 6-1. VVith
the Database view minimized and the Image VVindowin focus the drop down is as per
Figure 6-2.
The difference is shown above for comparison. A full detail of all the Database dialogs will
be given in Chapter 13 for Database view. The rest of this chapter will deal with drop
downs and dialogs as they appear when the Database view is minimized and the Image
Window is active.
6-1
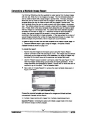
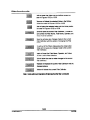
Detailed Description of menus (with Database view minimized)
File
-
New Image Opensa new imagewindowor clears the currentone. See Section7
New Routine - Opensa new routinewindowor clearsthe current routine. See Section8
Open Image- See Section4
Open Routine - See Section4
Close - Closesthe currentlyactivewindow
Save - Savesthe currentlyactivewindow- See Section4
SaveA. - Savesthecurrentlyactivewindow- See Section4
Export - Exportsthe active windowto other formats- See Section7 (ImageWindow)or
Section10 (ResultsWindow)
Export to Word - Opens up MS Word 2000 and automaticallygeneratesa report using
theWord2000templatecalledEnterprise
Template.
Print- Printstheactivewindow- SeePrintingImagesandRe~rts in Section4
-
Print Preview Previewshow a printoutwould look for the currentwindow
Properties - Allowsentry of additionalinformationaboutthe ImageWindow(Section7) or
the RoutineWindow(Section8)
Recent file. This is a list of the 4 most recentlyopenedfiles. Selectingone of these
nameswill causethat file to be reopened.
Exit - Quitsthe program
-
Edit
Figure 6-3 Edit Menu
Undo
- Removes the effects of the last action
Copy - Makes a copy of the current window or selected part of the image window to the
clipboard
6-2
MA861000-4.0
8/17199
Annotation
Figure6-4Annotation
Menu
- See Annotationsin Section11 (Image EditingToolbar)
Move to Back - See Annotationsin Section 11 (ImageEditingToolbar)
Move to Front
Move Forward - See Annotationsin Section 11 (Image EditingToolbar)
Properties - See Annotationsin Section11 (Image EditingToo~ar)
Clear Annotations - Removesall annotationsfrom the image
Add Scale Bar -If a calibratedimageis presentin the imagewindow.Add ScaleBar" will
Move Back See Annotationsin Section11 (Image EditingToolbar)
superimposea small scale bar in the bottomrighthandcomer of the image. This overlayis
nondestructiveto the imageand its propertiesmay be changedas per above. Unit of
measureis as per User Preference.Only integersare displayed,no decimalplaces.
View
Figure 6-5 View Menu
-
Custom Toolbar
Edit Toolbar
-
Displays or hides the customizable toolbar
Displays or hides the image editing toolbar
Operation Window
Result Window
-
- Displays or hides the operation builder part of the routine window
Displays or hides the result window
- Displays or hides all annotations on the image window
Frame- Displays or hides the current guard frame (See Section 9)
Annotations
Guard
Process Frame
Image Gallery
- Displays or hides the current process frame (See Section 9)
- Displays or hides the database image gallery of thumbnails.
6-3
MA86100D-4.0
8117/99
Operation
Figure 6-6 OperationMenu
Acquisition - Expandsthe acquisitionpart of the operationbuildertree in the routine
window- See Section9 for more information
Grayscale - Expandsthe grayscalepart of the operationbuildertree in the routinewindow
- See Section9 for more infom'lation
Threshold - Expandsthe thresholdpart of the operationbuildertree in the routinewindow
- See Section9 for more infom'lation
Binary - Expandsthe binarypart of the operationbuildertree in the routinewindow- See
.
Section9 for more infom'lation
Measurement- Expandsthe measurementpart of the operationbuildertree in the routine
window- See Section9 for more information
Frame - Expandsthe frame part of the operationbuildertree in the routinewindow- See
Section9 for more infom'lation
Routine - Expandsthe routinepart of the operationbuildertree in the routinewindowSee Section9 for moreinformation
Routine
Figure6-7 RoutineMenu
UndoExecute Removesthe effects of the last executecommand
-
-
Edit Step Bringsup the configurationbox for the current step (priorto execution)so
parameterscan be changed
Delete Step Deletesthe currentstep
-
-
Execute Step Executesthe currentlyhighlightedstep. This functionis grayedout if the
highlightedstep does not immediatelyfollow the most recentlyexecutedstep in the routine.
MA861D00-4.0
6-4
-
8117199
Execute To - Executesall of the unexecutedsteps prior to the step currentlyhighlighted.
Execute All - Executesall of the steps in the routine
-
Manual Multifield Allows executionof the routineover a numberof fields. The results
from the fields can be displayedas a summaryor as individualfields.
Auto Multifield - Runsthe routineover a seriesof fields. The automaticstage controller
controlsthe movementof the stage betweenfields.
Focus - Focusesthe imageof the sample. This commandrequiresan automaticstage.
Clear Results - Clears the resultsfrom the currentrun of the routine
Setup
Figure 6-8 SetupMenu
Select Camera - Allows selection of the camera port that will be used for live images.
See Section 5 for more information
Shading
Correction
- Will
even out inconsistencies
in brightness in the field of view for
the currentobjectiveselected. See Section5 for more information.
Calibrate Objective - Allows the user to calibratethe current objectiveof the microscope.
See Section5 for more information.
Calibrate Image - Allows the user to calibratethe current image. See Section5 for more
information.
Guard Frame- Is active when the Routinewindowis active. This commandbringsup the
dialogbox to setup the Guard Framefor the routine. See Section8 for more information.
Multifield - Allows configurationof the X, Y pattemthat will be used for automatic
multifieldanalysisin conjunctionwith a motorizedstage.
Custom Toolbar- Allows the user to customizethe operationstoolbar. See Section12
for more information.
Preferences- Brings up a dialog box to allowcustomizationof the reportsand select
units. See Section 12 for more information.
6-5
MA861000-4.0
8/17/99
Window
Figure 6-9WindowMenu
Image Database - Selecting this will maximize the Database view dialog if minimized. The
check mark indicates if already maximized.
Image2 - Selecting this will maximize the Image Window view if minimized. The check
mark indicates if already maximized. The number indicates the image number currently in
use.
Gallery - Selecting this will maximize the Image Gallery view if minimized. The check mark
indicates if already maximized.
.
Routlne2 - Selecting this will maximize the Routine Window view if minimized. The check
mark indicates if already maximized. The number indicates the routine number currently in
use.
Help
Figure6-10
-
Help Topics Selectingthis optionwill open the Help Topics dialog as seen in Figure 6-11
allowing the user to select a topic of help.
About Omnimet - Selecting this option will open the About Omnimet dialog that gives the
information about the Enterprise
6-6
system.
Figure 6-11 HelpTopicsdialog
Figure 6-12 About Omnimet dialog
6-7
Database View Menu Options
As noted at the begining of this chapter. the menu's change according to whether the
database view is active or not. The following is a description of the menu options available
when the database view is active.
File
New Image
- Opens an Image Window to accept live video
New Routine - Opens the Routine Operation Builder Window
Open Image
-
Open Routine
Opens an Open Image dialog
- Opens an Open Routine dialog
Add to Report Queue
-
Sends selected images to the Report Queue
-
Report Queue Contents
Opens a dialog to show images currently being
queued for report generation as seen in Figure 6-13
Figure 6-13 File Menu when Database View is active
5"a
Database
First Record
Previous
Record
Displays the first record.
Moves the view one page back toward the beginning of the
record.
Next Record
Moves the view one page forwardtowardthe end of the
record.
Last Record
Displays the last page of the record.
Edit Record
Opens the fields that can be editedby the user for
necessary changes.
Add Record
Allows
Delete record
Deletesa selected record.
CancelAdd I Edit
Closesany open fields.
Copy Record
Copiesfield values from a selectedrecord.
Paste Record
Insertsa copy of the contentsin the Clipboard.
Retrieve Record
Opensa selected recordfile.
Archive Project
Movesyour image files to an extemalStorageMediumin
order to recoverdisk space on the harddisk for the Image
Database.
Dearchive
Project
the userto adda newrecord.
Retransmitsarchivedimagesdata backto your hard disk.
Figure6-14 Database Menu when Database View is active
6-9
MA861D00-4.0
8/17/99
View
Custom Toolbar
Alk1Nsthe user to createa toolbarso that it contains icon
buttonsfor operationsor functionsthat are used frequently.
Image Gallery
Shows all the imagesof the databaseor the result of a filter in
Filters
Showsthe filters fo the selectedtable and the filter being used.
Figure6-15
thumbnailformat. It also displaysthe project number,specimen
id, and the image number.
VIeW Menu when
DatabaseView is active
Setu p
Preferences
Brings up a dialog box to allow customizationof the select
units. reports, annotations. and the database.
Gallery Config
Allows the user to set the amount of rows and columns to
be viewed in the Image Gallery Window.
Figure6-16 Setup Menu when Database View is active
6-10
MA861 000-4. 0
8/17/99
Image Window
Figure 7-1 Image Window
Start Live Video
To start live video camera
1
Push in the
18button in the main toolbar of the Image window.
To stop live video and to capture/freeze image:
1
Release the
18 button in the main toolbar of the Image window.
Note: Per design the image window doesn't allow a frozen image to be
resized larger than the actual image.
Add
Current
---
Image
to
Database
This function is only enabled if a project and specimen are open at the image tab
level.
1
Ensure that the databaseis open to Imagetab level
2. The8 buttonshouldbe active.
3. Pressthe.
buttonto savetheimageto the Database.
7-1
Grayscale
The grayscale function displays the gray image in the Image window. To apply
the grayscale function:
1
Press the
ID button of the Image window main toolbar.
Black
The Black will change the values of all non-detected pixels to zero. Thus, all nondetected area in the image will become black. It is used to highlight the detected
phase(s) with light bitplane colors in the image.
To apply Black function:
1.
Press the
18 button
in the Image window main toolbar.
.
Wh ite
The White will changethe valuesof all non-detectedpixels to 255. Thus.all nondetectedarea in the imagewill becomewhite. It is used to highlightthe detected
phase(s)with dark bitplanecolors in the image.
To apply White function:
1. Press the
C buttonin the maintoolbarof the Imagewindow.
Pseudocolor
The Pseudocolor allowsthe user to represent the gray levels with different
colors in the image. It is used to indicate any uneven illumination prior to setting
the shading corrector. Pseudocolor is disabled for color images.
To apply the Pseudocolor:
1. Press the
II
button in the main toolbar of the Image window.
7-.2
MA861 000-4.0
8/17/99
Saturation
The Enterpriseuses a 256 gray level range.This extendsfrom 0, which
representsblack,to 255, which representswhite.In order to obtaina good image
from the microscopefor analysis,the maximumgray value (brightness)of any
pixel in the imageshould not exceed255. If the gray level of a pixel exceeds255,
it is considered"overflow" or saturation.
The .Saturation. Overflowbutton allowsthe user to turn on or off the overflow
indicator.Pixelsthat are over illuminated(grayscaleover 255) are coloredin
brightblue.This is executedin real time so that the user can tune the illumination
until the blue pixelsof the saturationindicatorare just extinguished. In the event
that it is desiredto work with an imagethat is in part oversaturated,then the blue
saturationpixelswill disappearupon imagecapture.
Note: Saturationonly works with monochromeimagesources.
To use Saturation:
1. Press the
~
buttonin the Imagewindow.
.
2. Adjust the illumination on the microscope until only a few blue overflow
indication pixels are visible on the screen.
3, Reduceillumination slightly until no blue pixels are seen.
Bitplanes
The 16 bitplanebuttonscontrol the displayingof the colors on the image.
Executinga routinewill turn on and off the bitplanesas executioncontinues. To
see the appearanceof bitplanesthat have alreadybeenturned off, press the
correspondingbuttonto turn it back on.
New Image
To open a new Image window:
1. From the Enterprise main menu, click File.
2.
Select New Image (Ctrl+N).
Or
1
Click the
[8
buttondirectly underthe File menu.
7~.
MA861 000-4. 0
8117/99
Open Image
To open an existing image:
1. From the Enterprise main menu, click File.
2 Select Open in the pull down menu
3.
Navigate to the folder that containsthe imageto be opened.
4
Click the image file that you'd like to open, and click Open.
Or
1
Click the
(i8 buttonin the Enterprise'stoolbar,and performstep 3. and 4 of
the above procedure.
Undo
The
.8 button undoes the last user action
One steponly.)
Printing an Image
To print out a hard copy of an image:
~
1. From the Enterp~ main menu, click File.
2.
Select Print (CtrI+P) in the pull down menu.
Or
Click the
[8
buttonin the Enterprisetoolbar.
Copy an Image
To copy an image or portion of an image to the Clipboard:
1. From the Enterprise's main menu, click Edit.
2
Select Copy (Ctr1+C)in the pull down menu.
Or
Press the IrfI buttonin the Enterprise'stoolbar
The copied imagecan be pastedinto otherWindowscompatibleprograms.
,,~
MA861D00-4.0
~,
~~.7~__~-
",-,-,.'Cc~~
-8/17/99
Save an Image
1
From the main menu, click File.
2.
SelectSave (CtrI+S)or Save As.
3.
4.
Use Save As to save the image to the specified folder with a specific name
for the image.
Use Save to save the image to the original image file. If a new image to be
saved,Saveworksexactlythe same as Save As.
Or
1. Click
[II
in the Enterprisetoolbar.
Note: The image window must be active to save the image. If the routine
window or the results window are active then they will be saved, not the
image.
.
Exporting an Image
To export an image:
1. The ImageWindowmust be the active window(Highlightedtitle bar) and is
frozen.
2.
From the Enterprise main menu, click File.
3.
Select Export... in the pull down menu
4. Navigate to the folder where you'd like to export the image to.
5.
Select proper file type.
6. Type in file name with the extension
7. Click OK.
Note: Ensure that the image window is active to export the image. If it is
the results window that is active then the results will be exported, not the
image.
7-5
Image Property Window
The ImagePropertywindow is where special informationis enteredto be saved
with the image. The informationenteredon this screenwill be used when reports
are generated.
To changethe image properties:
1. Makesure the Imagewindow is active.
2.
Fromthe Enterprisemain menu,click File
3.
SelectProperties... in the pull down menu or click the m
button in the
Enterprise toolbar.
4,
Type in the companyname in the Company window
5. Type in the user name in the User window.
6. Type in the sample id in the Sample ID window.
7.
8
Type in commentsin the Comments window.
The Objective. Calibration Factor and Aspect Ratio windows are read
only. They display the information for the objective. calibration factor and
aspectratio appliedto the image in the Imagewindow.
9.
Click OK to apply the new properties
7.6
Routine Window
033
034 DIlate Wear layer using Vertical kernel for 1 cycle
035 Dilate Bltplane 16 using Vertical kernel for 1 cycle
036 * Steps 37-38measure the lengths of the test lines II .
037 Feature Wear Layer with Feret 0038 Feature Bltplane 16with Feret 0039 * NOTE: In the results window the graphs are color 040 <end>
-,.&
:g.a--.y
c
-. Baal-'
~.
BoundaryFin
. BorderElim
.
~.
.
.
1 ' .
1 r.
OIord
Size
Oear
aear o\A8ide!ram.
00.. Hut
Con\IWX
Copy
:':I
. D818ConwxHull
r- 8 Della D~
, . D818 Erode
. Dele Prune
Figure 8-1 Sample Routine Window
A routine is a set of image analysis operations or steps that have been recorded
and can be performed on one or more fields of view of the sample. This is a very
powerful and important tool in image analysis. The routine can be saved for
future use after it is built. Comments associated with individual operations or
steps can also be added to help other users understand the routine.
The upper portion of this window is the Routine window. The lower portion is the
Operation Builder window. For details on the operations inside the Operation
Builder window, refer to Section 9 (Operations) and the Appendix. As can be
seen in Figure 8-1, the routine window has a toolbar with the following buttons:
Undo execute
Edit a routine step
Delete a routine step
[8
18
lEI
1m
18
-
Executea routinestep
Executeto a routine step
Executeall routine steps
Execute manual multifield
Executeauto multifield
Setup Guard Frame
Execute auto focus
~1
Undo Routine Step
The undo function will undo one user action. User actions include: Execute, Add
step, Delete step, and Edit step. After an undo is performed the undo is disabled.
Undo will undo the user action on the routine, image and result database.
To undo:
1
Click the
-
button in the Routine window main toolbar.
Edit Routine Step
This function enables the user to edit the routine step and execute the step.
To edit a routine step:
1. Click the step that is to be edited.
2.
Click the
button in the Routine window main toolbar.
.
After editing the step, the step will be executed and the next step will be
highlighted.
Notice:
1. 'J'./heneverthe user adds a step from the Operation Builder or the custom
toolbar into the routine it will always be added just before the highlighted step.
2. 'J'./henediting a highlighted step, the Edit Routine function will ensure the
highlighted step is the next step to be executed in the routine execution
sequence. If the step to be edited is not the next step to be executed in the
routine sequence, the Edit Routine function will execute all of the prior steps,
which have not been executed.
Delete Routine Step
To delete a single step from the routine:
1. Highlight the step that is to be deleted.
2. Click the [8 button in the Routine window main toolbar.
8-2
MA861 000.4. 0
8/17/99
Execute Routine Step
This functionis used to execute the routine one step at a time. However, this
function can only be used to execute the routine sequentially. Otherwise the
Execute Step button in the Routine window toolbar or the Execute Step menu
item in the Enterprise main menu will be disabled.
To use Execute Step:
1. Make sure the step selected is the next step to be executed in the Routine
execution sequence in the Routine window.
2.
From the Enterprise main menu, click Routine.
3.
Select Execute Step in the pull down menu.
Or
Make sure the step selected is the next step to be executed in the Routine
execution sequence in the Routine window.
.
buttonin the Routine window main toolbar.
2.
Repeatthe above proceduresfor the next highlightedstep in the Routinewindow.
Execute Routine to a Step
This functionallows you to execute multiple steps in a routine.
To execute multiple steps:
1. Click any step to be executed in the Routine window.
2. From the Enterprise main menu, click Routine.
3. Select Execute
4.
to Step in the pull down menu.
All steps above the highlighted one will be executed.
Or
1.
Click any step to be executed in the Routine window.
2. Click the
18button
in the Routine window main toolbar.
3. All steps above the highlighted one will be executed.
Execute All Steps in a Routine
To executeall of the steps in a routine:
1. From the Enterprise main menu, click Routine.
2. Select Execute All in the pull down menu.
Or
8-3
1. Click the
[fJ buttonin the Routine window main toolbar.
Manual Multifield
This function allows multiple field measurements to be made with the same
routine. It stores and displays measurement data, both in total and by individual
fields.
To apply the manual multifield function:
1. From the Enterprise main menu, click Routine.
2
Select Manual Multifield in the pull down menu.
3.
The multiple field dialog box pops up in the Routine window.
4.
Click the Start buttonto applythe routineto the fields for the first field. Click
on the Continue button to apply the routine to the remaining fields. The
status bar of the Routine window shows how many fields have been
measured.
.
5. Click Done buttonto end the function.
Or
R buttonin the Routinewindowmaintoolbar.
1
Click the
2.
The multiple field dialog box pops up in the Routine window.
3.
Click the Start button to apply the routine to the fields for the first field. Click
on the Continue button to apply the routine to the remaining fields. The
status bar of the Routine window shows how many fields have been
measured.
4.
Click Done
buttonto end the function.
Note: the function is disabled while image is not live.
8-4
Auto Multifield
This function allows multiple field measurements to be made with the same
routine automatically. It stores and displays measurement data, both in total and
by individual fields. The auto multifield can also be performed by pressing the
RUN button on the automatic stage controller.
To apply the auto multifield function:
1.
From the Enterprise main menu, click Routine.
2.
Select Auto Multlfleld in the pull down menu.
-
3. Select Yes to clear the results.
Or
1. Click the '8 button in the Routine window main toolbar.
Or
1. Press the RUN button on the automatic stage controller.
Note1: \'\'hen a large stage pattem is set for Auto Multifield, make sure that
screen saver and virus scan are disabled before the Auto . Multifield is run.
Note2: Auto Multifield can only be accessed when a routine is present and with a
live image.
Guard Frame
Guard frame allows you to select smaller field sizes for measurement than the
default image window size. It is usually used to build multiple field feature
measurement routines without missing or double counting any particles at the
edge of the frame.
To set up the Guard
Frame:
1. From the Enterprise main menu, click Setup. Select Guard Frame in the pull
down menu.
Or click the
-
button in the Routine window main toolbar.
1. In the frame setup window, you are able to size and position the Guard
Frame. For more information about setting the Guard Frame see Section 9.
2. Click OK to apply the setting. Click Cancel to cancel the setting.
Focus
Focus allows you to focus the image using the automatic stage. The software
will adjust the distance between the sample and the microscope objective to find
the sharpest image. The auto focus can also be performed by pressing the Auto
Focus button on the stage controller box.
To the auto Focusfunction:
1. In the Enterprise main menu, click Routine.
2. Select Focus.
Or
1. Click the ~ button from the Routine window.
Or
8-5
Createa New Routine
To bring up a new Routine window:
1. From the Enterprise main menu, click File.
2.
Select New Routine in the pull down menu.
Or Click
D
in the Enterprise toolbar.
To bring up the Operation window:
1. From the main menu, click View.
2.
Select Operation Builder Window in the pull down menu.
Figure 8-2 Operations Builder
To add operationsinto the Routinewindow:
1. In the Operationwindow,click the Root Node to expandthe Omnimet
Operations.
2. Click any Branch Node to expandthe branch.
3. For example,click the BranchNodeof Threshold,the two functionsof
KThreshold"and KPausethreshold-will be displayed.
4. Doubleclick the Threshold leaf node to bring up the Thresholddialogbox.
5. Apply the Thresholdoperationsto the image.For more informationaboutthe
Thresholddialog,pleaserefer to the help topic for the Threshold.
6. After clickingthe OK buttonof the Thresholdwindow,the operationof the
Thresholdis addedto the Routinewindow.
Or click any button in the customtoolbarto add operationsinto the Routine
window.
8-7
Save a Routine
1. From the main menu, click File.
2. Select Save (Ctrl+S) or Save As.
3. Use Save As to save the routine to the specified folder with a specific name
for the routine.
4.
Use Save to save the routine to the original routine file. If a new routine to be
saved, Save works exactly the same as Save As.
Or
1
Click
[g
in the Enterprise tooIbar.
Print a Routine
1. The routine window must be the active window (highlighted title bar)
2. The routine window must not be showing the operatia1 builder.
3. From the Enterprise main menu, click File.
4. Select Print (Ctr1+P)in the pull down menu.
Or
Click the
[g
buttonin the Enterprisetoolbar.
Stopping the Execution of a Routine
In order to stop a routine that is executing, the ESC key should be pressed. If the
key is pressed during the execution of commands that involve multiple passes
(i.e. thicken and separate), the command will be aborted and execution will stop.
Routine Execution Sequence
All the steps in a routineshould be executedsequentially;for example,you are
not able to executethe third step without executingthe first two steps in a routine
To executea highlightedstep in the Routinewindow,you needto make sure all
of the prior stepsmust have been executed.
MA861000-4.0--
-~.,
,
8-8
~- --
8/17/99
Routine Property Window
Figure 8-3 RoutinePropertyWindow
To open the Routine Property Window, click on File - Properties
or click on the
button when the routine window is active (Highlighted title bar). The information on this
screen is saved as part of the routine.
Type in the author name in the Author window.
2. Type in the comments for the routine in the Comments window.
3. Type in the desired bitplane names in the sixteen bitplane name windows.
4. Click OK to apply new properties.
Note: Bitplane 1 corresponds
to the leftmost color in the below diagram.
8-9
Setupfor Auto Multifield
1 From the .Setup. drop down select .Multifield" , then select .Stage Pattern'
Stage Pattern Definition Window
Figure 8-4 Stage Pattern Definition Window
In the above Stage Pattern Definition window:
1. In Fields group.the numberof fields in both X-axis and Y-axisdirections may
be set. The maximum number in either axis is a total of 10.000fields.
2. The Origin Offset group. allows the settings of an offset point from the set
origin point in either or both X-axis and Y-axis.
3. The three Checker buttons give the choice of contiguous, vertical checker,or
horizontal checker stage patterns to setup the arrangement of fields.
4. The two Orientation buttonsset the stage's travel pattern in either the X-axis
or Y-axis as the preferred direction.
5. In Field MovementSize group. you may choosedifferentfield size out of the
three options: Image Size, Guard Frame, and User defined.
6. In Autofocus group.the First Field allows you to set the first autofocus field.
The Interval allowsyou to determinethe pattern of autofocus.
7. TheLoadbuttonloads a previously saved pattern file in the Buehler STP
format.
8. The Save buttonsaves the current stage patternas a Buehler SIP format.
9. Once an auto field patternhas been setup, savingthe routinewill also save
the associated stage pattern.
10. When a saved routine is opened that was saved with an associated stage
pattern,that patternwill be availableby default as can be observedby
viewing the stage pattern window.
11. If the user wants to run a different stage pattern to the default one then either
load is used as described in number 7 to load up a saved pattern,or the user
MA861000..4.0
--~~---"
8-10
&'17/99
may make a new one from scratch.
For auto multifield stage pattern setup:
1. From the Enterprise main toolbar. click Setup.
2.
Expand the Multifield menu item.
3. Select Stage Pattern.
4.
Stage Pattern Definition window will pop up as shown in Figure 8-4 on the
prior page.
Auto Multifield Run Options Window
1
From the "Setup" drop down select Multifield then "Run Options",
Figure 8-5 Auto Multifield Run Options Window
In the aboveAuto Multifield Run Options window:
1. In Pattern Source group. you can chooseto use Rectangle, which is the
default,or a User Defined From File as a patternsource.
2. In Special Options group,you can chooseto enableTrial Run option. In
this group box, you can also setup the delay time and messagebetween
each field.
3. For multifjeldRun Option setup:
;4. Fromthe enterprisemain toolbar, click Setup.
5. Expand the Multifleld menu item.
6.
Select Run Options.
Auto Multifield Run Options window will pop up.
'~ff
Rectangle
To run a Rectangle Pattern that was previouslydefined:
1. In Enterprisemain menu,click Setup.
2. SelectMuttifield in the pull down menu.
3. SelectRun Options.
4. Click on the Rectangle input box to set the previouslyconfiguredfield
pattern.
5. Click OK.
6. In the Routinewindow,click the.
button.
User Defined From File
User Defined From File uses Excel.csv (comma delimited) XYZ position tables to
set where the stage should travel to in terms of step positrons.
Set Origin Window
Figure 8-7 Set Origin Window
In the above Set Origin option window:
1. Set Origin for X and Y performs the same operation as the" Set Origin"
button on the stage control joystick. It will cause the current X,Y position to
be remembered and the X,Y counter in the status bar of the Enterprise GUI to
be zeroed out The Z-axis reading will be unchanged.
2. Set Origin for X, Y, and Z performs the same operation as the" Set origin for
X and Y" selection, but additionally zero's out the Z-axis position reading.
Subsequent selection of the -Go to Origin" button on the joystick will cause
the stage to return to this X,Y position, but not to the zeroed Z position.
Note: When you check any of these options, the Enterprise takes the
current stage position as the origin.
8-12
Operations
Operationsare the buildingblocksof a routine. Routineswill generallyincludeat least
one commandfrom each of the followinggroups:acquisition, grayscale, color
threshold, grayscale threshold, binary, and measurement. Operationsare addedto a
routineby either clickingon the buttonin the CustomizableToolbaror double-clickingon
the operationin the operationbuilderwindow.
Displaying Operation Window
To display the Operation Builder Window:
1. The Routinewindowhas to be the active window.
2. From the Enterprisemain menu,click View.
3. Select Operation Window in the pull down menu
Acquisition
Average Grab
Average Grab is appliedto the input image by taking the averagepixel valuefor
each pixel for severalframesof live image.The numbersof framesare definedin
the "Grab, Average" parameterbox as the numberof cycles. Since noiseis
random,the overall SIN ratio is increasedand randomnoise is eliminated.The
result is a better qualityimagefor analysis.
To performAverage Grab:
1. Doubleclick Grab, Average in the OperationBuilderwindow.
2. Choosethe numberof cycles in the Grab, Average window.
3. Click OK.
Or
1. Click the.
buttonin the EnterpriseCustomtoolbar.
Note: In order to grab a live image.Average Grab should be placedas the first
step in a routine.If Average Grab is not the first step in a routine,a new image
will be grabbedin the middleof executionof the routine,and resultsmay not be
repeatable.
Grab
Grab freezes a live image.
To perform Grab:
1. Double click Grab in the Operation Builder window.
Or
~
1. Click the
button in the Enterprise Custom tool bar.
Note: In order to grab a live image. Grab should be placed as the first step in a
routine. If Grab is not the first step in a routine. a new image will be grabbed in
the middle of execution of the routine, and results may not be repeatable.
9-1
MA861(XX).4.0
Load Image
Load im.ge loadstheselectedimageto the imagewindow.
To performLoadImage:
1. Doubleclick Load Image in the OperationBuilderwindow.
2. Navigateto the folderthat containsthe imageyou'd like to open.
3. Selectthe image.
4. Click Open button.
Or
1. Click the
,-
button in the Enterprise Custom toolbar.
Note: Load Image only work when you use it as the first step in a routine
Restore Image
Restore Imagefunctionbrings back the original image. ~his command is used
later in routines when it is desired to view the original grayscale image (prior to
any grayscale commands).
To apply Restore Image:
1. Double click Restore Image in the Operation Builder window
Or
Click OK to apply new properties. Then Click the .ill
Enterprise Custom tooIbar.
button in the
Grayscale
The objectiveof "Grayscale" is to provide a more subjectively pleasing image,
improve the usefulness of an image or convert the image to a form that is more
suitable to human or machine analysis.
To apply a Gray Operation:
1. In the Operation Builder window, expand the Grayscale branch.
2
Double click anyone of the leaf nodes.
Or
1. Click on the appropriateicon in the toolbar.
9-2
M A---s61000..4. 0
&117/99
Color Threshold
Color HLS Threshold
Saturationis the strengthor purity
of the color. Saturationrepresents
U'8 amoIri of gray in ~1X;., to
U'8 h~ 8nd is me_urad - 8
pen»ntage from O%(gray) to
1QO%(ful/ysaturated). On tile color
wheel,saturation
i..;;;-~ - one
approachesthe edgeof the wheel,
and saturationdecreases- one
approadles the center.
Hue is the wavelengthof light
IV:~
from or transmlt8d
through8n objed. MOle~T.TMIIy.
hue is ktentifiedby the ~
of the
color such as red. orange,or green.
H~ is measured.. a k)C8tk)non
the color wheel and is expr.-led as
a degreebetweenO' and 380'.
Luminanceis the relative
lightnessor darknessof the color
and is uauaIy measured- 8
pert:entagefrom O%(bIack)
to
100%(white).
SC8l1ngallows the user to dtOO8ethe
way the histogram will be displayed.
Unear gives the least detail. Sq. Root
gives a more detailed histogram.
Lastly, Log gives the maximum detail.
UndowlMremovethe last
accumulativesampleseleded by
the user. It is only &dive whenan
accumulativesampleis 1eI8ded.
Accumulative
Sample adds a
new intensity
rangetolhe~
range that was
originany set.
Q..a;:;
MA861000-4.0
~- -~~
~
-
-
-
8/17/99
or wheel displays the range
and Saturation that the user
Ided.
,r can also configure the
f Hue and Saturation by using
lse and clicking on the edges
!ng them until it read1es the
Iry ranges for Hue and
on.
Bothedgescan
be usedfor
configuration.
This threshold
enablesthe userto
set the rangeof
intensityfor the
grayscale.
Color HLS Thresholding is the way of representing ranges of color values with
different color bitplanes. The bitplanes are used for binary operations and
measurements.
Two ways to start Color HLSThreshold:
1.
In the OperationBuilderwindow,expandColor Threshold branchnode.
Doubleclick Color HLS Threshold leaf node.
2.
Or click
the EnterpriseCustomtoolbar.
Pause, Color HLS Threshold
Pause, Color HLS Threshold is used to stop execution of a routine until
saturation, hue, and luminance thresholding is done. This is useful when there
is variance in the color ranges from one image to the next.
To Pause, Color HLS Threshold:
1. In the Operation Builder window. expand Color Threshold branchnode.
2.
Double click on Pause, Color HLS Threshold.
Or
9-4
Color RGB Threshold
RGB assigns an intensity value to each pixel ranging from O(black) to 255(white) for each
of the RGB components in a color image.
Red enables the user to
change the range of
intensity for the color red.
Greenenablesthe userto
changethe rangeof intensity
for the colorgreen.
Blueenablesthe userto
changethe rangeof
intensityfor the colorblue.
Scaling allows the user to choose t
way the histogram win be displayed.
Lineargives the least detail. Sq. Root
gives a more detailedhistogram.
Lastly,Loggivesthe maximumdetail.
Undo will remove the last
accumulative sample selected by
the user. It is only adive 'aWlen an
accumulative sample is selected.
Color RGB Thresholding is the way of representing ranges of color values with
different color bitplanes. The bitplanes are used for binary operations and
measurements.
Two ways to start Color RGB Threshold:
1.
In the Operation Builder window, expand Color Threshold
Double click Color RGB Threshold leaf node.
2. Or CliCk.
in the Enterprise Custom toolbar.
9-6
branch node.
Pause, Color RGB Threshold
Pause,Color RGBThresholdis used to stop executionof a routineuntil red,
green, and blue thresholdingis done. This is usefulwhenthere is variancein
the color rangesfrom one imageto the next.
To Pause, Color RGB Threshold:
1. In the OperationBuilderwindow.expand Color Threshold branchnode
2.
Double dick on Pause, Color RGB Threshold.
Or
1
Click
II
in the Enterprise Custom toolbar.
Grayscale Threshold
Thresholdingis the way of representingrangesof grayscalevalueswith
differentcolor bitplanes. The bitplanesare used for binaryoperationsand
rneasurements.
Two ways to start Threshold:
1. In the OperationBuilderwindow.expand Grayscale Threshold branchnode.
Doubleclick Threshold leaf node.
2. Or Click the
.
button in the EnterpriseCustomtoolbar.
Pause, Threshold
Pause.thresholdis used to stop executionof a routineuntil thresholdingis
done. This is usefulwhen there is variancein the grayscalerangesfrom one
imageto the next.
To Pause, threshold:
1. In the OperationBuilderwindow,expand Grayscale Threshold branchnode
2. Doubleclick on Pause,threshold.
Or
1
Click the.
buttonin the EnterpriseCustomtoolbar.
9-1
~861D00-4.0
8/17/99
Threshold Window
1
Main thresholdingdialog box displaysgray scalehistogramof the image.
Gray scale histogram has X-axis 0-255. Left end of scale is zero (black) and
right end is white (255). Y position of the graph represents the number of
pixels at each gray level.
2
To detecta bitplane.click one of the bitplanecolor buttons
3
Place the cursor over the Upper Limit slider. Press and hold the left button of
the mouse, and then drag the slider toward right over the desired gray scale
range selecting the lightest gray area of intent.
4.
Place the cursor over the Lower Limit slider. Press and hold the left button of
the mouse, and then drag the slider toward right over the desired gray scale
range selecting the darkest gray area of intent.
5
If other bitplanes are desired. repeat step 2 through step 4 for detecting the
other bitplanes. Clicking on another bitplane will cause the Lower Limit
slider to be placed immediately to the right of the Upper Limit of the last
detected bitplane.
.
6. Sticky Threshold option always movesthe LowerLimitslider and the Upper
Limitsliderone video level to the right of the previouspositionof the Upper
Limitslider.Thus, it is guaranteedthat differentbitplanecolors will not
overlap,or no video level will be includedin morethan one bitplane.If 2
bitplanesoverlapthe color shouldchangeto standardolive green overlap
color.
7.
8.
Thereare three differentY scalingsLinear, Sq. Root and Log. Selectthe
appropriatescale to best view the distributionof the grayscalepixels.
Click Settings to change or view the numeric value of the 16 bitplanes lower
and upper limits.
Threshold Bitplane Setting
In this dialog, numeric Upper and Lower limits are displayed for each bitplane.
You can use the increment or decrement buttons attached to each window to
change the Lower and Upper limits of each bitplane. A value of "-1" means that
the bitplane is not being used for thresholding.
MA861000-4.0
,..
9-8
I.
-
8117/99
Binary Operations
After thresholding, the different phases in the image are represented by different
bitplane colors. It is possible that more than one phase or feature of interest was
detected by the same bitplane color because of a similar gray level range. A
Binary operation is the processthat separatesand classifiesfeatureswithin the
same bitplane,
basedon morphology or size.
To apply a binary operation:
1. In the Operation Builder window, expand the Binary branchnode.
2. Doubleclick anyone of the leaf nodes.
Or
1. From Enterprise's main menu, click Operation.
2. Select Binary in the pull down menu.
Or
.
1. Click the appropriatebinaryoperationbutton in the Enterprisecustomtoolbar.
For more informationaboutindividualbinary commands,see the Appendix.
Measurement
After the phases of interest are well detected in different bitplanes.
measurement.
which is the purpose of image analysis. can be accomplished
To apply different type of measurement
1.
Click Measurement
branch node in the Operation Builder window.
2.
Doubleclick any leaf nodeto apply a specificmeasurement.
For informationaboutdifferentmeasurements,please refer to the followingtopics
in the appendix:
Plane area fraction measurement
Sample area fraction measurement
Feature measurement
Field measurement
Field measurement with Criteria
Plane area fraction measurementwith Criteria
Sample area fraction measurementwith Criteria
Feature measurement with Criteria
Field measurement with Criteria
"""
MA861~.O
A
9-9
.-.
~~c-~
'~
. .~",~c~",-'~'C
-
- ..- -8/17199
Frame
Process Frame
Process Frame definesa smaller area on the imagefor somebinaryoperations.
such as, clear outsideframe, radial grid, squaregrid. and borderelimination.
To setup ProcessFrame:
1. ExpandFrame node in the OperationBuilderwindow.
2. Doubleclick Process node.
Or
1. Click the
m button in the Enterprise Custom toolbar.
2
In the frame setup window, you are able to size and position the Process
Frame.
3.
Click OK to apply the setting. Click
Cancelto cancel Mle setting.
Guard Frame
Figure9-1 SampleGuard Framesetup dialog box
1
There are two groups of
buttonsin this dialog: WIdth and Height.
In the Width group:
Full:
generates a frame the full width of the image.
c
MA861000.4.0
'
&.19
-'.'
~~-~
- .
8/17/99
: generatesa frame half the width of the image.
YI
Y.
Left:
: generates a frame a quarter the width of the image.
moves frame to the left most position in the Image window, so that. the
left margin is on the left margin of the Image window. The X offset is O.
Center: moves frame to the center of the Image window.
Right:
moves frame to the right most position in the Image window, so that,
the right margin is on the right margin of the Image window.
In the Height group:
Full:
generatesa framewith the image'sfull height.
'12
: generatesa frame with the image'shalf height.
'I.
: generatesa frame with the image'squarter height.
Upper: movesframe upward,so that. the top margin is on the top marginof
the Imagewindow.The Y offset is O.
Center: movesframe to the center of the Imagewindow.
Lower: movesframe downward,so that, the bottommargin is on the bottom
marginof the Imagewindow.
.
2. You can also changethe size and the positionof frame manuallyby the
following two methods:
Moving the cursor to any edge of frame,the cursor changesinto a twodirectionarrow cursor. Pressingdownthe left mouse button,and dragging
the cursor will changethe size of the frame.
Using the increment and the decrement buttonsof the Width and the
Height windows.
3.
Moving frame manually by the following two methods
Moving the cursor inside frame. Pressing down the left mouse button and
dragging the cursor.
Using the increment and the decrement buttons of the X Offset and the Y
Offset windows.
4,
The X Offset and the Y Offset windows display the relative distance from the
upper left corner of the frame to the upper left comer of the Image window.
5. The Width and the Height windowsdisplaythe size of the frame.
6.
7
The Units window shows the preferred measurement unit.
Click OK button to set up the frame. Click Cancel the cancel the set up frame
function.
.
MA861000..4.0
9-11
~"
~"~-_.~._~
8/17/99
Routine Operations
Add Comments
1. Expandthe Routine branchnode in the OperationBuilderwindow.
2. Doubleclick Comment.
Or Click the.
buttonin the EnterpriseCustomtoolbar.
3. Type in a commentin the edit window.The commentwill be displayedin
routine.
4. Click OK.
Note: Commentlines have no effect on the operationof the routine.
a Routine
Pause
.
To pause a routinein orderto undertakemanualediting usingthe imageedit
tooIbar:
1. Expandthe Routine branchnode in the OperationBuilderwindow.
2. Doubleclick Pause, Edit.
Or
3. Click the
I buttonin the Enterprise
Customtoolbar.
4. Type in the commentin the edit window(this step is optional).
5. Click OK
In order to continueexecutinga routine.click Done after all of the manualediting
is complete.
Save Image
It is sometimesusefulto save imagesfor each field analyzed,a "Save Image"
step gives this functionality.This functionis especiallyusefulwith Multifield.
VVhenMultifieldis running,new imagefile is saved for every field underan
indexedfile name.
To
1.
2.
3.
run Save Image:
Have a suitable routine open, to append with the .Save Image" command.
Double click Save Image in the Routine Builder window.
In the Routine Save Image window, type in the desired file name to the
4.
5.
6.
required path.
Click OK.
Run the routine for several fieJds.
At the end of the field run use image open to observe the sequentially stored
images under the path that was set in number 4.
Or
MA861000.4.0 .
1._~-~-~
9-12
..
-
-
-
8/17/99
1
Click the
button in the EnterpriseCustom toolbarto observethe listof
sequentialimages.
Clear Annotations
Removes all annotations from the image.
Add Scale Bar
If a calibratedimage is present in the image window Add Scale Bar" will
U
superimpose a small scale bar in the borrom righthand comer of the image. This
overlay is nondestructive to the image and its properties may be changed as per
above. Unit of measure is as per User Preference. Only integers are displayed.
no decimal places.
Result Window
The resultwindowis only availablewhen there is an Imagewindow.The result
window is closedwhenthe Imagewindow is closed.'M1ena routineis executed
with measurements.the resultsare stored in a database. After the routine
completesexecution,the resultswindow is automaticallyopenedand a set of
resultsdisplayed. 'M1enthe resultwindow is accessed,the resultsstored in the
databaseare graphed. The resultswindowcan be openedby clickingon View Result Window or by clicking the
18button in the Enterprise toolbar.
There are two comboboxes in the Resultwindowtoolbar.One lists the
measurementsin the routineand the other one lists the fieldsthat were
measured. By clickingon the arrow to the right of the box, the list of optionswill
drop down. Choosingone of the options in the list will causethat graph to be
displayed.
On the resultstoolbar, there are two icons:
.
Print
18 printsthe currentlydisplayedgraph shownin the window.
Options
pops up the graphoptionsdialog.Thegraphoptionsarefor the
currentlydisplayedmeasurement.If an option in the dialog is not availablefor a
particularmeasurement,it is disabled(grayedout). Any changesmadeto the
graphs on the optionsscreenwill be saved as part of the routine.
Figure10-1 Typical resultswindow
MA861D00-4.0
-
10-1
,
8117199
Print ReportThe graphs can be printed in a report format. The information in the report is
drawn from a number of sources. The company and user names are drawn from
the image properties. For more formatting options, refer to Preferencein Section
12.
1. The Result window has to be active.
2.
From the Enterprise main menu, click File.
3. In the pull down menu, click Print Preview to preview document
4.
In the pull down menu, click Print.
Copy Result
18
To copy a resultto Clipboard,simply click in the
on the Enterprise toolbar.
After the results have been copiedto the clipboard, they can be use in Microsoft
Word 97 by either Pasting the clipboard inside a Text Box or Paste Special as a
.
Picture.
Export Results to Excel
The resultsof the routinecan be exportedto an Excelworkbook. The resultswill
be formattedas follows:
1. Eachstep will have its own worksheet.
2. When undertakingmultiplefields,featuremeasureswill have a separate
sheetfor each field. The other types of measurementswill have all of the
informationon one sheet.
The resultscan be exportedby followingthese steps.
1. The Result window
2.
hasto be active.
From the Enterprise main menu, click File.
3. In the pull down menu, click Export.
4.
Navigate to the desired location.
5. Type a file name, and the file type (XLS).
6. Click Save.
Clear Results
After running a routine, the results can be cleared by following these steps.
1.
From the Enterprise main menu, click Routine.
2.
Click Clear Results
in the pull down menu.
The results will also be cleared when the image goes live or when execution is
restarted.
10-2
MA861 000::4. 0
8/17/99
Results Graph Parameter Window
Graph Title displaysthe type of the measurement. The graph title can be
changedin this window.
X Axis TItle displaysthe title for the X-axis in the graph. The X axis title can be
changedin this window.
Y Axis Title displays the title for the Y-axis in the graph. The Y axis title can be
changed in this window.
X Axis group is enabledwhen displayingthe feature measurementgraph:
X Minimum and X Maximum display the minimum and the maximum ranges for
the bins on the X-axis in the graph. Uncheck Auto Scale to enable X Minimum
and X Maximum.
You can change the values of
graphs.
Intervaland Axis Ticks to generate different
Three types of differentdata formatsto representdata: Decimal, Scientific, and
Engineering.
Y Axis
group is enabled when displaying the field measurement graph:
Y Minimum and Y Maximum display the minimum and the maximum ranges for
the data on the Y-axis in the graph. Uncheck Auto Scale to enable Y Minimum
and Y Maximum.
You can changeAxis Ticks to generatedifferentgraphs.
Two types of scale: Linear and Log.
Note: If an option in the dialog is not available for a particular measurement, the
option is disabled (grayed out).
MA86'1000..4.0
8/17199
Image Editing Toolbar
The Edit toolbar is used to add annotationsand make manualadjustmentsto the
image. The Edit toolbar is active only when the Imagewindow is frozen.
Displaying edit toolbar
To displaythe Edit Toolbar on the activewindow:
1. Fromthe Enterprisemain menu,clickView.
2. Click Edit Toolbar in the pull down menu.
Or pushing in the
18button in the Enterprise toolbar
Hiding edit tool bar
To hide the Edit Toolbar:
1. From the Enterprise main menu, click View
2. Click Edit Toolbar in the pull down menu.
Or dick the
18 button in the Enterprise toolbar
Edit toolbar buttons
Selection:allows you to select a sedion of the image for copying to the
clipboard
Free Hand Draw: allows you to draw any shape or patternwith the selected
bitplane color by holding the left button of the mouse and drawing
18
~
Line Draw: allowsyou to draw a straightline with the selectedbitplanecolor
by clicking and dragging
Area Fill: allows you to paint a selectedand boundedarea
I:B Draw & Fill: allows you to draw the outline of a pattern and fill it with the
selected bitplane color.
11-1
(8
18
Erase:allowsyou to erasea pixel wide line of the selectedbitplanecolor.
Erase: allows you to erase an 8 pixel wide line of the selected bitplane
color.
Delete: allows you to delete any annotations or drawings in the selected
bitplane.
allows you to choosecolorfor editing.
bitplanes:
A detailed description of the functions below is provided in the following text.
Text Annotation:
Point to Point Measure:
-
CurvilinearMeasure:
18
Angle Measure:
line Scan Histogram:
-
Hand:
Pan
f!8
ZoomingIn
ZoomingOut
11-2
Annotation Text
To put annotationtext in the Imagewindow:
1. Clickthe[8 buttonof Edit toolbar.
2. Movethe mouse pointerto a desiredpositionon an image.
3. Pressdown the left mousebutton.
4. Dragthe mousepointerto distancethe annotationfrom the feature being
described(this is optional).
5. Releasethe left mousebutton.
6. Movethe mouse pointerinsidethe text-displayingwindow.
7. Doubleclick the left mouse button.
8. In the popupProperties dialog, select Text property.
9. Type in new text.
.
10. Click OK.
pt to pt Measure
A point to point measure is used to measure the straight line distance between
two points in the image.
To makea Pt to Pt me.sure:
1. Click the
18buttonin the Edit toolbar.
2. Movethe mouse pointerto a desired positionin the image.
3. Press and hold down the left mouse button,and drag the mouse pointerto
the otherend.
4. Releasethe left mouse button.
5. The distancewill be displayedwith the selectedmeasuredunit
Curvilinear Measure
A curvilinearmeasureis primarilyused to measurethe distancearoundan object
or alonga curved path.
To performa Curvilinear measure:
1. Click the
18buttonin the Edit toolbar.
2. Movethe mouse pointerto a desired positionin the image.
3. Pressand hold down the left mouse button,and drag the mouse pointerto
the otherend.
4 . Releasethe left mousebutton.
5'. The distancewill be displayedwith the selectedmeasurementunit.
11-3
Angle Measure
1. Click the
-
button in the Edit toolbar.
2. Move the mouse pointer to a desired position on an image.
3. Press and hold down the left mouse button, and drag the mouse pointer to
another position.
4. Release the left mouse button.
5. Press and hold down the left mouse button and drag the mouse pointer to
another point.
6.
Release the left mouse button.
7
The angle made up by these two lines will be displayed.
Line Scan Histogram
.
Line Scan Histogram allowsyou to obtaina graylevelhistogramacrossa line on
the image in any direction.
1.
Click the
[8
button in the Edit toolbar.
2. Move the mouse pointerto a desiredpositionon an image.
3. Press and hold down the left mousebutton,and drag the mousepointerto
another point.
4. Releasethe left mousebutton.
5. The histogramcorrespondingto the line on the imagewill be displayed.
Pan
.t. Click the
18 buttonof the Edittoolbar.
2. Move the mouse pointerinsidethe image.The mousepointerbecomesa
hand insidethe image.
3.
Press and hold down the left mousebuttonand move the image.
Zoom
1
Click
the
2. Click the
18button
-
of the Edit toolbar to zoom in.
button of the Edit toolbar to zoom out.
11-4
Change Annotation Property
To change the properties of annotation:
1. Click Edit from the Enterprise's main menu
2. SelectAnnotation in the pull down menu.
3.
Select Properties
Or
the mousepointerto the annotationtext where a changeof properties
is desired.
1.
Move
2
Click the left mousebuttonto select the text.
3
Click the right mouse button to reveal a pull down list.
4.
SelectAnnotation Properties in the popupmenu.
There are 4 properties: Text. Background, Border and Line
Text:
In text window. you can change the text to be displayed on the Image
window.
Note:You have to select Disable AutoUpdate option in order to display the new
text.
Disable AutoUpdate option lets you enableor disableautomaticscreen
update.For example,if you enable autoupdateand changethe
measurementunit from thousandthsof an inch to microns.the annotation
text will be updateautomatically.
Click Color to change text color
Background:
.
Transparent option allows you to switch text background between
transparentand solid color.
Click Color to changetext backgroundcolor.
Border:
WIdth changesthe border width surroundingannotationtext.
Click Color to change of border.
No Border option
allows you to turn on/off text border.
Line:
Width changes the line width
Click Color to change line color
MA861000-4.0-
._~-~~
11..$
~
--
.~~~--
--
&'17/99
Move
to Front
Used in cases where several annotations overlay each other, for example,
annotation 1 is on the top of annotation 2 and annotation 2 is on the top of
annotation 3.
To move annotation 3 to the front of all the annotations (thus, annotation 3 is on
the top of annotation 1):
1. Move the mouse pointer to the annotation 3 text, and click the left mouse
button.
2
Clickthe right mousebutton
3
In the popupmenu, select Move to Front.
Or
1. Move the mouse pointer to the annotation 3 text, and click the left mouse
button.
Click Edit in the
Enterprisemain menu
3. Select Annotation in the pull down menu.
4
Select Move to Front
Move to Back
Used in cases where several annotations overlay each other, for example,
annotation 1 is on the top of annotation 2 and annotation 2 is on the top of
annotation 3.
To move annotation 1 behind all the annotations (thus, annotation 1 is behind
annotation 3):
1. Move the mouse pointer to the annotation 1 text, and click the left mouse
button.
2. Click the right mouse button.
3.
In the popupmenu,select Move to Back
Or
1. Move the mouse pointer to the annotation 1 text, and click the left mouse
button.
2.
Click Edit in the Enterprise main menu
3.
SelectAnnotation in the pull down menu.
4
Select Move to Back.
11~
Move Forward
Used in cases where several annotations overlay each other. Move Forward
moves the selected annotation one level up. For example, annotation 1 is on the
top of annotation2 and annotation2 is on the top of annotation3.
To move annotation3 to the front of annotation2 (thus, annotation3 is on the top
of annotation2):
1. Move the mouse pointerto the annotation3 text, and click the left mouse
button.
2.
Click the right mousebutton.
3.
In the popup menu, select Move Forward.
Or
1. Move the mouse pointer to the annotation 3 text, and click the left mouse
button.
.
2.
Click Edit in the Enterprise main menu.
3.
Select Annotation in the pull down menu.
4.
Select Move Forward
Move Back
Used in cases where several annotations overlay each other, Move Back moves
the selected annotation one level down. For example. annotation 1 is on the top
of annotation 2 and annotation 2 is on the top of annotation 3.
To move annotation 1 behind annotation 2:
1.
Move the
mousepointer to the annotation 1 text, and click the left mouse
button.
2.
Click the right mousebutton.
3. In the popupmenu, select Move Back.
Or
1. Move the mouse pointer to the annotation 1 text, and click the left mouse
button.
2. Click Edit in the Enterprise's main menu.
3.
Select Annotation
4.
Select Move Back.
in the pull down menu.
Undo Edit
To undo the last editing action:
1. From the Enterprise main menu, click Edit.
2
Select Undo in the pull down menu
Or dick the
button in the Enterprise toolbar.
Copy Annotation
To copy an annotation to the Clipboard:
[8
1.
Click the
2
Move the mousepointerto the annotationto be copieg
3.
button of Edit toolbar
Push andholddownthe leftmousebuttonanddragthe mousebuttonto
make a rectangleto surroundthe annotationto be copied.After the rectangle
coversthe desiredannotation,releasethe left mousebutton.
There are 3 ways to copy
1
From the Enterprise main menu, click Edit. In the pull down menu, select
Copy.
2. Click the
[g
button in the Enterprise toolbar.
3. Click the right mouse button. In the popup menu, select Copy
Clear Annotations
To clear annotations:
1. From Enterprisemain menu, select Edit.
2.
SelectClear annotations in the pull down menu
Add Scale Bar
With Image Window as current selection click on the Edit drop down
1
Click on Add Scale Bar to add a scale non-destructively over a calibrated
image.
2. If no longer needed use clear annotation to remove.
11-8
~
861"00().4 . 0
8117/99
Custom Toolbar
The customtoolbar is used to quicklyaccessthe functionsthat are used most often.
Clickingon one of the buttonsin the toolbarwill causethe routinedialog box to be
displayed.
Displaying
Custom
Toolbar
-To display the Custom
Toolbar
on the active window:
From the Enterprise main menu, click View.
2. Click Custom Toolbar in the pull down menu
Hiding Custom Toolbar
To hide the Custom Toolbar:
1. From the Enterprise main menu, click View.
2. Click Custom Toolbar in the pull down menu.
Customize Toolbar Window
Available
buttonslist box displays all the buttons available on the Custom Toolbar.
Toolbar buttons list box displays all the buttons currently on the Custom Toolbar.
Figure 12-1 Customize Toolbar Dialog Box
MA861000.4.0
..,--~_..~
12-1,-_.'- r
,
~,-
~-~.~"
.~~
8/17/99
Add new buttons:
1. In the Toolbar buttons list box, select the button that will follow the new button about
to be added.
2. In the Available buttons list box,click on the buttonthat will be to addedthe Custom
Toolbar.
3.
PressAdd button.
Note: A total of 29 buttons can be added to the Custom toolbar.
Remove a button:
.
1
In the Toolbar
2.
Press Remove button. The button will be listed in the Available
buttons
list box, click on the button that will be removed.
buttons
Move a button:
1
In the Toolbar buttons list box. click on the buttonto be moved.
2. Click either Move Up or Move Down.
.12-2.
box.
Preferences
Units:
Figure 12-2 User Preferences (Units Dialog Box)
To access the setupdialog box for User Preferences,go to Setup -
Preferences.The
Unitstab is usedto selectthe measurementunits for results. The choicesare pixels,
inches,thousandthsof an inch, microns,millimeters,and centimeters. When the unit is
changed,the graphsin the resultswindowwill be updatedto reflectthe new unit.
+'-::.
~:;-'.;~
MA8610()0..4.0
---~CCc
:-~_,,~~12-~___~=.
..;=
8/17/99
Database:
Figure 12-3 User Preferences (Database
Dialog Box)
The Database tab controls the settings of the database functions. The following are the list
of functions found in the Database tab and their descriptions:
Sort Recordset:
Check this box if you wish all the records in the
database are sorted by their key value.
Save Results to Excel file:
(100 fields max)
Check this box if you wish to save the analysis result
to Excel files.
Save Field Images for Analysis:
Check this box if you want to save images for the
Show Image Properties Dialog:
Archive to removable media:
analysis.
Check this box if you want the Enterprise to show the
image property before an image is saved for
analysis.
Check this box if you want to archive images to
removable media.
Archive Removable Path:
You can specify the path for the removable media
drive in this box.
Archive Hard Disk Path:
You can specifythe archive hard disk path. This is
the directory where the database saves all the
information.
Dearchive Path:
You can specifythe de-archive path in this box.
Reuse Archive
Volume:
Check this box if you wish to delete the archive
volume after you de-archive the media.
12-4
MA861000-4.0
8117/99
Report Format:
Figure 12-4 User Preference (Report Format Dialog Box)
The Report FormatOptionstab controlsthe format of the reportswhen printingresults.
The Headerbox turns on the printingof a headerat the top of each page. The header
consistsof items suchas the sample name,date. and comments. The Footerwhen turned
on will print the options(PageNumbersand SampleFile Names)at the bottomof each
page.
12-5
Report Selection:
Figure 12-5 User Preferences(ReportSelectionDialogBox)
The ReportSelection tab allows configuration of report printouts.
In Multiple Measurements group:
All Measurements prints all measurements.
Displayed prints only the measurement results currently displayed in the active results
window.
In Data group:
Graph and Statistics prints both graphs and statisticaldata in the report.
Measured Value printsthe measured data in the report.
In Multifield Selection:
Field Summary printsout a summaryreport.
All Fields prints out an individual report for each field.
12-6
RoutineShortcuts:
Figure 12-6 User Preferences(RoutineShortcutsDialogBox)
The RoutineShortcutstab allowsthe user to select a maximumof ten shortcutpathsto link
the selectedroutinefiles to the numberedtoolbarfor fast access to the usersfavorite
routines. Use. Browse8to set the pathto other files as required.
12-7
Annotations:
Figure12-7 User Preference(Annotations Dialog Box)
The Annotation tab allows the user to select the colors for the Text, Background, Border &
its width, and line color & its width.
Text Color changes the color for the text in a annotation. To do this you click the color box
to bring up the color selection window and choose the preferred color.
Background Color changes the background color in an annotation. To do this you click the
color box to bring up the color selection window and choose the preferred color.
Border Color changes the border color in an annotation. To do this you click the color box
to bring up the color selection window and choose the preferred color.
line Color changes the line color in an annotation. To do this you click the color box to
bring up the color selection window and choose the preferred color.
Width changes the width for the border and/or line in an annotation. To do this you use the
spin boxes to change the widths of the border and line.
12-8
MA861000-4.0
8/17/99
Changing
-
the
Routines
associated
with
the
-
Shortcut
icons
If it is requiredto reassignthe shortcuticonsto other routinesthan the ones linkedas
default.then the followingsteps should be followed.
1 In the .User Preferences.click on the Browsebuttonof the numberedicon that is to be
changed. This will open a standard"Open"dialog.
Use the windows"Open" dialogto navigateto the routinefilenamethat is now to be
associatedwith the shortcut
3.
Closethe .Open" dialog windowwith OK
4. Closethe "User Preferences.dialogwith OK
5 Checkthat the shortcut path has been reassignedby lettingthe mousepointerhover
over theshortcuticonso thatthetooltiprevealsthe pathandfilename.
2
Figure 12-6 Open dialog box from the User Preferences when browse is selected
,~
~-~,
12-8
.-
"~
~
__0
-
MA861000-4.0
8117/99
Standard Toolbar
This toolbar is always displayed as part of the Omnimet Enterprise frame.
Displaying Routine Window
If the routine is minimized. you can click the
the Routine window.
I:D
button in the Enterprise toolbar to display
Displaying Result Window
To display the Result window:
1
From the Enterprise main menu, click View.
2.
Select Result Window
Or clickingthe
Displaying/Hiding
in the pull down menu.
buttonin the Enterprise toolbar
Annotation
To display or hide any annotations on the screen
1
Fromthe Enterprisemain menu,click View
2. Select Annotation in the pull down window.
Or pushingin the
Displaying/Hiding
[8
buttonin the Enterprisetoolbar.
Guard Frame
To display or hide the Guard Frame in the Image window
1
Fromthe Enterprisemain menu.click View
2
SelectGuard Frame in the pull down window
Or simply push in the
MA861(XH).4.0
-~-~~~c
j
~
(red) button in the Enterprise tool bar.
12-10
"
-~'"
c
~---'--'-"
8/17199
To display or hide the Process Frame in the Image window:
1. From the Enterprise main menu, click View.
2. SelectProcess Frame in the pull down window.
Or simply push in the
[8
(blue) button in the Enterprise toolbar.
While both the Guard Frame and/or the Processframe may be displayed against a frozen
image as detailed in the prior sections. To display them against a live Image the following
steps will need to be undertaken:
Click on the Saturation icon
~
while the image is live.
From the Enterprise main menu, click View.
.
Selecteitheror both the Process Frame or Guard Frame as neededin the pull down
windowor use the relevanticons.
Shortcut Toolbar
Figure 12-6 RoutineShortcutstoolbar
-
Icon 1 1 phase percent
Icon 2 - Particle sizing
Icon 3 - Porosity
Icon 4 Single Phase Grain Size
-
The shortcuttoolbarprovidesthe user with the abilityto quicklyaccess up to 10 of the
most commonlyused routines. Each Enterpriseis shippedwith 4 of these buttonspreset
to suppliedroutinesand imagesas describedbelow. Eightother routinesand imagesare
also provided.but not attached. To attach them. followthe instructionsgiven on page 129.
Button1 demonstrates phase detection in color. Area phase percentage is then given.
1.
2. Button 2 is an example of particle sizing.
3. Button 3 is an example of porosity.
4. Button 4 is an example of single phase grain sizing.
The file name and path used for each of the previous buttons is given with the tooltip if the
mouse pointer is allowed to hover over any of the buttons.
The user may reassign any of the 10 shortcut buttons to any other desired routine file at
any time using the. User Preference" routine shortcuts dialog.
12-11
MA8610D0-4.0
8117/99
Using the Shortcut Toolbar
If it is not known which of the numbered icons will access the application solution that
is needed, simply allow the mouse pointer to hover momentarily on each icon to reveal
the routine name via the tooltip wizard.
2.
3.
4,
Click on the appropriate icon to instantly load the required application solution routine
to the routine window.
To see the applicationof the routineon the suppliedstoredimage,click on the D
button in the routinewindow.
To use the shortcutroutineon your own materialsimplyhighlightthe step that calls for
the stored imageand use[8 button to delete that step. The routinewill now work
with the live image. Edit all remainingsteps as need to accommodatedifferences
betweenthe live imageand the stored standard. If required,save the modifiedroutine
with a new filename. The modifiedroutine may be attachedto a shortcuticon as
describedon page 12-4.
.
Using
and
Modifying
the
supplied
shortcut
-
application
solutions
-
The routinesthat are linkedto the shortcuticons are designedto demonstratea rangeof
commonapplicationsolutions. The user is free to modifyany of these routines.but they
must be saved with a new namesince the suppliedones are readonly.
To use the shortcutapplicationsolution:
1
2.
Click on the appropriate numbered icon.
Modify the routine as needed to suit the live sample
3.
Click on
III
to run the routine.
Save the modifiedroutineif requiredby
1.
2.
3.
4
5
Ensurethat the routinewindowis current (highlighted).
Click on "File" to revealthe drop down menu.
Click on "Save As" to openthe standardwindowsdialog
Type in a new file nameand save.
Reassignthe shortcutpath as needed.
12-13
MA861000.4.0'
r
~~
&'17/99
Guidelines
for
the
modification
of the
eight
supplied
shortcut
application
solutions
--
The supplied shortcut application solutions have been constructed around the supplied
linked image. While the routines have been developed to work over a range of image
conditions. your live sample may be sufficiently different that various steps in the routine
may need modification as indicated below.
1 To run any of the shortcut routines on a live sample it will be necessary to delete the
2.
"load image" step.
If the illumination of your sample is different to the supplied stored one, or if the etched
condition is different, then the thresholding step will need adjustment Simply highlight
thatstep and click on
3.
I to edit the step.
If the magnification or the feature size of the sample is different to that used in the
stored image, then any "Trap", "Chord Size", or KFeatureSize Transfer" steps may
need adjustment. Again use the
(8
button to edit all the appropriate steps.
4. A differentrangeof measurement parameters may be needed, use the
adjust as necessary. If necessary, save changes to a new filAname.
12-14
MA861D00-4.0
8117/99
Image Database and Automatic Report generator
Overview
The Omnimet Enterprise version 4.0 includes a powerful database and report
generator for the StOfage of images and associated data along with the capability
to send these to MicrosoftWord for professional report generation.
The databaseis organizedin a logicalstructurewith imagesstored undera
Specimensfolder and specimensstored undera Projectfolder. Undereach
folderthere are a numberof fields for the user to enter additionalinformation
aboutthe image. The labelsfor these fields are user definable. Imagesand
projectsmay be quickly retrievedby usinga filter based search tool that works on
any of the data fields.
Getting Started
The databaseand report writer functionof the OmnimetEnterpriseare all self
containedand do not demandthat the user separatelyopen any additional
software. MicrosoftWord 2000 will be openedautomaticallyby the Omnimet
when neededfor report generation.
When launchingthe OmnimetEnterpriseapplication,the user will be promptedto
enter their name in a log on screen. If the systemis new and has not been run
before,the entry field will be blank as shownin Figure 13-1, otherwiseit will show
the nameof the last user.
Figure 13-1 Logonscreen
Type in your name, and click OK or simply click OK directly if your name is
already showing. This name will subsequently show in the database entries
when new projects are made.
MA861000-4.0
..~-
1~1'.
--
&117/99
After logging on, you will see the Omnimet Enterprise Desktop GUI as shown
below in Figure 13-2 with the database view occupying most of the screen. If the
database is not needed at this time and only access to the image analysis
functions are needed, then simply minimize the database view.
Figure13-2 Omnimet Enterprise Desktop GUI
In order to be able to save images to the database it is necessary to have:
1. An image in the image window to save to the database.
2.
Database open at the image folder level with project and specimen folders
defined.
This is achievedas follows:
1. Eitheropen an existing project or start a newone (page 13-9).
2. Lockthis projectusing the project button(the buttonshouldthen appear as
beingdepressedand the projectnumbershouldappearin the adjacent
window.)
3. Click on the Specimen tab and either use the scroll buttons
to
locate a specimen to place the images under, or create a new specimen
(page 13-11). In either case, once the correct specimen information is
showing in the dialog, lock it down by depressing the"'Specimen
This will cause the specimen name to show in the window
adjacent to the specimen lock-down button.
4.
Next, click on the Images tab to reveal the images dialog for the database. If
this specimen name has no prior images under it, then the page will show
Record = a and Total Records = a at the bottom left edge of the dialog as
shown in Figure 13-3. It will also have no thumbnail image showing.
Figure 13-3
RecordsStatusBar
If the specimenname has prior imagesthen the numberof these will be
shownin the read out shown in Figure 13-3and a thumbnailof the currently
selecteddatabaseimagewill be shown in the bottomright hand comer.
5. If there is no current live image or an importedimageshowingin the image
windowthen click on File in the main headerof the Enterpriseand select
either:New Imagefor a live image,or Open Imageto importone.
6. Oncethere is an image in the windowthere are two methodsto copy it to the
database.
a) Quick Method - Simply press the
buttonthat is on the image window
frame. This will copy the image to the database with just the automatically
linked data attached. The user will need to use the Edit tool.
to enter
any additional data into the eight remaining fields. The record readout
seen in Figure 13-3 should increment by one and a thumbnail of the
database image will appear in the bottom right hand comer of the
Database Image view.
13-3
b) Standard Method - With the required image in the image window toggle
to the Database view by either, clicking on a portion of the database
dialog that extends beyond the current image window, or click on Window
as shown in Figure 13-4 then select Image Database.
Figure 13-4 Windows Menu
With the Image Database showing, click on the.8 button in the
Database toolbar. you may now enter data associated with the image
under eight different field headings. You may en~r data, or choose to
enter nothing. Either way simply click OK to close the. Add data" mode
the image will be added to the database as shown by its thumbnail under
the Images tab.
Generating Reports using the Database
The OmnimetReportGeneratorthat is built into the Image Databaseallowsthe
userto send a single image,or a rangeof imagesto the report queuefor report
generation. Fromthe reportqueue,the user may select an appropriatetemplate
from the six standardones suppliedaccordingto whetherone, two, three,four or
six imagesareto appearon eachpage of the report.
Generating a Single Image Report
To send just a single image to the report queue:
1. Simply navigate down through the projects and specimen folders to the
correct project\specimen\image level, if known, then scroll through the
images at this level until the appropriate thumbnail shows. Alternatively use
the database filter tool to automatically locate the desired image (page 1323.)
2. Click on File, then select. Add to Report Queue" as shown in Figure 13-5.
13-4
Figure 13-5 DatabaseFile Menu. Add to ReportQueue"
3.
Clickingon "Addto ReportQueue- will generatea dialogshowinghow many
recordshave beenaddedto the queue as shown in Figure13-6below.
Press OK to clear this configurationdialog.
Figure 13-6 Add to Report Queue dialog
4
Returnto the File drop down as shown in Figure 13-5 and select Report
Queue Contents dialog as shown in Figure 13-7.
Figure 13-7 DatabaseFile Menu. Report Queue Contents"
5
For this single image, its name will already be highlighted, to make the report
simply click on the .Create Report" button shown in Figure 13-8. This will
cause a File Open dialog window to open.
Figure13-8ReportQueueContentsdialog
6. If it does not opento the templatedirectoryunder MS Office(C:\Program
Files\MSOffice\Templates)then navigatethroughthe directoriesuntil six
templatesnamed1pix, 2pixL, 2pixP, 3pixL, 3x2pixL,and 4pixL are visible.
Highlightthe 1pix templatefor the single imagethen click Opento generate
the report. MS Word 2000 will now automaticallyopen and the chosen image
with linkeddata will be insertedinto the template. You may chooseto enter
MA861D00-4.0
-~
,
13-5
_0
-
-
-
8/17/99
Generating a Multiple Image Report
The OmnimetEnterprisehas the capabilityto make reportsfrom multipleimages
with one, two, three, four or six imageson a page. The 1pix templateallowsthe
user to create a reportwith a single imagein portraitview. The 2pixL template
allowsthe user to create a reportwith two images in landscapeview. The 2pixP
templateallows the user to createa reportwith two images in portraitview. The
3pixL templateallows the user to createa reportwith three imagesin landscape
view. The 3x2pixLallows the user to create a reportwith six imagesin landscape
view. Finally,there is the 4pixL templatewhich allows the user to createa report
with four imageson a landscapeview. An outline view of the standardsupplied
templatescan be seen on page 13-7. 'Nhicheverformat of reporttemplateis
chosen,the queued imageswill be pastedin, along with associateddata
accordingto the bookmarksin thesetemplates. In the case where the numberof
queuedimagesexceedsthe numberof image placementboxes on a page,then
additionalpages are generateduntil the imagesare accommodated.
To create a report the user mustfirst add contentsto the ReportQueue(page 134). There are differentways to get a rangeof images. A" outlineof these
availableformats is shown on page 13-7.
To create the report:
1. Add the requiredimagesto the reportqueue using the Add to Report
.
Queue"commandunder File (see Figure 13-5). The imagesmay be selected
individuallyat the imagetab levelof the databaseor a rangeof imagesmay
be addedto the report queueat the specimenand projecttab levels.
2. Use the "Report QueueContents"commandunder File (see Figure 13-7)to
view the imagesnamesbeingqueuedready for report generation. All the
imagefilenamesare highlightedby default. Simply click on those that are not
requiredto go to the report. This will deselectthem.
3J. Next, click on .Create Reports" to access the open template dialog seen in
Figure 13-9 below.
Figure 13-9Opentemplatedialog
Choosethe requiredtemplateand observethe imagesand linkedtext being
automaticallyinsertedinto the Report.
For multiple image reports with images from multiple projects\specimens:
Separ8te Project: Checking the option will initiate a page break in the report
each time the project number changes.
13-7
Image Database in more detail
Thereare five tabs in the ImageDatabase. Theseare the: ProjectsTab,
SpecimensTab, ImagesTab. AnalysisTab, and the FieldsTab. Beloware
descriptionsof each tab and its function.
Tabs:
Figure 13-17ProjectsTab
Adding a New Project:
A projectmay be added by pressingthe.
buttonas seen in Figure 13-17. The user may
enter valuesinto the open fields. Press OK
when finished. The ProjectNumberis
automaticallyset when OK is pressed.To save
the new projectpress OK, or press the Add
buttonagain. To cancel all changespress
Cancel,or pressthe Esc key.
Scrolling through Projects:
The _=II
buttonwill allow the user to scroll
througheach projecton the database.
Locking a Project:
currentprojectnumber will now show in the
window next to the lock down button.
13-8
MA861000-4.0
..
8/17/99
Editing a Project:
Deleting
To edit a record in the Projectstab pressthe
button,or select Edit Recordfrom the Database
pulldown. The user may now entervaluesinto
the fields that need to be edited. To savethe
changespress OK, or pressthe edit button
again. If you press the edit button,a message
will be displayedasking if you want to save
changes,click yes. To cancelall changespress
Cancel,or press the Esc key.
a Project:
To delete a projectpress the :8 button, or
select Delete Record from the Database
pulldown. There will be a confirmation dialog
that must be clicked before deletion occurs.
Copying a Project Record:
To copy a record press the.8 button,or select
Copy Recordfrom the D~tabasepulldown.To
pastea record pre~ the 18 button,or select
PasteRecordfromthe Database
drop down.
Archiving a Project:
Dearchiving a Project:
Project Record Search
using Filters:
Report Queue Contents:
To Archive a project click on the"
button, or
select Archive Project from the Database
pulldown. Archiving may only be undertaken
within the Projects tab.
To Dearchive a project click on the -. button,
or select Dearchive Project from the Database
pulldown. Dearchiving can only be done in the
Projects tab.
The i:8 button will open the Filter dialog for the
Projects tab.
The
.
button will open the Report Queue
Contentsdialog.
Adding Images to the
Report Queue Contents:
Image Gallery:
The.
buttonwill add the currentproject
imagesto the ReportQueue.
The. buttonwill open the Image Gallery in
which thumbnails of images in the database will
be displayed.
13-10
MA861000-4.0
8/17/99
Figure13-18 Specimens Tab
Adding a New Specimen:
A specimenmay be addedby pressingthe.
buttonas seen in Figure13-18. In order to add
a specimena projectmust be locked. The user
may enter values into the open fields. To save
the new specimenpressOK, or press the Add
buttonagain. To cancelall changespress
Cancel,or press the Esc key.
Scrolling through
Specimen Records:
The
Locking a Specimen:
--
button will allow the user to scroll
througheach specimenthe current specimen id
will now show in the window next to the lock
down button.
To lock a specimen, press the
on the database.
Editing a Specimen
Record:
.
J-
button
To edit a record in the Specimenstab press the
button. or select Edit Record from the
Databasepulldown. The user may now enter
values into the fieldsthat need to be edited. To
save the changespressOK. or press the edit
buttonagain. If you pressthe edit button,a
messagewill be displayedasking if you want to
save changes,click yes. To cancel all changes
press Cancel.or pressthe Esc key.
13-11
MA861000-4.0
.
,'.
8/17/99
Deleting a Specimen:
To deletea specimenpressthe. button,or
selectDeleteRecordfromthe Database
pulldown.
Copying a Specimen
Record:
To copy a recordpress the
Pasting a Specimen
Record:
To pastea recordpress the 18 button,or
selectPasteRecordfrom the Databasedrop
down.
Specimen Record Search
using Filters:
The
Report Queue Contents:
The
Adding Images to the
Report Queue Contents:
Image Gallery:
-
button,or select
Copy Record from the Database pulldown.
~ buttonwill open the Filterdialogfor the
.
.
Specimens tab.
button will open the Report Queue
Contents
dialog. .
The.
buttonwill add the contentsof the
currentspecimento the ReportQueue.
The
button will open the Image Gallery in
which thumbnailsof imagesin the databasewill
be displayed.
13-12
AlA861(X)O..4.
0
'.
8/17199
~
all
Figure 13-19 Images Tab
Adding Images and Data:
An imagecan be added by pressingthe.
button as seen in Figure 13-19. In order to add
a image both the projectand specimenmust be
locked. The user may enter valuesinto the
open fields. An imagethumbnailwill be placed
in the bottomright handcomer of the image
databaseas indicatedin Figure13-20. To save
the new image press OK, or pressthe Add
button again. To cancelall changespress
Cancel,or press the Esc key.
Scrolling through Images:
The ...
buttonwillallowtheuserto scroll
througheachimage.
Editing an Image Record:
Deleting Images:
MA861000.4.0
-
--
To edit a record in the Imagestab press the.
button,or select Edit Recordfrom the Database
pulldown. The user may now entervalues into
the fields that need to be edited. To save the
changespress OK, or pressthe edit button
again. If you pressthe edit button,a message
will be displayedasking if you want to save
changes,click yes. To cancelall changespress
Cancel,or press the Esc key.
To delete an image press the"
button, or
select Delete Record from the Database
13-13
I
8/17199
Copying an Image Record:
To copy a record press the 8 button,or select
Copy Recordfrom the Databasepulldown.
Pasting an Image Record:
To paste a record press the 18 button, or
select Paste Record from the Database drop
down.
Opening\Retrievinga
Record:
m
To open\retrievea record press the
button,
or select RetrieveRecordfrom the Database
pulldown.
!3
Image Record Search
using Filters:
The
button will open the Filter dialog for the
Images tab.
Report Queue Contents:
The. buttonwill open the ReportQueue
Contents
dialog.
.
Adding Images to the
Report Queue:
The . buttonwill add the current imageto the
ReportQueue.
Image Gallery:
The.
buttonwill open the Image Gallery and
show the current Project\Specimen images.
13-15
13-16
Analysis Tab:
Figure 13-21AnalysisTab
Adding Image Analysis
Infonnatlon:
Analysisinformationmay be added by pressing
the. buttonas shownabove. In order to add
an analysis,the user must run a routineand
both the projectand specimenmust be locked.
The user mayenter values into the open fields.
To save the new analysispress OK, or press
the Add buttonagain. To cancelall changes
press Cancel,or press the Esc key.
Scrolling through Analysis
Information:
The
Editing an Analysis
Infonnation:
--
button will allow the user to scroll
througheach availableanalysis.
.
To edit a recordin the Analysistab press the
button, or select Edit Record from the
Databasepulldown. The user may now enter
values into the fields that need to be edited. To
save the changespress OK, or press the edit
buttonagain. If you press the edit buttona
messagewill be displayedasking if you want to
save changesclick yes. To cancel all changes
press Cancel,or press the Esc key.
Deleting an Analysis
Record:
-~.-
MA861000.4.0
To delete a analysis press the.
button. or
select Delete Record from the Database
pulldown.
13-'1'1
~---
~
8/17/99
Image Gallery
Overview
The ImageGalleryallows the user to view groupsof thumbnailsof imagesin the
databaseof the Omnirnet.
The number of thumbnails that are viewable in the gallery is dependant on
several factors:
1. The configuration of the Gallery view (number of rows and columns to be
displayed).
2. The degree of filtering currently present in the database. In this way, the
gallery will show only those thumbnail records according to whether: a project
is selectedand locked. a specimen is selected and locked, and whether the
user is at the image folder tab level or not.
3. 'M1ether the filter search tool has been used to select an image or range of
images.
.
If no projectis selectedand locked,then all the imagerecordscurrentlyin the
databasewill be representedby thumbnailsin the Gallery. VVhenthere are more
imagerecordthumbnailsthan can be displayedon one pageof the galleryview,
then the userwill need to navigatethroughthe pagesusingthe ,' "_~~I~
tools.
Accessing the Gallery View
To bring the ImageGallery into view, the databaseview must be the active
window if the Omnimet has an image window present This can be confirmed by
observing the main title bar of the Omnimet user interface, it should appear as
below in Figure 13-23.
Figure 13-23Main title bar of Omnirnet when database is active
The Stepsto open the GalleryView are:
1. Click on "View- as seen above in Figure 13-23to revealthe drop down menu
shown in Figure 13-24 below.
2. Click on ImageGalleryto open the ImageGalleryview. The numberof
imagethumbnailsbeing displayedwill dependon the current leve!of filters in
the database.
MA861000-4.0
~_-i_~
- 1~17
-
~
"..".,
~
8/17/99
Copying an Analysis
Record:
Pasting an Analysis
Record:
Opening\Retrieving a
Record:
Analysis Record Search
using Filters:
To copy a record pressthe .8 button,or select
Copy Recordfrom the Databasepulldown.
To paste a record press the 18 button. or
select Paste Record from the Database drop
down.
To retrievea recordpressthe. button,or
selectRetrieveRecordfromthe Database
pulldown.
The ~ buttonwill open the Filter dialog for the
Analysis tab.
Fields Tab:
Figure13-22Fields Tab
The purpose of the Fields tab is to hold the results from the routines saved in the
Analysis tab. Once an Analysis is added the results are automatically saved in
the Fields tab. The values from the routine are automatically entered into the
Fields tab when a new analysis is saved. The values cannot be edited.
~
The .
The
button is active and will open the Filter dialog for the Projects tab.
button is active and will open the Report Queue Contents dialog.
The.
button is active and will open the Image Gallery to show thumbnails of
images under the current project\specimen selection.
13-18
MA8610D0-4.0
8/17/99
Or
Click the. icon in the Database view toolbar. The Image Gallery will now
be displayed as shown in Figure 13-25below.
Figure 13-25 Gallery View
Image Gallery in Detail
Navigationof multiple pages.
Clickingthis icon displays the first page of the Image Gallery
record.
Clicking this icon moves the view one page backtowardthe
beginning of the Image Gallery record.
Clicking this icon moves the view one page forwardtowardthe
end of the Image Gallery record.
Clicking this icon displays the last page of the Image Gallery
record.
Clicking this icon opens a further dialog as seen below in Figure
13-26 to allow the user to click on the page number to go to.
Once the appropriate page number is selected in this dialog,
clickingOK will display the page view.
13-19
MA861 000-4. 0
8/17/99
Figure 13-26
ImageGalleryPage List
When navigatingmultiplepages, the current page location and the total
number of pages available to view are displayed in read out dialogs at the
bottom left portion of the Gallery view status bar as seen in Figure 13-27
below.
Figure 13-27 GalleryView MultiplePagepositionindicator
Image Record Information
Under each thumbnail,there are three linesof data relatingto the original
image record, those are:
1,
Project Number
2. Specimen Name
3. ImageNumber
Opening a Record from the Image Gallery View
When in the Image Gallery view, the user may click on a thumbnail to
select it as indicated by an outer red border. Double clicking the selected
thumbnail will cause that image to be retrieved from the database and
displayed in the Image Window. If there was an existing image in the
Image Window, the user may be prompted to save changes if it has been
altered since it was last saved.
Gallery Configuration
The user may choosethe number of thumbnails that are to be displayed
per page by using the Gallery Config tool. It should be noted however
that choosing fewer thumbnails to display does not change the size of the
thumbnails. They are of fixed size regardless of how many are being
displayed.
To access the Gallery Configuration Utility:
1 Click on Setup in the main Omnimet header when in Database view
to reveal the drop down menu as shown below in Figure 13-28 and
click on Gallery Config.
13-20
MA861000-4.0
8/17/99
Figure 13-28GalleryConfiguration
2.
The dialog shownbelowin Figure 13-29will be generatedto allow
the user to changethe numberof thumbnailrows and thumbnail
columns.
Figure 13-29GalleryConfigSetup dialog
3.
Change the number of rows and columns to be displayed using the
= increment, decrement spin tools, or click and highlight the current
number and over-type with the new value. Click OK to set the new
values and exit the dialog. Click Cancel if no change is to be made.
Pleasenote that the maximum number of rows and columns that can be
displayed is 10. If the number of thumbnails being displayed exceeds the
Gallery view window size. then scroll and pan tools are automatically
generated to allow the user to view thumbnails beyond the frame edge.
Altematively, the user may click and drag the Gallery view frame edges
to enlarge the view until all the thumbnails can be viewed.
13-21
MA861(XX).4.0
8/17/99
Archiving Databased Images
Archiving moves your image files to an extemal Storage Medium in order
to recover disk space on the hard disk for the Image Database. All project
imagethumbnails are retained and shown in the imagegalleryfor
reference,even when the actual image files are archived to an extemal
storage medium. When opening an image via the thumbnail, the
Omnimet will direct the operator to the specific archive medium 1.0.
assigned during the archive process.
Archiving Database Config under User Preferences
Archivingand dearchivingof projectsis performedin a structuredformal
Figure13-30showsthe defaultvaluesthat are usedfor archivingand
dearchivingpaths.
Dearchivingretransmitsarchivedimagesdata back to your hard disk.
This may be helpfulin case you want to edit an a..::hivedProject.
Figure13-30UserPreferences
DatabaseTab
Archive to removable Selectthis option if you want to archive images
media:
to the removablemedia.
Archive Removable
Path:
The user may specifythe pathfor the
removablemediadrive in this box.
Archive Hard Disk
Path:
The user may specifythe archivehard disk
path. This is the directorywherethe database
saves all the information.
Dearchive Path:
The user specifythe dearchivepath in this box.
ReuseArchive
Volume:
Selectthis option if you wish to deletethe
archivevolumeafter you de-archivethe media.
13-22
MA861 000.4. 0
8/17/99
Database Configuration Utility
Figure 13-31DatabaseConfiguration
The purposeof the DatabaseConfigurationis to enablethe user to make
changesto the databasefieldnames. Thereare three columnsin the dialog. The
Labelcolumncontainsthe labelsof the user interfaceof the database. The Field
Namecolumncontainsthe actual field namesin the database.The Data Type
columnindicatesthe data type of each field in the databaseand showswhether
the data to be entered should be text only. numericonly. or alphanumeric.The
ReadOnlycolumn showswhetherthe field is readonly or not You can only
renamethe informationin the label column. The DatabaseConfigurationchecks
for duplicatedlabels. Only unique labelscan be saved in the database. The
DatabaseConfigurationprogramalso does not allow the user to type in special
charactersor use a space betweenwords.
The r~-
button pops up the label Dialog box shown below.
To renamea label of the database,you can do the following
1. Selecta label by left mouseclickingthe label.
2. Click the Renamebutton.
3. Type in the new label in the Label Dialog.
4. Click OK
Clicking OK in the Label Dialog box will replace the original label name. Clicking Cancel in the
Label Dialog box will not replace the original label name. Clicking the
out of the Database Configuration. Clicking the
III..
button will exit
button will open the dbconfig help file
13-23
MA861000-4.0
8117/99
Database Filters
Each tab has its own filter. The following are the different filters for each tab:
Figure13-32ProjectsFilter Dialog
Figure 13-33 Specime11sFilter Dialog
Figure 13-34 Images Filter Dialog
Figure 13-35 Analysis Filter Dialog
Figure 13-36 Fields Filter Dialog
13-24
Filter functionality
Add will insert the Value into the Defined values box
seen in Figures 13-32 to 13-36.
Removewill delete the selected Value in the Defined
values box seen in Figures 13-32 to 13-36.
Use will place the selected value into the Value position
box seen in Figures 13-32 to 13-36.
Save will save the current Filter Definition. In order to
save a filter the Filter Name,Field Name,Operator,and
Value must be selected.
Save As will save any changesmadeto the current
Filter Definition with the option of changing the Filter
Name.
.
To exit out of the Filters dialog press the close button
Close will not save any changes made to the current
Filter Definition.
Insert will insertthe Field Name.Operator,and Value
into the current Filter Definition.
Edit will allow the user to make changesto the current
Filter Definition.
Replace will replace the current Filter Definition with the
changed options.
Delete will delete the current Filter Definition
Note: Uponexitingand reenteringEnterprisethat the filter is removed
13-25
MA861000-4.0
8117/99
Creating Reports with Image Analysis Results
In order to createan automaticreport. the OmnimetEnterprisemust be open.
MS Word will automaticallyopen as soon as the 'Exportto Word' selectionis
made if it is not alreadyrunningin the background. Once a routinehas been run
that generatesresults,the user need only ensure that the actualpageof results
requiredin the reportis the one that is currentlydisplayed (onlythe top page
from the potentiallymulti-pageresultsviewer is copiedinto the report).The
remainderof the reportgenerationis automaticonce the 'Exportto Word'
selectionis made.Figure14-1 beJowshows the selectionof Exportto Word from
the File pull-downmenu.
Figure 14-1 Part of the File pull down showing the Export to Word selection
As soon as the Export to Word selection is made, MS Word in MS Office will
automatically start if it is not already running and the default report template will
open. At this point the original gray image will be pasted into the space for the
gray image in the report, the modified image will be pasted into the space labeled
'Detected image' and the top page of the results will be pasted into the space set
aside for results. The images and results are automatically sized into the
template frames and any associated data automatically entered into the table
headings of the report. An example of the standard report from the default
template is given on the next page as Figure 14-2.
Once the report has been made, the user has the choice to print it and close the
Word document without saving, or printing it and saving the document with a
logical name in a preferred location.
14-1
MA861000-4.0
8117/99
Company name
Date: January 15, 2000
Central Laboratories
Report:
Objective:
Calibration:
Requester:
Vendor:
Material:
0.47244 ~m/Pixel
Heat No:
Fig. 1
Captured image
Fig. 3
Image Analysis Measurements
Comments
Signature:
Figure 14-2 Sample report
--
MA861000.4.0
~
"-
~
,.-,~"
&117/99
Modifying the Template
The template that is shipped with the Omnimet Enterprise can be modified to
better suit individual needs as described here. The template is located under the
diredory C:\Program Files\Buehler\Enterprise\ReportTernplate. It is important
that this path is kept as the Enterprise is programmed to look at this location in
order to automatically make the report in Word with the 'Export to Word'
command. Figure 14-3 below shows the path leading to the Enterprise template.
Figure 14-3 Locationof the EnterpriseReportTemplate
Other templates may be created and modified to suit the needs of each person,
but it must be remembered that only the one called 'Enterprise Template',
residing within the Enterprise template directory, will allow automatic report
generation. Thus, if this automated feature is to be retained after modification of
the default Enterprise template, then neither its narne, nor its location can be
changed after modification.
The choicesthereforeare:
1 Use the Buehler supplied Enterprise template as is. with no modification
whatever.
2
Modify the Enterprise template but keep the exact same name and directory
location in order to retain its ability to be opened automatically.
3
Using the Enterprisetemplate- make additionaltemplateswith other names,
underneathanotherlocationthat are openedmanuallyfromwithin Microsoft
Word.
For cases 2 and 3 above.the following applies - first, the Enterprise template
should be Opened. It can be found under C:\Program
Files\Buehler\Enterprise\Report Template and can be located with Windows
explorer as shown above in Figure 14-3.
14-4
AlternativelyMicrosoftWord may be openedand the 'File Open' facility used to
locateand open the Enterprisetemplateas seen below in Figure 14-4.
Figure14-4File open DialogBox in Word
.
Wordwill generatea dialog box as shown below in Figure14-5.
Figure14-5 Promptbox after selecting'Exportto Word' withoutthe Templatecalled
'EnterpriseTemplate'
The buttonnamed 'Enable Macros' should be clicked In order to proceed.
In either case, once it has been opened, textual changes may be made to the
Enterprise Template as with any word processed document. Please note
however, that text that is inside the marks « and » MUST NOT be touched as
these are bookmarks and are linked into the Enterprise program.
Once the needed changes have been made, then in the case of item 2 listed
prior, it Is critical that the modified template is saved as Enterprise Template.dot
within the Enterprise Template directory. This is ensured by using .Save' under
File rather than 'Save As.'
-
MA861000.4.0
14-5
8/17/99
In the case of item 3 listed prior, where additional templates are required the
'Save As' function should be used with a filename other than 'Enterprise
Template'. This new - additional template should be saved to the standard
MicrosoftOffice location for Word templates (C:\Program Files\Microsoft
Office\Templates). This can be seen in Figure 14-6 below.
Figure 14-6 File Save As Dialog Box for Templates in Word
In order to be able to have the choice to use these additional templates. the
default Enterprise Template will have to be disabled, else it will always open in
preference. The default Enterprise Template under the directory C:\Program
Files\Buehler\Enterprise\ReportTemplate may easily be disabled by renaming it
using Explorer to any other name.
Once the default EnterpriseTemplatehas been disabledby renamingit, it will be
found that as soon as 'Exportto Word' is selected,Word will open, but that it will
generatea dialog box as shownbelowin Figure 14-7.
This will then bring the user into the standard Microsoft Word Template selection
window that is normally generated by clicking 'New' under File. This window is
shown below as Figure 14-7. In Figure 14-7, the additional templates can be
seen, in this example they are modified versions of the original Enterprise
Template.
14-6
MA861000-4.0
8117/99
Boolean
Boolean
operationsperfomllogical functionsbetweenbitplanes.
OR:
combines two source bitplanes to form a single
destination bitplane.
AND:
takes commonparts of 2 source bitplanes and
integrates into a destination bitplane.
XOR:
excludes common parts of 2 sources bitplanes
and combines remainder of 2 source bitplanes
into destination bitplane.
both bitplanesfrom entire imageand
puts rest of imageinto destinationbitplane.
NOR:
excludes
NAND:
excludes commonparts of 2 sourcebitplanes
NXOR:
combinescommonparts of 2 sourcebitplanes
with remainderof imageand puts combined
bitplanesinto destinationbitplane.
MINUS:
takes the part of Source #1 that is not in
Source #2, and puts it into destination bitplane.
This function is useful for removing overlap
from 2 bitplanes.
from commonimageand placesremainderof
imageinto destinationbitplane.
Boundary Fill
This functionsmoothesthe object boundaryin the selectedbitplaneby
expandingand shrinkingthe objects. The resultingobjectshave shapes
similarto the originalobjects.This functionis definedas dilationwith a
squarekernelfollowedby erosionwith a cross kernel. It is normallyused
to substantiatethe boundariesbeforeinverting.
Border Eliminate
This functioneliminatesall objectson the chosen bitplane that touch
edge of image processing frame.
A1-1
Chord Size
This functioneliminatesobjectsthat cannotcompletelycover a specified
test box of X by Y size. It is usefulto eliminateelongatedthin objects
such as scratches.Do not use this functionon grain boundariesas thin
boundarieswill disappear.An objectthat does not coverthe wholetest
box can be transferredto anotherbitplaneor discarded(to none).See
Trap also.
Clear
This functionerasesselectedbitplanepixelsin the entire image
Clear Outside Frame
This functionerasesselectedbitplanepixelsoutsidethe ProcessFrame.
Close
This is dilation followed by erosion. Both operations will be done with
same kernel and same number of cycles. You can select number of
cycles. Kernel choices include square, hexagon, octagon, horizontal,
vertical, and cross. This function is used to fill holes or connect particles
in a phase without significantly losing the original shape.
Convex Hull
This functionroundsoff edgesand fills in crevicesat edge of particles.It
can dilate any concaveobject until it becomesconvex(turninga C into a
circle).
Copy
This functioncopiesthe selectedsourcebitplaneinto anotherbitplane
Does not alter informationin sourcebitplane.The sourcebitplaneis
turnedoff and destinationbitplaneis turnedon at end of operation.
Delta Convex Hull
This functionsendsthe changesof the selectedbitplane(addedpixels)
from convex hull to selected bitplane. This is the difference from original
image (before convex hull) and the image after applying convex hull.
MA861000.4.0'
A1-2
:)
- ~,
2/4IW
Delta Dilate
This functionsends the changesof the selectedbitplane(addedpixels)
from dilate to selectedbitplane.This is differencefrom originalimage
(beforedilate)and imageafter applyingDilate.
Delta Erode
This functionsends the changesof the selectedbitplane(subtracted
pixels) from erode to selected bitplane. This is difference from original
image (before erode) and image after applying Erode.
Delta Prune
This functionsends changesof the selectedbitplane(subtractedpixels)
from pruneto selectedbitplane.This is differencefrom originalimage
(beforeprune)and imageafter applyingPrune.
Delta Thicken
This functionsends changesof the selectedbitplane(addedpixels)from
thickento selectedbitplane.This is differencefrom originalimage(before
thicken)and imageafter applyingThicken.
Delta Thin
This functionsends changesof the selectedbitplane(subtractedpixels)
from thin to selectedbitplane.This is differencefrom originalimage
(beforethin) and imageafter applyingThin.
Dilate
This function grows objects with the chosenkernel(square,cross,
octagon,hexagon,horizontal,or vertical) by adding a layer to the objects.
Erode
This functionshrinksobjectswith the chosenkernel(square,cross,
octagon,hexagon,horizontal,or vertical)by peelinga layer off the
objects.
MAB61000.4.0
A1-3
{,j."
-
2!4tfJO
Fill
This function fills holes (undetected areas) that are totally enclosed by the
detected bitplane
Feature Size Transfer
Feature Size Transfer performs feature separation (sorting) based on a
chosen characteristic (shape, length etc.). You can send particles that
meet characteristic criteria to any bitplane. You also have the ability to
undertake single specification (>5 microns) or multiple (>5 and <2). For
multiple you can select from AND and OR. For specification you can
choose>, <, =, ~,?. The calculate limits button computes highest and
lowest value for the chosen characteristic in the selected bitplane.
Intersect Transfer
This functiontransfersany object in source bitplanewhich overlapsor
crossesany objecton the intersectorbitplaneto a destinationbitplane.
The entire object is transferrednotjust the portionwhich
overlaps/crosses.The transferredobjectsare eliminatedfrom the source
bitplane.The intersectorbitplaneis not affected.All three bitplanesare
still on at the end of the operation.
Invert
This functioninvertsthe source bitplane. Every pixel that was on is
turnedoff and vice versa.
Open
This function is erosion followed by dilation with the same kernel and the
same number of cycles for each operation. Open generally srnoothes the
contour of an object, breaks narrow "necks" between particles and
eliminates thin protrusions, as well as removing small features.
Prune
This functiontrimsshortthinlinesbya selectednumberof cycles.
Choosing "to end" will trim lines until triple points are reached. Any pixel
that has only 1 neighboring pixel is removed with each cycle. This
function only works after thinning. It is available for square and hexagon
kemels. The user selects the number of cycles or to end.
A1-4
MA861000.4. 0
2/4100
Radial Grid
This function generates a circular grid using selected bitplane. Grid, radial
dialog box allows user to type in number of circles and diameter lines to
form the grid. The maximum grid is 100 circles and 100 diameters.
Seed
This function finds the single line or point at the center of an object.
Sometimes objects like a dumbbell will have more than one seed point.
This function is available with square and hexagon kemels.
Separate
This functionautomaticallyseparatesobjectsthat touch each other.
Separatealgorithmlooksfor valleysor necks,which may connect
adjacentobjects.
Square Grid
This functiongeneratesan X by Y grid using selectedbitplane.The frame
optionwill put a borderaroundthe outsideof the imageor processframe.
The maximumgrid is 100 X 100.
Thicken
This functionadds layersof pixelsto the objects in the selectedbitplane
for the selectednumberof cycles. Unlikedilate,thickenwill not connect
objectsthat did not touch prior to applyingthe thickenfunction.You can
select numberof cyclesor to end. To end dilatesobjectsuntil 1 pixel is
left betweenobjects.Both squareand hexagonkernelsare available.
Thin
This functionremoveslayersof pixelson the objectsin the selected
bitplanefor the selectednumberof cycles. Unlikeerode,thin will not
removeobjectsbut ratherstopswhen the object is 1 pixelwide or
reducedto a point Squareand hexagonkernelsare available. The user
can select the numberof cycles or to end.
Trap
This functioneliminatesobjectsthat completelyfit insidea specifiedtest
box of X by Y size. Particlesthat do not fill the test box can be sent to
either anotherbitplaneor discarded(to none).
MAM1000-4.0
.
A1.o
c.. I
- ---2/4...00
Feature measurements
0 Degree Feret
This functionis the measurementof the horizontalferet. The angle is
measuredrelativeto the positiveX axis as seen on the monitorscreen
that is in horizontalposition.The result is providedas a numberin the
chosenunitsof measurement
45 Degree Feret
This function is the measurement of the diagonal feret. The angle
between the feret and positive X-axis is 45 degrees. The result is
provided as a number in the chosen units of measurement.
90 Degree Feret
This function is the measurement of the vertical feret. The angle between
the feret and positive X-axis is 90 degrees. The result is provided as a
number in the chosen units of measurement.
135 Degree Feret
This function is the measurement of the diagonal feret. The angle
between the feret and positive X-axis is 135 degrees. The result is
provided as a number in the chosen units of measurement.
Area
This functionmeasures the area of each individual object feature in a
particular bitplane. The result is provided as number in the chosen units
of measurement
Aspect Ratio
This function is the longest feret in a detected object divided by shortest
feret in the same object. This is the same as Length/Width. The result is
provided as a dimensionless number.
ASTM E-112 96
This functiongives the ASTM grain size number as defined by ASTM
specification E-112 96 for each individual grain. The result is provided as
a dimensionless number.
A1~
MA8610()().4:0
',-,.
2/41'00
AverageFeret
This functionis the averagemeasurementof all the ferets of an object.
The result is providedas a numberin the chosen units of measurement.
Breadth
This functionis also called Orthogonal feret that measures the feret
perpendicular to the angle of the longest feret (length). The result is
providedas a number in the chosen units of measurement
Circular Diameter
This function determines the equivalent circular diameter of each
individual object in a selected bitplane in the image. The area of the
object is measured first, and then an equivalent circle with the same area
is calculated. The diameter of this circle is the equivalent circular
diameter of the object. The result is provided as a number in the chosen
units of measurement.
Compactness
This function is defined as 4*pi * Area I (Convex perimeter2). The result is
providedas a dimensionless
number.
Convex Perimeter
This function is an approximation of the perimeter
of the particles that
have concave edges. Convex perimeter is a rubber band around all
ferets in a particle. The result is provided as a number in the chosen units
of measurement.
Density
This functionis also called .Photographic Density.. This is the
measurement of the average gray level values of all detected pixels in the
detected bitplane in the image divided by 255. If the image is completely
black, which means no light can come from it, the density of this image is
0%. If the image is completely white, which means all light can come from
it, the density of this image is 100%.
Length
This function gives the longest measured feret. The result is providedas
a number in the chosen units of measurement.
A1-7
Orientation
This functiongives the angle at which the longest feret occurs.This
function is used to give an angle of the particle relative to the X-axis on
the monitor screen. The result is provided in degrees.
Perimeter
It is the distancearound each individual feature or object. It gives the
perimeter for each particle. The result is provided as a number in the
chosen units of measurement.
Roughness
This functiongives the roughnessfor each object in the selectedb!tplane
in a rangeof 0 to 1.0. Roughnessis definedas the ratio of the convex
perimeter,which is a rubberbandaroundall feret, to the perimeter.If
there is no concaveat the edge of the particle,the roughnessof this
particleis 1.0. The result is providedas a dimensionlessnumber.
Spherical Diameter
Spherical diameter is defined as the (circular diameter * 1.22474). This
measurement gives the equivalent spherical diameter of each individual
object in a bitplane in the image. The result is provided as a number in
the chosen units of measurement.
Sphericity
This function measures the sphericity of each object in a selected
bitplane in a range of 0 to 1.0. Sphericity is defined as (4 * PI * area) I
(perirneter2). If the shape of the particle is a perfect circle, the sphericity
of this particle is 1. The more bumps a particle has, the lower sphericity
value. The result is provided as a dimensionless number.
String Length
This function is used to measure the actual (curved) length of objects that
are thin, curved and elongated. The result is provided as a number in the
chosen units of measurement.
A1-8
String Width
This functionis usedto measurethe actual (curved)width of objectsthat
are thin, curvedand elongated.The result is providedas a numberIn the
chosenunits of measurement.
Width
Width is the shortestof the measuredferet. It measuresthe minimum
feret diameterof each particlein a selectedbitplane.The result is
providedas a numberin the chosenunits of measurement.
X Centroid
This functiongives the CentroidX coordinatewith respectto the originof
the image or Guard Frame (if used).
Y Centroid
This functiongives the CentroidY coordinatewith respectto the originof
the imageor Guard Frame(if used).
'.1"A.10i8
MA861000-4.0
(~ ~"
2/4AJO
Field measurements
Anisotropy
This measurement is defined as the mean horizontal chord divided by the
mean vertical chord for all detected particles in the selected bitplane. The
result is a dimensionless ratio such as 1.6.
Area
This functiongives the total area of all objects or phases of interest for a
particular bitplane. The result is provided as a number in the chosen units
of measurement.
Area Percent
This measurementis definedas the area of a particularbitplanedivided
by the area of the field beingmeasured.The result is expressedas
percentagesuch as 45.3%.
ASTM E-112 96
This measurement gives the average ASTM grain size of the metal
microstructure using the average chord length as defined by ASTM
specification E-11296. The result is provided as a dimensionless number
such as 10.69.
Average Area
This measurement is the area of all the particles in the selected bitplane
divided by the total number of particles. It is the mean of feature area
measurement The result is expressed as a number in the chosen units
of measurement
Circular Diameter
This measurement gives the average equivalent circular diameter of all
the objects in a bitplane of an image. The average area of each object in
the field is measured first, and then an equivalent circle with the same
area is determined. The diameter of this circle is the equivalent circular
diameter of the object. The result is expressed as a number in the
chosen units of measurement.
Count
This measurement gives the total number of objects in the selected
bitplane within the measurement frame. The result is provided as a
dimensionless number such as 67.
A1-10
Note: Holes in particles must be filled before measurement or a miscount
may occur.
Density
This functionis also called"PhotographicDensity." This is the
measurementof the averagegray level valuesof all detectedpixels in the
detectedbitplanein the imagedividedby 255. If the image is completely
black,which meansno light can come from it, the densityof this imageis
0%. If the imageis completelywhite,which meansall light can come from
it, the densityof this imageis 100%.
Horizontal Intercept
This measurementgives the total numberof horizontalinterceptsof
horizontalscan lineswith the particlesin the selectedbitplane.The result
is expressedas a dimensionlessnumbersuch as 252.
Horizontal Mean Chord
This measurement determines the approximate width of the selected
objects.It is defined as the total horizontal chord lengths divided by the
total number of horizontal intercepts. The result is provided as a number
in the chosen units of measurement
Number/Area
This measurementis definedas the total numberof objectsdividedby
the total field area withinthe measuringframe. It determinesthe number
of objectsper unit area.When usingthis measurement,it is betterto use
large area unitsof measurement(i.e., millimetersor inches)ratherthan
small units (i.e., microns).If small units are selected,valuesfor this
measurement,such as 0.0013particfesper unit area can be the result.
The result is providedas a numberin the chosenunits of measurement.
Perimeter
This measurement determines the sum of the total individual object
perimeters (length of the edges around an object) in a particular bitplane.
The result is provided as a number in the chosen units of measurement.
Spherical Diameter
Sphericaldiameteris definedas the circular diameter,multipliedby
1.22474.This measurement gives the total equivalent spherical diameter
of all the objectsin a bitplane of an image. The result is provided as a
A1;.11
number in the chosen units of measurement.
Vertical Intercept
Verticalintercept gives the number of vertical intercepts of vertical lines
with the particles in the selected bitplane. The result is expressed as a
dimensionless number such as 577.
Vertical Mean Chord
This measurement determines the approximate height of the selected
objects. It is defined as the total vertical chord lengths divided by the total
number of vertical intercepts. The result is provided as a number in the
chosen units of measurement.
A1-12
Area Fraction Plane Measurement
This functionmeasures the area percentage of a particular bitplane
relative to the measurement of the total area of a reference bitplane. This
function allows the selection of a specific bitplane as the reference for
measuring the percentage. Although only 1 reference bitplane is chosen,
as many source bitplanes as required may be selected. In other words,
Area % = (source bitplane area)/(reference bitplane area) * 100%.
Results are always reported as a percentage.
Area Fraction Sample Measurement
This function measures the area percentage of a particular bitplane
relative to the measurement of total field area in the field of view or to the
Guard Frame, whichever is smaller. In other words, Area % = (source
bitplanearea)/(GuardFramearea) * 100%.Resultsare always reported
as a percentage.
Criteria Measurements
Criteriaallows the user to set limits for any of the measured data. The
user may set limits of less than, greater than, inside limits or outside
limits. This may be undertaken for Field, Feature, Area fraction Plane, or
Area fraction Sample. When Criteria Measurements are used, an Excel
file called fieldmap.csY is generated with a data column for any criteria
measure step. For Field and Area fraction Criteria the fieldmap.csY file
will indicate 1 for fields exceeding the set limits. For Feature Criteria the
fieldmap.csY file will show the number of features exceeding the set
limits.
MA861000-4.0
-.
--
A1t..13
--.
--
-.
\)"
2/4100