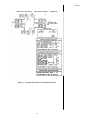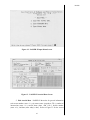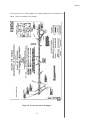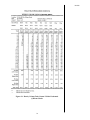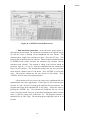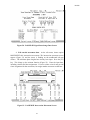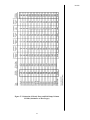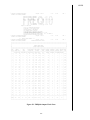
1
T EXAS T RANSPORTATION INSTITUTE
A Short Course
on Techniques for Determining
Construction Related Road User Costs
prepared by
TEXAS TRANSPORTATION INSTITUTE
THE TEXAS A&M UNIVERSITY SYSTEM
701 NORTH POST OAK, SUITE 430
HOUSTON, TEXAS 77024-3827
for
TEXAS DEPARTMENT OF TRANSPORTATION
March 1999
TABLE OF CONTENTS
Page
INTRODUCTION ...................................................................................................................................1
COURSE OVERVIEW ............................................................................................................................2
COURSE AGENDA.................................................................................................................................3
STEPS TO COMPLETE A USER COST STUDY....................................................................................4
STEP 1: DATA REQUIREMENTS................................................................................................................................4
STEP 2: SELECTION OF ANALYSIS TECHNIQUE..................................................................................................7
STEP 3: CONVERT TO USER COSTS.......................................................................................................................12
GENERAL COMMENTS ON ................................................................................................................ 17
SELECTED COMPUTER MODELS ...................................................................................................... 17
PASSER II-90..................................................................................................................................................................17
PASSER III ......................................................................................................................................................................29
FREQ...............................................................................................................................................................................34
SUMMARY.....................................................................................................................................................................35
EXAMPLE PROBLEMS ........................................................................................................................ 36
EXAMPLE 1: ROADWAY ON NEW LOCATION–US 281 ALICE RELIEF ROUTE ..........................................36
EXAMPLE 2: DETOUR ROUTING ANALYSIS USING TRAVEL TIME DIFFERENTIAL ................................40
EXAMPLE 3: INTERSECTION WIDENING (calculations by hand and using PASSER II)....................................41
EXAMPLE 4: WIDEN AND RECONSTRUCT URBAN ARTERIAL–US 90A FROM KIRBY TO I-610
(HARRIS COUNTY)......................................................................................................................................................53
EXAMPLE 5: BUILD SIX MAINLANES AND TWO 2-LANE FRONTAGE ROADS WHERE A
FOURLANE ARTERIAL NOW EXISTS–US 90A FROM SOUTH OF I-610 TO HIRAM CLARKE
(HARRIS
COUNTY) .......................................................................................................................................................................66
EXAMPLE 6: FREEWAY CONSTRUCTION USING FREQ10PC.........................................................................84
EXAMPLE 7: TEMPORARY DAILY LANE CLOSURE–FREEWAY WORK ZONE ON URBAN FREEWAY
..........................................................................................................................................................................................91
SUMMARY......................................................................................................................................... 107
REFERENCES..................................................................................................................................... 108
LIST OF TABLES
Page
Table 1. Adjustment Factor for Restricted Lane Width and Lateral Clearance ....................................... 10
Table 2. CPI and Value of Motorist Time–1985 to 1997........................................................................ 13
Table 3. Additional Daily Motorist Costs Due to the Delayed Completion of a Rural Highway
Project
from a Two-Lane Undivided Highway to a Four-Lane Divided Highway ............................. 15
Table 4. Summary of PASSER II-90 Input Data Requirements............................................................. 18
Table 5. Interchange Interior Travel Time and Overlap as a Function of Separation Distance
Between Intersection Stop Lines .......................................................................................... 30
Table 6. Summarized Traffic Volumes on a Segment of I-10 East Freeway .......................................... 86
LIST OF FIGURES
Page
Figure 1.
Figure 2.
Figure 3.
Figure 4.
Figure 5.
Figure 6.
Figure 7.
Figure 8.
Figure 9.
PASSERII-90 Phase Numbering System................................................................................ 19
Example of the LEART Animation Screen ............................................................................. 25
Assistant Function for Left Turn Movement .......................................................................... 27
Assistant Function for Through Movement............................................................................ 28
Phasing Code Descriptions Used by PASSER III................................................................... 31
Interchange Movements Required by PASSER III................................................................. 33
Layout of the Alice Relief Route in Jim Wells County ........................................................... 37
Detour Plan Bridge Beam Erection......................................................................................... 38
Existing and Proposed Geometrics and AM Peak Period Turning Movement Count
for FM 1111 and CR 99........................................................................................................ 43
Figure 10. Completed HCM Analysis of All-Way Stop Control Section ................................................ 45
Figure 11. PASSER II Main Menu Screen ............................................................................................ 46
Figure 12. PASSER II Input Menu Screen ............................................................................................ 47
Figure 13. PASSER II Arterial Data Screen .......................................................................................... 47
Figure 14. PASSER II Vehicle Movement Screen ................................................................................. 48
Figure 15. PASSER II Vehicle Movement Data Screen Completed for Example 3 ................................ 50
Figure 16. PASSER II Phasing Pattern Data Screen .............................................................................. 51
Figure 17. Phasing Pattern Data Screen Completed for Example 3........................................................ 51
Figure 18. PASSER II Output Menu Screen ......................................................................................... 52
Figure 19. PASSER II Measures of Effectiveness Screen for Example 3............................................... 52
Figure 20. Project Layout for Example 4............................................................................................... 54
Figure 21. Arterial and Intersection Layout for Example 4.................................................................... 55
Figure 22. Tube Count Locations.......................................................................................................... 57
Figure 23. PM Volumes for Example 4................................................................................................. 58
Figure 24. PASSER II Main Menu Screen ............................................................................................ 59
Figure 25. PASSER II Edit Menu.......................................................................................................... 60
Figure 26. PASSER II Arterial Edit Screen Completed for Example 4................................................... 60
Figure 27. PASSER II Vehicle Movement Data Screen ......................................................................... 61
Figure 28. PASSER II Vehicle Movement Screen Completed for Example 4 ........................................ 62
Figure 29. PASSER II Phasing Pattern Input Screen............................................................................. 63
Figure 30. PASSER II Phasing Pattern Screen Completed for Example 4 ............................................. 63
Figure 31. PASSER II Arterial Geometry Data Input Screen ................................................................. 64
LIST OF FIGURES
Page
Figure 32.
Figure 33.
Figure 34.
Figure 35.
Figure 36.
Figure 37.
Figure 38.
Figure 39.
Figure 40.
Figure 41.
Figure 42.
Figure 43.
Figure 44.
Figure 45.
Figure 46.
Figure 47.
Figure 48.
Figure 49.
Figure 50.
Figure 51.
Figure 52.
Figure 53.
Figure 54.
Figure 55.
Figure 56.
Figure 57.
Figure 58.
Figure 59.
PASSER II Output Menu Screen ......................................................................................... 65
PASSER II Measures of Effectiveness for Phase I, PM........................................................ 65
PASSER II Measures of Effectiveness for Post Construction............................................... 66
Layout of Tube Counts for Example 5 ................................................................................. 68
Hourly Volume Tube Counts-US 90A Eastbound @ Hiram Clarke ...................................... 70
Hourly Volume Tube Counts–US 90A Westbound @ Hiram Clarke .................................... 71
Willowbend Geometry and Turning Movements during Phase 1 and Post Construction ...... 72
PASSER II Edit Menu.......................................................................................................... 73
PASSER II Arterial Data Screen .......................................................................................... 74
PASSER II Turning Movement Data Input Screen............................................................... 75
PASSER II Data Input Screen Completed for Example 5..................................................... 76
PASSER II Phasing Pattern Data Entry Screen (not completed) ........................................... 77
PASSER II Phasing Pattern Data Entry Screen (completed) ................................................. 77
PASSER II Output Menu..................................................................................................... 78
PASSER II Arterial System Performance Output................................................................. 78
PASSER III Main Menu Screen ........................................................................................... 79
PASSER III Edit Menu Screen............................................................................................. 80
PASSER III Freeway Identification Data Input Screen......................................................... 80
PASSER III Signal Interchange Data Screen ........................................................................ 81
PASSER III Intersection Movement Screen ......................................................................... 81
PASSER III Assistant Function............................................................................................ 82
PASSER III Intersection Movement Screen Completed for Example 5 ................................ 82
PASSER III Output Menu.................................................................................................... 83
PASSER III General Signalization Information Output Screen ............................................ 83
Study Selection and Freeway Geometry............................................................................... 91
Estimation of Hourly Entry and Exit Ramp Volumes SH 288 (Southmore to MacGregor) .... 93
FREQ10 Output–Base Condition ......................................................................................... 99
FREQ10 Output–Work Zone ............................................................................................. 103
NOTES
INTRODUCTION
In 1987, the Houston District of the Texas Department of Transportation
(TxDOT) requested that the Texas Transportation Institute (TTI) evaluate the
impacts of the construction sequencing on a proposed reconstruction of the US
59 Southwest Freeway. The original intent of that work effort was to determine
any potential impacts of construction on three different freeway segments under
contract to three different contractors. There was concern as to what would
happen should the contractors not remain in the same construction phase/time
frames which could result in the use of difficult transitions between each
contractor’s area of work. The delays determined by the analysis (using hand
calculations and simulation models) were ultimately converted into road user
costs that were later used to support the specification of liquidated damage
assessed should a contractor fall behind the planned construction schedule. The
application of road user costs may not be necessary for all projects. The criteria
for the selection of projects requiring road user cost studies will be based upon a
policy currently under development.
Over the past 10 years, the staff of the TTI Houston office has
completed over 50 road user cost studies for the Houston District. These have
ranged from complicated freeway reconstruction projects requiring the use of
computer simulation models) to simpler projects where hand calculations were
used. In order to transfer the technology of completing these studies to TxDOT
on a state-wide basis, the Construction Division has contracted TTI to develop a
short course to provide instruction on the techniques of determining the
construction related road user costs for various types of projects in a consistent
manner throughout the State. This two-day course is a result of that effort.
1
NOTES
COURSE OVERVIEW
The purpose of this two-day short course is to provide TxDOT staff
with the expertise to complete road user cost studies for roadway construction
projects. Upon successful understanding of the material in this course, each
student will be able to:
1.
2.
Select the appropriate technique to prepare a road user cost
study for various construction projects.
Complete a user cost study which will be consistent with other
road user cost studies undertaken throughout the state.
This two-day course will briefly present a process to select the proper
techniques to complete a user cost study, the correct way to use either manual
methodologies or computer simulation tools to determine user delays, and how
to convert the user delays into a monetary value. The following course agenda
provides a general guideline for review of the course material and conduct of
the class. Students are encouraged to actively participate in the short
course by asking questions as necessary.
All class material was developed based upon the experience and
expertise of TTI staff in preparing a wide variety of user cost studies for the
Houston District. Even though the majority of the example problems are within
urban areas, the techniques can be applied to rural areas of the State as well.
The work efforts of several TTI staff are represented in this short course.
Primary authors of the course are Darrell W. Borchardt, P.E., and Anthony P.
Voigt, P.E.
2
NOTES
COURSE AGENDA
DAY 1
Session 1
Session 2
Introductions/Course Overview
Steps to Complete a User Cost Study
•
Data Requirements
•
Selection of Analysis Technique
•
Conversion to User Costs
LUNCH BREAK
Session 3
Example Problems
DAY 2
Session 3
Example Problems–Continued
LUNCH BREAK
Session 4
General Comments on Selected Computer Models
Session 5
General Discussion/Summary
NOTE: Other breaks will be scheduled throughout the day as necessary.
3
NOTES
STEPS TO COMPLETE A USER COST STUDY
There are three basic steps to complete a road user cost study (RUCS).
This session of the short course will provide an introduction and overview of
each of following steps.
Step 1: Data Requirements
•
Traffic Control Plan
•
Traffic Volume Data
•
Contract Time Determination
Step 2: Selection of Analysis Technique
•
Layout Overall Approach for Analyses
•
Traffic Model Selection
•
Determine Capacities
•
Determine Delays
Step 3: Conversion to User Costs
•
Value of Time
•
Amount to Specify as Liquidated Damages
•
Documentation
Each of these steps is critical for TxDOT staff to follow a consistent,
state-wide methodology for completing road user cost studies. Although each
analyst or project manager may approach each problem in their own unique
way, the overall methodology should be consistent. Consistency is very
important to assure valid estimations of user costs for all TxDOT roadway
construction projects.
STEP 1: DATA REQUIREMENTS
As with all traffic engineering projects, it is essential that adequate data
be made available to prepare a valid road user cost study. Three essential data
items typically needed for RUCS include a traffic control plan, traffic volume
data, time duration of phases and/or steps. It is also necessary to determine if a
RUCS is to be completed for each phase and/or step of a project or if only a
before and after study is to be completed. In most cases, the before/after
approach is acceptable. However, the more detailed approach may be needed
for special projects. This will be explained in greater detail in Step 2.
4
NOTES
Step 1A: Traffic Control Plan
A complete traffic control plan may not always be available at the time a
road user cost study is required to prepare the project for bidding. In fact, user
cost studies have been completed to evaluate certain concepts of proposed
construction sequencing to determine how to phase the construction before any
detailed traffic control plan development was completed. In most instances, a
set of traffic control plans at the 90-95% completion stage are sufficient to
prepare a valid RUCS for a proposed construction project. The plans should be
able to provide sufficient detailed information on the following items that are
necessary to estimate roadway capacity within the proposed project.
•
•
•
•
Existing project layout.
Layout of project sequencing.
Roadway lane information:
number of lanes;
lane widths;
lateral restrictions;
turn restrictions; and
special traffic control operations (if any).
Special Detours (e.g., total roadway closure):
times of detours; and
proposed detour routing.
Other unique considerations are adjacent traffic generation (e.g.,
shopping centers, sports venues, schools, etc.), time of year constraints, and
special events.
Some engineering judgement and assumptions may be necessary to
complete each study. The assumptions should be documented in the road user
cost analysis report.
Step 1B: Traffic Volume Data
The availability of traffic volume data is the most critical component of
completing a road user cost study. This may also be the most difficult portion
of the needed information to obtain. Current traffic data (hourly volumes, peak
period traffic counts, travel time studies, etc.) within the limits of the
construction project should be collected. It may also be necessary to obtain
traffic volume information on roadways outside the area of construction if road
closures and/or extensive detouring is expected. Advantages of being able to
collect updated volume information include: 1) the information can be used by
5
NOTES
the construction office to evaluate any proposed lane closure strategies
throughout the project; and 2) to retime any traffic signals in the work area. The
analysis technique selected will determine the type and amount of data that is
needed. In most cases, either turning movement counts (in the case of
signalized intersections) or freeway mainlane and/or ramp counts are required.
These analyses cannot be adequately completed without the necessary traffic
volume information. As the road user costs analyses are typically completed
near the end of the design process, it is important that steps are taken to obtain
the required data. The importance of having current and accurate traffic volume
data is critical to RUCS.
Step 1C: Contract Time Determination
The determination of the expected contract time is a component that can
be very useful in road user cost studies. If the time required to complete each
phase/step is known, a prorated average road user cost can be determined and
applied evenly throughout the job.
STEP 2: SELECTION OF ANALYSIS TECHNIQUE
The second step in completing a road user cost study is to select the
most appropriate technique to estimate the roadway delays. In many cases, this
step is completed in conjunction with the collection of the traffic data (Step 1B).
The availability of a traffic control plan and/or traffic volume data can influence
which technique is used for the study.
Step 2A: Layout Overall Approach for Analysis
Before determining the actual delays associated with the construction, an
overall approach or “plan of attack” should be outlined. There are two levels of
effort at which the user cost studies can be completed. The first is very detailed
and requires that roadway delays are estimated for each phase/step of a
construction project. This is especially useful for complicated projects,
rehabilitation projects in which there is no change in roadway capacity after the
construction is complete, projects in areas of high traffic demands, or a project
in which the existing capacity of the roadway is significantly reduced during the
construction. This approach can be applied to situations in which there is a
critical phase of a project. The advantage of this approach is that a more
detailed traffic operations analysis is completed resulting in a more realistic
estimation of road user costs. In addition, a comprehensive review of the traffic
conditions that may be expected during each phase can be evaluated. In more
high profile projects that are accompanied by public information campaigns,
6
NOTES
knowledge of the expected travel conditions can be a valuable aid in informing
the public of the importance of finding an alternate route. Disadvantages of this
approach are that it may require more time and effort to evaluate each phase,
and it will typically require a significant amount of traffic volume data.
The second approach is a comparison of the existing traffic conditions
to the traffic conditions expected after the project is completed: a “before and
after” comparison. In many cases, the amount of traffic data required is no
different than when completing the more detailed phase-by-phase analysis.
However, the amount of time required to complete the analysis is much less.
This methodology can be used on all construction projects in which the capacity
of the roadway is increased.
There are no specific guidelines to assist in determining which approach
should be used. Either approach determines user costs which are incurred by
the traveling public due to the roadway construction. Using the second
approach (“before and after” comparison) can probably be used for most
roadway construction projects. In addition to evaluating the delay, that
approach will also illustrate the benefit the improved roadway will have on the
traveling public after all construction has been completed.
Step 2B: Traffic Model Selection
Working in conjunction with the analysis approach and the collection of
necessary traffic volume data, the correct traffic simulation model must be
selected and appropriately applied to the given construction project. Although
there are several methodologies and computer models which may be used for
most situations, it is important to complete these studies in a consistent manner
throughout the Department. In addition, road user cost studies may be
completed using hand calculations in some instances. However, most road user
cost studies will require the use of a computer simulation program. At the
present time, three traffic modeling programs are acceptable for use in roadway
construction projects. These are the FREQ10PC freeway simulation program
and the PASSER II and PASSER III (or PASSER 2000) traffic signal
optimization programs. Depending upon the specifics of the particular
construction project, none of these models may provide for the best choice and
the use of other techniques may be necessary. However, these instances are rare
and may require special consideration. Until the validity of other computer
programs for use in road user cost studies can be addressed, only the FREQ and
PASSER series of programs are recommended for use by TxDOT staff for these
studies.
7
NOTES
In some instances, the road user cost studies can be completed using
hand calculations. Some examples include detour routing of traffic due to road
closures or turn restrictions, evaluation of detour routes, and delay analyses of
all-way stop controlled intersections. The latter involves using techniques
included in The Highway Capacity Manual (1).
Many TxDOT projects impact signalized intersections within the
construction area. Although there are many traffic signal timing optimization/
simulation models available for use, it is recommended that the PASSER series
be utilized. These programs were developed by TTI for TxDOT and are
extensively used a nation-wide. Most District traffic engineering sections utilize
these models to time traffic signals; therefore, each District should have one or
more staff member(s) who is familiar with several of the PASSER models.
Specific uses of the models are as follows:
•
PASSER II
•
PASSER III
•
PASSER IV
-
isolated signalized intersections
interconnected arterial signal systems
isolated diamond interchanges
interconnected diamond interchanges
along a freeway frontage road
signalized arterials
diamond interchanges
three-level diamond interchanges
grid networks
-
There may be some projects in which the geometric and traffic control
exist so that the PASSER series of models may not adequately simulate the given
situation. In these rare cases, the evaluator may wish to use other signal timing
programs for that particular project. There are several computer models
available; two of the most popular are TRANSYT-7F and SYNCHRO.
TRANSYT-7F is presently available in an updated version (Release 8) for $500;
SYNCHRO was developed in the private sector and is very expensive–pricing
currently begins at $4,095 for agencies with up to 400 signals under their
jurisdiction. If the evaluator decides to use one of these two models or another
model, the results may not be consistent with these determined by the PASSER
series. Until these programs are evaluated for specific applicability to road user
cost studies, TxDOT staff should use the PASSER series of programs on all
construction projects involving roadways with signalized intersections.
Many construction projects in urban and rural districts are completed on
sections of freeways. In most cases, the freeway construction may impact the
traffic due to reduced capacity resulting from narrowed freeway lanes, the
8
NOTES
removal of shoulders, and a reduction in the distance from the travel lanes to
any lateral obstructions. The capacity of the freeway in these cases may be
estimated by the procedures which will be examined in Step 2C.
Several microcomputer programs can be utilized to simulate freeway
operations of a freeway under construction. The expertise within TxDOT for
evaluating freeway operations using the available models may be somewhat
limited when compared to that for signal operations. Many of these models
require an extensive amount of data collection to produce valid results and each
model also has its intended use. Based upon TTI’s past experience in
completing road user cost studies, it is recommended that the FREQ10PC model
be used to estimate delays for road user cost studies on freeways.
The FREQ10PC model is particulary applicable in cases where the
freeway capacity is reduced by narrowing of lanes or a lane is completely
removed. The model also has the capability to evaluate lane closures during
specific time periods. Although the FREQ series of computer programs was
developed by the University of California at Berkeley, TxDOT provided funding
for the development of Release T91. The FREQ10PC model provides detail
operational information for the freeway on a sectional basis and can evaluate the
roadway for an entire 24-hour time period.
There may be some construction projects (especially in the urban
environment) in which the FREQ10PC model may not effectively model
freeway operations. An example of this is a project in which several freeways
are impacted by detours from a roadway under construction; primarily in the
downtown area of a large city. In this case, the CORFLO freeway modeling
program is recommended. The evaluator could also opt to use the Traffic
Software Integrated System (TSIS) which allows the user to simulate freeways,
surface streets, and two-lane roadways within the same software package. The
data requirements of CORFLO and TSIS are quite intensive and each requires
the setting up of a network in a link-node fashion. These models should be
used for special cases of very complicated construction activities in urban areas.
By correctly applying traffic models documented above, the evaluator
should have adequate resources to determine the delays associated with a
majority of road user cost studies. However, there may be some projects in
which other methodologies may be more appropriate. An example of this is a
toll facility in which the value of lost revenue due to delayed completion of a
project could be considered in the estimation of liquidated damages. For the
vast majority of TxDOT construction projects, the FREQ10PC, PASSER II/III
models, hand calculations, or a combination of these will be sufficient to
9
NOTES
complete the road user cost studies. In special instances, the evaluator should
use other accepted techniques as necessary.
Step 2C: Capacity Determination
Although some of the computer traffic models complete the capacity
calculations internally (based upon user supplied inputs such as lane widths,
lateral obstructions, traffic mix, etc.), there may be some instances where the
user must determine the actual roadway capacity. Or, the user may also be
required to provide the model with a “capacity reduction factor” for a specific
situation. Just about any accepted standard practice may be used for
determining the capacity of a given roadway. However, to provide for
consistency among road user cost studies, it is highly recommended that the
procedures documented in HCM (1) be used. Users may also use the Highway
Capacity Software (HCS), which is a “computerized” version of the HCM. As
long as the users are consistent in the determination of the capacities, the use of
most any method is valid. The estimation procedures should be well
documented and kept as part of the project file.
As one becomes more familiar with completing road user cost studies
(and reviewing traffic control plans), it will become more obvious that during
most situations the capacity of the roadway is normally restricted due to lane
width reductions and the placement of concrete barriers in close proximity to the
travel lane. Table 3-2 of the HCM (Table 1) can be utilized to approximate a
capacity adjustment factor. Although primarily designed for use on freeways,
the adjustment factor can be used to estimate the reduction in capacity of lanes
on arterial streets. This will provide for a consistent methodology for
determining the roadway capacity in various steps of a construction project.
Capacities for all-way stop control or two-way stop control can also be
calculated using procedures in HCM.
Table 1. Adjustment Factor for Restricted Lane Width
and Lateral Clearance
Distance From
Traveled Way
To
Obstruction*
(ft)
=6
4
2
0
Adjustment Factor
Obstructions on One Side
Obstruction on Two Sides
Lane Width* (ft)
= 12
11
10
= 12
11
10
1.00
0.99
0.97
0.92
0.95
0.94
0.92
0.88
0.90
0.89
0.88
0.84
1.00
0.98
0.95
0.86
0.95
0.93
0.90
0.82
0.90
0.88
0.86
0.78
*Interpolation may be used for lane width or distance from traveled way to obstruction.
Source:
Table
3-2
of
10
Reference
(1).
NOTES
A brief example to determine the roadway capacity due to the narrowing
of freeway lanes is as follows:
•
•
•
•
two freeway lanes;
narrowed to 11 foot in width and no inside shoulder;
base capacity = 2,000 vph/lane; and
adjustment factor = 0.88 (from Table 1).
Roadway Capacity = (2,000 vph/lane x 0.88 x 2 lanes) = 3,520 vph.
Step 2D: Determine Delays
The next step is to determine the delays resulting from the construction
activities. In Step 2A, the user needed to develop an overall approach or “plan
of attack”, primarily to decide if a user cost was to be completed for each phase
of the construction project or completed using a more simplistic “before and
after” comparison.
In the case of the evaluator completing a very detailed phase-by-phase
analysis, it is necessary to estimate the delays for each phase/step using the
selected model. In addition, an estimate of the amount of time necessary to
complete the construction activities on each phase is required to determine a
prorated road user cost. The actual delay relating to each phase/step is
determined by subtracting the delays after construction from those determined
for each phase during construction. This is illustrated by the examples below.
Post-Construction Delay: 100 vehicle-hours/day
Phase 1 (6 months): 147 vehicle-hours/day
Phase 2 (3 months): 186 vehicle-hours/day
Phase 3 (3 months): 126 vehicle-hours/day
Construction delay for each phase:
Phase 1: 147 vehicle-hours - 100 vehicle-hours = 47 vehicle-hours/day
Phase 2: 186 vehicle-hours - 100 vehicle-hours = 86 vehicle-hours/day
Phase 3: 126 vehicle-hours - 100 vehicle-hours = 26 vehicle-hours/day
Prorated (average) construction delay:
Average: [(47x6) + (86x3) + (26x3)] ÷ 12 months = 52 vehicle-hours/day
11
NOTES
If phase specific user costs are desired, the delays calculated above can
be used as the basis for incurring liquidated damages for milestone completions
of each (or selected) phases. However, should only an overall project
completion be of concern, the averaging technique presented above should be
used.
A second methodology can be used based upon a “before and after”
comparison. This can apply to the majority of projects where the completion of
the project is important, but in cases in which no specific phase is critical to
normal traffic operations. Continuing with the same example, if the existing
delays on the roadway (post-construction) are estimated at 120 vehicle-hours per
day. The delay incurred on motorists due to not completing the project on time
are estimated as:
Delay = 120 vehicle-hours - 100 vehicle-hours = 20 vehicle-hours/day
Although the user delays determined by each methodology differ by
approximately forty vehicle-hours, both values are determined using valid
methodologies. Each District may wish to determine which methodology is
most appropriate for the majority of its projects and use only that method. In
most cases, the “before and after” delay analysis is sufficient. However, this
decision should be made on an individual project basis.
STEP 3: CONVERT TO USER COSTS
The third step involves converting the vehicle delays into a monetary
value, and specifying the amount of the actual user costs to include in the
construction contract as liquidated damages. In order to determine the monetary
value, the current value of time must be known.
Step 3A: Value of Time
The basis for determining the current value of time is a 1985 Texas
Transportation Institute report, The Values of Travel Time: New Estimates
Developed Using a Speed Choice Model (2). This study derived the value of
time employing a speed choice model that assumes a rational driver chooses a
travel speed to minimize total driving costs. Total driving costs include value of
time, vehicle operating costs, accident costs, and traffic violation costs. The
study recommends the following values of time (in 1985 dollars):
12
NOTES
•
•
Drivers–$8.03 per person-hour; and
Passenger Car - $10.04 per vehicle-hour (assumes 1.25 persons
per vehicle).
The value of time is adjusted to current values by using the Consumer Price
Index (CPI). Table 2 illustrates the CPI and value of time from 1985 to 1997.
Current CPI values may be obtained from the Wall Street Journal or other
economic publications. Although the CPI is updated on a monthly basis, the
changes are usually so small that Table 2 need only be updated on a semi-annual
basis. As this study was completed in the mid 1980s, there have been some
discussions to update the current value of time using more recent data than just
the CPI. With the advent of cellular telephones, pagers, telecommuting, and
“just-in-time” delivery, the value of a motorists time has become a very complex
issue. Until the study is updated, the value of time as referred by Table 2 of this
report should be used.
Table 2. CPI and Value of Motorist Time–1985 to 1997
Year
1985
1986
1987
1988
1989
1990
1991
1992
1993
1994
1995
1996
1997
Notes:
Value of Time
CPI1
Drivers2
$ 8.03
$ 8.24
$ 8.48
$ 8.82
$ 9.26
$ 9.76
$10.17
$10.47
$10.78
$11.06
$11.37
$11.71
$11.98
222.2
228.4
240.4
118.2 4
124.0 4
130.7 4
136.2 4
140.3 4
144.5 4
148.2 4
152.4 4
156.9 4
159.9 4
Passenger Cars2,3
$10.04
$10.30
$10.60
$11.03
$11.58
$12.20
$12.71
$13.09
$13.48
$13.83
$14.22
$14.64
$14.97
1
CPI values are annual percentages.
Costs represent only value of time.
3
Passenger car cost based on drivers value of time x vehicle occupancy rate of
1.25.
4
CPI base was changed in 1988. A multiplication of 2.995566 must be used
with CPI published after 1988.
2
Source: Reference (2).
TTI staff typically uses the most current value of time for “passenger
cars” to determine the total construction related road user costs. Should
additional information concerning vehicle occupancy be available, that for
13
NOTES
“drivers” should be used and multiplied by the average number of persons per
vehicle to obtain a more realistic estimate. The user costs is then determined by
multiplying the delay by the current value of time as illustrated by the previous
example user cost results presented as follows.
For the example in which a phase-by-phase analysis was completed, the
road user costs for each phase are estimated as:
Phase 1 Costs: 47 vehicle-hours/day x $14.97/vehicle-hour = $704/day
Phase 2 Costs: 86 vehicle-hours/day x $14.97/vehicle-hour = $1,287/day
Phase 3 Costs: 26 vehicle-hours/day x $14.97/vehicle-hour = $389/day
Using the prorated (or average) delay values, the user costs are estimated
at:
Average Costs: 52 vehicle-hours/day x $14.97/vehicle-hour = $778/day
Finally, the road user cost based upon a “before and after” comparison
results in the following:
User Costs: 20 vehicle-hours/day x $14.97/vehicle-hour = $300/day.
If a large portion of the traffic volume consists of heavy trucks, the
evaluator may wish to determine a value of time which will account for the
higher operating costs of commercial vehicles. Using a value of time for
passenger cars results in a more conservative estimate of user costs.
While individualized road user cost studies are necessary for many
projects, other projects may be able to determine the road user cost from a predetermined set of values based on capacity reduction and AADT. These types
of “standardized” tables can be especially useful in highway projects where the
reduction in capacity is the only variable. While road user costs for typical
highway projects can be generated by examining these tables, these values only
represent a magnitude of additional motorist costs associated with a project. The
appropriate computer program should be used with project-specific data to
estimate the additional motorist cost for a specific project.
Standard-type tables usually generate a road user cost for a daily delay,
but, for example, if a project only reduces capacity at night when volumes are
low, the road user cost will obviously be different from the project which
reduces capacity 24 hours. Table 3 presents an example of a table created to
estimate the road user cost for the delayed completion of a rural highway project
14
NOTES
from a two-lane undivided to a four-lane divided facility. This table is taken
from TTI Research Report 1310-F Comparison of Contracting Strategies for
Reducing Project Construction Time (3). Several tables were produced in this
report for different freeway configurations and lane closures. The tables in TTI
Report 1310-F are likely to be reevaluated and updated and should not be used
for future road user cost projects as these were developed for illustration
purposes only. In the example of Table 3, the estimated road user cost is
dependent on the percentage of truck traffic and AADT. The tables as presented
in the referenced report were developed for illustrative purposes only and are
not intended to be directly applied to specific construction projects.
Table 3. Additional Daily Motorist Costs Due to the Delayed Completion
of a Rural Highway Project from a Two-Lane Undivided Highway
to a Four-Lane Divided Highway
AADT
5000
10000
15000
20000
25000
30000
Additional Daily Motorist Costs ($/day)
5% Trucks
10% Trucks
20% Trucks
0
100
100
200
200
300
300
400
500
600
700
1000
1000
1200
1500
1600
1900
2400
Source: Reference (3).
Step 3B: Amount to Specify as Liquidated Damages
The next step is to specify an amount in the construction contract as the
liquidated damages to be incurred by the selected contractor for not completing
project deadlines. This liquidated damage is a sum of TxDOT engineering costs
(i.e., costs to pay for TxDOT staff to monitor and administer the project) and a
portion (or all) of the estimated road user costs. A previous study by TTI
recommended that 25 percent of the motorists costs be included in liquidated
damages (3). This reduction of the estimated road user costs by 75 percent
provides for a very conservative use of the actual delays incurred on the public
by delayed completion of the project.
Step 3C: Documentation
The final step (which should ideally be completed concurrently while
completing the user cost study) is to provide sufficient documentation in the
project file concerning the study. This is critical to provide consistency among
user cost studies, as well as to satisfy any legal issues about the validity of the
study. If a dispute arises between TxDOT and a contractor, the most likely point
15
NOTES
of contention may be on time extensions related to the construction, but proper
documentation is needed in case the contractor challenges the actual user cost
delays used to determine the liquidated damages. The information which should
be retained in the project file for documentation typically contains the following:
a.
b.
c.
d.
e.
Traffic Data Sources;
Modeling Approach;
Delay Calculations;
CPI and Value of Time Update; and
Project Specific Items.
16
NOTES
GENERAL COMMENTS ON
SELECTED COMPUTER MODELS
This portion of the manual provides for a brief introduction to the
computer models used in the following examples. It is not intended to instruct
in detail on all the uses of each model, but to provide a brief overview of each
model. In completing user cost studies, the models are used to aid in estimating
motorist delay only, and not to (for example) determine and implement traffic
signal timings in the field. Using consistent assumptions throughout all user cost
studies in each model will simplify the modeling process.
The following traffic simulation models are highlighted in this session.
Traffic Simulation Models
PASSER II-90
PASSER III
FREQ
Traffic signal optimization programs which may be used
for construction projects on arterials.
Freeway models which may be used for urban and rural
rehabilitation and construction projects.
PASSER II-90
Application: Isolated Signalized Intersections and Arterial Signal Systems.
PASSER (Progression Analysis and Signal System Evaluation Routine)
II can analyze both individual signalized intersections and progression
operations along arterial streets. The program can simulate existing timings or
optimize signal timings based on a wide range of user defined options. A
unique feature of PASSER II is that it can optimize signal phasing. The latest
edition, PASSER II-90 was preceded by three other versions: PASSER II-80,
PASSER II-84, and PASSER II-87. A Windows-based version (PASSER II-99)
is currently under development and testing. PASSER II-90 was designed for
analyzing intersections with or without separate left turn lanes and protected left
turn phases. PASSER II-90 is popular because of the ability to select
intersection phasing to maximize arterial progression. The program varies the
signal phasing sequences and offsets at each intersection concurrently (with
needed speed or cycle length changes) to find the optimal timing plan that
maximizes the progression bands while minimizing total arterial system delay.
Table 4 summarizes the input data requirements for PASSER II-90 (4).
17
NOTES
Table 4. Summary of PASSER II-90 Input Data Requirements
Major Data Category
Network Data
Input Data Type
Intersection
Street Names
Intersection Spacing
Source of Information
Maps, Drawings,
Arterial Photographs,
Field Measurements
Speed Data
Posted Speed Limit
85th Percentile Speeds
Field Study
Volume Data
Total Traffic Volumes
Turning Movement Counts
Field Study
Timing Data
Left Turn Treatment
Permissive Phase Sequence
Number of Phases
Minimum Phase Times
Existing Cycle Length (optional)
Existing Phase Sequence (optional)
Existing Splits (optional)
Existing Offset (optional)
Timing Plan
Field Study
Control Data
Program Control Options
Embedded Parameters
Bandwidth Weighting
Queue Clearance Time
User Specified Values
There are eight basic signal timing parameters and other parameters to
watch with respect to simulation and optimization with PASSER II-90: Cycle
Length, Phase Designation, Phase Sequence, Left Turn Treatment, Interval and
Phase Length, Coordination Offset, Embedded Data, and Phaser Data.
Cycle Length
PASSER II-90 assumes that all intersections operate on a common
background cycle length. Double cycling is not allowed (if necessary,
TRANSYT or SYNCHRO can handle double cycling). The model can select the
best cycle length for progression, or develop a timing plan for a given cycle
length. Several optimization computer runs may be needed before a final
solution is obtained. Engineering judgment is necessary to avoid excessive sidestreet queues, link oversaturation, and wasted green time. PASSER II-90
calculates a “maximin cycle length” or the maximum of the minimum-delay
cycle lengths for each intersection. It is recommended that the cycle length be
restricted to within 10 seconds of the maximin cycle length. This will insure that
the optimal arterial progression settings are used, knowing that arterial system
delay will be near the minimum value.
Phase Designation
18
NOTES
PASSER II-90 uses the basic NEMA eight phase system as defined in the
Traffic Control Systems Handbook. Phases 1, 2, 5, and 6 serve the traffic
movements along the arterial where progression is desired. Phases 3, 4, 7, and 8
serve the cross street phases. Protected lefts are given odd phase numbers,
through and right turn phases are given even numbers. In PASSER II-90,
movements 2 and 5 move in the “A” direction and 1 and 6 travel in the “B”
direction (Figure 1). The input data should also include minimum phase lengths
to satisfy pedestrian movements, if required.
Figure 1. PASSERII-90 Phase Numbering System
Phase Sequence
Phase sequence is the order signal phases are displayed during a cycle.
Two to six phases make up a typical cycle, depending on how the left turns are
treated. PASSER II-90 will automatically select the best phase sequence
combination, with or without overlaps, to maximize the progression bandwidth.
PASSER II-90 can evaluate up to four phase sequences for the main arterial
while only one phase sequence is allowed for the cross street.
19
NOTES
Left Turn Treatment
The optimal signal timing at an intersection with permissive left turns is
a complex issue. To determine phase time, the capacity must be estimated, but
capacity is dependent on phase times. A thorough solution requires many
iterations, but PASSER II-90 only computes one pass through this process. The
phase times based on permissive left turn capacities may not be accurate. The
user should concentrate on output at intersections with permissive left turns and
compensate with adjusted minimum phase green times if necessary.
Six left turn treatments are available for analysis in PASSER II.
Protected, permitted, and protected/permitted (combined) operations, each with
or without left turn bays, is available. Procedures for selecting each option are
discussed as follows (4).
Summary of Operating Procedures
Alternative left turn treatments have very profound effects on the overall
traffic operations. To obtain the needed solutions, the user must select the most
appropriate traffic signal timing solutions among the possible alternatives by
providing the options to be analyzed. The following section describes the
detailed operating procedure for users to switch among different left turn
treatments.
Changing Left Turn Treatment to Permitted Without Bays
3.
4.
5.
6.
7.
8.
9.
10.
11.
12.
Press the <ESC> key to return to the Main Menu.
Type <3> to edit the data in the Main Menu.
Type <2> to edit the intersection movement data in the Edit Menu. The
movement input screen should appear with the cursor at the data entry
field for the NEMA 5 movement.
Move to the volume field for the desired left turn movement and press
[F2] until the “NO-BAY” in the lower right-hand corner is highlighted.
Type <0> (zero) for the volume.
Move to the data entry field for the minimum phase time and type <0>
(zero).
Return to the left turn volume field and enter the previous volume or
another desired volume.
Press the [F3] key. This will activate the ASSISTANT window.
Enter the traffic volume.
Press <ENTER> to retain the specified volume or enter another volume
and press <ENTER>.
20
NOTES
13.
14.
15.
16.
Press <ENTER> to retain the specified peak hour factor or enter another
peak hour factor and press <ENTER>.
Press <ENTER> if the displayed volume is the correct volume or enter
the desired volume.
Press <ENTER> and the cursor will appear in the volume field along
with the specified volume. A value, “[1]”, should be present in the
brackets next to the left turn volume.
Other left turn movements may be changed by following steps four
through thirteen.
Changing Left Turn Treatment to Protected Without Bays
1.
2.
3.
4.
5.
6.
7.
8.
9.
10.
11.
Press the <ESC> key to return to the Main Menu.
Type <3> to edit the data in the Main Menu.
Type <2> to edit the intersection movement data in the Edit Menu. The
movement input screen should appear with the cursor at the data entry
field for the NEMA 5 movement.
Move to the volume field for the desired left turn movement and press
[F2] until the “NO-BAY” in the lower right-hand corner is highlighted.
With a non-zero value of the Minimum Phase Time coded, press the
[F3] key. This will activate the ASSISTANT window with the question,
“Left Turn Protected Only?” appearing in the upper left-hand corner.
Type <Y>.
Press <ENTER> to retain the specified volume or enter another volume
and press <ENTER>.
Press <ENTER> to retain the specified peak hour factor or enter another
peak hour factor and press <ENTER>.
Press <ENTER> if the displayed volume is the correct volume or enter
the desired volume.
Press <ENTER> and the cursor will appear in the volume field along
with the specified volume. A value, “[2]”, should be present in the
brackets next to the left turn volume.
Other left turn movements may be changed by following steps four
through ten.
Changing Left Turn Treatment to Protected/Permitted Without
Bays
1.
2.
Press the <ESC> key to return to the Main Menu.
Type <3> to edit the data in the Main Menu.
21
NOTES
3.
4.
5.
6.
7.
8.
9.
10.
11.
Type <2> to edit the intersection movement data in the Edit Menu. The
movement input screen should appear with the cursor at the data entry
field for the NEMA 5 movement.
Move to the volume field for the desired left turn movement and press
[F2] until the “NO-BAY” in the lower right-hand corner is highlighted.
With a non-zero value of the Minimum Phase Time coded, press the
[F3] key. This will activate the ASSISTANT window with the question,
“Left Turn Protected Only?” appearing in the upper left-hand corner.
Type <N>. This will cause the left turn analysis to default to the
protected/permitted (“combined) phase.
Press <ENTER> to retain the specified volume or enter another volume
and press <ENTER>.
Press <ENTER> to retain the specified peak hour factor or enter another
peak hour factor and press <ENTER>.
Press <ENTER> if the displayed volume is the correct volume or enter
the desired volume.
Press <ENTER> and the cursor will appear in the volume field along
with the specified volume. A value, “[3]”, should be present in the
brackets next to the left turn volume.
Other left turn movements may be changed by following steps four
through ten.
Changing Left Turn Treatment to Permitted With Bays
1.
2.
3.
4.
5.
6.
7.
8.
9.
10.
11.
Press the <ESC> key to return to the Main Menu.
Type <3> to edit the data in the Main Menu.
Type <2> to edit the intersection movement data in the Edit Menu. The
movement input screen should appear with the cursor at the data entry
field for the NEMA 5 movement.
Move to the volume field for the desired left turn movement and press
[F2] until the “BAY” in the lower right-hand corner is highlighted.
Type <0> (zero) for the volume.
Move to the data entry field for the minimum phase time and type <0>
(zero).
Return to the left turn volume field and enter the previous volume or
another desired volume.
Press the [F3] key. This will activate the ASSISTANT window.
Enter the traffic volume.
Press <ENTER> to retain the specified volume or enter another volume
and press <ENTER>.
Press <ENTER> to retain the specified peak hour factor or enter another
peak hour factor and press <ENTER>.
22
NOTES
12.
13.
14.
Press <ENTER> if the displayed volume is the correct volume or enter
the desired volume.
Press <ENTER> and the cursor will appear in the volume field along
with the specified volume. A value, “[4]”, should be present in the
brackets next to the left turn volume.
Other left turn movements may be changed by following steps four
through thirteen.
Changing Left Turn Treatment to Protected With Bays
1.
2.
3.
4.
5.
6.
7.
8.
9.
10.
11.
Press the <ESC> key to return to the Main Menu.
Type <3> to edit the data in the Main Menu.
Type <2> to edit the intersection movement data in the Edit Menu. The
movement input screen should appear with the cursor at the data entry
field for the NEMA 5 movement.
Move to the volume field for the desired left turn movement and press
[F2] until the “BAY” in the lower right-hand corner is highlighted.
With a non-zero value of the Minimum Phase Time coded, press the
[F3] key. This will activate the ASSISTANT window with the question,
“Left Turn Protected Only?” appearing in the upper left-hand corner.
Type <Y>.
Press <ENTER> to retain the specified volume or enter another volume
and press <ENTER>.
Press <ENTER> to retain the specified peak hour factor or enter another
peak hour factor and press <ENTER>.
Press <ENTER> if the displayed volume is the correct volume or enter
the desired volume.
Press <ENTER> and the cursor will appear in the volume field along
with the specified volume. A value, “[5]”, should be present in the
brackets next to the left turn volume.
Other left turn movements may be changed by following steps four
through ten.
Changing Left Turn Treatment to Protected/Permitted With Bays
1.
2.
3.
4.
Press the <ESC> key to return to the Main Menu.
Type <3> to edit the data in the Main Menu.
Type <2> to edit the intersection movement data in the Edit Menu. The
movement input screen should appear with the cursor at the data entry
field for the NEMA 5 movement.
Move to the volume field for the desired left turn movement and press
[F2] until the “BAY” in the lower right-hand corner is highlighted.
23
NOTES
5.
6.
7.
8.
9.
10.
11.
With a non-zero value of the Minimum Phase Time coded, press the
[F3] key. This will activate the ASSISTANT window with the question,
“Left Turn Protected Only?” appearing in the upper left-hand corner.
Type <N>. This will cause the left turn analysis to default to the
protected/permitted (“combined) phase.
Press <ENTER> to retain the specified volume or enter another volume
and press <ENTER>.
Press <ENTER> to retain the specified peak hour factor or enter another
peak hour factor and press <ENTER>.
Press <ENTER> if the displayed volume is the correct volume or enter
the desired volume.
Press <ENTER> and the cursor will appear in the volume field along
with the specified volume. A value, “[6]”, should be present in the
brackets next to the left turn volume.
Other left turn movements may be changed by following steps four
through ten.
Interval and Phase Length
PASSER II-90 calculates phase lengths, not interval lengths to minimize
intersection delays. Both the minimum phase times and splits calculated or
specified by or to the model include change intervals. For existing timing
simulations, the green plus amber plus all-red should be set to the existing phase
length. Rough guidelines for minimum phase time are: a) no pedestrian factor,
absolute minimum is 6-10 seconds green plus change intervals; b) if pedestrians
are a factor, but no pedestrian crossing signals are present, the minimum phase
length should be equal to the pedestrian crossing time; and c) if pedestrian signal
are present, the minimum phase length should be set to at least equal to the walk
time (4 feet/second) plus the pedestrian clearance time.
Coordination Offset
This offset is the time from a system reference point to the cycle’s
beginning point for each signal controller in the system. PASSER II-90
calculates offsets for each signal in the progression system to maximize the
progression bandwidths for the arterial. These offsets can be visually checked
using the LEART simulation. One advantage of PASSER II is the ability to
simulate traffic operations using a dynamic animation. The dynamic arterial
animation system, LEART, allows users to examine traffic operations at one or
all arterial intersections simultaneously. Vehicles are shown as different colored
blocks depending on the traffic movement (left turn, right turn, through) and if
they are stopped at the intersection. Two performance measures are dynamically
24
NOTES
updated on the screen: PVG and DELAY. PVG is the percentage of total
vehicles passing through the intersection on a green indication and DELAY is
the average delay in seconds per vehicle when vehicles pass through the
intersection. Figure 2 shows an example of the LEART animation screen.
Figure 2. Example of the LEART Animation Screen
Embedded Data
These parameters are the study assumptions, calculation equations, and
evaluation criteria used by the program. Parameters such as pretimed or
actuated control, ideal saturation flow, analysis period, left turn sneakers, phase
lost time, unit of delay, level-of-service (LOS) delay criteria, and various model
coefficients can be changed to suit local conditions.
Phaser Data
The user can identify and define different offset reference systems to
implement the optimal timing plan.
25
NOTES
The program is divided into three main sections: Input, Edit, and
Output. The input menu contains paths to the regular data input, data for
phaser, and the embedded data. The edit menu allows the user to edit network
data, signal phase data, link geometry, and access to the intersection input screen
(where turning movements, saturation flows, and minimum green times are
input). The output menu allows users to access the solution evaluation menu,
and the animation program. A convenient feature of the data input screens for
intersection movements and saturation flows is the assistant function. The
assistant function prompts the user for various data and calculates flows and
saturation flow rates automatically. An example of the assistant screens for left
turns and through movements are shown in Figures 3 and 4.
Oversaturation during construction can easily occur when reducing
capacity by closing lanes, restricting turn movements, and re-routing of detoured
traffic. Volume to capacity (v/c) ratios in excess of 1.2 can cause error messages
in PASSER II-90. If a situation occurs where v/c ratios will exceed saturation
for any extended period of time, examine traffic control plans to determine if
additional detours or capacity can be implemented. Oversaturation may also
exaggerate delay values reported by PASSER II. Usually these type delay
numbers are obvious to pinpoint for seasoned PASSER II users. Check
estimated queue lengths and average vehicle delay to help determine
reasonableness of the reported delay numbers, especially in situations where
alternate routes exist.
PASSER II calculates almost all timing information needed for field
implementation. Webster’s method is used to calculate recommended cycle
lengths and green splits. Travel time is used to find optimal coordination offsets
maximizing progression bandwidths. Alternative signal phasing is analyzed to
optimize progression. Measures of effectiveness (MOEs) include arterial
progression efficiency and attainability, average speed through system, system
“maximin” cycle length, movement phase times, v/c ratios, delay
(second/vehicle), level of service, queues, stops, total intersection delays, and
minimum delay cycles. System measures of effectiveness include average
intersection delay, total system delay, total system fuel consumption, and total
system stops.
26
NOTES
Figure 3. Assistant Function for Left Turn Movement
27
NOTES
Figure 4. Assistant Function for Through Movement
28
NOTES
Application for Road User Cost Studies
PASSER II may be the easiest tool to simulate and optimize isolated
signalized intersections and arterial signal systems that is freely distributed
throughout TxDOT. This will likely be the traffic model used for construction
projects on arterials in both the rural and urban environments. The available
assistant functions provide an easy to use interface to calculate traffic volumes,
minimum green times, and saturation flow rates. MOE’s are easily identifiable
with the program output and are given on both an intersection and system basis.
Although the software is intended for use as an aid in evaluating and optimizing
traffic signal operations, the RUCS user should not get “bogged down” in signal
timing output, but should concentrate on determining the minimum delay cycle
length. The total system delay determined by the software is used in the road
user cost study. Additional details can be found in the PASSER II-90 User’s
Manual (4).
PASSER III
Application: Diamond Interchanges–Isolated or Systems.
PASSER III was developed by TTI for TxDOT to determine optimal
and evaluate signal timing plans at diamond interchanges. PASSER III analyzes
isolated diamond interchanges (with or without frontage roads) or progression
for a series of diamond interchanges connected by frontage roads. The program
analyzes various phasing patterns and varies the offset to minimize delay within
the interchange. PASSER III has a built in assistant function to calculate
saturation flow rates based on the methodology of the HCM (1).
Data input is divided into four separate entities: freeway identification
(freeway name, number of interchanges, upper and lower cycle lengths, cycle
length increment, other parameters dealing with problems having more than one
interchange), interchange and signal phasing data (cross street name, left turn
treatment, interior travel time, interior queue storage, signal phasing),
interchange movement data (volume, saturation flow, minimum green time), and
frontage road progression data (distance, speed, queue clearance time).
Comment on Data Input Screens
Freeway Identification Screen
Input general data for interchange. Main inputs deal with cycle length
(lower cycle length, upper cycle length, cycle length increment) and progression
inputs. The minimum cycle length is the smallest cycle length the program will
29
NOTES
use to calculate a solution. The program will not allow the user to input a cycle
length less than 40 seconds. The upper cycle length is constrained by the lower
cycle length value as the lowest value and 150 seconds for optimization and 300
seconds for evaluation. The cycle length increment is the number of seconds
the program should use between the lower and upper cycle lengths for
optimization (five seconds is recommended). Progression options include
having the program calculate the band splits according to frontage road
volumes. If one frontage road is given priority with respect to progression, the
program allows the user to determine the relative importance of that progression
by assigning the bandwidth percentages by hand. Typically, the user would
allow the program to determine progression bandwidths.
Interchange and Signal Phasing Data Screen
This screen provides certain inputs for signal phasing, interchange
geometry, and operational data. Options include permitted or protected left turn
phasing options and interior travel time (Table 5).
Interior queue storage is based on the number of vehicles, by movement
(through or left), that can be stopped within the interchange without blocking
frontage road traffic. These storage amounts can be estimated by allowing one
vehicle 25' of space. Shared use lane capacity may be divided between lefts and
through vehicles.
Table 5. Interchange Interior Travel Time and Overlap as a Function
of Separation Distance Between Intersection Stop Lines
Distance (feet)
Travel Time (seconds)
67
6
94
7
125
8
160
9
200
10
244
11
288
12
332
13
376
14
420
15
Reference: PASSER III-88 User’s Manual.
Overlap (seconds)
4
5
6
7
8
9
10
11
12
13
The five signal phasing options are also listed on this screen, with inputs
for internal and external offsets. Figure 5 presents a summary of the phasing
code
30
NOTES
Figure 5. Phasing Code Descriptions Used by PASSER III
31
NOTES
descriptions used by PASSER III. To find the most efficient operation for any
phasing type, enter a <Y> in the “Run Delay-Offset Analysis” column. If a <N>
is coded in the “Run Delay-Offset Analysis” column, the program will allow the
user to enter an internal offset for analysis. If applicable, the user then can
evaluate certain external offset by entering values in the “Forced ext.” column.
Data entry is not allowed in the “Forced ext.” column for the first interchange.
Interchange Movement Data
The interchange movement data input screen allows the user to enter
volumes, saturation flows and minimum phasing lengths for each movement.
The assistant functions, accessed by pressing [F3], are very helpful to the user in
completing data input for the interchange movement data.
Volumes are entered for only those vehicles impacted by the signal
timings. Free U-turning vehicles and right-turn-on-red vehicles should not be
included in these volumes. Diamond interchange movements that must be
counted are shown in Figure 6.
Saturation flow is easily calculated using the assistant function. The
user must ensure that the input minimum green times for each side of the
interchange do not exceed the minimum cycle length input in the Freeway
Identification Screen. For optimization runs, a minimum phase time for each
movement of 10-12 seconds is typical when pedestrian traffic has pedestrian
actuation available.
Frontage Road Progression Data
For simulation/optimizations where there is more than one subject
interchange, it is necessary for the user to input frontage road information such
as link distances (stopline to stopline), speed (average desired running speed or
posted speed limit), and queue clearance times (the time in seconds that the
platoon should arrive at the intersection after the green interval has begun).
Outputs include summaries of general information and data input
(freeway, cross street names, dates, etc.), delay-offset diagrams, optimal
progression solution (optimal cycle lengths, progression speed, bandwidth,
efficiency, and attainability), frontage road progression information (phasing
sequence, internal and external offsets, A&B direction travel times), general
signalization information (phase times, v/c ratios, delay, internal storage ratios,
phase order, internal offset, total interchange delay, and level of service), and
time-space diagrams.
32
NOTES
Figure 6. Interchange Movements Required by PASSER III
33
NOTES
Application for Road User Cost Studies
PASSER III is probably the easiest tool to simulate and optimize isolated
signalized diamond interchanges and frontage road interchange systems that is
freely distributed throughout TxDOT. This will likely be the traffic model used
for construction projects at diamond interchanges in both the rural and urban
environments. The available assistant functions provide easy to use interfaces to
calculate traffic volumes, minimum phase times, and saturation flow rates.
MOE’s are easily identifiable in the program output and are given on an
interchange basis. Although the software is intended for use as an aid in
evaluating and optimizing traffic signal operations, the user should not get
“bogged down” in the signal timing output, and should concentrate on
determining delay associated with the minimum delay cycle length. The total
system delay determined by the software is used in the road user cost study.
Additional details can be found in the PASSER III User’s Manual (5).
FREQ
Application: Freeway Modeling with or without Parallel Arterials, HOV
Benefits on Freeway Corridors (FREQ10PL), and Benefits of Ramp Metering on
Freeway Operations (FREQ10PE).
FREQ10 is a traffic simulation model suited to priority lane handling
(FREQ10PL) (HOV) or priority entry handling (ramp meters) on freeways
(FREQ10PE). FREQ was developed in 1968 and continuously improved in
response to changing traffic theory, traffic demand modeling, and simulation
modeling techniques. Capabilities include detailed fuel consumption and
emissions models, modal shift models, spatial shift models, optimization
models, and improved input and output capabilities. An updated model
designated as FREQ11 can be obtained from the Institute of Transportation
Studies at UC–Berkeley. TxDOT has free distribution of FREQ10 Release T91,
which is sufficient for most applications of road user cost studies.
Inputs to the FREQ model include freeway design features (subsection
lengths, capacity, speed-flow curves (optional), location and capacity of ramps,
grades, number of lanes), freeway demand (time-slice specific or synthetically
generated O-D data), optional alternative route traffic flow and geometric
connections to freeway, optional HOV design specifications (FREQ10PL only),
optional ramp control specifications (FREQ10PE only), optional time slice
specific reductions in subsection capacity for incident scenarios or roadway
maintenance (FREQ10PE only).
34
NOTES
FREQ is one of the most easy to use freeway modeling tools. FREQ can
accommodate 24 time slices, 38 subsections, and 18 origins and destinations.
FREQ outputs include traffic performance tables consisting of travel
time, delay, queue, speed, fuel and emissions (optionally) for each time slice.
Contour maps are available for up to 10 traffic performance measures.
Measures of effectiveness include: flows, densities, total vehicle-hours or travel,
vehicle noise, v/c ratios, travel times, total vehicle-miles, fuel consumption,
speeds, ramp delays, and traffic queues.
Application for Road User Cost Studies
The FREQ10PE component of FREQ should be used for freeway road
user cost applications. Road user cost studies typically do not require the use of
HOV or ramp metering capabilities of FREQ. Typical studies examine the delay
differences between geometric layouts (different number of lanes) or capacities
(due to reduced lane or shoulder widths, etc.). Be aware that the “analyze
merge” toggle can be sensitive in oversaturated conditions. The user may want
to toggle this “analyze merge” option off when completing user cost studies.
SUMMARY
Several computerized traffic modeling tools are available to complete
road user cost studies. The most effective model for completing road user cost
studies are the traffic-based (as opposed to the economic based) models. In
summary, the following computerized traffic modeling tools are recommended
for use in road user cost studies, with their applications listed for reference. At
this time, it is not recommended that economic based models be used to
calculate road user cost.
Signalized Intersections
PASSER II-90 (isolated and arterial simulation/optimization)
PASSER III (isolated diamond interchanges and frontage road systems
simulation/ optimization)
Freeways
FREQ (freeway simulation–one freeway and urban and rural work zone
closures/scheduling)
35
NOTES
EXAMPLE PROBLEMS
This session of the short course concentrates on completing several
example problems, including actual user cost studies which TTI has completed.
These are not being presented in any particular order, but are structured so that
at least one example of each of the various types of projects that may require
road user cost studies is presented. These example problems will give students
the opportunity to complete a number of user cost studies and gain hands-on
experience with typical hand calculations and traffic simulation models. The
techniques illustrated are meant to provide a source of reference material to
TxDOT staff.
The examples are grouped by the analysis technique or simulation
program used. The first group of examples will use by-hand calculations to
calculate delay for a new route, a stop controlled intersection, and a detour
routing. The second group of examples will use PASSER II and PASSER III to
determine delays at isolated intersections, arterial systems, and freeway
interchanges. The third group of examples will focus on using the FREQ10
freeway simulation model to estimate delay on freeway sections while the fourth
group of examples will estimate delays on freeways due to lane closures using
FREQ10.
EXAMPLE 1: ROADWAY ON NEW LOCATION–US 281 ALICE
RELIEF ROUTE (calculations by hand)
This project provides for the construction of the “Alice Relief Route”, a
9.9 mile facility bypassing downtown Alice. This is a new facility on a new
location. The southern portion of the project is currently under construction and
a user cost study for the northern segment is needed. This example illustrates
using hand calculation techniques to determine road user costs. Figure 7
presents the layout of the proposed Alice Relief Route in Jim Wells County.
Step 1: Review Traffic Control Plans (TCP)
A review of the available TCP indicated minimal impacts on the existing
traffic. If the user cost study was halted at this juncture, no user costs would
have been assigned to the project. However, there will be a time savings to
traffic after the route is completed, so a very simple analysis can be performed.
36
NOTES
Figure 7. Layout of the Alice Relief Route in Jim Wells County
37
NOTES
Figure 8. Detour Plan Bridge Beam Erection
Step 2: Define Analysis Approach
38
NOTES
Since it was determined that there would be no calculable delays to the
existing traffic, the impact of delayed construction on the traffic projected to use
the roadway should be studied. This approach basically uses the “after” portion
of the “before and after” studies described in Session 2. The analysis can be
completed by comparing the existing travel time through downtown Alice with
that projected by using the new route.
Step 3: Data Collection
Only minimal data collection effort in the field is necessary to obtain the
required data. A sample of travel times through downtown Alice using US 281
was completed by TxDOT personnel. The traffic volume data was available
from other Department resources.
Step 4: Estimation of Road User Costs
The hand calculations are presented below. These calculations include
an estimate of the travel time for the new route, an estimate of current travel
time through downtown Alice, calculation of the delay savings (180.25 vehiclehours/day), and estimated daily road user cost ($2,640/day).
ASSUMPTIONS
•
•
•
Roadway on New Location ? ?
No Impacts on Existing Traffic
Traffic Volumes
Projected AADT = 5,150 veh/day (1997)
Travel Times
New Route (Relief Route)
9.9 miles @ 60 mph = 9.9 minutes
Current Route (through downtown Alice)
12.0 minutes–typical average trip
SAVINGS = 2.1 minutes/trip
TOTAL ESTIMATED DAILY SAVINGS
[(5,150 veh / day) x (2.1 min) x (1 hr / 60 min)] = 180.25 veh-hrs / day
ROAD USER COSTS
[(180.25 veh-hrs / day) x ($14.64 / veh-hr)] = $2,640/day
Step 5: Documentation Results
It is critical to document all data sources used in any road user cost
study. For this particular project, documentation should include the resources
for traffic projections and the results of the travel time studies completed along
the existing roadway. In addition, the current value of time (Table 2) should be
39
NOTES
documented in the project file as well as the CPI value used to update the value
to the more current value.
EXAMPLE 2: DETOUR ROUTING ANALYSIS USING TRAVEL TIME
DIFFERENTIAL (calculations by hand)
This example presents the calculation of additional delay due to a
detour. This detour is part of the project presented in Example 5, where a fourlane urban arterial reconstructed to a six-lane urban freeway with frontage
roads.
Step 1: Review Traffic Control Plans (TCP)
Figure 8 presents the detour plan from the TCP. (This particular project
required 15 detours at various points during the construction. This detour
results from a bridge beam erection over westbound Holmes Road.
Step 2: Define Analysis Approach
A travel time study was necessary to determine the additional delay due
to the detour. These detours were scheduled to occur from 10:00 p.m. to 5:00
a.m. on weekdays, so only volumes observed during these times would be used
in the calculation of additional delay.
Step 3: Data Collection
For each detour plan, two travel times were determined: 1) existing
route; and 2) detour route. The number of repetitions of the travel time runs
depends mainly on the time of the detour. If the detour is during the late-night,
and volumes are relatively low, the travel time study can be completed during
the day when free-flow conditions are present, as was this case. However, if the
detours will be during AM or PM peak periods with significant volumes, an
alternative modeling approach may be necessary in order to capture the
additional delay to stop-controlled and signalized intersections. In addition to
the travel time information, it is necessary to complete traffic volume studies to
estimate the quantity of the detoured traffic.
40
NOTES
Step 4: Estimation of Road User Costs
The estimated detour travel time is subtracted from the existing route
travel time to estimate the per-trip additional delay. The per-trip additional delay
is then multiplied by the total number of vehicles which are estimated to utilize
that detour route during prescribed hours.
This detour will close the westbound Holmes road entry to westbound
US 90A. From the travel time study, the existing route (from Kirby to the US
90A merge) was found to take about 3.1 minutes to travel during free flow
conditions while the detour route travel time is estimated at 14.3 minutes. The
difference in travel time between the two routes is 11.2 minutes for each trip.
This is the additional delay to each vehicle that passes through this detour.
From automatic tube counts, it was estimated that approximately 280
vehicles would be detoured from 10:00 p.m. to 5:00 a.m. on the average
weekday. These 280 vehicles will incur 52.3 vehicle-hours each evening that
this detour is in effect. The estimated user cost would then be calculated using
the current value of time (at the time of this study–$14.92/vehicle-hour delay).
The additional user cost due to this detour is estimated at $780 (52.3 vehiclehours x $14.92).
Step 5: Documentation Results
It is critical to document all data sources used in any road user cost
study. For this particular project, the documentation should include the
resources for traffic volume projections and the results of travel time studies
completed along the existing roadway and detour route. In addition, the current
value of time (Table 2) should be documented in the project file as well as the
CPI value used to update the value to a more current value.
EXAMPLE 3: INTERSECTION WIDENING (calculations by hand and
using PASSER II)
This example illustrates completing a road user cost for part of a
roadway improvement project. This project improves a two-lane roadway with
a stop controlled intersection to a four-lane roadway with continuous two-way
left turn lane, with a traffic signal installation at the intersection. This project is
fairly typical in urban and rural districts throughout the State. The user costs
can be estimated by comparing the total intersection delay of the existing traffic
conditions at a stop controlled intersection with the post-construction condition
of capacity increase and signal installation. Delay calculation techniques as
41
NOTES
presented in the 1994 Highway Capacity Manual for stop controlled intersections
and the PASSER II-90 model for signalized intersection are used for this project.
Basic geometrics and capacity information are summarized as follows.
Existing Conditions
• one-lane each direction
• 12 foot lanes
• all-way stop controlled intersection
Proposed Conditions
• two-lane approach with dedicated left-turn
lane
• 12 foot lanes
• eight phase signal operation with overlap
phasing
• protected turn lanes and phasing
Step 1: Review Traffic Control Plans (TCP)
In this case, a detailed review of the TCP is not needed to complete a
valid road user cost study. The information necessary to complete the road user
cost is given: the existing and proposed geometrics (lanes/approach, lane widths)
and signal system information.
Step 2: Define Analysis Approach
A simplistic approach of completing a “before and after” study of traffic
operations at the intersection can be completed. The before condition will use a
1994 HCM-based stop-controlled intersection analysis.
Since the after
construction condition will involve an isolated signalized intersection, the
PASSER II-90 computer model is used to estimate intersection delays with
improved geometrics.
Step 3: Data Collection
Hourly turning movement counts are needed to be able to use the HCM
stop-controlled analysis and the PASSER II-90 traffic signal optimization model.
For this example, there were adequate resources available to collect turning
movement count (TMC) data for the analysis. It would not be practical to
complete the TMCs for an entire 24-hour time period. However, the data should
be collected during the AM, PM, and Mid-Day traffic periods. Based upon
knowledge of traffic patterns in the area, the AM and PM peak hour volumes
were assumed to occur for three hours each on a daily basis. The Mid-Day
turning movement patterns are assumed to occur for 10 hours each day. While
this will account for 16 hours of the day; the remaining hours of the day (late
evening and early morning hours) exhibit very low traffic volumes and will not
42
NOTES
considerably contribute to the estimate of daily delay. For this example, the AM
peak hour turning movement count and existing and proposed geometrics are
presented by Figure 9.
Figure 9. Existing and Proposed Geometrics and
AM Peak Period Turning Movement Count for FM 1111 and CR 99
43
NOTES
Step 4: Estimation of Road User Costs
This example will require a different technique to estimate the delays
during the existing geometrics and that of the newly constructed signalized
intersection. The 1994 HCM methods were used to complete an analysis of the
existing all-way stop controlled intersection for the AM, Mid-Day, and PM peak
hour conditions. To estimate intersection delay after construction is complete
with a signal in place, use PASSER II-90 to calculate delays for the hours using
the same traffic volumes as used for the existing conditions.
Step 4a. Use of 1994 HCM method for determining delay at allway stop controlled intersections. The 1994 HCM presents a method to
calculate the estimated delay at an all-way stop controlled intersection. While
this method can be hand-calculated, it lends itself to a spreadsheet solution.
Allison Meadors of TxDOT’s Traffic Operations Division in Austin developed a
Microsoft Excel spreadsheet to solve the many calculations of this method. The
only data needed to complete this analysis is the turning movement count and a
knowledge of the number of approach lanes for each direction. Specific steps
are as follows.
1. Open Microsoft Excel.
2. Load the file: “c:\traffic\hcm94.xls”. (NOTE: The file name could
change depending upon the setup of the computer.)
3. The two data entry entities needed for the spreadsheet are turning
movements and number of approach and opposing traffic lanes (Figure 9).
Enter the turning movement data and number of subject approach lanes and
opposing approach lanes (example: for the northbound direction, the number of
opposing approach lanes is the total number of southbound approach lanes).
4. Note the total intersection delay value as calculated at the bottom of
the spreadsheet.
Figure 10 illustrates the completed spreadsheet for the AM peak hour.
The spreadsheet should give a total intersection delay of 52.81 vehicle-hours of
delay for the AM peak period. For this analysis, the PM and Mid-Day delay
would also be calculated by inputting the PM and Mid-Day turning movement
counts into the spreadsheet. It is recommended that the user print out and/or
save the Microsoft Excel spreadsheet file for each time period studied for
documentation purposes. The next step is to analyze AM operations after the
roadway and signal improvements are in place.
44
NOTES
Figure 10. Completed HCM Analysis of All-Way Stop Control Section
Step 4b. Use of PASSER II-90 to estimate delay at isolated
signalized intersection. For this example, a total of three signal optimization
analyses are required (AM, Mid-Day, and PM peak periods). An example of the
PASSER II analysis of the AM peak period conditions is outlined below. This
will complete the post-construction (or “after”) portion of this study.
45
NOTES
1. Start PASSER II. Enter the PASSER II-90 program following the
instructions given by your instructor.
2. Go to the main menu. From the information screen, press any key
to go to the main menu (Figure 11). The main menu includes several options:
input new data, read old data, edit data, store data, print data, run PASSER II,
read output, and quit the program.
Figure 11. PASSER II Main Menu Screen
3. Choose option 1–Input New Data. To set up the model for this
problem, select option 1-Input New Data. The Input Menu (Figure 12) will
appear and there will be three choices: 1) Input New Traffic Data (choose to
input arterial data, movement data, and phasing data); 2) Input Embedded Data
(choose to edit program parameters); and 3) Input Phaser Data (choose to edit
the definitions of timing data).
4. Choose option #1–Input New Traffic Data. The program then
asks if you want to abandon existing data input, press <Y>. The arterial data
edit
screen
appears
(Figure
13).
46
NOTES
Figure 12. PASSER II Input Menu Screen
Figure 13. PASSER II Arterial Data Screen
5. Edit Arterial Data. PASSER II then asks for general information
such as run number (enter <1>), city name (enter <Anywhere, TX>), number of
intersections (enter <1>), arterial name (enter <FM 1111>), district number
(enter <0>), and date (enter today’s date). Refer to Figure 13 for the correct
47
NOTES
inputs for this example. Press <ENTER> to move between fields. After
entering the general data, enter a beginning cycle length of 60 seconds. For
isolated intersection simulation (when number of intersections input = 1) the
program does not allow for a range of cycle lengths to be simulated. The
program will run with this cycle length and determine a “best” cycle length that
can be re-input after the initial simulation. Enter a Movement #2 direction of
<3> (for an easterly direction). This will match our turning movement layout in
Figure 9. The output level input allows the user to specify the amount of output
available, for this example leave at zero (to output all information). The
program also allows the user to specify between the PASSER II best solution or
the AAP P2 best solution. Select zero, the PASSER II best solution, BUT DO
NOT PRESS ENTER. Figure 13 indicates how this screen should appear.
Press <ENTER>. The screen will now ask for the name of cross street #1 (in
our case, enter CR 99) and press <ENTER>. The program automatically moves
directly to the Vehicle Movement data edit screen (Figure 14) and asks if any
data needs modification. Enter <Y>.
Figure 14. PASSER II Vehicle Movement Screen
6. Edit Arterial Movement Data. When the intersection movement
screen appears (Figure 14), the cursor is flashing on the eastbound left turn
volume (note north arrow in upper right corner of screen). The left turn phasing
will be protected only. To toggle a left turn protected only, use the scroll down
48
NOTES
arrow to go to the minimum phase for the eastbound left turn and enter <7>
seconds. Scroll back up to the eastbound left turn volume input and press the
[F3] key. This brings up the assistant function. (There are three assistant
functions in PASSER II: the volume assistant, the saturation flow assistant, and
the minimum green assistant.) The assistant is asking if the left turn should be
permissive. Enter <N> since we want protected only. The assistant then asks if
left turns are protected only. Type in a <Y> for yes. Enter the eastbound left
turn volume from Figure 9 (95 vehicles). The assistant then prompts the user
for a peak hour factor and has a default value of 1.00 shown. Press <ENTER>
to accept this value. The program confirms the left turn volume as 95 vehicles.
Press <ENTER> twice to remove the assistant function.
Use the down scroll key to move the cursor to the eastbound left turn
saturation flow rate (1,805 vphg shown). The left turn bay has one lane, 12’
wide (Figure 9). Press [F3] to invoke the saturation flow rate assistant. The
program asks for the ideal saturation flow (1,900 vphg). Accept this value by
pressing the <ENTER> key. The assistant will then prompt the user for a list of
values such as peak hour factor, lane width, etc. Check to insure that all of
these values are appropriate for this example. If you have any questions about
these values, ask your instructor. The program calculates a saturation flow of
1,805 vphg and the minimum phase length should remain seven seconds. Note
that left of the minimum phase time for the eastbound left turn movement is the
numbers: 5[5]. The first 5 is the NEMA movement number for the eastbound
left turn and the 5 in brackets is the PASSER II notation for left turn protected
with left turn bay operation. See the short discussion on PASSER II for other
left turn phasing options and notations.
Again, press the <ENTER> key to move the cursor to the eastbound
through volume. Press the [F3] key to prompt the assistant function. Enter
through traffic (300 vehicles) and right turn traffic (90 vehicles). The assistant
will total the throughs and right turns for a total of 390 vehicles. Follow the
assistant instructions until the cursor is on the through and right turn saturation
flow rate (1,800 vphg is now shown). From Figure 9, we see that there are two
12-foot wide lanes on this approach. Press the [F3] key to activate the assistant
and follow the prompts, entering two lanes and 12 feet for the average lane
width. All other values remain the same (the saturation flow for the eastbound
through and right should be 3,494 vphg).
The minimum phase length must now be calculated. While seven
seconds was used for the protected left turn movement (a typical length), the
minimum phase length for the through and right turn phase should be based on
pedestrian walk time, if appropriate. For our example a minimum phase time
49
NOTES
will be calculated for pedestrians. Place the cursor on the minimum phase
length for the through and right turn movement. Press the [F3] key to bring up
the assistant. The assistant asks for the pedestrian “walk” time, and walking
pace. The default of four feet/second is acceptable for both. The assistant will
then ask for the pedestrian walk distance, which in our example is 60 feet (five
lanes x 12'/lane). The assistant asks for half of the lane distance, which is six
feet. The assistant has calculated a minimum phase length of 17 seconds for this
movement.
Follow the same steps to enter and calculate the volumes and saturation
flow rates for the other three approaches. Figure 15 shows what the vehicle
movement screen should look like once all volumes and saturation flow rates
have been input. If all values on your screen do not match, ask your instructor
for assistance. The program asks if any data needs modification again, if all
values match Figure 15, enter <N>, otherwise enter <Y> and correct the input
data.
Figure 15. PASSER II Vehicle Movement Data Screen
Completed for Example 3
7. Edit Signal Phasing Data. After input of the turning movement and
saturation flows, the program then proceeds to the signal phasing data input
screen (Figure 16). PASSER II will allow you to select four possible phasing
patterns for the arterial and only one for the cross street. The cursor should be
50
NOTES
Figure 16. PASSER II Phasing Pattern Data Screen
leading, press <ENTER> to toggle a <Y>, which will appear. Scroll down to
choose the phasing selections with overlaps to minimize delays. The cross street
phasing must be chosen using engineering judgment because PASSER II only
allows one cross street phasing selection. While any of these phasing patterns
could be chosen, the dual left turns leading with overlap is chosen. Figure 17
shows the phasing pattern screen after the phasing patterns have been toggled
for analysis. If the analyst is unsure of the optimal cross street phasing pattern,
the model may be rerun using each of the possible choices and choosing the
phasing pattern resulting in the lowest delay. Press <ESC> twice to return to the
Main Menu. All necessary geometric, volume, and signal phasing information
has been entered and the PASSER program is ready for execution.
Figure 17. Phasing Pattern Data Screen Completed for Example 3
51
NOTES
8. Save input file. Save the file first using option #4 on the main
menu.
9. Run PASSER II. After designating a subdirectory (use <C:\p2\>)
and filename (for this example enter <ex3sigam.dat>, choose option #6 on the
main menu to run the program. After running PASSER II will display the
output menu (Figure 18). While each of the output choices have important
information, option #5–measures of effectiveness, will summarize the total
system delay (in vehicle-hours).
Figure 19 shows the arterial system
performance output. The total system delay number (11.6 vehicle-hours/hour)
will be used, along with the total system delay for the pre-construction
simulation (52.8 vehicle-hours), to calculate the additional user delay due to
construction.
Figure 18. PASSER II Output Menu Screen
The additional delay due to construction for the AM period is 41.2
vehicle-hours/hour (52.8-11.6). This value would be used with the PM and
Mid-Day values to determine a daily road user cost. This daily road user cost is
determined after review of the 24 hour tube counts.
Step 5: Documentation Results
For this example, the critical elements to include in the project file are
the turning movement counts, the all-way stop control intersection analysis
spreadsheet, and the printouts of the PASSER II analyses. Most of the
assumptions utilized to execute the software will be included on the printouts.
52
NOTES
EXAMPLE 4: WIDEN AND RECONSTRUCT URBAN ARTERIAL–US
90A FROM KIRBY TO I-610 (HARRIS COUNTY)
This project will widen and reconstruct US 90A (Main Street) from
Kirby Drive to the diamond interchange at I-610. The roadway is an existing
four- and six-lane urban arterial that will be widened to a six- and ten-lane
divided curb and gutter arterial. The 95 percent complete traffic control plan
was available. No lane closures will be permitted from 6:00 a.m. to 9:00 a.m.
inbound (northbound) and from 3:00 p.m. to 7:00 p.m. outbound (southbound).
At I-610, no lane closures will be allowed for any approach from 6:00 a.m. to
9:00 a.m. and from 3:00 p.m. to 7:00 p.m. Figure 20 shows the project location
and general layout. Phase 1 during the PM peak hour will be studied as the
example for this project.
Step 1: Review Traffic Control Plan (TCP)
Several particular items of importance were indicated by a thorough
review of the traffic control plan. There are several signalized intersections (six
arterials, one diamond interchange) of varying cross-sections and lane and
shoulder widths. The evaluator should note the geometric configurations of all
signalized intersections for each construction phase. A diagram of the study area
with intersection geometry for each construction phase should be completed to
allow for a better understanding of the overall picture of the project. The
diagram for Phase 1 and post construction are illustrated by Figure 21.
Although
53
NOTES
this project has five distinct phases, the signal operations for the PM peak of
Phase 1 will be presented as an example.
Figure 20. Project Layout for Example 4
54
NOTES
Figure 21. Arterial and Intersection Layout for Example 4
55
NOTES
Step 2: Define Analysis Approach
The basic study section is a single arterial with four-leg intersections,
with three exceptions: the diamond interchange at US 90A and I-610, the
intersection of Kirby and OST, and the intersection of OST and US 90A (a
three-legged intersection). Because of the proximity of the diamond interchange
with the Buffalo Speedway intersection, the relatively minor contribution to
additional delay expected at the OST and Kirby intersection, and the arterial
nature of the overall problem, PASSER II is the analysis tool chosen for this
study. The diamond interchange could have been studied individually using
PASSER III, but treating each side as one intersection is adequate for these type
studies. It also simplified the evaluation process by using a single computer
model. Using PASSER II, determine the optimal signal timings for each
construction phase and the final configuration.
Step 3: Data Collection
Ideally, extensive traffic volume studies should be completed at each
signalized intersection in the study corridor. Due to limited resources of time
and equipment available, automated tube counts are placed at only strategic
locations throughout the study area (Figure 22). Fifteen minute manual turning
movement counts are completed at each signalized intersection for the AM, MidDay, and PM peak periods. Thirty minute manual turning movement counts are
completed at the diamond interchange during the same time periods. Other data,
including speeds and signal phasing, may be observed in the field while
intersection spacing may be obtained from the TCP.
Step 4: Data Reduction
As with many projects, the time available for these studies is sometimes
limited by review and letting schedules. Because of these time constraints,
analysts often must limit data collection times to maximize the number of counts
given a limited data collection staff. In this case, 15 minute turning movement
counts were collected. While two hour counts may be better, the 15 minute
counts can be checked against the tube approach counts to determine an
appropriate hourly turning movement count for each analysis period. In these
cases, engineering judgment is used to assign turning movement volumes used
in the analysis. Once turning movements have been developed from the tube
and manual counts, the PASSER II optimizations could be completed. The PM
peak hour volumes used for this study are illustrated by Figure 23.
56
NOTES
Figure 22. Tube Count Locations
57
NOTES
Figure 23. PM Volumes for Example 4
58
NOTES
Step 5: Computer Simulation/Optimization Analysis
Input data into PASSER II for each construction phase (five in all) for
each time period (three time periods: AM , Mid-Day and PM) for a total of 15
PASSER II optimizations. Input data into PASSER II for the final geometric
condition is also necessary to estimate the delay after the construction is
complete. Summarize system delay for each simulation and determine the delay
difference between each construction phase and the final geometry condition.
And finally, calculate the estimated road user cost (by summation of AM, MidDay, and PM period additional delay values multiplied by appropriate
multipliers to obtain a daily total) based on the current value of time.
It is now necessary to complete Phase 1 and post-construction
simulation/optimization for the PM period. This example file has been setup
with all volumes and saturation flow rates entered for all intersections except
Kirby at South Main. The data input and run PASSER II to determine the delay
for the PM period for Phase 1 will be completed for this example.
1. Start PASSER II. Enter the PASSER II-90 program following the
instructions given by the instructor. Go to the main menu (Figure 24) and
choose option 2–read old data from disk. The program will ask you for a
subdirectory and filename. Choose the file ex5p1.dat. The file will load and
return to the main menu screen.
Figure 24. PASSER II Main Menu Screen
59
NOTES
2. Edit arterial data. From the main menu, choose option 3–edit data.
Once in the edit menu (Figure 25), choose option 1–edit arterial data. The
arterial data screen (Figure 26) allows the user to input general project
information, cycle length ranges for analysis, direction designation for
movement 2, output options, and progression options. All this information was
previously set up on the data file and nothing needs to be changed on this
screen. Press <ESC> to go back to the edit menu.
Figure 25. PASSER II Edit Menu
Figure 26. PASSER II Arterial Edit Screen Completed for Example 4
60
NOTES
3. Edit arterial movement data. At the edit menu, choose option 2–
edit intersection movements. This brings up a list of seven intersections. Scroll
down and choose 7–Kirby. The intersection movement screen appears (Figure
27) and the cursor is flashing on the northbound left turn volume. The
minimum phase lengths have already been input. Press the [F3] key. This
brings up the assistant function. There are three assistant functions in PASSER
II: the volume assistant, the saturation flow assistant, and the minimum green
assistant. The assistant is asking if the left turn should be protected. Type in a
<Y> for yes. Enter the northbound left-turn volume from Figure 23 at the Kirby
intersection (50 vehicles). The assistant then prompts the user for a peak hour
factor and has a default value of 1.00 shown. Press <ENTER> to accept this
value. The program confirms the left turn volume as 50 vehicles. Press
<ENTER> twice to remove the assistant function.
Figure 27. PASSER II Vehicle Movement Data Screen
Use the down scroll key to move the cursor to the northbound left turn
saturation flow rate (1,805 vphg shown). From Figure 21, the left turn bay has
one lane, 11’ wide. Press [F3] to bring up the saturation flow rate assistant. The
program asks for the ideal saturation flow (1900 vphg). Accept this value by
pressing the <ENTER> key. The assistant will prompt the user for a list of
values, accept the default values for all questions except for the number of lanes
(enter 1), and the average lane width (enter 11). The program calculates a
saturation flow of 1,746 vphg. The minimum phase length has been set to seven
seconds.
61
NOTES
Press the <ENTER> key again to move the cursor to the northbound
through volume. Press the [F3] key to prompt the assistant function. Enter
through traffic (370 vehicle) and right turn traffic (80 vehicle). The assistant
will total the throughs and right turns for a total of 450 vehicles. Follow the
assistant instructions until the cursor is on the through and right turn saturation
flow rate (1,800 vphg is now shown). From Figure 21, we see that there are two
eleven foot wide lanes on this approach. Press the [F3] key to activate the
assistant and follow the prompts, entering two lanes and 11 feet for the average
lane width. All other values remain the same. Follow the same steps to enter
and calculate the volumes and saturation flow rates for the other three
approaches.
Figure 28 shows what the screen should look like once all
volumes and saturation flow rates have been input. If any of the inputs on your
screen do not match those shown on Figure 28, please ask your instructor for
assistance. The program will then take you back to the list of cross streets, press
the <ESC> key to return to the edit menu.
Figure 28. PASSER II Vehicle Movement Screen Completed for Example
4
4. Edit signal phasing. Once back to the edit menu, the phase
sequences which PASSER II is to optimize for at the Kirby intersection need to
be entered. Choose the third option, edit intersection phasing data. A list of
intersections is shown. Choose intersection 7–Kirby. PASSER II will allow the
selection of four possible phasing patterns for the arterial and only one for the
cross street. Figure 29 shows the phasing pattern screen with no inputs. The
cursor should be on the arterial dual lefts with overlap. Press <ENTER> to
toggle a <Y>, which will appear. Next, choose the four phasing selections with
62
NOTES
overlaps to minimize delays. The cross street phasing must be chosen using
engineering judgment as PASSER II only allows one cross street phasing
selection. While any of these phasing patterns can be chosen, the left turn three
leading with overlap is selected since there are three times as many left turns
while the through volumes are similar. Figure 30 shows the phasing pattern
screen after phasing patterns have been toggled for analysis. If the analyst is
unsure of the optimal phasing, the model may be rerun using each of the
possible choices and choosing the phasing resulting in the lowest delay. Press
<ESC> twice to return to the edit menu.
Figure 29. PASSER II Phasing Pattern Input Screen
Figure 30. PASSER II Phasing Pattern Screen Completed for Example 4
63
NOTES
5. Edit arterial geometry data. At the edit menu, choose selection 5,
arterial geometry data. The values necessary for this simulation are already
input, but this where progression speeds and distances between intersections are
input. Figure 31 shows the arterial geometry data screen. Press <ESC> twice to
take you back to the main menu. The file is complete and ready to run.
Figure 31. PASSER II Arterial Geometry Data Input Screen
6. Save input file. Save the file using option 4 on the main menu.
7. Run PASSER II. After designating a subdirectory (c:\p2\data) and
filename (ex5p1.dat), choose option 6 on the main menu to run the program.
After running PASSER II will display the output menu (Figure 32). While each
of the output choices have important information, option 5–measures of
effectiveness will summarize the total system delay (in vehicle-hours). Figure 33
shows the arterial system performance output. The total system delay number
(126.3 vehicle-hours/hour) will be used, along with the total system delay for the
post construction simulation, to calculate the additional user delay due to Phase
1 of construction.
8. Run PASSER II for post construction. Another file, ex5post.dat,
is the post construction conditions file. Select this file and run in PASSER II.
The total system delay post construction will be 83.8 vehicle-hour/hour (Figure
34).
The additional delay due to construction for the PM period during Phase
1 is 42.5 vehicle-hour/hour (126.3-83.8). This value would be used with the AM
and Mid-Day values to determine a daily road user cost. This daily road user
cost is determined after review of the 24-hour tube counts.
64
NOTES
Figure 32. PASSER II Output Menu Screen
Figure 33. PASSER II Measures of Effectiveness for Phase I, PM
65
NOTES
Figure 34. PASSER II Measures of Effectiveness for Post Construction
Step 6: Document Results
In a short technical memorandum, document the following: construction
sequencing, modeling techniques, traffic demands (with counts included at the
end of the memorandum, if necessary), delay results (report vehicle-hours of
delay for each time period and construction phase), the current value of time,
and the summary of estimated road user cost for each construction phase.
EXAMPLE 5: BUILD SIX MAINLANES AND TWO 2-LANE
FRONTAGE ROADS WHERE A FOUR-LANE ARTERIAL NOW
EXISTS–US 90A FROM SOUTH OF I-610 TO HIRAM CLARKE
(HARRIS COUNTY)
This project consists of building six freeway mainlanes and two 2-lane
discontinuous frontage roads. A rail line runs through the project limits. Within
the study section, the existing roadway is a four lane divided urban/rural arterial
with an elevated section over the railroad and two signalized intersections. The
95 percent complete traffic control plan was provided along with the plan and
profile sheets. The detours and lane closures will only be allowed during nonpeak hours: 10:00 p.m. Sunday night to 5:00 a.m. Friday morning, and from
10:00 p.m. Friday night to 9:00 a.m. Sunday morning. This analysis would
involve determining the levels of additional congestion due to street closures,
detours, or capacity reductions due to construction.
66
NOTES
Step 1: Review Traffic Control Plan (TCP)
This particular project had 15 individual phases (or steps) and 14
separate detour operations. Road user costs were calculated for each phase and
detour. There are two existing signalized intersections in the study area. One,
one-way stop controlled intersection (Stella Link) currently exists but will
become signalized at project completion.
The two existing signalized
intersections will be reconfigured to diamond interchanges. It is recommended
that the evaluator draw a diagram of the study area configuration (intersection
layouts) for each phase of the project. This is critical for projects similar to this
where many different phases are involved.
Step 2: Define Analysis Approach
The existing signalized intersections are isolated in operation and are
analyzed as isolated intersections during construction using PASSER II. During
the later phases, the two intersections changed to diamond interchanges
(Willowbend and Hiram Clarke) are analyzed with PASSER III. Traffic
volumes at these intersections are reduced for the post-construction analysis
because of the traffic diversion to the new freeway. The detours are typically at
night (10:00 p.m.-5:00 a.m.) and exist over a wide area. Computer simulation of
the detours is probably not the most efficient and timely solution. As a result,
several travel time studies were completed to determine the additional time
needed by drivers to traverse those detours and manual calculations similar to
that completed in Example 2 were used.
Step 3: Data Collection
Seventeen automatic tube counters were placed in the field for a week.
Two-hour manual turning movement counts were completed at the three
signalized intersections (US 90A at Willowbend, Stella Link, and Hiram Clarke).
Figure 35 presents the location of the automated tube counts.
Step 4: Data Reduction
The tube counts and manual turning movement counts were combined
to develop a turning movement diagram for each study intersection for the AM,
Mid-Day, and PM peak hour. Engineering judgment must be used to ensure that
the turning movement and automatic tube counts are reasonable and reliable.
After examination of the automatic tube counts and turning movement counts, it
was assumed that a majority of motorist delay during construction will be due to
delay at signalized intersections.
67
NOTES
Figure 35. Layout of Tube Counts for Example 5
68
NOTES
While a delay value for each intersection will be found for the AM, MidDay, and PM periods, these values must be used to find an approximate daily
road user cost. This is done by examining the hourly tube counts and
determining appropriate multipliers for each time period that will best
approximate the daily user cost (Figures 36 and 37). For this situation, the
“volume” counts as measured west of Hiram Clarke are used to identify how
long a time period occurs. The AM peak direction is eastbound. The eastbound
count shows that the AM multiplier should probably be two, since volumes
from 7:00 a.m.-9:00 a.m. are much higher than those before 7:00 a.m. and after
9:00 a.m. The PM peak direction is westbound and the westbound count shows
that volumes begin increasing at 3:00 p.m. and begin to significantly decrease
after 7:00 p.m. The multiplier in the PM should probably be two (more
conservative) or three. Over those four hours between 3:00 p.m. and 7:00 p.m.,
it is assumed that two times the peak hour delay could represent the overall
delay between 3:00 p.m. and 7:00 p.m. The remainder of the daily delay uses
the Mid-Day delay value times the remaining number of hours believed to
significantly contribute to the daily delay. From the tube counts, it appears the
Mid-Day delay could represent the hours of 6:00 a.m.-7:00 a.m., 9:00 a.m.-3:00
p.m., and 7:00 p.m.-9:00 p.m., a total of nine hours. While traffic volumes from
9:00 p.m. to 6:00 a.m. are relatively small, travel delays in the overnight period
should be relatively low. An estimation for overnight delays can be ignored or,
if in the engineer’s judgment a delay value is appropriate, use half or a third of
the Mid-Day delays for the overnight period. For this example, the total daily
delay would be found using the following equation:
Total Daily Delay (veh-hrs) = (AM Delay x 2) + (Mid-Day Delay x 9) + (PM Delay x 2).
Engineering judgment is necessary to distinguish these multipliers from
the hourly tube counts. If unsure, use the more conservative multiplier. In this
case, there may have been some question about if the PM period should count
for two or three hours. The selection of the two-hour multiplier would
typically be more conservative.
Step 5: Computer Simulation/Optimization Analysis and Travel Time Study
After determining that most of the delay to motorists will occur at the
signalized intersections in the study area, PASSER II or PASSER III are used to
simulate operations at these intersections for each geometric condition through
construction.
69
NOTES
Figure 36. Hourly Volume Tube Counts-US 90A Eastbound
@ Hiram Clarke
70
NOTES
TEXAS TRANSPORTATION INSTITUTE
WEEKLY VOLUME COUNT SUMMARY SHEET
Location: US 90A WB W. of Hiram Clarke
Date:
12-16-1997
Direction f Flow: US 90A WB
Channel: This is 2 of 2
Site No: 3010017
Day of Week:
MON
TUE
WED
THU
FRI
SAT
SUN
Weather:
Good
Good
Good
Good
Good
Good
Good
12/22
12/16
12/17
12/18
12/19
12/20
12/21
Time Hourly Hourly Hourly Hourly Hourly Hourly Hourly
Volume Volume Volume Volume Volume Volum Volume
e
0-1
173
171
178
224
418
271
1-2
113
71
81
129
261
170
2-3
80
58
63
77
155
135
3-4
41
39
41
38
103
62
4-5
55
57
66
79
72
54
5-6
160
186
197
166
108
69
6-7
375
507
468
449
184
116
7-8
660
827
828
771
373
242
8-9
701
708
716
438
225
9-10
571
612
730
511
404
10-11
621
650
690
674
427
11-12
717
777
817
638
541
12-13
814
912
886
739
560
13-14
770
841
937
735
727
14-15
785
910
1039
1024
823
687
15-16
1287
1288
1459
1417
938
715
16-17
1878
1874
2043
1869
808
667
17-18
2435
2561
2474
2010
877
667
18-19
1551
1588
1558
1342
647
686
19-20
847
855
897
892
682
590
20-21
541
571
614
692
469
470
21-22
427
464
477
553
422
362
22-23
329
395
401
764
351
296
23-24
297
326
390
503
351
335
AM Peak
1035
2035
2004
1936
995
583
(6-9) Volume
5-Day
7-Day
Avg
Avg
Hourly Hourly
Volume Volume
187
99
70
40
64
177
450
772
708
638
654
770
871
849
940
1363
1916
2370
1510
873
605
480
472
379
1930
239
138
95
54
64
148
350
617
558
566
612
698
782
802
878
1184
1523
1837
1229
794
560
451
423
367
1524
AM Peak
Highest Hour
660
-
827
828
817
674
541
772
698
PM Peak
(3-6) Volume
-
5600
5723
5976
5296
2623
2049
5649
4545
PM Peak
Highest Hour
-
2435
2561
2474
2010
938
727
2370
1837
1657 + 10377+
16942
17774
17775
11777
9478
17254
14966
Daily Total
+ --- ---
Indicates sum is not full 24-hour total.
Indicates data is unavailable.
Figure 37. Hourly Volume Tube Counts–US 90A Westbound
@ Hiram Clarke
71
NOTES
The intersection of Willowbend will be examined to determine delay
during Phase 1 during the PM peak hour as an isolated signalized intersection
(using PASSER II) and post-construction as a diamond interchange (using
PASSER III). The Phase 1 and post-construction intersection geometry and
volumes are shown in Figure 38. The post-construction volumes are lower
because the newly constructed mainlanes are carrying a majority of the through
traffic and the frontage road being non-continuous at the railroad tracks.
Figure 38. Willowbend Geometry and Turning Movements during
Phase 1 and Post Construction
72
NOTES
Phase 1, AM, Willowbend
1. Start PASSER II. Enter the PASSER II-90 program following the
instructions given by your instructor. Go to the main menu and choose option
2–read old data from disk. The program will ask you for a subdirectory and
filename. After choosing a subdirectory as instructed, choose the file
ex6p1com.dat. The file will load and return to the main menu screen.
2. Edit arterial data. From the main menu, choose option 3–edit data.
Once in the edit menu (Figure 39), choose option 1–edit arterial data. The
arterial data screen (Figure 40) allows the user to input general project
information, cycle length ranges for analysis, direction designation for
movement 2, output options. Note that the progression options have been
blacked out by the program because of the isolated intersection analysis.
Nothing needs to be changed on this screen. Press <ESC> to go back to the edit
menu.
Figure 39. PASSER II Edit Menu
73
NOTES
Figure 40. PASSER II Arterial Data Screen
3. Edit arterial movement data. At the edit menu, choose option 2–
edit intersection movements. The intersection movement screen appears (Figure
41) and the cursor is flashing on the northbound left turn volume. The
minimum phase lengths have already been input. Press the [F3] key. This
brings up the assistant function for left turns. There are three assistant functions
in PASSER II–the volume assistant, the saturation flow assistant, and the
minimum green assistant. The assistant is asking if the left turn should be
protected. Type in a <Y> for yes. Enter the southbound left turn volume from
Figure 38 (120 vehicles). The assistant then prompts the user for a peak hour
factor and has a default value of 1.00 shown. Press <ENTER> to accept this
value. The program confirms the left turn volume as 120 vehicles. Press
<ENTER> twice to remove the assistant function.
Use the down scroll key to move the cursor to the southbound left turn
saturation flow rate (1,805 vphg shown). From Figure 38, the left turn bay has
one lane, 12’ wide. Press [F3] to bring up the saturation flow rate assistant. The
program asks for the ideal saturation flow (1,900 vphg). Accept this value by
pressing the <ENTER> key. The assistant will prompt the user for a list of
values, accept the default values for all questions including the number of lanes
(enter 1), and the average lane width (enter 12). The program calculates a
saturation flow of 1,805 vphg. The minimum phase length has been set to 10
seconds.
74
NOTES
Figure 41. PASSER II Turning Movement Data Input Screen
Press the <ENTER> key again to move the cursor to the southbound
through volume. Press the [F3] key to prompt the assistant function. Enter
through traffic (530 vehicle) and right turn traffic (69 vehicle). The assistant
will total the throughs and right turns for a total of 599 vehicles. Follow the
assistant instructions until the cursor is on the through and right turn saturation
flow rate (1,800 vphg is now shown). From Figure 38, we see that there are two
twelve foot wide lanes on this approach. Press the [F3] key to activate the
assistant and follow the prompts, entering two lanes and 12 feet for the average
lane width. All other values remain the same.
The remaining approaches do not have left turn bays or protected left
turns. These approaches have relatively low left-turn volumes. After input of
the southbound volumes and saturation flow rates, the cursor goes to the
northbound left-turns. From Figure 38, this left-turn volume is zero, so enter
zero for left turn volume, saturation flow rate, and minimum green time. The
cursor will then move to the through volume for the northbound approach.
Press the [F3] key to bring up the assistant. Enter zero for left turns, 1,765 for
throughs, and 26 for right turns. Continue by calculating the saturation flow for
this approach (two 12’ lanes).
The cursor then moves
approach. This approach does
until “NO BAY” is highlighted.
time. Move the cursor back up
to the left turns for the eastbound Willowbend
not have a left turn bay, so press the [F2] key
Go down and enter zero for the minimum green
(using the scroll up key) to the left turn volume
75
NOTES
entry. Press the [F3] key to bring up the assistant. The assistant will tell you
that you will have “permitted phase operation”. Enter the left turn volume (176
vehicles). Once the cursor is back to the eastbound left turn volume, press
<ENTER> twice to go to the eastbound through movement. Continue to input
the data for the eastbound and westbound approaches. Figure 42 shows what
the screen should look like once all volumes and saturation flow rates have been
input.
Figure 42. PASSER II Data Input Screen Completed for Example 5
4. Edit signal phasing. Once back to the edit menu, the phase
sequences which PASSER II will optimize at the intersection needs to be
entered. Choose the third option, edit intersection phasing data. Because of the
type of left turn treatments at this intersection, PASSER II will allow the
selection only two possible phasings for the arterial and only one for the cross
street. Figure 43 shows the phasing pattern screen with no inputs. The two
possible phasing selections for the arterial are selected while the cross street
phasing must be chosen using engineering judgment. While any of the cross
street phasings could be chosen, the left turn 3 leading without overlap is chosen
since there are many more eastbound left turns. Figure 44 shows the phasing
pattern screen after phasings have been toggled for analysis. If the analyst is
unsure of the optimal phasing, the model may be rerun using each of the
possible choices and choosing the phasing resulting in the lowest delay. Press
<ESC> twice to return to the main menu. The file is complete and ready to run.
5. Save input file. Save the file first using option 4 on the main menu.
76
NOTES
Figure 43. PASSER II Phasing Pattern Data Entry Screen (not
completed)
Figure 44. PASSER II Phasing Pattern Data Entry Screen (completed)
77
NOTES
6. Run PASSER II. After designating a subdirectory and filename,
choose option 6 on the main menu to run the program. After running, PASSER
II will display the output menu (Figure 45). While each of the output choices
have important information, option 5–measures of effectiveness will summarize
the total system delay (in vehicle-hours). Figure 46 shows the arterial system
performance output. The total system delay number (28.0 vehicle-hours/hour)
will be used, along with the total system delay for the post construction
simulation, to calculate the additional user delay due to Phase 1 of construction.
Figure 46. PASSER II Arterial System Performance Output
78
NOTES
The next step is to evaluate the post construction conditions at the US
90A at Willowbend intersection using the PASSER III model.
1. Start PASSER III. Enter the PASSER III program following the
instructions given by your instructor. Go to the main menu (Figure 47) and
choose option FILE–data set choices. The program will ask you for a
subdirectory and filename. After choosing a subdirectory as instructed, choose
the file ex5post.dat. Press <ESC>, the file will load and return to the main
menu screen.
Figure 47. PASSER III Main Menu Screen
2. Edit arterial data. From the main menu, choose option EDIT–
define or modify data. Once in the edit menu (Figure 48), choose option
GENERAL. The general data screen (Figure 49) allows the user to input general
project information, and cycle length ranges for analysis. Note that the
progression options have been blacked out by the program because of the
isolated intersection analysis. Nothing needs to be changed on this screen.
Press <ESC> to go back to the edit menu.
3. Edit signal data. From the edit menu, choose option SIGNAL.
From the signal phasing screen (Figure 50) the user can name the cross street,
designate whether or not to have permitted left turns, input interior travel time
and interior queue storage. The signal phasings are also designated to let
PASSER III know which signal phasing patterns should be simulated or
optimized. No data on this screen needs editing. Press <ESC> to return to the
edit menu.
79
NOTES
Figure 48. PASSER III Edit Menu Screen
Figure 49. PASSER III Freeway Identification Data Input Screen
80
NOTES
Figure 50. PASSER III Signal Interchange Data Screen
4. Edit arterial movement data. At the edit menu, choose option
MOVEMENT–edit intersection movements. The intersection movement screen
appears (Figure 51) and the cursor is flashing on the northbound left turn
volume. The minimum phase lengths have already been input. Press the [F3]
key. This brings up the assistant function (Figure 52). Enter the input data,
including volumes and lane assignments. If a zero volume exists do not provide
a lane assignment for that movement, but assign another movement to that lane.
Figure 51. PASSER III Intersection Movement Screen
81
NOTES
Figure 52. PASSER III Assistant Function
Figure 53 shows what the screen should look like once all volumes and
saturation flow rates have been input.
Figure 53. PASSER III Intersection Movement Screen
Completed for Example 5
5. Run PASSER III. Choose the RUN option on the main menu.
After running, PASSER III will display the output menu (Figure 54). While
each of the output choices have important information, option GENERAL will
summarize the total intersection delay (in vehicle-hours) along with other
measures of effectiveness for the intersection for each cycle length analyzed
82
NOTES
Figure 54. PASSER III Output Menu
(Figure 55). The lowest total intersection delay number (1.50 vehicle-hrs/hr for
40 sec cycle length) will be subtracted from the Phase 1 intersection delay (28
vehicle-hrs/hr) to determine the additional delay of 26.5 vehicle-hour/hour for
the AM period.
Figure 55. PASSER III General Signalization Information Output Screen
83
NOTES
The AM delay would then be combined with the Mid-Day and PM
delay, each multiplied by the duration estimated for each period, to determine a
daily road user cost.
Step 6: Document Results
In a short technical memorandum, document the following: construction
sequencing, modeling techniques, traffic demands (with counts included at the
end of the memorandum, if necessary), delay results (report vehicle-hours of
delay for each time period and construction phase), the current value of time,
and the summary of estimated road user cost for each construction phase.
EXAMPLE 6: FREEWAY CONSTRUCTION USING FREQ10PC
Step 1: Review Traffic Control Plans
The first step in the user cost analysis is to review available traffic
control plans. Preliminary plans, with a 95 percent completion, illustrated three
construction phases:
Phase I–Construction of the center portion of the proposed roadway.
Traffic remains in existing conditions and no diversions are
necessary.
Phase II–Construction of the eastbound roadway. The eastbound traffic
is diverted to the center of the roadway, as constructed in Phase
I.
Phase III–Construction of the westbound roadway. Traffic is diverted
to the newly constructed roadway from Phase I and Phase II.
Review of the traffic control plans indicate that much of the delay will
occur on the frontage road due to the closure of several exit and entrance ramps
during Phase II and III. Minimal impact is anticipated for each phase on overall
freeway operation since two directional lanes are provided for each phase
during construction.
Step 2: Define Analysis Approach
To evaluate the impacts of construction on mainlane traffic, FREQ10PC
was used to simulate freeway operations. The input requirements of FREQ10PC
84
NOTES
consists of freeway design features available from the traffic control plans and
demand input parameters. The output of FREQ10PC provides a detailed
description of the freeway’s traffic performance.
To determine additional delay due to construction, assumptions were
made to provide a consistent user cost analysis.
•
•
•
•
No diversion to alternate routes;
Minimal impacts to cross street traffic;
No impacts from other freeway construction projects; and
Construction performed only one phase at a time.
As a result of narrow travel lanes, reduced and/or no shoulders, and
minimal clearances, as illustrated in the traffic control plans, flow rates, and
capacity are reduced on the freeway mainlanes. Drivers will compensate for
being laterally close together by slowing down and observing longer
longitudinal spacings. The adjustment factor from Table 3-2 of the HCM (Table
1) is based upon lane width, the distance to the nearest lateral obstruction,
whether lateral obstructions exist on one or both sides of the roadway, and the
number of lanes on the freeway are used to reduce capacity on freeway sections
during construction. Four lane freeways will experience more severe impacts
from restricted lane widths as opposed to six or eight lane freeways. The
following drawing illustrates the basic geometry of the study section.
Step 3: Data Collection
The primary element to a user cost analysis is the availability of traffic
demands within the project area. Freeway mainlane and ramp volume data,
within the project corridor, was required for this study.
After collecting the necessary data, entrance and exit ramp average
hourly volumes are summarized from beginning to end of the project area. The
85
NOTES
data is input on a spreadsheet illustrating traffic volumes on a typical weekday,
Saturday, and Sunday. Table 6 illustrates a summarized segment of traffic
volumes on I-10 East Freeway.
Table 6. Summarized Traffic Volumes on a Segment of I-10 East Freeway
I-10 (East) Eastbound–Spur 330 to Frontage Road
CrosbyLynchburg
Thompson
Time Begin
Origin
Spur 330
Entry
Exit
*M/L*
Exit
60
20
100
560
12:00 a
40
10
80
470
1:00 a
40
10
80
420
2:00 a
50
10
60
440
3:00 a
50
10
90
540
4:00 a
60
30
510
1,170
5:00 a
90
80
1,050
2,260
6:00 a
130
100
890
2,140
7:00 a
160
70
720
2,100
8:00 a
230
70
630
2,320
9:00 a
230
90
620
2,440
10:00 a
230
100
630
2,480
11:00 a
250
110
660
2,550
12:00 p
230
110
700
2,550
1:00 p
270
100
790
2,750
2:00 p
280
110
880
2,960
3:00 p
310
110
1,040
3,280
4:00 p
330
120
1,380
3,720
5:00 p
280
110
850
3,070
6:00 p
200
80
550
2,160
7:00 p
170
60
410
1,670
8:00 p
130
50
350
1,390
9:00 p
110
40
300
1,240
10:00 p
100
30
210
980
11:00 p
Total
45,660
13,580
1,630
4,030
Thompson
Entry
50
30
20
30
40
50
110
160
140
180
190
220
200
190
190
200
270
260
210
200
140
110
90
70
3,350
Frontage
Entry
0
0
0
0
0
0
10
10
10
10
10
10
10
10
10
10
10
10
10
10
0
0
0
0
140
Destination
M/L
470
390
330
370
450
680
1,320
1,390
1,440
1,720
1,880
1,950
1,960
1,930
1,990
2,120
2,320
2,400
2,270
1,700
1,290
1,070
960
770
33,170
Step 4: Data Reduction
The FREQ10PC model is not capable of simulating frontage road traffic
due to ramp closures in Phase II and Phase III. Therefore, a different approach
was used to evaluate delay assuming several factors:
•
•
•
Average speed of the frontage road is assumed at 35 miles/hour;
Impact from cross street traffic is excluded; and
Traffic normally using a closed ramp is assumed to progress
along the frontage road at 35 miles/hour to the next available
ramp.
After rerouting traffic, the corresponding volumes are multiplied by the
resulting additional travel time along the frontage road.
86
NOTES
Step 5: Computer Simulation/Optimization Analysis
Input data into FREQ10PC for existing conditions, eastbound
construction of Phase II, and westbound construction of Phase III in 24 hour
time slices. Freeway demand patterns are in terms of time slice specific user
supplied generated Origin-Destination (O-D) data and the occupancy
distribution at each on-ramp.
System delay is summarized for each simulation. Determine the delay
difference between each construction phase and the final geometry condition.
The calculated frontage road results are combined with the FREQ10PC mainlane
delay to determine the estimated delay for each phase. The estimated road user
cost is based on the current value of time.
This example will concentrate on the Phase II analysis for the eastbound
direction using the FREQ10PC model.
1. Start FREQ10PC. Open the FREQ10PC program and press any
key to continue until the option to press 0, 1, or 2 appears. Choose option 2
(Priority Entry Analysis) for this project; this option will be used for the majority
of user cost studies for freeway projects. The main menu will appear and since
we are starting a new problem, choose option 1.
2. General Description. The general description screen will appear,
allowing the user to input project information: route, direction, dates, and
comments. Press [F1] to edit the screen. The cursor will appear at the route
description. Type in the route being analyzed, which is I-10 Eastbound East
Freeway. Complete each portion of the project description by pressing
<ENTER> after each entry. Once the description of the project is complete, the
cursor will appear at the message, “Choose your option”, press [F10]. The
freeway design screen will appear.
3. Entering Freeway Geometry
Step 3a. From the traffic control plans you should be able to determine
the number of lanes and type of ramp for each freeway subsection. Beginning at
subsection 1 you are asked to input the number of lanes. Press <2> to indicate
that this is the number of lanes in subsection 1 and press <ENTER>.
NOTE: If you try entering an on-ramp in subsection 1 you will receive
an error message stating, “Subsection 1 may not have an on-ramp. Press any
key to continue.” FREQ10 will only allow a mainlane origin at the first
87
NOTES
subsection. In addition, the last subsection will only allow a mainlane
destination and therefore an off-ramp is not allowed.
Press <ENTER> to identify that there is no on-ramp at the beginning of
subsection 1. Press <1> to indicate the type of off-ramp at the end of subsection
1, as illustrated in the traffic control plans, is a right-sided one-lane exit.
TTI’s past experience has been to not use the “merge analysis” module
of the FREQ model for user cost studies. It is recommended that this option is
turned off by pressing <1> for each subsection.
The FREQ model also allows for the input of freeway grade and truck
percentage information. This information is used by the model only for
emissions and fuel consumption outputs and does not impact the operational
results. Therefore, it is not necessary to include these values.
Step 3b. A blue screen will now appear illustrating the geometry of the
data that was input for a two-lane roadway with a mainlane origin and a
mainlane destination with a one- lane exit on the right side. To edit this screen
press [F1]. You are asked to input a per lane ramp capacity limit default. To
follow the HCM guidelines, a capacity of 1,700 is input. Press <ENTER> and
you are prompted to a destination 1 limit. Input 1,700 since the HCM manual
states that 1,700 is the capacity of a one-lane exit ramp. Press <ENTER> and
you are asked to input a description of subsection 1. (Note: There is a limit of
23 characters). Type in an appropriate name for this section, such as I-10 East
EB Thompson X and press <ENTER>. From the traffic control plans, the
distances between each ramp is required for this section. For this case, the
length from the exit ramp to the previous ramp is 3,000 feet, type in 3,000. The
capacity of this section is calculated from an adjustment factor from Table 3-2 in
the HCM (Table 1). Enter 3,420 for the capacity and press <ENTER>. The final
item is to select the appropriate speed-flow curve which FREQ will use in its
analysis. A guideline used in the past is to choose the curve based upon the
freeway design speed. In this example, use the 70 mph curve.
Step 3c. The first subsection is complete. The next step is to complete
the freeway one section at a time, or ramp to ramp. From the traffic control
plans, the next ramp is Thompsons Entry. To add the next subsection, press
[F5]. Repeat Step 3a, Step 3b, and Step 3c until the project area is complete.
Once the input of each subsection is complete press [F10].
4. Inputting Time Slice Demands. The entering of design values for
the freeway is now complete. If you have corrections to make, such as adding,
deleting, or modifying the subsections then you would press <2> in the
88
NOTES
modification menu. The default occupancy data can be used for this example as
well as for all user cost studies.
To input traffic volumes, corresponding to each exit and entrance ramp,
press <4>. The screen prompts for the freeway time slice demand data screen.
Press [F1] to edit this screen. The number of time slices is 24 (24 hours in a
day), press <ENTER>. The number of time slices per hour is one, since traffic
counters in hourly volumes were used for this project, not 15-minute counts.
The vehicles per time slice, one, is equal to vehicles per hour, therefore default
the type of demand data to zero. Press [F10].
The blue screen showing is geometrically identical to the freeway design
screen that was input in step 3. The description given in step 3b is displayed in
the middle of the roadway. Press [F1] to edit the volume data, where one
depicts a time from 12:00 a.m. to 1:00 a.m. From the volume spreadsheet, enter
the mainlane traffic volumes prior to the I-10 Eastbound Thompson Exit.
After the traffic volume for each time slice for the mainlane is
completed, the cursor is prompted to the exit ramp volume. Enter the traffic
volumes for I-10 EB Thompson Exit in the 24 time slice column. Press [F4] to
enter traffic volumes for the next subsection. Repeat until the traffic volumes
for each subsection has been input. Press [F10] when complete.
5. Input Arterial and Other Options. At the modification menu,
press <5> to input arterial options. Depending on the scope of the project will
determine whether you will select an option (1) or to not select an option (0).
Press [F1] to edit the screen.
The goal of this analysis is to determine an estimate of total system
delay. Therefore, default (0) the irrelevant options: engage arterial, engage
freeway growth, speed curves, fuel rates, emission rates, and reduced capacities.
Select (1) disengage weaving analysis since this option is also irrelevant to the
study. Select (1) to calculate mainlane delays and unless free flow speeds are
given, use the posted speed limit for speeds used for calculation. In this
example, use 65 mph. Press [F10] when screen is complete.
6. Save Data Set to Disk File. From the modification menu, press <0>
to return to the main menu. Press <2> to save the file. Enter a file name at the
command prompt.
89
NOTES
7. Run FREQ10PE. Press <5> from the main menu to run the
simulation program. The following screen prompt will ask, “Current data set in
memory will be lost!”, “Continue anyway? Y/N”. Press <Y>.
The next screen asks the user to enter a one line run identification for
this FREQ10PE input file. It is important to enter a specific project name for
each project study. When there are several FREQ10PE outputs the one line run
identification is the only way to separate each project. For example, I-10 East
Eastbound Freeway–Phase II. Press <ENTER>.
The operations to be executed for this run is simulation only. Press <1>
and enter. Go to the print selection screens by pressing <0> and <ENTER>.
The development of contour maps are not required, but are ideal for visually
examining traffic impacts, therefore, exit the screen by pressing [F10]. Edit the
screen, press [F1], and select (1) freeway and arterial subsection design features
and freeway ramp capacity limits. Press [F10] to exit the screen. Press [F1] to
edit the screen and select (1) freeway summary table and freeway mainlane delay
summary table default other print results. Press [F10]. The command prompt
will ask if you want to save print selections in a file. This is a handy option in
that in most cases a similar output is desirable for al l user cost studies.
After you press <N>, the FREQ10PE program will run automatically
and the results are output to a separate file. The program will tell you the
simulation run was successful, if not then view the error message and correct the
error accordingly. The name of the output file is freq10pe.out and you can open
the output file in MS-DOS with an edit command or open the file in any file
editor.
In a short technical report, document the construction sequencing,
modeling techniques, traffic volumes, delay results obtained from the models,
the current value of time used, and a summary of the estimated road user cost
associated for each construction phase.
90
NOTES
EXAMPLE 7: TEMPORARY DAILY LANE CLOSURE–FREEWAY
WORK ZONE ON URBAN FREEWAY
This example determines the weekday road user cost for a daily
roadway closure on SH 288, south of the Houston CBD. This is basically an
eight-lane divided facility. This example illustrates the use of FREQ10PE to
simulate reduced capacity in a temporary work zone.
Step 1: Review Traffic Control Plan
A review of the TCP indicates that a two-lane closure is necessary to
repair a series of pavement failures in the left-most lane. The location of these
repairs is in the southbound direction of SH 288 between Binz and MacGregor
Streets. The contractor is limited to closing lanes between the hours of 8:00 a.m.
and 5:00 p.m. This construction will occur on weekdays only during daylight
hours.
Step 2: Define Analysis Approach
The basic study section is shown in Figure 56. The freeway is a basic
four- lane configuration with an auxiliary lane between the Southmore entry
ramp and MacGregor exit ramp. Because it is anticipated that no diversion will
occur during hours when the work zone is present, the FREQ10PE freeway
simulation tool could be used to determine the anticipated impact of the work
zone to traffic conditions. Two simulations will be performed: 1) a simulation
with the work zone present and reduced capacity due to the lateral obstructions
on one side of the travel lanes; and 2) a simulation with no work zone present to
determine the recurring levels of vehicle delay.
Figure 56. Study Selection and Freeway Geometry
91
NOTES
Ideally traffic counts would be completed at each entry and exit ramp as
well as across the mainlane section. However, limited resources reduce the data
collection to a weekday hourly mainlane count for a 24-hour period and 24-hour
total volume counts on all entry and exit ramps. The number and width of lanes
(four lanes–12' wide), distance between ramps, and speed limit (60 miles/hour)
are taken from the TCP or existing plans or other sources.
Step 4: Data Reduction
FREQ10PE requires volume data to be given in hourly flow rates. The
entry and exit ramp volumes (currently just 24-hour totals) must be converted to
hourly estimates. This can be done in two basic ways: 1) based on each hourly
percentage of the total 24-hour mainlane count; or 2) based on typical 24-hour
volume distributions from other facilities in the area, around the state, or around
the nation based on the characteristics (inbound or outbound direction, type of
facility, etc.) of the subject facility. Because we are fortunate to have a hourly
24-hour volume count on the mainlanes of SH 288, we can distribute the entry
and exit ramp volumes at the same hourly ratios as the mainlane hourly traffic
distribution. Figure 57 shows the actual data collected and the procedure to
estimate the entry and exit ramp volumes based on the mainlane hourly traffic
distribution.
Figure 57 is a spreadsheet-based calculation for the estimated ramp
volumes. The shaded volume numbers are the volumes found as a result of data
collection. The estimation procedure begins by calculating the percentage of the
total 24-hour volume for each hour of the day [for example, it is calculated that
1.07% (720/67,220) of the total 24-hour daily traffic occurs from 12:00 a.m. to
1:00 a.m.]. The estimated hourly volume for each ramp is then calculated by
multiplying the 24-hour ramp count by the hourly percentage [for example, it is
calculated that 106 (9880 x 1.07%) vehicles access the Southmore exit ramp].
All volumes used in the computer analysis are shown in Figure 57.
Step 5: Computer Simulation/Calculation of Estimated Road User Costs
Input all required data into FREQ10PE for the case with no capacity
reduction (no work zone present) to determine base level of delay, then edit the
file to incorporate capacity reductions representing the work zone during
prescribed hours of operation.
92
NOTES
Figure 57. Estimation of Hourly Entry and Exit Ramp Volumes
SH 288 (Southmore to MacGregor)
93
NOTES
1. Start FREQ10PE. Enter the FREQ10PE program following the
instructions given to you by your instructor. Go to the system menu and choose
Option 2–FREQ10PE Priority Entry Analysis. The main menu should now be
present. Select Option 1–start a new problem.
Pressing the [F1] key, edit the General Description screen to reflect this
analysis. Press <ENTER> to move to the next descriptor.
ROUTE:
DIRECTION:
BEGINNING TIME OF DATA:
ENDING TIME OF DATA:
DATE OF DATA:
DATE OF INVESTIGATION:
INVESTIGATOR:
COMMENTS:
SH 288
SOUTHBOUND
0:00
24:00
7/1/1998
7/15/1998
BASE CONDITION
Once the program is back to the control cursor, press [F10] to enter the
“edit subsection” screen.
At the edit subsection screen, press [F1] to enter the data elements for
the first subsection. Refer to Figure 56 for the number of lanes for subsection 1
(four lanes). This is the first subsection, so there is no on-ramp at the beginning
of the section, so keep the <0> by pressing the <ENTER> key. There is a onelane right side off-ramp at the end of subsection 1, so key a <1> at the prompt
for type of off-ramp at the end of the section. Keep the default values for the
remaining data elements unless this information is available. In this case, we
will keep the default values. Once the cursor is at the “Choose Your Option”
prompt, press the [F10] key to enter the geometry description edit screen.
On this screen, parameters such as ramp and freeway mainlane capacity,
subsection length, speed, and a subsection description are entered. Press [F1] to
edit the data. Change the default ramp capacity to 1,700 vphpl. The default
ramp capacity field is only available on this screen. Notice that the ramp
capacity at “DEST 1” immediately changes to 1,700 vph. Press <ENTER> until
the cursor is on the “ENTER SSEC DESCRIPTION” line. Enter an appropriate
descriptor such as “ML Orig to Smore ex”. Press <ENTER> to move to the
“LENGTH” field. Enter 5,000 as the length (dimensions in feet) for this
subsection. Press <ENTER> to move to the “CAPACITY” field and enter 8,400
(capacity was calculated using HCM methods and was found to be 2,100 vphpl).
Press <ENTER> to move to the “SPEED” field and enter 60 (FREQ10PE will
now use the speed-flow relationship based on free flow speeds of 60
94
NOTES
miles/hour). Sixty miles per hour is the speed limit of this roadway and is
estimated to be fairly close to actual average free flow speeds. Press <ENTER>
to accept the 60 value for “SPEED”. The cursor is back to the “Choose Your
Option:” position.
At the bottom of the screen are several options, among them are:
ED SCRN [F1]–edit the current screen;
CHNG DESIGN [F2]–which takes you back to the edit subsection
screen;
SCRN UP [F3]–which takes you to the previous subsection;
SCRN DWN [F4]–which takes you to the next subsection;
ADD/INSRT NXT SS [F5]–adds a subsection to the end of the current
subsection shown;
DELETE THIS SS [F6]–deletes the current subsection shown; or
SPLT THIS SS [F7]–which will divide the current subsection.
Assuming the correct information was entered for subsection 1, press
[F5] to bring the edit subsection screen back up. Enter the number of lanes and
types of on/off ramps according to Figure 56 for this subsection, leaving the
defaults for merge analysis, freeway gradient, percent trucks, and percent diesel
trucks. Note: The percent trucks and percent diesel trucks are used by the
program to calculate emissions. Typically, the effect of trucks is taken into
account in the calculation of capacity. Similar to the method outlined above for
subsection 1, enter data for subsections 2 through 6 and use the [F3] and [F4]
keys to check your simulation design. Feel free to ask any instructor for
assistance if needed.
After entering subsection data for subsection 6, choose option “EXIT” to
take you to the modification menu. Volume data is the next parameter to be
input to the program. Choose option 4–input/modify time slice demands, to
bring up the “freeway time slice demand data” edit screen.
This study will use 24 individual time slices, each representing a one
hour time period. Press [F1] to edit this screen. Keep the default 24-hour time
slices, but change the time slices per hour to <1>. Keep the default <0> for the
type of demand data since we have hourly time slice counts. The time at the
beginning of the first time slice will be 12:00 a.m., enter “00:00” and press
<ENTER>. The cursor should now be at the “Choose your option:” prompt.
Check the screen for errors and if there is a need to edit, press [F1], if not, press
[F10] to begin entering volume data.
95
NOTES
Enter volume data by hour for each origin (either mainlane origin or
entry ramp) or destination (either mainlane destination or exit ramp) by pressing
[F1] and entering each volume, then pressing <ENTER> after each hourly
volume is input. After all volumes on each screen are input, press [F4] to edit
the next set of input or output volumes. Check each set of volumes by pressing
[F3] (to go to the previous screen) or [F4] (to go to the next screen). Once all
volumes are input correctly, press [F10] at the “Choose your option” prompt to
return to the modification menu.
FREQ has several program parameters that must be customized for each
simulation. In the modification menu, choose option 5–input/modify arterial
and other optional data. Each of the elements and the inputs for this example of
the optional data edit screen are explained in brief:
Engage Arterial–FREQ has an optional route algorithm that can be used
to divert traffic from the mainlanes. This option is not used for this
simulation. Keep the default input <0>.
Disengage Weaving Analysis–FREQ will use algorithms to simulate the
effects of weaving. However, this option should be disengaged for this
analysis. The algorithms are assumed to be based on traffic behavior
(both driver and vehicle characteristics) present in the 1960's and may
not accurately reflect today’s driver behavior. Enter a <1> to
disengage the weaving analysis.
Calculate Mainlane Delays–Enter a <1> to engage the calculation of
mainlane delays. Another input will then appear on the screen, asking
for the speed to use for the calculations. The default is 55 mi/h, enter
“60” mi/h, which is the assumed free flow speed for this facility.
Engage Freeway Growth Factor–This option is useful to “grow”
volumes for future conditions. For this simulation, the input remains
<0>.
User Supplied Speed Curves–FREQ has the option for the user to input
speed curves for local conditions. For this simulation, keep the default
speed-flow curves by entering <0>. The program then asks for the
default speed curve. Enter <60> mi/h as the default speed curve.
User Supplied Fuel Rates–This gives the user the option to update the
cost of fuel. Not necessary for this type of simulation.
96
NOTES
User Supplied Emission Rates–This gives the user the option to update
the emissions characteristics of today’s fleet of vehicles. Not necessary
for this type of simulation.
Reduced Capacities–This option gives the user the ability to reduce
capacity on a particular subsection during various hours. Keep <0> for
this simulation, this is the option that is used in the “during work zone”
simulation to reduce the work zone capacity.
If all the options were input correctly, press [F10] at the “Choose your option”
prompt. If not, press [F1] to re-edit this screen. Because we changed the
default speed curve, FREQ gives the message “To assign speed curve other than
60 to a subsection, modify your freeway design”. This is the correct response
from the program. Pressing <ENTER> will return the user to the modification
menu.
No other data needs to be entered for this simulation. At the
modification menu, choose option 0–return to main menu. At the main menu,
choose option 2 to save this data set to a file. Enter the data file name as “288sb”
and press <ENTER> to save, (no extension is necessary). The main menu now
appears and we are ready to run the FREQ10PE program. Choose option 5–
make a FREQ10PE run. The program warns the user to make sure they have
saved the data set and asks if the user wants to continue, press <Y> to continue.
The program then asks for a one line identification for this run, type
“SH 288 SB BASE CONDITION” and press <ENTER> to accept. The program
then shows the run options menu. Choose option 1–simulation only. The
program then asks for output options, and asks the user if they want to use the
previous options used. At this point, the user can define a new set of outputs,
modify the existing data to be output, or use the existing data output. Choose
option 1 to modify the data to be output.
FREQ has numerous output pages that can be selected for inclusion in
the output file. However, only a selected few of the output sections are
necessary for the user to gain a clear picture of the simulation results. For this
reason, the output is limited to only five pages out of the almost 100 available.
The first output edit screen shows the contour maps that the program
can output. The most useful maps for road user cost studies are the speed,
queueing, and volume/capacity maps. Note that these maps are already selected,
so press [F10] to go to the next screen. The program then asks if the user wants
97
NOTES
to print out input data, in this case we do not, so press [F10] to go to the next
screen.
The next output data screen gives the user the option to print detailed
simulation results for each time slice. For road user cost studies, the summary
tables for the freeway performance and freeway delay MOE’s are needed in the
output file. Notice that <1> is entered for the first two options: “Freeway
summary table” and “Freeway mainline delay summary table”. These two pages
contain information on freeway performance for each time slice. Press [F10] to
prompt the program to save the user selections in a file. Press <Y> to save the
output options, and enter a title for the file: “USERCOST”. Press <ENTER> and
the FREQ10PE program executes the simulation and returns the user to the DOS
prompt. The output may be found in the file “freq10pe.out”. This file can be
viewed in any DOS editor or word processing program. Figure 58 shows a
copy of the output. The most important output for this study is the total
mainline delay in vehicle-hours (for this simulation 610.04 vehicle-hours).
NOTE: FREQ will not save the output file as any other name but
FREQ10PE.OUT. The user must rename the output file or it will be
overwritten the next time FREQ is executed.
The next simulation needs to reflect the reduced capacity caused by the
lane closures. We can use the same file (288sb) as the basis for this next
simulation.
2. Re-Start FREQ10PE. Enter the FREQ10PE program following the
instructions given to you by your instructor. Go to the system menu and choose
Option 2–FREQ10PE Priority Entry Analysis. The main menu should now be
present. Select Option 3–retrieve data set from disk file. The program prompts
the user for the filename, type “288sb” and press <ENTER>. The general
description edit screen then appears to confirm to the user what information is
contained in the file. Press <ENTER> to return to the main menu.
Immediately save this data file to another name to reduce the possibility
of overwriting the non-work zone data. Choose option 2–save data set to disk
file. The program asks if the user wants to overwrite the file named
“288SB.FRQ”. Press <N> and enter the new filename for this simulation:
“288SBWZ”, no extension is necessary. Press <ENTER> to save the file and
return to the main menu.
98
NOTES
7
1 INSTITUTE OF TRANSPORTATION STUDIES
UNIVERSITY OF CALIFORNIA, BERKELEY
FFFFFFFFFF
FFFFFFFFFF
FFF
FFF
FFFFFFF
FFFFFFF
FFF
FFF
FFF
FFF
FREQ10PE
FREQ10PE
RRRRRRRRR
RRRRRRRRRR
RRR
RRR
RRR
RRR
RRRRRRRRRR
RRRRRRRRR
RRR RRR
RRR RRR
RRR
RRR
RRR
RRR
REL T91
EEEEEEEEEE
EEEEEEEEEE
EEE
EEE
EEEEEEE
EEEEEEE
EEE
EEE
EEEEEEEEEE
EEEEEEEEEE
7/17/98
QQQQQQQ
Q*A.D.MAY*Q
QQQQQ
QQQQQ
QQQQ
QQQQ
QQQQ
QQQQ
QQQQ
QQQQ
QQQQ
QQQ QQQQ
Q*UC*
QQQQQ
Q*REGENTS*QQ
Q*1988*Q QQQ
1111
111111
1111
1111
1111
1111
1111
1111
1111
11111111
1:31 PM
PAGE
000000
000 000
000
000
000
0000
000 0 000
000 0 000
0000
000
000
000
000 000
000000
288 BASE
1. THIS IS A SIMULATION ONLY EXECUTION.
2. THERE ARE 1.0 TIME SLICES PER HOUR.
3. WEAVING ANALYSIS IS NOT ENGAGED.
4. NO ALTERNATE ROUTE IS PROVIDED.
5. SPEED FLOW DATA IS SUPPLIED BY THE PROGRAM.
6. THE MAINLINE DELAY CALCULATION IS ENGAGED AT 60. MPH.
7. FUEL DATA ARE SUPPLIED BY THE PROGRAM.
8. EMISSION RATES SELECTED FROM PROGRAM TABLES: 1995 - 85 DEGREES F.
1 INSTITUTE OF TRANSPORTATION STUDIES
FREQ10PE
REL T91
7/17/98
1:31 PM
UNIVERSITY OF CALIFORNIA, BERKELEY
*****
1
INPUT HAS BEEN COMPLETED
1 INSTITUTE OF TRANSPORTATION STUDIES
UNIVERSITY OF CALIFORNIA, BERKELEY
PAGE
2
*****
FREQ10PE
REL T91
SIMULATION BEFORE ENTRY CONTROL
7/17/98
1:31 PM
PAGE
3
************************************************************************************************************************************
************************************************************************************************************************************
FREEWAY SUMMARY TABLE
SIMULATION BEFORE CONTROL
************************************************************************************************************************************
***********************************************************************************************************************************
*TIME *
FREEWAY
*
RAMP
* TOTAL FREEWAY * TOTAL TRAVEL * AVERAGE * GASOLINE * HYDROCARB * CARBON * NITROUS * BEGIN*
*SLICE* TRAVEL TIME
*
DELAY
* TRAVEL TIME *
DISTANCE
* SPEED * CONSUMED * EMISSIONS * MONOXIDE * OXIDES * TIME *
************************************************************************************************************************************
*
*VEH-HR PAS-HR * VEH-HR PAS-HR * VEH-HR PAS-HR * VEH-MI PAS-MI *
MPH
* GALLONS * KILOGRAMS * KILOGRAMS*KILOGRAMS*
*
*
1 *
28.
36 *
0.
0 *
28.
36 * 1507.
1898 *
53.1 *
61. *
0.
*
5. *
1. * 0:00 *
*
*
*
*
*
*
*
*
*
*
*
*
*
2 *
16.
20.*
0.
0.*
16.
20.*
836.
1053.*
53.5 *
34. *
0.
*
2. *
1. * 1:00 *
*
*
*
*
*
*
*
*
*
*
*
*
*
3 *
16.
20.*
0.
0.*
16.
20.*
836.
1053.*
53.5 *
34. *
0.
*
2. *
1. * 2:00 *
*
*
*
*
*
*
*
*
*
*
*
*
*
4 *
11.
14.*
0.
0.*
11.
14.*
605.
763.*
53.6 *
24. *
0.
*
2. *
0. * 3:00 *
*
*
*
*
*
*
*
*
*
*
*
*
*
5 *
18.
22.*
0.
0.*
18.
22.*
952.
1199.*
53.4 *
38. *
0.
*
3. *
1. * 4:00 *
*
*
*
*
*
*
*
*
*
*
*
*
*
6 *
42.
52.*
0.
0.*
42.
52.* 2185.
2754.*
52.6 *
88. *
1.
*
7. *
2. * 5:00 *
*
*
*
*
*
*
*
*
*
*
*
*
*
7 *
125.
157.*
0.
0.*
125.
157.* 6198.
7810.*
49.8 *
242. *
1.
*
20. *
4. * 6:00 *
*
*
*
*
*
*
*
*
*
*
*
*
*
8 *
174.
219.*
0.
0.*
174.
219.* 8342. 10511.*
48.0 *
329. *
2.
*
28. *
5. * 7:00 *
*
*
*
*
*
*
*
*
*
*
*
*
*
9 *
145.
183.*
0.
0.*
145.
183.* 7126.
8979.*
49.0 *
279. *
2.
*
23. *
4. * 8:00 *
*
*
*
*
*
*
*
*
*
*
*
*
* 10 *
122.
154.*
0.
0.*
122.
154.* 6081.
7662.*
49.9 *
238. *
1.
*
19. *
4. * 9:00 *
*
*
*
*
*
*
*
*
*
*
*
*
* 11 *
135.
170.*
0.
0.*
135.
170.* 6661.
8393.*
49.4 *
261. *
2.
*
21. *
4. *10:00 *
*
*
*
*
*
*
*
*
*
*
*
*
* 12 *
125.
158.*
0.
0.*
125.
158.* 6222.
7839.*
49.8 *
243. *
2.
*
20. *
4. *11:00 *
*
*
*
*
*
*
*
*
*
*
*
*
* 13 *
129.
162.*
0.
0.*
129.
162.* 6391.
8053.*
49.6 *
250. *
2.
*
20. *
4. *12:00 *
*
*
*
*
*
*
*
*
*
*
*
*
* 14 *
139.
175.*
0.
0.*
139.
175.* 6850.
8631.*
49.3 *
268. *
2.
*
22. *
4. *13:00 *
*
*
*
*
*
*
*
*
*
*
*
*
* 15 *
169.
212.*
0.
0.*
169.
212.* 8127. 10240.*
48.2 *
320. *
2.
*
27. *
5. *14:00 *
*
*
*
*
*
*
*
*
*
*
*
*
* 16 *
212.
267.*
0.
0.*
212.
267.* 9906. 12482.*
46.7 *
393. *
3.
*
34. *
6. *15:00 *
*
*
*
*
*
*
*
*
*
*
*
*
* 17 *
293.
369.*
0.
0.*
293.
369.* 12866. 16211.*
43.9 *
517. *
4.
*
47. *
7. *16:00 *
*
*
*
*
*
*
*
*
*
*
*
*
* 18 *
377.
475.*
0.
0.*
377.
475.* 15510. 19542.*
41.2 *
632. *
5.
*
60. *
8. *17:00 *
*
*
*
*
*
*
*
*
*
*
*
*
* 19 *
220.
278.*
0.
0.*
220.
278.* 10221. 12879.*
46.4 *
406. *
3.
*
35. *
6. *18:00 *
*
*
*
*
*
*
*
*
*
*
*
*
* 20 *
139.
175.*
0.
0.*
139.
175.* 6826.
8601.*
49.3 *
267. *
2.
*
22. *
4. *19:00 *
*
*
*
*
*
*
*
*
*
*
*
*
* 21 *
100.
126.*
0.
0.*
100.
126.* 5066.
6383.*
50.6 *
199. *
1.
*
16. *
3. *20:00 *
*
*
*
*
*
*
*
*
*
*
*
*
* 22 *
91.
115.*
0.
0.*
91.
115.* 4639.
5845.*
51.0 *
183. *
1.
*
14. *
3. *21:00 *
*
*
*
*
*
*
*
*
*
*
*
*
* 23 *
75.
95.*
0.
0.*
75.
95.* 3879.
4888.*
51.5 *
154. *
1.
*
12. *
3. *22:00 *
*
*
*
*
*
*
*
*
*
*
*
*
* 24 *
60.
76.*
0.
0.*
60.
76.* 3139.
3956.*
52.0 *
125. *
1.
*
10. *
2. *23:00 *
*
*
*
*
*
*
*
*
*
*
*
*
************************************************************************************************************************************
*
*
*
*
*
*
*
*
*
*
*
*
*TOTAL* 2960.
3729.*
0.
0.* 2960.
3729.*140971. 177623.*
47.6 *
5585. *
36.
*
470. *
85. *
*
*
*
*
*
*
*
*
*
*
*
*
*
************************************************************************************************************************************
Figure 58. FREQ10 Output–Base Condition
99
NOTES
1 INSTITUTE OF TRANSPORTATION STUDIES
UNIVERSITY OF CALIFORNIA, BERKELEY
***** TOTAL MAINLINE DELAY
FREQ10PE
REL T91
SIMULATION BEFORE ENTRY CONTROL
(VEH-HRS) *****
DESIRED SPEED =
7/17/98
1:31 PM
PAGE
60.0 *****
TIME SLICE
DELAY
TIME SLICE
DELAY
TIME SLICE
DELAY
TIME SLICE
DELAY
TIME SLICE
DELAY
1
6
11
16
21
3.27
5.09
23.78
47.13
15.61
2
7
12
17
22
1.69
21.21
21.34
78.69
13.73
3
8
13
18
23
1.69
34.62
22.26
118.29
10.67
4
9
14
19
24
1.20
26.53
24.88
49.96
8.04
5
10
15
20
1.95
20.59
33.09
24.74
***** TOTAL DELAY =
4
610.04 VEH-HRS *****
1 INSTITUTE OF TRANSPORTATION STUDIES
UNIVERSITY OF CALIFORNIA, BERKELEY
FREQ10PE
REL T91
SIMULATION BEFORE ENTRY CONTROL
7/17/98
1:31 PM
PAGE
5
***** AVERAGE MAINLINE DELAY (MIN/VEH) *****
TIME SLICE DELAY
TIME SLICE DELAY
1
6
11
16
21
0.33
0.35
0.54
0.71
0.46
2
7
12
17
22
***** OVERALL AVERAGE DELAY =
1 INSTITUTE OF TRANSPORTATION STUDIES
UNIVERSITY OF CALIFORNIA, BERKELEY
TIME SLICE DELAY
0.31
0.51
0.52
0.92
0.44
TIME SLICE DELAY
3
8
13
18
23
0.31
0.62
0.52
1.14
0.41
TIME SLICE DELAY
4
9
14
19
24
0.30
0.56
0.55
0.73
0.39
5
10
15
20
0.31
0.51
0.61
0.54
0.727 MIN/VEH *****
FREQ10PE
REL T91
7/17/98
1:31 PM
PAGE
CONTOUR DIAGRAM OF
SPEED
BEFORE ENTRY CONTROL
TIME
SLICE ......................................................................................................
.
.
24 .5555555555555555555555555555555555555555555555555555555555555555555555555555555555555555555555555555.
23 .5555555555555555555555555555555555555555555555555555555555555555555555555555555555555555555555555555.
22 .5555555555555555555555555555555555555555555555555555555555555555555555555555555555555555555555555555.
21 .5555555555555555555555555555555555555555555555555555555555555555555555555555555555555555555555555555.
20 .4444444444444444444444444444444444444444444444444444444455555555555555555554444444444444444444444444.
19 .4444444444444444444444444444444444444444444444444444444444444444444444444444444444444444444444444444.
18 .3333333333333333333333333333333333333344444444444444444444444444444444444444444444444444444444444444.
17 .4444444444444444444444444444444444444444444444444444444444444444444444444444444444444444444444444444.
16 .4444444444444444444444444444444444444444444444444444444444444444444444444444444444444444444444444444.
15 .4444444444444444444444444444444444444444444444444444444444444444444444444444444444444444444444444444.
14 .4444444444444444444444444444444444444444444444444444444455555555555555555554444444444444444444444444.
13 .4444444444444444444444444444444444444444444444444444444455555555555555555555555555555444444444444444.
12 .4444444444444444444444444444444444444455555555555555555555555555555555555555555555555444444444444444.
11 .4444444444444444444444444444444444444444444444444444444455555555555555555554444444444444444444444444.
10 .4444444444444444444444444444444444444455555555555555555555555555555555555555555555555444444444444444.
9 .4444444444444444444444444444444444444444444444444444444444444444444444444444444444444444444444444444.
8 .4444444444444444444444444444444444444444444444444444444444444444444444444444444444444444444444444444.
7 .4444444444444444444444444444444444444455555555555555555555555555555555555555555555555444444444444444.
6 .5555555555555555555555555555555555555555555555555555555555555555555555555555555555555555555555555555.
5 .5555555555555555555555555555555555555555555555555555555555555555555555555555555555555555555555555555.
4 .5555555555555555555555555555555555555555555555555555555555555555555555555555555555555555555555555555.
3 .5555555555555555555555555555555555555555555555555555555555555555555555555555555555555555555555555555.
2 .5555555555555555555555555555555555555555555555555555555555555555555555555555555555555555555555555555.
1 .5555555555555555555555555555555555555555555555555555555555555555555555555555555555555555555555555555.
......................................................................................................
:
:
:
:
:
:
01
02
03
04
05
06
BEGIN
TIME
-
THE DIGIT LEVELS DENOTE THE FIRST DIGIT OF THE OPERATING SPEED (EX. 4 MEANS 40-49 MPH).
Figure 58. FREQ10 Output–Base Condition (continued)
100
23:00
22:00
21:00
20:00
19:00
18:00
17:00
16:00
15:00
14:00
13:00
12:00
11:00
10:00
9:00
8:00
7:00
6:00
5:00
4:00
3:00
2:00
1:00
0:00
6
NOTES
1 INSTITUTE OF TRANSPORTATION STUDIES
UNIVERSITY OF CALIFORNIA, BERKELEY
FREQ10PE
REL T91
7/17/98
1:31 PM
PAGE
7
CONTOUR DIAGRAM OF
QUEUE LENGTH
BEFORE ENTRY CONTROL
TIME
SLICE ......................................................................................................
.
.
24 .
.
23 .
.
22 .
.
21 .
.
20 .
.
19 .
.
18 .
.
17 .
.
16 .
.
15 .
.
14 .
.
13 .
.
12 .
.
11 .
.
10 .
.
9 .
.
8 .
.
7 .
.
6 .
.
5 .
.
4 .
.
3 .
.
2 .
.
1 .
.
.
.
......................................................................................................
:
:
:
:
:
:
01
02
03
04
05
06
BEGIN
TIME
-
23:00
22:00
21:00
20:00
19:00
18:00
17:00
16:00
15:00
14:00
13:00
12:00
11:00
10:00
9:00
8:00
7:00
6:00
5:00
4:00
3:00
2:00
1:00
0:00
BLANK DENOTES MOVING TRAFFIC. ASTERISK DENOTES QUEUED VEHICLES DUE TO MAINLINE CONGESTION.
M DENOTES QUEUED VEHICLES DUE TO MERGING. B DENOTES QUEUED VEHICLES DUE TO MAINLINE CONGESTION AND
MERGING.
(WHEN BOTH QUEUES EXIST, LENGTH OF DISPLAY REPRESENTS MAINLINE CONGESTION.)
1 INSTITUTE OF TRANSPORTATION STUDIES
UNIVERSITY OF CALIFORNIA, BERKELEY
FREQ10PE
REL T91
7/17/98
1:31 PM
PAGE
CONTOUR DIAGRAM OF
VOLUME/CAPACITY RATIO
BEFORE ENTRY CONTROL
TIME
SLICE ......................................................................................................
.
.
24 .1111111111111111111111111111111111111111111111111111111111111111111111111111111111111111111111111111.
23 .1111111111111111111111111111111111111111111111111111111111111111111111111111111111111111111111111111.
22 .2222222222222222222222222222222222222222222222222222222211111111111111111111111111111222222222222222.
21 .2222222222222222222222222222222222222222222222222222222222222222222222222222222222222222222222222222.
20 .3333333333333333333333333333333333333333333333333333333322222222222222222222222222222333333333333333.
19 .5555555555555555555555555555555555555544444444444444444444444444444444444444444444444444444444444444.
18 .7777777777777777777777777777777777777766666666666666666666666666666666666666666666666777777777777777.
17 .6666666666666666666666666666666666666655555555555555555555555555555555555555555555555666666666666666.
16 .5555555555555555555555555555555555555544444444444444444433333333333333333334444444444444444444444444.
15 .4444444444444444444444444444444444444433333333333333333333333333333333333333333333333333333333333333.
14 .3333333333333333333333333333333333333333333333333333333322222222222222222222222222222333333333333333.
13 .3333333333333333333333333333333333333322222222222222222222222222222222222222222222222333333333333333.
12 .3333333333333333333333333333333333333322222222222222222222222222222222222222222222222333333333333333.
11 .3333333333333333333333333333333333333322222222222222222222222222222222222222222222222333333333333333.
10 .3333333333333333333333333333333333333322222222222222222222222222222222222222222222222222222222222222.
9 .3333333333333333333333333333333333333333333333333333333322222222222222222223333333333333333333333333.
8 .4444444444444444444444444444444444444433333333333333333333333333333333333333333333333444444444444444.
7 .3333333333333333333333333333333333333322222222222222222222222222222222222222222222222333333333333333.
6 .1111111111111111111111111111111111111100000000000000000000000000000000000000000000000111111111111111.
5 .0000000000000000000000000000000000000000000000000000000000000000000000000000000000000000000000000000.
4 .0000000000000000000000000000000000000000000000000000000000000000000000000000000000000000000000000000.
3 .0000000000000000000000000000000000000000000000000000000000000000000000000000000000000000000000000000.
2 .0000000000000000000000000000000000000000000000000000000000000000000000000000000000000000000000000000.
1 .0000000000000000000000000000000000000000000000000000000000000000000000000000000000000000000000000000.
.
.
......................................................................................................
:
:
:
:
:
:
01
02
03
04
05
06
BEGIN
TIME
-
23:00
22:00
21:00
20:00
19:00
18:00
17:00
16:00
15:00
14:00
13:00
12:00
11:00
10:00
9:00
8:00
7:00
6:00
5:00
4:00
3:00
2:00
1:00
0:00
THE DIGIT LEVELS DENOTE V/C IN VALUES FROM 0 TO 10 (CORRESPONDING TO 0.0 TO 1.0). THE ASTERISK DENOTES SATURATION.
Figure 58. FREQ10 Output–Base Condition (continued)
101
8
NOTES
The only modification needing to be made for the work zone simulation
is to reduce the capacities during the work hours in the subsection that is
affected by the lane closures. To modify the data set, choose option 4–modify
data set. The modification menu appears.
Then select option 5–input/modify arterial and other optional data.
Press [F1] to edit the optional data screen. Keep all values the same, except
toggle the reduced capacity option to <1> to engage the reduced capacity
algorithm. Press <ENTER> to return to the “Choose your option:” prompt.
Among several edit options at the bottom of the screen is “F8: REDUCED CAP”.
Press [F8] to enter the edit capacity screen. In this case, the lane closure is at the
end of subsection 5, and no other subsections will have a reduced capacity.
Press the [F4] key until the subsection 5 screen is shown. Press [F1] to take the
cursor up to the capacity window. The hours of lane closure were 8:00 a.m. to
5:00 p.m., which corresponds to time slices 9 through 17. Change the capacities
of time slices 9 through 17 to “3,860” vph (this capacity results from an
additional 8% from the non-work zone condition found using the adjustment
factors for lateral obstructions). Once back to the “Choose your option”
prompt, press [F10] to return to the optional data screen. If no other changes
need to be made, press [F10] to return to the modification menu.
Note that we previously entered “BASE CONDITION” in the comments
section in the general description edit screen. Select option 1 to edit the general
description edit screen. Press [F1] and toggle down to the comments section.
Edit the comments to read “DURING WORK ZONE”. At the “choose your
option” prompt, press [F10] to return to the modification menu. Then select
option 0 to return to the main menu. Save the data set using option 2,
overwriting the filename “288SBWZ”. Choose option 5 to run the program. For
the one line identification, type “SH 288 SB WORK ZONE”. Press <ENTER>.
At the operations screen, select option 1–simulation only. The program then
prompts for the output options, and because we have previously defined the
typical output for road user cost studies, choose option 2 to accept the previous
option setup. The program executes the simulation.
The output may be found in the file “freq10pe.out”. This file can be
viewed in any DOS editor or word processing program. Figure 59 shows a
copy of the output. The most important output for this study is the total
mainline delay in vehicle-hours (for this simulation 1,268.23 vehicle-hours).
102
NOTES
7
1 INSTITUTE OF TRANSPORTATION STUDIES
UNIVERSITY OF CALIFORNIA, BERKELEY
FREQ10PE
FFFFFFFFFF
FFFFFFFFFF
FFF
FFF
FFFFFFF
FFFFFFF
FFF
FFF
FFF
FFF
FREQ10PE
RRRRRRRRR
RRRRRRRRRR
RRR
RRR
RRR
RRR
RRRRRRRRRR
RRRRRRRRR
RRR RRR
RRR RRR
RRR
RRR
RRR
RRR
EEEEEEEEEE
EEEEEEEEEE
EEE
EEE
EEEEEEE
EEEEEEE
EEE
EEE
EEEEEEEEEE
EEEEEEEEEE
REL T91
QQQQQQQ
Q*A.D.MAY*Q
QQQQQ
QQQQQ
QQQQ
QQQQ
QQQQ
QQQQ
QQQQ
QQQQ
QQQQ
QQQ QQQQ
Q*UC*
QQQQQ
Q*REGENTS*QQ
Q*1988*Q QQQ
7/17/98
1111
111111
1111
1111
1111
1111
1111
1111
1111
11111111
PAGE
1
7/17/98
1:32 PM
PAGE
2
7/17/98
1:32 PM
PAGE
3
000000
000 000
000
000
000
0000
000 0 000
000 0 000
0000
000
000
000
000 000
000000
288 WORK ZONE
1. THIS IS A SIMULATION ONLY EXECUTION.
2. THERE ARE 1.0 TIME SLICES PER HOUR.
3. WEAVING ANALYSIS IS NOT ENGAGED.
4. NO ALTERNATE ROUTE IS PROVIDED.
5. SPEED FLOW DATA IS SUPPLIED BY THE PROGRAM.
6. THE MAINLINE DELAY CALCULATION IS ENGAGED AT 60. MPH.
7. FUEL DATA ARE SUPPLIED BY THE PROGRAM.
8. EMISSION RATES SELECTED FROM PROGRAM TABLES: 1995 - 85
9. REDUCED CAPACITIES ARE SUPPLIED BY THE USER.
1 INSTITUTE OF TRANSPORTATION STUDIES
FREQ10PE
REL T91
UNIVERSITY OF CALIFORNIA, BERKELEY
*****
1:32 PM
INPUT HAS BEEN COMPLETED
1 INSTITUTE OF TRANSPORTATION STUDIES
UNIVERSITY OF CALIFORNIA, BERKELEY
DEGREES F.
*****
FREQ10PE
REL T91
SIMULATION BEFORE ENTRY CONTROL
************************************************************************************************************************************
************************************************************************************************************************************
**
**
**
FREEWAY SUMMARY TABLE
**
**
SIMULATION BEFORE CONTROL
**
**
**
************************************************************************************************************************************
************************************************************************************************************************************
*TIME *
FREEWAY
*
RAMP
* TOTAL FREEWAY * TOTAL TRAVEL * AVERAGE * GASOLINE * HYDROCARB * CARBON * NITROUS *BEGIN *
*SLICE* TRAVEL TIME *
DELAY
* TRAVEL TIME *
DISTANCE
* SPEED * CONSUMED * EMISSIONS * MONOXIDE * OXIDES * TIME *
************************************************************************************************************************************
*
* VEH-HR PAS-HR * VEH-HR PAS-HR * VEH-HR PAS-HR * VEH-MI PAS-MI *
MPH
* GALLONS * KILOGRAMS * KILOGRAMS*KILOGRAMS*
*
*
*
*
*
*
*
*
*
*
*
*
*
*
1 *
28.
36.*
0.
0.*
28.
36.* 1507.
1898.*
53.1 *
61. *
0.
*
5. *
1. * 0:00 *
*
*
*
*
*
*
*
*
*
*
*
*
*
2 *
16.
20.*
0.
0.*
16.
20.*
836.
1053.*
53.5 *
34. *
0.
*
2. *
1. * 1:00 *
*
*
*
*
*
*
*
*
*
*
*
*
*
3 *
16.
20.*
0.
0.*
16.
20.*
836.
1053.*
53.5 *
34. *
0.
*
2. *
1. * 2:00 *
*
*
*
*
*
*
*
*
*
*
*
*
*
4 *
11.
14.*
0.
0.*
11.
14.*
605.
763.*
53.6 *
24. *
0.
*
2. *
0. * 3:00 *
*
*
*
*
*
*
*
*
*
*
*
*
*
5 *
18.
22.*
0.
0.*
18.
22.*
952.
1199.*
53.4 *
38. *
0.
*
3. *
1. * 4:00 *
*
*
*
*
*
*
*
*
*
*
*
*
*
6 *
42.
52.*
0.
0.*
42.
52.* 2185.
2754.*
52.6 *
88. *
1.
*
7. *
2. * 5:00 *
*
*
*
*
*
*
*
*
*
*
*
*
*
7 *
125.
157.*
0.
0.*
125.
157.* 6198.
7810.*
49.8 *
242. *
1.
*
20. *
4. * 6:00 *
*
*
*
*
*
*
*
*
*
*
*
*
*
8 *
174.
219.*
0.
0.*
174.
219.* 8342. 10511.*
48.0 *
329. *
2.
*
28. *
5. * 7:00 *
*
*
*
*
*
*
*
*
*
*
*
*
*
9 *
147.
186.*
0.
0.*
147.
186.* 7126.
8979.*
48.4 *
280. *
2.
*
23. *
4. * 8:00 *
*
*
*
*
*
*
*
*
*
*
*
*
* 10 *
123.
155.*
0.
0.*
123.
155.* 6081.
7662.*
49.3 *
238. *
1.
*
20. *
4. * 9:00 *
*
*
*
*
*
*
*
*
*
*
*
*
* 11 *
136.
172.*
0.
0.*
136.
172.* 6661.
8393.*
48.8 *
261. *
2.
*
22. *
4. *10:00 *
*
*
*
*
*
*
*
*
*
*
*
*
* 12 *
126.
159.*
0.
0.*
126.
159.* 6222.
7839.*
49.2 *
244. *
2.
*
20. *
4. *11:00 *
*
*
*
*
*
*
*
*
*
*
*
*
* 13 *
130.
164.*
0.
0.*
130.
164.* 6391.
8053.*
49.0 *
251. *
2.
*
21. *
4. *12:00 *
*
*
*
*
*
*
*
*
*
*
*
*
* 14 *
141.
177.*
0.
0.*
141.
177.* 6850.
8631.*
48.6 *
269. *
2.
*
22. *
4. *13:00 *
*
*
*
*
*
*
*
*
*
*
*
*
* 15 *
172.
216.*
0.
0.*
172.
216.* 8127. 10240.*
47.4 *
321. *
2.
*
27. *
5. *14:00 *
*
*
*
*
*
*
*
*
*
*
*
*
* 16 *
218.
275.*
0.
0.*
218.
275.* 9906. 12482.*
45.5 *
395. *
3.
*
35. *
6. *15:00 *
*
*
*
*
*
*
*
*
*
*
*
*
* 17 *
656.
826.*
365.
461.* 1021.
1287.* 11721. 14768.*
17.9 *
776. *
14.
*
145. *
9. *16:00 *
*
*
*
*
*
*
*
*
*
*
*
*
* 18 *
643.
811.*
365.
461.* 1009.
1271.* 16027. 20195.*
24.9 *
883. *
14.
*
148. *
12. *17:00 *
*
*
*
*
*
*
*
*
*
*
*
*
* 19 *
220.
278.*
0.
0.*
220.
278.* 10221. 12879.*
46.4 *
406. *
3.
*
35. *
6. *18:00 *
*
*
*
*
*
*
*
*
*
*
*
*
* 20 *
139.
175.*
0.
0.*
139.
175.* 6826.
8601.*
49.3 *
267. *
2.
*
22. *
4. *19:00 *
*
*
*
*
*
*
*
*
*
*
*
*
* 21 *
100.
126.*
0.
0.*
100.
126.* 5066.
6383.*
50.6 *
199. *
1.
*
16. *
3. *20:00 *
*
*
*
*
*
*
*
*
*
*
*
*
* 22 *
91.
115.*
0.
0.*
91.
115.* 4639.
5845.*
51.0 *
183. *
1.
*
14. *
3. *21:00 *
*
*
*
*
*
*
*
*
*
*
*
*
* 23 *
75.
95.*
0.
0.*
75.
95.* 3879.
4888.*
51.5 *
154. *
1.
*
12. *
3. *22:00 *
*
*
*
*
*
*
*
*
*
*
*
*
* 24 *
60.
76.*
0.
0.*
60.
76.* 3139.
3956.*
52.0 *
125. *
1.
*
10. *
2. *23:00 *
*
*
*
*
*
*
*
*
*
*
*
*
************************************************************************************************************************************
*
*
*
*
*
*
*
*
*
*
*
*
*TOTAL* 3607.
4545.*
731.
921.* 4338.
5466.*140344. 176833.*
38.9 *
6102. *
56.
*
660. *
90. *
*
*
*
*
*
*
*
*
*
*
*
*
*
************************************************************************************************************************************
Figure 59. FREQ10 Output–Work Zone
103
NOTES
1 INSTITUTE OF TRANSPORTATION STUDIES
UNIVERSITY OF CALIFORNIA, BERKELEY
***** TOTAL MAINLINE DELAY
FREQ10PE
REL T91
SIMULATION BEFORE ENTRY CONTROL
(VEH-HRS) *****
DESIRED SPEED =
7/17/98
1:32 PM
PAGE
4
60.0 *****
TIME SLICE
DELAY
TIME SLICE
DELAY
TIME SLICE
DELAY
TIME SLICE
DELAY
TIME SLICE
DELAY
1
6
11
16
21
3.27
5.09
25.48
52.78
15.61
2
7
12
17
22
1.69
21.21
22.76
460.49
13.73
3
8
13
18
23
1.69
34.62
23.79
376.19
10.67
4
9
14
19
24
1.20
28.58
26.71
49.96
8.04
5
10
15
20
1.95
21.92
36.07
24.74
***** TOTAL DELAY = 1268.23 VEH-HRS *****
1 INSTITUTE OF TRANSPORTATION STUDIES
UNIVERSITY OF CALIFORNIA, BERKELEY
FREQ10PE
REL T91
SIMULATION BEFORE ENTRY CONTROL
7/17/98
1:32 PM
PAGE
5
***** AVERAGE MAINLINE DELAY (MIN/VEH) *****
TIME SLICE DELAY
TIME SLICE DELAY
1
6
11
16
21
0.33
0.35
0.58
0.81
0.46
2
7
12
17
22
***** OVERALL AVERAGE DELAY =
1 INSTITUTE OF TRANSPORTATION STUDIES
UNIVERSITY OF CALIFORNIA, BERKELEY
TIME SLICE DELAY
0.31
0.51
0.55
6.59
0.44
TIME SLICE DELAY
3
8
13
18
23
0.31
0.62
0.56
3.59
0.41
TIME SLICE DELAY
4
9
14
19
24
0.30
0.61
0.59
0.73
0.39
5
10
15
20
0.31
0.55
0.67
0.54
3.662 MIN/VEH *****
FREQ10PE
REL T91
7/17/98
1:32 PM
PAGE
CONTOUR DIAGRAM OF
SPEED
BEFORE ENTRY CONTROL
TIME
SLICE ......................................................................................................
.
.
24 .5555555555555555555555555555555555555555555555555555555555555555555555555555555555555555555555555555.
23 .5555555555555555555555555555555555555555555555555555555555555555555555555555555555555555555555555555.
22 .5555555555555555555555555555555555555555555555555555555555555555555555555555555555555555555555555555.
21 .5555555555555555555555555555555555555555555555555555555555555555555555555555555555555555555555555555.
20 .4444444444444444444444444444444444444444444444444444444455555555555555555554444444444444444444444444.
19 .4444444444444444444444444444444444444444444444444444444444444444444444444444444444444444444444444444.
18 .2222222222222222222222222222222222222222222222222222222222222222111111111114444444444333333333333333.
17 .2222222222222222222222222222222222222211111111111111111100000000000000000002222222222444444444444444.
16 .4444444444444444444444444444444444444444444444444444444444444444444444444443333333333444444444444444.
15 .4444444444444444444444444444444444444444444444444444444444444444444444444444444444444444444444444444.
14 .4444444444444444444444444444444444444444444444444444444455555555555555555554444444444444444444444444.
13 .4444444444444444444444444444444444444444444444444444444455555555555555555554444444444444444444444444.
12 .4444444444444444444444444444444444444455555555555555555555555555555555555554444444444444444444444444.
11 .4444444444444444444444444444444444444444444444444444444455555555555555555554444444444444444444444444.
10 .4444444444444444444444444444444444444455555555555555555555555555555555555554444444444444444444444444.
9 .4444444444444444444444444444444444444444444444444444444444444444444444444444444444444444444444444444.
8 .4444444444444444444444444444444444444444444444444444444444444444444444444444444444444444444444444444.
7 .4444444444444444444444444444444444444455555555555555555555555555555555555555555555555444444444444444.
6 .5555555555555555555555555555555555555555555555555555555555555555555555555555555555555555555555555555.
5 .5555555555555555555555555555555555555555555555555555555555555555555555555555555555555555555555555555.
4 .5555555555555555555555555555555555555555555555555555555555555555555555555555555555555555555555555555.
3 .5555555555555555555555555555555555555555555555555555555555555555555555555555555555555555555555555555.
2 .5555555555555555555555555555555555555555555555555555555555555555555555555555555555555555555555555555.
1 .5555555555555555555555555555555555555555555555555555555555555555555555555555555555555555555555555555.
.
.
......................................................................................................
:
:
:
:
:
:
01
02
03
04
05
06
THE DIGIT LEVELS DENOTE THE FIRST DIGIT OF THE OPERATING SPEED (EX. 4 MEANS 40-49 MPH).
Figure 59. FREQ10 Output–Work Zone (continued)
104
BEGIN
TIME
-
23:00
22:00
21:00
20:00
19:00
18:00
17:00
16:00
15:00
14:00
13:00
12:00
11:00
10:00
9:00
8:00
7:00
6:00
5:00
4:00
3:00
2:00
1:00
0:00
6
NOTES
1 INSTITUTE OF TRANSPORTATION STUDIES
UNIVERSITY OF CALIFORNIA, BERKELEY
FREQ10PE
REL T91
7/17/98
1:32 PM
PAGE
7
CONTOUR DIAGRAM OF
QUEUE LENGTH
BEFORE ENTRY CONTROL
TIME
SLICE ......................................................................................................
.
.
24 .
.
23 .
.
22 .
.
21 .
.
20 .
.
19 .
.
18 .
.
17 .***************************************************************************
.
16 .
.
15 .
.
14 .
.
13 .
.
12 .
.
11 .
.
10 .
.
9 .
.
8 .
.
7 .
.
6 .
.
5 .
.
4 .
.
3 .
.
2 .
.
1 .
.
.
.
......................................................................................................
:
:
:
:
:
:
01
02
03
04
05
06
BEGIN
TIME
-
23:00
22:00
21:00
20:00
19:00
18:00
17:00
16:00
15:00
14:00
13:00
12:00
11:00
10:00
9:00
8:00
7:00
6:00
5:00
4:00
3:00
2:00
1:00
0:00
BLANK DENOTES MOVING TRAFFIC. ASTERISK DENOTES QUEUED VEHICLES DUE TO MAINLINE CONGESTION.
M DENOTES QUEUED VEHICLES DUE TO MERGING. B DENOTES QUEUED VEHICLES DUE TO MAINLINE CONGESTION AND
MERGING.
(WHEN BOTH QUEUES EXIST, LENGTH OF DISPLAY REPRESENTS MAINLINE CONGESTION.)
1 INSTITUTE OF TRANSPORTATION STUDIES
UNIVERSITY OF CALIFORNIA, BERKELEY
FREQ10PE
REL T91
7/17/98
1:32 PM
PAGE
CONTOUR DIAGRAM OF
VOLUME/CAPACITY RATIO
BEFORE ENTRY CONTROL
TIME
SLICE ......................................................................................................
.
.
24 .1111111111111111111111111111111111111111111111111111111111111111111111111111111111111111111111111111.
23 .1111111111111111111111111111111111111111111111111111111111111111111111111111111111111111111111111111.
22 .2222222222222222222222222222222222222222222222222222222211111111111111111111111111111222222222222222.
21 .2222222222222222222222222222222222222222222222222222222222222222222222222222222222222222222222222222.
20 .3333333333333333333333333333333333333333333333333333333322222222222222222222222222222333333333333333.
19 .5555555555555555555555555555555555555544444444444444444444444444444444444444444444444444444444444444.
18 .8888888888888888888888888888888888888877777777777777777766666666666666666666666666666777777777777777.
17 .555555555555555555555555555555555555554444444444444444444444444444444444444**********555555555555555.
16 .5555555555555555555555555555555555555544444444444444444433333333333333333339999999999444444444444444.
15 .4444444444444444444444444444444444444433333333333333333333333333333333333337777777777333333333333333.
14 .3333333333333333333333333333333333333333333333333333333322222222222222222226666666666333333333333333.
13 .3333333333333333333333333333333333333322222222222222222222222222222222222225555555555333333333333333.
12 .3333333333333333333333333333333333333322222222222222222222222222222222222225555555555333333333333333.
11 .3333333333333333333333333333333333333322222222222222222222222222222222222226666666666333333333333333.
10 .3333333333333333333333333333333333333322222222222222222222222222222222222225555555555222222222222222.
9 .3333333333333333333333333333333333333333333333333333333322222222222222222226666666666333333333333333.
8 .4444444444444444444444444444444444444433333333333333333333333333333333333333333333333444444444444444.
7 .3333333333333333333333333333333333333322222222222222222222222222222222222222222222222333333333333333.
6 .1111111111111111111111111111111111111100000000000000000000000000000000000000000000000111111111111111.
5 .0000000000000000000000000000000000000000000000000000000000000000000000000000000000000000000000000000.
4 .0000000000000000000000000000000000000000000000000000000000000000000000000000000000000000000000000000.
3 .0000000000000000000000000000000000000000000000000000000000000000000000000000000000000000000000000000.
2 .0000000000000000000000000000000000000000000000000000000000000000000000000000000000000000000000000000.
1 .0000000000000000000000000000000000000000000000000000000000000000000000000000000000000000000000000000.
.
.
......................................................................................................
:
:
:
:
:
:
01
02
03
04
05
06
BEGIN
TIME
-
23:00
22:00
21:00
20:00
19:00
18:00
17:00
16:00
15:00
14:00
13:00
12:00
11:00
10:00
9:00
8:00
7:00
6:00
5:00
4:00
3:00
2:00
1:00
0:00
THE DIGIT LEVELS DENOTE V/C IN VALUES FROM 0 TO 10 (CORRESPONDING TO 0.0 TO 1.0). THE ASTERISK DENOTES SATURATION.
Figure 59. FREQ10 Output–Work Zone (continued)
105
8
NOTES
Step 3. Calculate additional delay and estimated road user cost.
The daily additional road user delay due to the work zone is:
1,268.23 610.04 = 658.19 vehicle-hours
And the associated daily road user cost is:
658.19 veh-hrs x 14.97 $/veh-hrs (1997 value of time) = $9,853.10 or $9,900
Step 6: Document Results
In a short technical memorandum, document the following: construction
sequencing, modeling techniques, traffic demands (with counts included at the
end of the memorandum, if necessary), delay results (report vehicle-hours of
delay for each time period and construction phase), the current value of time,
and the summary of estimated road user cost for each construction phase.
106
NOTES
SUMMARY
107
NOTES
REFERENCES
1.
2.
3.
4.
5.
Highway Capacity Manual. Transportation Research Board, Special
Report 209, Third Edition, 1994.
Chui, Margaret K. and W.F. McFarland, The Values of Travel Time:
New Estimates Developed Using a Speed Choice Model. TTI Research
Report 396-2F, 1985.
McFarland, W.F., R.J. Kabat, and R.A. Krammes, Comparison of
Contracting Strategies for Reducing Project Construction Time. TTI
Research Report 1310-1F, March 1994.
Chang, Edmond, Carroll J. Messer, Arterial Signal Timing Optimization
Using PASSER II-90: Program User’s Manual. TTI Research Report
467-2F, 1991.
Fambro, Daniel B., Nadeem A. Chaudhary, Carroll J. Messer, and Rene
U. Garza., A Report on The Users Manual for the Microcomputer
Version of PASSER III-88. TTI Research Report 478-1, September 1988.
108