1
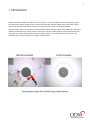
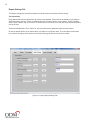
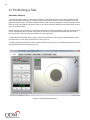
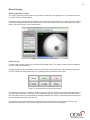
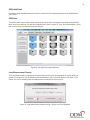
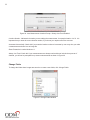
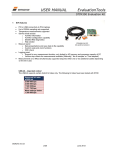
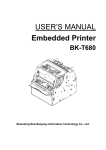
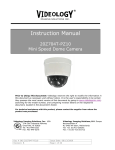
Optical Design Manufacturing, Inc.
inSpec
Software User Manual
Fiber Inspection and Testing Procedures
Technical Support Document
2
Table of Contents
I.Introduction................................................................................................... 3
II.Requirements............................................................................................... 5
III.
inSpec Installation........................................................................................ 6
IV.
Connecting ODM Devices to your PC.............................. ............................. 8
V.
inSpec Overview............................................................................................ 9
VI.
Performing a Test........................................................................................ 10
VII.
Technical Support.......................................................................................... 11
.
3
I. Introduction
When connected to ODM’s VIS 400-HDP, VIS 300 USB, or VCM 410 USB field connector inspection system,
the ODM inSpec software allows users to inspect and save fiber endface images and pertinent data. inSpec
also provides automated Pass/Fail analysis according to the IEC 61300-3-35 industry standard.
See the image below for an example of the automated Pass/Fail analysis inSpec offers. Maintaining clean fiber
endfaces is essential to the proper function of fiber optic systems. ODM inspection microscopes provide clear,
high-resolution images to be analyzed using the inSpec software. This manual will serve as a guide to the
installation and use of the software to complete closeout reports.
4
Figure 1: inSpec Main Screen - Landscape Mode
inSpec Tablet Support
inSpec is designed to be touch-friendly and supports screen rotation to make it more convenient when used
with tablets. Figure 1 illustrates the main screen in the landscape mode; Figure 2 illustrates the main screen in
the portrait mode.
In this manual, all subsequent figures will be illustrated in the landscape mode, but the operation of inSpec will
be the same in the portrait mode. Only the button sizes and locations are changed to accommodate the different orientation.
Figure 2: inSpec Main Screen - Portrait Mode
5
II. Requirements
Operating System Compatibility
•
Windows 8
•
Windows 7
•
Windows Vista
Software Requirements
•
Microsoft .NET Framework 4 or newer
•
Microsoft Visual C++ x86 Redistributable
Windows Driver Requirements
•
Imager Support
The ODM VIS 400-HDP Probe utilizes the UVC 1.1 driver included with Windows. No other driver installation is needed.
Videology driver for ODM VIS 300 or VCM 410
•
Serial Port Support
If ODM’s RP 460 power meter is to be used, FTDI serial port driver can be downloaded from
http://www.ftdichip.com/Drivers/CDM/CDM20824_Setup.exe
6
III. inSpec Installation
CD Installation
1. Insert the ODM inSpec CD into a PC running Windows 8, Windows 7, or Windows Vista
2. If the program does not start automatically, open the ODM/VIS folder on the CD
3. Double-click setup.exe and follow the software installation instructions
Web Installation
1. Go to http://www.odm-inc.com/Downloads.html
2. Click the Download button for ODM Complete Software Package
3. Choose Save
4. After the download completes, view download
5. Choose Run
6. Choose Unzip
7. After the ODM Installer starts, choose Install
8. Follow the installation instructions
Microsoft .NET Framework
If you are prompted for a newer version of .NET Framework and you are not provided with a link during inSpec
installation, it can be downloaded from Microsoft at
http://www.microsoft.com/download/en/details.aspx?id=24872. Alternately, it is included on the inSpec installation CD in folder Microsoft .NET Framework 4. To install it, double click on dotNetFx40_Client_x86_x64-1.
Microsoft Visual C++ Redistributable
If you are prompted that you need to install Microsoft Visual C++ Redistributable and you are not provided with
a link during inSpec installation, it can be downloaded from Microsoft at
http://www.microsoft.com/en-us/download/details.aspx?id=5555. Alternately, it is included on the inSpec installation CD in folder Microsoft C++ Redistributable. To install it, double click on vcredist_x86.exe.
7
Manual Installation of inSpec Software
If you want to install inSpec manually, you can do so by navigating to folder \ODM\VIS on the installation CD
and double clicking setup.exe
If you downloaded the software from ODM’s website (http://www.odm-inc.com/Downloads.html), extract the
files on your PC by running the installer. After the installer is finished, close it then navigate to
C:\ODM Software\VIS and double click on setup.exe.
Manual Installation of Software Drivers
Before connecting your ODM devices to your PC, please load the required drivers by following the instructions
below.
Installation of FTDI Chip Driver for the ODM RP 460
To install the FTDI Chip Windows driver for the RP-460, navigate to the FTDICHIP folder of the CD
included in the installation package and double-click on CDM20824_Setup and follow the installation
instructions. If you don’t have a CD, you can download the FTDI Chip driver at
http://www.ftdichip.com/Drivers/CDM/CDM20824_Setup.exe
Installation of UVC Driver for VIS 400-HDP
No driver installation is required for the VIS 400-HDP. It is included with Windows XP SP3, Windows Vista,
Windows 7 and Windows 8.
Installation of Videology Driver for the VIS 300 and VCM 410
Both the ODM VIS 300 and VCM 410 require a Videology Windows driver for proper operation. If the serial
number on the VIS 300 or VCM 410 has a “C” appended to the end, navigate to the Videology/Windows 32-64bit Cypress folder of the installation package, double–click on SetupVid and follow the installation instructions.
If there is no “C” after the serial number, then go to web page http://www.videologyinc.com/download.htm and
download the SFT-04040 Windows driver and follow the installation instructions.
8
IV. Connecting ODM Devices to Your PC
Test Equipment
The VIS 400-HDP or VIS 300 can be used for visual inspection with the ODM inSpec software.
The RP 460 power meter can be used to record power (dBm) or loss (dB) measurements.
VIS 400-HDP Visual Inspection Scope
Plug the VIS 400-HDP into a USB port on the PC. Power is supplied by the USB port. Wait for Windows to load
the UVC driver. You should see Windows report a message indicating the driver loaded successfully.
VIS 300 Visual Inspection Scope
Using the supplied USB cable, plug the ODM VIS-300 into a USB port on the PC. Apply power to the device.
Wait for Windows to load the driver you installed in the previous section. You should see Windows report a
message indicating the Videology Camera driver loaded successfully.
RP 460 Optical Power Meter
Plug the RP 460 into a USB port on the PC using the supplied USB cable. Apply power to the device.Wait for
Windows to load the driver you installed in the previous section. You should see Windows report two messages
indicating the drivers loaded successfully.
9
V. inSpec Overview
Starting inSpec
Run ODM inSpec by double-clicking on the inSpec icon on your desktop. Figures 3 and 4 illustrate the functions for each item on the main screen.
Tab Selection
Live or Saved
Image Display
Window
PASS/FAIL
Indicator
Automatic Analysis
Button
Grading Circles
Status Bar
Optical Power Meter Control
and Measurement
Figure 3: inSpec Functions - Automatic Grading Mode
Tab Selection
PASS/FAIL
Indicator
Live or Saved
Image Display
Window
Sample Obstruction
Overlay Circles
Pass/Fail Buttons
Hide/Show
Grading
Grading Circles
Status Bar
Optical Power Meter Control
and Measurement
Focus Bar
Figure 4: inSpec Functions - Manual Grading Mode
10
Tool Tips
Holding the cursor over a button will display a tool tip describing its function. See Figure 5.
Figure 5: Tool Tips
Main Tab
The Main tab contains all of the functions to perform a test, but before starting a test, the technician should set
up the appropriate settings by selecting the settings tabs. See the Settings Tabs descriptions below.
Analyze
After the appropriate setup has been selected under the settings tabs, the technician can perform an analysis
of a fiber end face.
The Analyze button is enabled when a fiber cable is plugged into the ODM VIS 400-HDP and it is focused.
Capture Image
When a live image is displayed in the image window, the Capture Image button will be enabled on the Main
tab. Clicking on Capture Image will cause the Save File window to open. Here you can create a new folder to
save the image or save it to an existing folder.
When a fiber end image is saved, the information under the Report Settings tab (Customer Company Name for
example) is saved as well. Clicking on any of the saved images will load that image and the information about
the image into inSpec. When a report is created, the customer information is reported with the image.
Figure 6: Capture Image File Screen
11
Live Image
If a saved or analyzed image is displayed on the main tab, clicking on the Live Image button will display the live
stream from the VIS 400-HDP or VIS 300.
Enlarge
Clicking the Enlarge button will display a larger version of the image displayed on the main screen, as shown
in Figure 7, below. Click the Windows X button in the upper right corner or click the Exit button to close the
Enlarge image window
Click to Close
Window
Figure 7: Enlarged Image Window
Magnify and Center
Clicking the Magnify and Center button magnifies the image displayed approximately 2.5 times and centers the
fiber end face. See Figure 8 below.
To return to the normal view, click the Full Field of View button.
Figure 8: Magnify and Center Screen
12
Voice On/Off
Voice commands can be used in situations when both hands are busy. Voice commands can be turned on and
off by clicking the Voice Commands button. When on, command feedback is given as illustrated in Figure 9.
When the command feedback box is green, the command was understood. Yellow indicates that a command
was understood but may have been misinterpreted. Red indicates the command was not understood.
Below are a few voice commands that can be used rather than clicking on a button
Button
Capture Image
Hold/Read*
Save/Measure*
Magnify and Center*
Analyze
Voice Commands Off
Voice Command
“Capture Image” or “Cheese”
“Hold” or “Read”
“Save” or “Measure”
“Center Image” or “Full View”
“Analyze”
“Disable Voice
*For these commands you can use the same command to toggle between button states. For example: When
you say “Center Image,” inSpec will magnify and center the image. Rather than saying “Full View,” you can say
“Center Image” again to return back to full view.
Figure 9: Voice Command Feedback
13
Focus Bar
The blue focus bar is located below the fiber end image on the Main tab. It is visible when a live image is
displayed and the image is not totally blurred. It is an aid to help focus the image. When the focus ring on
the ODM probe is rotated and the image becomes more focused, the red peak bar stays at the best focus
achieved. Each time a new peak is reached the image associated with the peak is saved in a temporary buffer.
If the image becomes unfocused again after a peak is reached, the peak focused image is still saved. When
the Analyze button is pressed the best focused image is used not the image displayed at the time the Analyze
button was pressed. This helps to ensure the best focused image is used for the analysis.
Figure 10: Unfocused Fiber End
Figure 11: Focused Fiber End
Figure 12: A Focused Image is Needed to Perform a Successful Automated Analysis
Exit
inSpec will close when the Exit button is clicked.
14
Reports Tab
The Reports tab contains the list of saved fiber end images. Using these images, there are two reports that can
be created, VIS Reports and Site Loss Reports.
VIS Report information includes fiber end face image(s) and power meter measurements for the selected test.
Site Loss report creates an Excel report of all the images stored in the present selected folder.
Figure 13: Reports Tab
VIS Report Button
To create a VIS report, select one or two fiber end images and click VIS Report.
To include power measurements in a report, the technician must first select one or two images that he or she
would like to associate with the power measurement, then click the Save button on the Main tab when an appropriate loss measurement is displayed.
Site Loss Report Button
Creates an Excel Report of all fiber end images in the selected folder.
Clear Check Boxes Button
Clears all check boxes.
Change Folder Button
Permits the technician to change or create a new folder. Ideally, a folder should be created for each test site.
Doing this will allow site loss reports to be created easily.
15
Test Settings Tab
The Test Settings Tab contains options that control the analysis mode, camera settings, and IEC specifications
for the automatic analysis.
Analysis Mode
To change the mode of grading click the Test Settings tab and choose Automatic or Manual in the Analysis
Mode group. If a VIS-300 is selected for a video source, you will not be allowed to choose the Automatic mode.
Fiber Type
The two types of fiber the technician may choose are single-mode and multi-mode. To ensure that the correct
size critical zone is used during analysis, the technician must choose the correct fiber type. Single-mode diameter is 25μm, multi-mode is 65μm.
Video Source
The technician can select a video source by clicking on the drop-down box in the Video Source group. ODM
probe names are “ODM HDP Probe,” “USB 2.0 Camera,” and “Videology Camera.”
Camera Settings
Image controls are only available when inSpec is in the manual analysis mode. You can adjust image brightness, contrast, sharpness, and gamma using these controls.
IEC Profile 61300-3-35
Figure 14: Image Controls
When performing a test using automatic analysis, technicians must choose the IEC specification to compare
defect sizes and locations. The specification is used to determine whether the end face passes or fails the test.
Figure 15: inSpec Test Settings Tab
16
Report Settings Tab
The Report Settings tab contains information to help annotate a saved fiber end face image.
Test Information
Drop-down boxes contain information that is likely to be repeated. These lists can be added to by clicking the
Add button next to the item. These are labeled Customer Company Name, Contact Name, Testing Company
Name, Tester’s Name, and Test Location. To delete an item from a list, select the item and press the Del button
next to the item.
Text boxes labeled Fibers From, Fibers To, and Comment can be updated to reflect the test location.
On the top header portion of the reports there is a space for a company name. The name that is entered into
the Customer Company Name space on the Report Settings tab will be used to fill the header.
Figure 16: inSpec Report Settings Tab
17
Pass/Fail Settings Tab
Loss measurement pass/fail limits can be set and enabled on this tab as shown in Figure 17. If a limit is enabled and the power meter measurement exceeds that set limit, the measurement is marked as “Fail” on the
reports.
Figure 17: Pass/Fail Settings Tab
Help Tab
The Help tab contains the inSpec version number and software manual. It also contains user-specific guides
and endface zone details.
Figure 18: Help Tab
18
VI. Performing a Test
Automatic Analysis
To perform automatic grading, connect the fiber to the VIS 400-HDP and focus the image. If the fiber needs
to be cleaned,clean it using a dry or wet/dry method and reconnect the fiber to the VIS 400-HDP, focus and
press the Analyze button. The inSpec software performs and reports the analysis by comparing defects to the
IEC61300-3-35 specification and reports Pass or Fail with the number of defects that caused a failure in each
zone on the fiber endface.
Defects that are colored in blue were found but are smaller than the specified defect size limit for the zone and
are not considered a failure. Defects colored red are equal to or larger than the specified size and cause a
failure. See IEC-61300-3-35 2009 specification for more information.
To show detailed information about a defect, mouse-over the defect so that a pop-up window appears below
the Pass/Fail box in the upper left hand corner. See Figure 19.
To change the specification that is used to determine pass or fail, choose the Test Settings tab and choose the
desired specification before performing a test.
Figure 19: Automatic Grading Screen
19
Manual Grading
Grading Obstruction Overlay
The overlay is used to judge the size of any particles or scratches in the grading zones. The zones are based
on the IEC 61300-3-35 specification.
Clicking the Show Grading button will display grading circles as illustrated below. The overlay can be moved by
clicking and dragging on the top bar of the overlay. To move the overlay to the home position (the lower righthand corner of the image), click the Home button.
Figure 20: Sample Obstruction Overlay
Grading Circles
To show or hide grading circles, click the Show/Hide Grading button. The grading circles (zones) are based on
the IEC 61300-3-35 specification.
Using the grading circles provided as a guide, the technician can judge and mark a fiber endface image Pass
or Fail by clicking the appropriate button. If no grading is desired, press the None button.
Figure 21: None/Pass/Fail and Show/Hide Buttons
The grading circles can be centered on the fiber core by pointing the mouse at core center and right-clicking or
by clicking the Locate button. They also can be nudged left, right, up or down by first clicking the fiber image
then using the arrow keys on the keyboard. Pressing and holding the Shift key and pressing the arrow keys will
move the grading circles ten pixels at a time.
The grading circles can be resized by first clicking the fiber image and then using the mouse wheel, or by
pressing and holding the Ctrl key and pressing the Up or Down arrows on the keyboard.
20
Figure 22: Grading Circles Displayed
Figure 23: Grading Circles and Pass Displayed
21
OPM Hold/Read
Clicking the OPM Hold/Read button will freeze or resume the live reading streamed from the ODM RP 460
power meter.
OPM Save
To save the power meter measurement, first select one or two fiber end images on the Reports tab and click
OPM Save on the Main tab. You will be prompted by the screen in Figure 25. (Hint: Press and hold the Ctrl key
and click the image if you want to select two images.)
Figure 24: Two Fiber End Images Selected
Loss Measurement Prompt
The Loss Measurement prompt assists you when saving power meter measurements for reports. When you
choose No in Figure 25, you are indicating the measurement is just for the trunk portion of the cable. If you
choose Yes you are indicating that the measurement includes the top sector jumper.
Figure 25: Loss Measurement Location Prompt - Always Just Trunk Disabled
22
Figure 26: Loss Measurement Location Prompt - Always Just Trunk Enabled
Location Number: Indicates the location you are making the measurement, for example location 1 of 12. It is
important that you enter the correct location number, if you do not your reports will not be accurate.
Increment Automatically: Check this if you want the location number to increment by one every time you make
a measurement and save it to an image file.
Reset: Resets the Location Number to 1.
Always Just Trunk: Check this if your measurements are always trunk and do not include the top sector. If
checked, you will not be prompted for top sector measurements as shown in Figure 26.
Change Folder
To change the folder where images are saved or to create a new folder, click Change Folder.
Figure 27: Change Folder Window
23
Reporting
inSpec permits the user to create reports. Two types of reports are provided: VIS Report and Site Loss Report.
The VIS Report information includes fiber end face image(s) and power meter measurements for the selected
test. The Site Loss Report information includes all the tests for the folder selected and displayed at the bottom
of the inSpec screen, Figures 28 and 29 illustrate these reports.
VIS Report
Clicking on the VIS Report button will display results similar to the figure below. To display the results you must
first select one or two images in the image list before clicking VIS Report. (Hint: Hold Ctrl key while clicking to
select two images.)
Figure 28: VIS Report Screen
24
Site Loss Report
If you have Microsoft Excel installed on your computer, clicking on the Site Loss Report button will create a site
loss report of all the optical power measurements made that are associated with the end face images presently
displayed in the selected folder.
Figure 29: Site Loss Report
25
VII. Technical Support
If you need technical assistance or have specific questions about any procedures or guidelines in this guide,
please contact our technical support team:
During Business Hours
8AM to 5PM Eastern Standard Time
Please call us at 603-524-8350
Evenings/Weekends
Email us at [email protected]
Please include your phone number and we will
contact you.
On YouTube
Visit our YouTube page for helpful videos
Visit Our Website
www.odm-inc.com