1
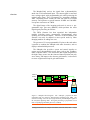
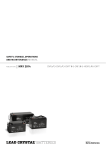
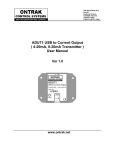
D eMorpho A Q User's Manual Data Sheet Data Acquisition System for use with Scintillator Detectors Acquire energy histograms Measure Count rates Display pulse shapes Bridgeport Instruments, LLC 6448 E Hwy 290, Ste D-103, Austin TX 78723-1040 Phone: 512-533-9933 www.BridgeportInstruments.com © Bridgeport Instruments, LLC Version R1, Jan. 2009 Table of Contents 1. Introduction ....................................................................... 3 2. Morpho Installation ........................................................... 6 3. Theory of Operation .......................................................... 7 4. Technical Data ................................................................ 10 5. Performance Data ............................................................ 12 6. Driving A Power Base .................................................... 14 7. Controls ........................................................................... 15 8. Advanced Controls .......................................................... 17 9. External Signals .............................................................. 19 10. Revision History ........................................................... 19 © Bridgeport Instruments, LLC; eMorpho User Manual; Version R2, January 2009 Page 2 1. Introduction eMorpho eMorpho is a member of a product line that includes complete radiation sensors (R2D), digitally controlled plug-on high-voltage generators (TwinBase) and multichannel analyzers that employ digital signal processing (eMorpho). The entire product line has been designed form the ground up to optimally meet the requirements of scintillator-based radiation detection and signal processing. Intended Use The eMorpho is intended for use with nuclear radiation detectors that use a scintillator and a photomultiplier tube (PMT). The eMorpho delivers excellent results with commonly used scintillator types such as NaI(Tl) and CsI(Na) or CsI(Tl) as well as any other scintillator crystals. Use the eMorpho for: Precision scintillator-based gamma-ray spectroscopy of man made and naturally occurring radioactivity. Prompt and delayed gamma-ray spectroscopy in neutron activation analysis. High-count rate applications: Up to 16 Mcps for periodic pulses; > 500 kcps random pulse rate in NaI(Tl). Embedded applications: The smallest eMorpho fits onto a 2inch diameter (51 mm) circle. Low power applications: The fast, high performance eMorpho versions consume between 0.35 W and 1.1 W. Low power versions consume significantly less. Low cost applications: The eMorpho has been designed for large scale applications and offers impressive performance at the lowest possible cost per channel. Low-risk developments: The eMorpho has a simple and easy to use digital interface. This allows users, instrument designers and system integrators to quickly integrate the eMorpho into a larger software frame work─at minimal risk and cost. Ease of Use The analog input of the eMorpho connects directly to the PMT signal output. The card communicates with a computer via a USB port, which also provides power to the card. A simple graphical user interface (GUI) is used to control the eMorpho. Alternatively, © Bridgeport Instruments, LLC; eMorpho User Manual; Version R2, January 2009 Page 3 Bridgeport Instruments provides driver software to aid application engineers in writing task specific control code. Functionality The eMorpho is used for detecting and measuring nuclear radiation in a variety of situations, including discovering, quantifying and identifying sources of radioactivity. Supported detectors are single-type scintillators as well as phoswich detectors. With the basic software, the card provides four distinct measurements: Pulse count rate as an indicator of radiation activity. Energy histogram 4096 channels, 232−1 counts/channel for isotope identification. Oscilloscope-like trace capture, triggered and untriggered, for advanced usage such as pulse shape analysis. List mode data acquisition, storing energies, pulse shape information and time stamps. © Bridgeport Instruments, LLC; eMorpho User Manual; Version R2, January 2009 Page 4 Overview The Morpho-DAQ receives the signal from a photomultiplier anode into a 50 Ω-terminated input. The current signal is converted into a voltage signal, with programmable gain, while preserving the original pulse shape. This is presented to a waveform digitizing ADC. Depending on the version, the ADC has either 10 or 12 bits accuracy and operates at speeds between 20 MHz and 100 MHz. Low power versions run at 5 MHz. The digital image of the incoming pulse train is sent to a programmable logic gate array (FPGA), which performs the entire digital signal processing in real time. The FPGA firmware has been organized into independent modules including energy measurement, histogramming, pulse counting and waveform capture. Because of the modularity. the firmware can easily be adapted to meet special needs by either changing modules or adding new ones. The presence of 21 user programmable I/O pins on the card makes it possible to combine the eMorpho with other electronics, such as displays and embedded processors. The eMorpho also provides a power and control interface to operate active photomultiplier power bases, such as the TwinBase, under computer control. This convenient and elegant integration of the high-voltage source into the front-end data acquisition not only saves money and improves the detector performance, it also allows to create a tight control loop for gain stabilization. Data & Power ADC USB FPGA I-to-V HV-Control DC/DC Local Power Supply HV PMT NaI Figure 1: eMorpho block diagram. The eMorpho performs the data acquisition and can control a HV-generator mounted on the PMT. The current-to-voltage converter (I-to-V) presents the photomultiplier signal to the waveform digitizing ADC. All signal processing is performed in real time in a field-programmable gate array (FPGA). © Bridgeport Instruments, LLC; eMorpho User Manual; Version R2, January 2009 Page 5 2. Morpho Installation Driver Installation Copy the content of the software CD-ROM into an appropriate directory on your computer. We recommend C:\BPI\eMorpho. Now remove the CD-ROM from the drive. To make Windows install the USB driver connect the eMorpho DAQ card to your computer via a USB cable. Wait until the “Found new hardware wizard” comes up asking for directions to locate the driver. Click on the “Browse” button and choose the directory C:\BPI\eMorpho\D2XX3014. Click OK. After Windows is finished copying the driver files, reboot the computer and you are all set. For the driver installation, you do not need to connect the eMorpho to a radiation detector. User Interface If you ordered the eMorpho with an IGOR interface you may have to install the IGOR-PRO software that is included with your shipment. Just follow the very simple instructions on the IGOR installation disk. Then launch the interface by double-clicking on eMorpho.pxp in the eMorpho\GUI folder. © Bridgeport Instruments, LLC; eMorpho User Manual; Version R2, January 2009 Page 6 3. Theory of Operation Signal Input The eMorpho will deliver best performance if the photomultiplier signal is DC-coupled to the eMorpho signal input. Hence it is best to operate the photomultiplier of the radiation detector at negative high voltage. The input amplifier is a current to voltage converter with five software selectable gains ranging from 100 Ω transimpedance to 10.1 kΩ. A buffer amplifier, which doubles as an antialiasing filter, picks up the signal and presents it to a fast waveform-digitizing ADC. The input voltage range of this ADC is 1.056V. Hence the full-scale input signal current is 10.56 mA for the 100 Ω gain and 105 μA for the 10.1 kΩ gain setting. In the two most commonly used version of the eMorpho, the waveform-digitizing ADC is either a 10 bit, 20 MHz or a 12-bit 80 MHz digitizer. The resulting data stream of 25 MBytes/s (or 120 MBytes/s) is sent directly to a field programmable gate array (FPGA) for real time digital signal processing. Signal Processing The signal processing in the FPGA is organized into a number of independent modules. The functionality and purpose of the signal processing modules are summarized below: DC-finder: The DC-finder and trigger module recognizes incoming signal pulses and generates trigger information. If no pulses have been detected for some time the module measures the DC-baseline and subtracts this numeric value from the ADC data. Energy: The DC-corrected ADC data are sent to the Energy module, which computes energies in response to a trigger and checks for pulse pile up. For accepted pulses it reports the energy and some pulse shape information to various data storage modules. Histogram: The most often used data storage module is the Histogram module, which builds the energy spectrum. Trace: The Trace data storage module records 1024 ADC samples either untriggered or in response to a valid-event trigger. List mode: A list mode module records energies, time stamps and pulse shape information for a sequence of accepted radiation-induced pulses. © Bridgeport Instruments, LLC; eMorpho User Manual; Version R2, January 2009 Page 7 Statistics: This module contains pulse count rate information, which is used to precisely measure the histogramming rate as well as the true incoming pulse rate seen by the scintillator detector. Calibration: This module stores energy and time of arrival data from the last event plus diagnostic and environmental data such as the DC-baseline value and the TwinBase temperature. DAC: This module is used to set the control voltage for a TwinBase high voltage generator that plugs onto the PMT. USB: A set of two modules that define the communications protocol. They act as the data bridge between the USB controller and all internal FPGA modules. IF MUX Cal Tmp DAC TR DC ADC His PH Time Stat Ctrl Event Figure 2: The operational modules within the eMorpho FPGA. IF and MUX form the USB interface. Ctrl holds all control registers. Cal provides calibration data. DAC sets the photomultiplier high voltage. Stat holds the count rate information. His is the histogramming unit. Event is the list mode buffer. TR is the trace storage module. ADC is the ADC data capture module. DC is the baseline finder and pulse trigger module. PH is the energy measurement module, including pile up inspection and pulse shape analysis. Time shows how a new module might be added, for instance to measure arrival time using constant fraction timing. © Bridgeport Instruments, LLC; eMorpho User Manual; Version R2, January 2009 Page 8 Supported Scintillators The software for the eMorpho includes a function to establish default settings for all relevant signal processing parameters. This way users can select a scintillator and are guaranteed excellent spectroscopy at the click of a single button. Except for the PMT high voltage, no user adjustments are necessary to measure a highquality energy spectrum. The following scintillators are supported in this manner, listed from fast to slow: Plastic, CsI, ZnS(Ag), CsF, CeF3, YAP(Ce), YAG(Ce), GSO(Ce), LSO(Ce), PbSO4, LaCl3(Ce), LaBr3(Ce), NaI(Tl), BGO, BaF2, CaF2(Eu), LiI(Eu), CsI(Na), CsI(Tl), CsI(CO3), GOS, CdWO4, LiF(W). If your scintillator is not in this list, use the setting for the next slower scintillator. Expanded Functionality Embedded systems developers use the eMorpho to build new instruments featuring advanced digital signal processing. The eMorpho can serve as a rapid development platform providing a well documented, off-the-shelf solution. The eMorpho board offers 21 user-programmable I/O pins, which can conveniently be used to connect other embedded devices to an eMorpho or to connect multiple eMorpho cards together. © Bridgeport Instruments, LLC; eMorpho User Manual; Version R2, January 2009 Page 9 4. Technical Data ADC The various versions of the eMorpho are all software compatible and differ mainly in the ADC used. In general, using an ADC with fewer bits and running at a lower speed reduces power consumption. Operating at a high sampling rate will increase the count rate capability when used with fast scintillators. Consider these options: Using a 10-bit ADC is advisable when gamma-ray energies with a dynamic range of 5:1 (e.g. 200 keV to 1 MeV) need to be measured accurately. Use a 12-bit ADC if a wide dynamic range of 20:1 (e.g 500 keV to 12 MeV) is required. . For NaI(Tl) and slower scintillators, such as CsI(Tl) or CsI(Na) a 20 MHz ADC will deliver excellent results. Each eMorpho uses a third-order Gaussian low-pass filter as an anti-aliasing filter. The triple pole is located at a frequency equal to half the sampling frequency of the ADC. Note that for higher gains in the analog input stage (>430 Ω) the signal is slowed down further due to the limited bandwidth of the input amplifier at high current gains. Signal Processor All programmable logic on the eMorpho is confined to a single field-programmable gate array (FPGA)─a Spartan-3 XC3S300 from Xilinx. On power up it receives its configuration from an onboard EEPROM that is pre-programmed at the factory. Firmware downloads are not necessary. Alternatively, the FPGA (and the EEPROM) can be programmed in situ using a JTAG interface. The eMorpho communicates with the host computer via USB. The local USB controller is an FTDI245BM, which is a USB 1.1 full speed controller. It achieves data transfer rates of up to 0.8 MByte/s. Signal Input The eMorpho accepts signals into a current-to-voltage converter with 50 Ω input impedance. Its output is presented to the waveform digitizing ADC, which has a 1.056 V input range. There are 5 recommended gain settings available. Four gain resistors can be individually included or bypassed. A minimum 100 Ω resistor is always present. A 4-bit gain switch (GS) is used to © Bridgeport Instruments, LLC; eMorpho User Manual; Version R2, January 2009 Page 10 select the gain. The table below lists the effective transimpedance RF for the major gain settings. It also lists the full scale anode current computed from I_Anode_max = 1V/RF. Quantity Impedance Max. Current GS=0 100Ω 10mA GS=1 430Ω 2.3mA GS=2 1.10kΩ 0.9mA GS=4 3.40kΩ 0.29mA GS=8 10.1kΩ 0.09mA Depending on the signal pulse shape the maximum anode current can be related to a full-scale signal charge. For very fast signals (<20ns fwhm) the signal shape presented to ADC is determined by the anti-aliasing low pass filter. For slower signals, the ADC will see the original waveform. The table below shows the approximate charge for three typical pulse forms at full-scale amplitude: Spikes (such as from a plastic scintillator or a single photo-electron); NaI(Tl) with 230ns decay time and CsI(Na) with a multi-exponential decay. Gain Power Supply Type / Charge Spike NaI(Tl) CsI(Tl) GS=0 500 pC 2300 pC 10000 pC GS=1 116 pC 535 pC 2325 pC GS=2 45 pC 209 pC 909 pC GS=4 15 pC 68 pC 294 pC GS=8 5.0pC 23pC 99 pC Power consumption for operation with out a high-voltage generator attached: The full matrix for power consumption at different ADC speeds and accuracy will be included in the production release of this document. Below we show the power consumption for a 10bit, 20 MHz eMorpho. Quantity Symbol typ Supply current at V_USB = 5 V I_USB 98 mA Power consumption at V_USB = 5V P_USB 0.45 W Power consumption with V_X = 3.3 V P_33 0.37 W When the eMorpho is powering a TwinBase power base to generate high-voltage for a photomultiplier the power consumption of the system increases somewhat. At a nominal high voltage of © Bridgeport Instruments, LLC; eMorpho User Manual; Version R2, January 2009 Page 11 1000V, the power base will consume 38 mA at a 3.3 V to 5.5 V supply voltage. With a TwinBase connected and set to 1000V the power supply data change to: Quantity Symbol typ Supply current at V_USB = 5 V I_USB 136 mA Power consumption at V_USB = 5V P_USB 0.68 W Power consumption with V_X = 3.3 V P_33 0.45 W Note: The supply current to the power base is proportional to the requested high voltage. HV-Control The Morpho-DAQ board is equipped to power and control highvoltage generating power bases such as the TwinBase made by Bridgeport Instruments. The control output V_ctrl provides an analog control voltage. This control voltage is set by the host computer by programming a 12-bit DAC. The PMT receives a high voltage of: HV =1000⋅V_ctrl . The DAC has a voltage range of 3.000 V, but the firmware limits the DAC output to 2.000 V to prevent damage to the TwinBase and the PMT. 5. Performance Data Below we give an overview over the capabilities and speed of the Morpho-DAQ card. Specific performance may vary with the application and the software environment. Histogram Size The Morpho-DAQ uses 16 KBytes of histogram memory. The memory is organized to 4096 4-byte words. A single block read from the memory via the USB interface moves 896 4-byte words. Five block reads are necessary to read a complete histogram. On dual-core PC's a USB read takes a minimum of 32 ms. Quantity Histogram memory size Read out time Histogramming Speed Value 4096 x 4-byte words 25 ms – 32 ms The histogramming speed is determined by the integration time. The Morpho-DAQ card will not allow a second trigger during the integration time, causing a minimum dead time equal to one © Bridgeport Instruments, LLC; eMorpho User Manual; Version R2, January 2009 Page 12 integration time. A pulse arriving within an integration time of the first will cause a pile up and extend the dead time by another integration time. Hence, the histogramming speed can be summarized as follows: Quantity Rate HR = 1/ IT Periodic pulses: Periodic pulses, IT=100ns HR = 10 Mcps Pulses occurring randomly in time; PR=1/IT creates maximum HR. PR = 1 /IT HR = 1/e⋅IT Pulses occurring randomly in time, IT=100ns PR = 10 Mcps HR = 3.68 Mcps Note: IT denotes integration time. PR is the incoming pulse rate, and HR is the histogramming rate. Mcps is million counts per second. “e” is Euler's constant: 2.718... Waveform Data The eMorpho stores and reports 1024 ADC samples, in response to a request. The request can either be a command from the host computer (untriggered storage) or a trigger generated by an incoming pulse (triggered storage). Waveforms are stored as seen by the eMorpho, without subtracting the DC-baseline. Data are presented as 16-bit numbers in 10.6 format, ie the four least significant bits are interpreted as fractional bits. In a 10-bit system, the 6 LSB are always zero. In a 12-bit system, the 4 LSB are zero. Quantity Waveform memory size Read out time List mode Data Value 1024 x 16-bit words 2.6 ms – 32 ms The Morpho-DAQ card can store energies and arrival times for a sequence of pulses. This is referred to as list mode. When storing a 2-byte energy word, a 2-byte pulse shape descriptor and a 2-byte time stamp for each accepted pulse, the card can hold 340 events before a read out by the host computer is required. There are two similar versions of list mode data acquisition. One reports energy, pulse shape and a short time stamp. The other reports energy and a long time stamp. The short time stamp is a 16bit word with a resolution of 32 ADC sampling clock cycles The long time stamp is a 32-bit word and has a resolution of 1 ADC © Bridgeport Instruments, LLC; eMorpho User Manual; Version R2, January 2009 Page 13 sampling clock cycle. At the end of their range, the time data roll over and start counting at zero again. Quantity List mode memory size Read out time Value 1024 x 2-byte words 2.6 ms – 32 ms 6. Driving A Power Base HV control The eMorpho includes all the support electronics needed to power and control a TwinBase power base. These bases replace the conventional combination of external HV-supply and resistive divider. They are more cost effective, use less power and improve the PMT performance. The eMorpho supplies +3.3 V to the power base. The PMT high voltage is set by applying a control voltage at the V_ctrl terminal. Note that V_ctrl is always positive, even for negative HVgeneration. Alternative to using an analog HV-control voltage, the eMorpho makes the three digital HV-DAC control signals available at its Detector connector. TwinBases from the NP10 series can accept the digital controls and create the analog HV-control voltage locally. It is best to use the digital control interface when the eMorpho and TwinBase have to be connected by a long cable and noise pickup is anticipated. Temperature Data TwinBases from the NP10 series also carry a digital temperature sensor. The eMorpho connects to this sensor via three digital lines and is programmed to sample the temperature once every two seconds. The temperature is stored in the calibration registers. The temperature resolution is 1/16th of a degree centigrade and the absolute accuracy is ± 1 K. © Bridgeport Instruments, LLC; eMorpho User Manual; Version R2, January 2009 Page 14 7. Controls There are only a few controls that are needed to operate the eMorpho. Most are set automatically when choosing a scintillator in the graphics user interface. Below follows a brief description of all user-accessible controls. Trace display The eMorpho stores traces as 16-bit numbers. The display software however, always displays the traces on a 10-bit scale; i.e. the maximum value will be 1024. In a 10-bit system the display will consist of integer numbers. In a 12-bit system there are two fractional bits and the smallest value difference is 1/4th ADC unit. This scaling is useful, because it allows user to interpret the ADC scale in physical units of millivolts, as the ADC full scale corresponds to 1.056 V. Hence one unit corresponds to 1.056 V / 1024 = 1.031 mV DC-offset The DC-offset is not adjustable in the eMorpho but can be viewed in the trace display. It is always close to 120 ADC units, independent of the gain. Trigger Threshold The Morpho-DAQ board uses a level sensitive trigger to detect incoming pulses. The numerical value corresponds to the number of ADC bins. Note that the trigger level is measured with respect to the DCoffset. Hence, setting the trigger threshold to 20 will cause the eMorpho to trigger on a (displayed) DC-level of 140 ADC units. Quantity Trigger level legal range Integration Time Symbol min max TL 0 1023 Trigger level practical TL range 5 900 The Morpho-DAQ board uses numerical integration to compute the pulse energy. In practice the integration time is chosen to cover 90% of the emitted scintillator light. Suggested values for over 20 different scintillators are included in the software distribution. The integration time can be adjusted over a wide range: © Bridgeport Instruments, LLC; eMorpho User Manual; Version R2, January 2009 Page 15 Quantity Trigger Dead Time Symbol min max Integration time, in clock cycles IT 6 65535 Integration time (80 MHz system) IT 75 ns 0.819 ms Scintillator pulses subside gradually. At high count rates it may become necessary to make sure that new pulses do not ride on the tail end of a previous pulse. The Trigger Dead Time setting instructs the eMorpho to wait that time after a trigger before it will allow new triggers. In practice, the Trigger Dead Time is most often chosen to be twice the integration time. Quantity Scaling Symbol min max Time to baseline, in clock cycles TDT 6 65535 Time to baseline (80 MHz system) TDT 75 ns 0.819 ms You can use scaling to fit the histogram into less than 4096 bins or to expand the lower end of the histogram. A scaling of 0 means no histogram compression and should be used only for very small signals, such as when measuring the single photo-electron response of a photomultiplier. A scaling of 1 means the histogram gets compressed by a factor of two. A scaling of “n” causes a compression of 2n. Quantity Energy Scaling Pile Up Time Symbol ES min max 0 15 The eMorpho uses pattern recognition to identify piled up pulses. A single parameter governs this process. The pile up time should be somewhat larger than the full width at half maximum (fwhm) of the signal pulse. You can turn off pile up rejection, by setting the pile up time to be equal to the integration time. Quantity Pile up Time, in clock cycles Symbol PUT min max 6 65535 © Bridgeport Instruments, LLC; eMorpho User Manual; Version R2, January 2009 Page 16 8. Advanced Controls In this section we describe some advanced controls that are of interest when doing work that goes beyond pure spectroscopy. In the graphics user interface these variables are accessible in the Advanced Controls panel. Partial Integration The eMorpho supports phoswich detectors by providing a partial integration sum. It is computed in exactly the same manner as the energy integral, but the eMorpho sums only over the beginning of the pulse. This feature is always present and operates in parallel to the regular energy measurement. Ignore this parameter when not using a phoswich. The result from the partial integration is stored with the list mode data and is available when recording list mode data. Quantity Partial Integration Time, in clock cycles Optical Pulser Symbol PIT min max 6 65535 The eMorpho has a built-in pulse generator that can produce periodic single and double pulses. It can be used to drive a fast LED (such as a IF-E93 from Industrial Fiber Optics), or to trigger some external electronics. The pulser can be enabled and disabled and the eMorpho can be programmed to force a trigger on the rising edge of the pulse (first pulse in case of a double pulse). The pulse frequency can be varied from a quarter of the ADC sampling rate (R) down to R /2 30 in 30 steps where each step corresponds to a factor of 2. The controlling variable is “pulse period” which can range from 0 to 30. A value of 0 causes pulsing at the highest frequency. A value of 30 causes the lowest frequency. A value of 31 shuts the pulser off. The pulse width is governed by a variable with the same name. It's minimum value is 0, which causes a pulse width of 2 ADC sampling clock cycles. Increasing values increase the pulse width by factors of 2. The maximum legal value is 14, which causes a pulse width of 214 / R . If “Pulse Separation” is set to a value greater than zero, the pulser generates a second pulse after the first. A value of 1 causes a second © Bridgeport Instruments, LLC; eMorpho User Manual; Version R2, January 2009 Page 17 pulse to appear 2 ADC sampling clock cycles after the rising edge of the first. Increasing values increase the pulse separation by powers of 2. The maximum value is 215 / R . The table below summarizes the functional range for the three parameters, for an ADC sampling rate of R=80 MSPS. Quantity Symbol min max Pulse Period PP 0 30 Pulse Period, in s PP 50 ns 53.8 s Pulse Width PW 0 15 Pulse Width, in s PW 25 ns 0.819 ms Pulse Separation PS 0 15 Pulse Separation, in s PS 25 ns 0.819 ms © Bridgeport Instruments, LLC; eMorpho User Manual; Version R2, January 2009 Page 18 9. External Signals As programmed at the factory, the eMorpho uses some of its general purpose I/O (GPIO) pins to communicate trigger and pulser signals. Warning The I/O pins of the eMorpho are not 5 V tolerant. Use only with signals that range from 0 V to 3.3 V. External Trigger, XT The eMorpho can accept an external trigger as the pulse trigger. This can be used to force triggers in situation where the eMorpho would not trigger by itself; i.e. on very low amplitudes in a noisy environment. The external trigger and any internally generated triggers are ORed together. To disable the internal trigger, simply set the trigger threshold to 1023. External Trigger, XV Optical Pulse, OP; Optical Trigger, OT The eMorpho can accept an external veto signal. When XV is high, the energy module does not react to any other trigger source, internal or external. The eMorpho places the optical pulser signal and a trigger pulse synchronous with the rising edge of the first pulse on two GPIO pins. 10. Daisy chaining The run bit (R) of control register 15 is used to start and stop data acquisition. Similarly, the suspend bit (S) of control register 13 is used to suspend data acquisition. These two functions can be communicated via a daisy chain from Morpho to Morpho. There is an external input XR and an output RO. The output follows the logical equation RO = XR or R, and can be fed into the XR-input of the next eMorpho. S, XS, and SO form an equivalent combination for the suspend command. As a result it is possible to start and stop data acquisition simultaneously in a chain of eMorphos. The same holds for suspending the data acquisition. The common start (or suspend) command can be initiated from the host computer by writing to the control registers, or even from an external signal feeding into the XR (XS) input of the first eMorpho in the chain. © Bridgeport Instruments, LLC; eMorpho User Manual; Version R2, January 2009 Page 19 11. Revision History P1: Preproduction release; Adapted from Engineering release P0. April, 2006. P2: Reflect address change. R1: Update pulser chapter, Jan. 2009 © Bridgeport Instruments, LLC; eMorpho User Manual; Version R2, January 2009 Page 20