1
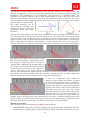
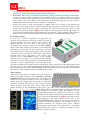
MIRA Purpose The MIRA Tomographer is a state-of-the-art instrument for creating a three-dimensional (3-D) representation (tomogram) of internal defects that may be present in a concrete element. MIRA is based on the ultrasonic pitch-catch method and uses an antenna composed of an array of dry point contact (DPC) transducers, which emit shear waves into the concrete. The 4 by 12 transducer array is under computer control and the recorded data are analyzed to create a 2-D image of the reflecting interfaces within the cross section below the antenna. The series of 2-D images obtained from a 2- dimensional surface scan of the test object are transferred to a computer with proprietary imaging software. The software assembles the 2-D slices into a complete 3-D image of the test object. The 3-D image can then be manipulated for interpretation of test results. MIRA has been used successfully for the following applications. Thickness measurement Detection of voids in grouted tendon ducts Detection of poor quality bond in overlays and repairs Detection of delaminations Detection of voids and honeycombing in concrete members Detection of voids behind tunnel linings and below slabs on ground. While not intended for that purpose, MIRA is also capable of detecting steel reinforcement, Principle MIRA is based on the ultrasonic pulse-echo method using transmitting and receiving transducers in a "pitch-catch" configuration as shown on the right. In the pitch-catch method, one transducer sends out a stress-wave pulse and a second transducer receives the reflected pulse. The time from the start of the pulse until the arrival of the echo is measured. If the wave speed C is known, the depth of the reflecting interface can be calculated as shown (the equation assumes that the two transducers are close to each other, see pg. 98). The key features that distinguish MIRA from other flaw detection devices include: The use of point transducers to introduce into the concrete pulses of shear waves with an adjustable nominal center frequency of 25 to 85 kHz The use of an array of point transducers to obtain rapidly 66 transit time measurements during each test The individual transducers are spring loaded to conform to an irregular surface and they do not require a coupling medium, that is, testing is done in the dry The transducer array (antenna) is contained within the same enclosure as the computer used to analyze the measured travel times The transit time measurement are analyzed using the synthetic aperture focusing technique (SAFT) to reconstruct, in real time, a 2-D image of the cross section below the antenna The data captured by MIRA are transferred to a computer and the 3-D visualization software allows views of different slices of the reconstructed internal structure 96 MIRA The following provides additional descriptions of the principles involved in the MIRA system. The antenna is composed of a 4 by 12 array of point transducers and a control unit that operates the transducers. The transducers act as transmitters and receivers in a sequential mode. The transducers are heavily damped so that a short duration pulse is created. The plot in blue below shows the typical shape of the received pulse after it has reflected from an air interface. The plot in red to the right shows the amplitude spectrum of the pulse. It is seen that, in this case, the nominal center frequency is about 50 kHz. The center frequency can be varied from 25 to 85 kHz, thus allowing the user to control both penetration depth and image resolution. The operation of the antenna is described next. Basically, the control unit within the antenna excites one row of transducers and the other rows of transducers act as receivers. The left side figure below shows the first row of transducers acting as transmitters and the remaining rows of transducers acting as receivers. The ray paths for the measured transit time are as shown. Then, as shown in the figure on the right, the next row of transducers is excited and the other rows to the right act as receivers. This process is repeated until each of the 11 rows of transducers has acted as transmitters. The figure to the right shows the 66 ray paths that are involved during a measurement at one test location. It takes less than 3 seconds to complete data acquisition and data processing at each location. As discussed below, the measured transit times are processed by the computer to create a 2-D image of the volume below the antenna. The reconstructed image shows the locations of the reflecting interfaces, which could be the opposite side of the member (back wall reflection), reinforcing bars, and most importantly internal concrete-air interfaces (such as voids, cracks, and delaminations). If there is a sufficiently large concrete-air interface (a defect) within the member, a portion of the emitted stress pulse will be reflected by the defect. As illustrated in the figure to the left, because of the shorter ray paths, reflections from the defect will arrive at the receivers sooner than reflections from the back wall. The signal processing software uses the arrival times of the reflected pulses at each row of transducers to determine the location of the defect within the member. Note in the figure that some transducers do not receive a reflection from the flaw or the back wall. This is because the flaw intercepts the rays that would normally be reflected from the back wall. This behavior accounts for a so-called "shadow" zones in some 2-D images. Method of operation There are three modes of operation of the MIRA system as follows: ADJUSTMENT—This mode is used for setting up the device parameters, managing stored data, and defining the scanning grid that will be used in the SCAN mode. The system can be set up to 97 MIRA use a designated shear wave speed for depth calculations or to measure the shear wave speed at each test location before gathering time-of-flight information. EXPLORE—This mode is intended for preliminary testing at arbitrary locations on the surface of the test object. Ideally, preliminary tests should be done at locations where the internal conditions are known. This mode is used to check the settings of the instrument before beginning actual surface area scans. Based on the appearance of the B-scan image (see pg. 99), it can be determined whether the correct device settings are being used. SCAN—This mode is used for gathering a complete data set by testing at pre-defined grid locations on the surface of the test object. This mode automatically saves the B-scan data at each test location after the B-scan image is displayed. The system also stores the current system settings and a bitmap image of MIRA screen display at each grid point. The bitmap images can be accessed by transferring the folder holding the scan data to a laptop computer. These bitmap images can be inserted in the project report to document key features in the testing results Performing a Scan To carry out a detailed inspection of a portion of the member, the user lays out a series of parallel scan lines on the testing surface, which are shown as green arrows. The distance between the scan lines is the same as the "horizontal step" distance entered in the ADJUSTMENT mode. If the entire interior of the object is to be examined, the distance between the scan lines should not exceed 250 mm. Another series of lines perpendicular to the scan lines is laid out, which are shown as dashed lines. The distance between these lines is the same as the "vertical step" entered in the ADJUSTEMNT mode. If the complete interior of the test object is to be inspected, the distance between the "vertical steps" should not exceed 100 mm. The antenna is oriented perpendicular to the direction of the scan lines and data are recorded at each "vertical step" along each scan line. After taking data along the first scan line, the operator moves to the beginning of the next scan line. The testing layout entered into the system in the ADJUSTMENT mode is used during image reconstruction to establish the locations of the reflecting interfaces within the test object. Data Analysis After transit time data are acquired at a test location, a signal processing technique called synthetic aperture focusing (SAFT) is used to reconstruct a 2-D image of the interior of the concrete member at the test location. In simple terms, the region below the antenna is subdivided into small elements (analogous to finite elements used for stress analysis). From the pulse arrival times and the known positions of the transmitter-receiver pairs, the depth of the reflecting interface can be established. Because of the inclined ray paths, the depth of the reflector is calculated using the formula for the relationship between the lengths of the sides of a right triangle. In the formula shown in the above figure, Cs is the shear wave speed determined by MIRA at the start of each measurement or the value entered by the user in the ADJUSTMENT mode. Volume elements that correspond to locations of reflecting interfaces are assigned a color to indicate intensity of reflection from those elements (constructive superposition). The end result is a 2-D image representing the locations of reflecting interfaces in the region below the antenna. 98 MIRA 3-D Image Reconstruction The data for the 2-D images obtained at each test location on the scanned surface are stored in the MIRA in a folder named by the user. At the completion of testing, the data are transferred to a laptop computer that contains the IDealviewer 3-D visualization software. The software "stiches" together the 2-D images to create a 3-D model of the test object. As an example, the figure at the right is the reconstructed 3-D model from a scan of a portion of a slab containing two tendon ducts and a reinforcing bar. The bottom of the slab is indicated. Duct Duct Bar Bottom of slab The user can manipulate the 3-D model by rotating it or looking at different orthogonal planes cutting through the model. The views on the three orthogonal planes have formal names as shown in left figure below. A C-scan shows the reflecting interfaces on a plane parallel to the test surface and at different depths (Z-axis); that is, it provides a "plan view" of the reflectors. A B-scan provides an "end view" of the reflectors. The B-scan views are the same images created at each test location by the MIRA. The D-scan provides a side view of the reflectors. The user can look at specific "slices" through 3-D model by defining the Z-coordinate for a C-scan image, the Y-coordinate for a B-scan image, and the X-coordinate for a D-scan image. For example the right figure below shows three slicing planes through the 3-D model of the slab with the ducts. C‐Scan B‐Scan D‐Scan Examples Plain concrete block with holes: The test object is a 0.8 m long by 0.43 m wide by 0.43 m deep plain concrete block into which three holes were cast as shown. The antenna of an older version of MIRA was scanned along the top of the block parallel to the direction of the holes. The resulting Bscan image is shown to the right. The three holes are seen clearly and the red band at the bottom represents reflections from the bottom of the block. Because of the inclined ray paths, it is possible to see the deeper 13-mm hole directly below the upper 13-mm hole. 13 mm hole 55 mm deep 30 mm hole 130 mm deep 13 mm hole 160 mm deep 99 MIRA Testing for voids in grouted cable ducts of bridge girders: An earlier version of the MIRA was used to evaluate the conditions of grouted post-tensioning ducts near the anchorage zone in the webs of a box-girder bridge. Before testing, the locations of the ducts were marked on the face of the web using information on the construction drawings (center photo below). One of the test records is shown below. The B-scan is at the cross section shown as a dashed line in the C-scan. The large amplitude signal in the S-scan at the location of the duct indicated a high probability that the duct was not grouted fully. This was confirmed by drilling a core and carefully removing the duct to reveal bare strands as shown in the photo on the right. (Courtesy of Ramboll Finland Ltd.) Scanning along web View of web and drilled core C-Scan Condition of duct B-Scan D-Scan Tendon Ducts in Slab Specimen at Copenhagen Training Facility: A 400-mm thick slab-onground has been constructed at the Germann Instruments training facility in Copenhagen. The slab contains two 100-mm diameter metal tendon ducts with a nominal cover of 100 mm. One duct is empty and the other Void? 1 contains 10 grouted, 16-mm diameter strands. A non-shrink grout was used to prepare the grouted duct specimen, which was then cast into the slab. In addition, ordinary reinforcing bars were located in the top of the slab parallel to the ducts. The figure to Grouted the right is the 3-D model constructed from the B-scan images duct obtained from scanning the surface of the portion of the slab 2 containing the ducts. The depth of the 3-D model has been cutoff Empty to eliminate the image of the bottom of the slab so that the ducts Bars duct can be seen easily. The empty duct is displayed with red color, which indicates strong reflections from the air interface. The grouted duct is shown in a greenish-yellow color, indicating lower amplitude reflections from the steel strands. The reinforcing bars between the ducts and to the right of the grouted duct are indicated in light blue. It is seen that at the far end of the grouted duct the image of the duct is in red, indicating a strong reflection 100 MIRA that is characteristic of an air void. To verify that the duct is not grouted fully, the grouted duct was excavated at two locations: (1) 150 mm from the edge at the end where the air void is indicated and (2) at the approximate mid-length of the duct where no air void is indicated. The following show the B-scan image and the corresponding photographs of the excavated duct at location 1. The B-scan image shows a similar pattern for the empty duct and the grouted duct, which is a strong indication that the grouted duct is not fully grouted. The corresponding photo of the excavated duct shows that the some of the strands are not embedded in grout. Thus the presence of the air void is confirmed. B-scan showing cross section image of slab at location(1) with suspected void in grouted duct The excavated duct at location (1) reveals that some of the strands are not embedded in grout The following show the results at location 2. The B-scan image shows lower amplitude reflections at the location of the grouted duct compared with the empty duct. These lower amplitude reflections are from the 10 strands within the duct. The reflection coefficient at the grout-steel interface is lower than at an interface with air, and that is why the grouted duct does not appear in red. The excavated portion of the grouted duct shows that the strands were encased with the grout. The grout was fractured during the removal of the metal duct and that is why a few wires are exposed. B-scan showing cross section image of slab at location (2) with no voids indicated in grouted duct; the reflections in the grouted duct are due to the strands. The excavated duct at location (2) reveals that the strands are encased with grout; note that some of the grout was fractured in the process of removing the metal duct and this exposed some wires. 101 MIRA MIRA Tomographer Specifications Dry point contact shear-wave transducers with ceramic wearing tip 25 to 85 kHz center frequency Transducers are spring loaded to conform to rough surfaces Phased array antenna containing 48 transducers in a 4 by 12 configuration; dimensions 365 × 115 × 125 mm; weight 4.5 kg Testing depth: 50 to 2000 mm Rechargeable battery, 5 h operating life Time to process data at test location: not more than 3 s 3-D tomographic display with Idealviewer software Operating temperature -10 °C to 50 °C MIRA Tomographer Ordering Numbers Item Order # MIRA system MIR-1001 Laptop computer with IDealviewer MIR-1002 120/240 VAC Charger MIR-1003 USB Cable MIR-1004 User manual MIR-1005 Wheeled carrying case MIR-1006 Extension handle (optional) MIR-1007 Extension Handle A removable extension handle is available to permit testing while standing or for testing in the overhead position without the aid of a ladder. The handle bolts directly to the MIRA unit and includes a trigger button to intimate data acquisition. 102