1
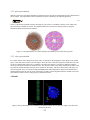
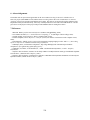
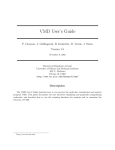
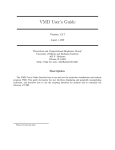
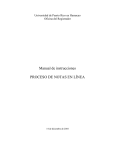
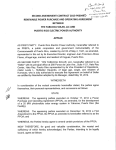
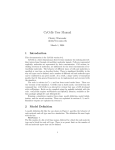
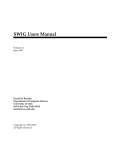
Proceedings of The National Conference
On Undergraduate Research (NCUR) 2009
University of Wisconsin La-Crosse
La-Crosse, Wisconsin
April 16 - 18, 2009
A GUI For The Analysis of Electrostatic Interactions in Molecular Dynamics
Simulations
Desirée E. Velázquez Ríos, John E. Morales García, Axel Y. Rivera Rodríguez
Department of Mathematics
University of Puerto Rico at Humacao
Humacao, Puerto Rico, 00792
Faculty Adviser: José O. Sotero Esteva
Abstract
We present a plug-in application with a graphical user interface (GUI) for the Visual Molecular Dynamics (VMD)
software for the analysis of electrostatic potentials. It consists of a window for control and visualization of the
distribution of charges. It also modifies the representation of the molecules showed on the main VMD window to
show the effect of the interaction on selected molecules. We developed an algorithm that approximates
computationally intensive calculations of the electrostatic forces with less pseudo-atoms using a N x M x L matrix of
boxes, reducing the amount of computation factor of N x M x L. The GUI shows a false-color representation of the
pseudo-atoms. A menu is used to configure the results shown by the VMD window. A set of buttons allow the user
to change the view points of the canvas and to control the computations. Even with the enhanced algorithms the
user may have to wait seconds or minutes depending on the size of boxes being used. Different threads are created
in order to show the progression of the computations while they are being performed. Communication between
threads is made possible by using shared memory.
Keyword: Molecular dynamics
1. Introduction
Molecular Dynamics (MD) simulations often give important insight on the properties of molecules and their
interactions. They are based on computing prescribed forces between particles. In the case of classical MD, those
particles represent atoms and the forces describe the fundamental forces related to bonds, Van Der Waals and
electrostatic forces. Classical MD simulations are well-suited to provide insights into the fundamental properties of
CNT-DNA hybrids because they enable calculation of structural properties with atomic resolution. For example,
Carbon nanotubes (CNT) and single stranded DNA (ss-DNA), interesting and important systems in nanoscience,
have been used to construct nanoscale chemical sensors. A detailed understanding of electrical properties of these
systems is relevant for the design of such sensors.
MD simulations are limited by the available computational power. State of the art simulations deal with systems
composed of hundreds of thousands of atoms. They use time steps in the order of femptoseconds (10-12 seconds).
Using massively parallel systems and sophisticated algorithms with execution times of several days one may achieve
simulations with total simulated time of the order of several nanoseconds (10-9 seconds). Then, the large data sets of
simulated data, called trajectories, are analyzed with software that is bound by similar limitations.
Visual Molecular Dynamics (VMD) is a computer program to visualize and model molecules7. This tool was
developed for viewing and analyzing the results of molecular dynamics simulations, but it also includes applications
for visualizing volumetric data, sequence data, and arbitrary graphics objects. When used for viewing and analyzing
MD trajectories, although it may be used in-line as the simulation progresses, most often it is used off-line after the
whole trajectory has been produced. Users can implement Tool Command Language (Tcl) and Python1 scripts
within VMD to add functionality for the analysis of MD trajectories because it includes embedded Tcl and Python
interpreters.
This paper presents a plug-in application with a graphical user interface (GUI) for VMD for the analysis of
electrostatic potentials. It is meant to provide a first glance of the distribution of charges and electrostatic
interactions to the researchers that may be recomputed with more detail and precision off-line. False-color
representations of the distribution of charges, projection of the atoms onto 2D planes, and 3D representations of the
effect of electrostatic interactions on selected molecules are made available almost instantly. Visual clues provide
feedback to the researcher about computation progresses and scales.
The GUI implements an algorithm that approximates computationally intensive calculations of the electrostatic
forces by dividing the sample space into N x M x L boxes. Pseudo-atoms that represent averages over each of the
boxes are then used to reduce the amount of computation. Multi-threading and the use of C++2 for the most CPU
intensive parts of the code also help to achieve the response times expected from an interactive application.
2. Background
The VMD program is compatible with main file formats produced by MD simulators. This relieves the VMD plugin programmer of the direct interpretation and manipulation of the data. Access to the positions, types and charges
of the atoms is made through the Python modules provided by VMD. Tkinter3,4, a GUI package for Python, is used
for building the window that let the researcher control points of view, atom types being viewed, and computation of
interactions.
2.1. Python and CPU intensive code
Python is an interpreted programming language. It is designed to be minimalist in the sense of syntactic complexity.
As a consequence the code written in that language is relatively easy to understand and modify even by non-experts.
At the same time, it supports programming paradigms such as object oriented programming and structured
programming. Functionality pertinent to the construction of computational tools for MD simulations such as
graphical user interfaces, threading, interprocess communications and interfacing with compiled languages is
provided by a large collection of modules. On the other hand, being an interpreted language with a characteristic of
placing syntax clarity over efficiency, it presents further limitations to computationally intensive applications. A
study made about performance between different programming languages reports that it took 192 seconds per
iterations to solve the Flavius Josephus problem in Python using a code consisting of 41 lines6.
2.2. VMD modules
VMD provides three modules for accessing and manipulating VMD state with objects that represent important
entities. They are referred in the VMD User's Manual as proxy classes that “are written in pure Python and use the
lower level built-in interfaces to communicate with VMD”. They provide the classes:
Molecule: a proxy for molecules loaded into VMD;
MoleculeRep: to keep track of the representations in a molecule;
AtomSel: whose instances are independent of the molecules and representations in VMD.
Other non-object oriented modules are provided for interacting with VMD including:
color: used to change the color definitions, color maps, or edit the color scale;
display: controls the VMD camera as well as screen updates;
graphics: used to create custom 3-D objects from graphics primitives such as triangle, line, sphere, text,
material, etc.
2.3. electrostatic model
When electrostatic charges are present, the Coulomb potentials between two atoms ai, aj is given by
(1)
where Qi and Qj are the charges of the atoms, ri,j their distance, and ε0 is a constant. For each atom, the potential
233
between it and all other atoms is computed and added to obtain the net potential on that atom:
(2)
where ri,j is the unit vector pointing from ai to aj.
2.4. test case: CNT-DNA hybrids
CNTs are cylindrical sheets of carbon with diameters of ~1nm and lengths up to a few centimeters. CNTs have
electronic and structural properties that vary depending on the diameter, chirality and length. They have many
interesting properties such as high mechanical strength and electronic stability. These features make them
candidates for practical applications.
Single strand deoxyribonucleic acid (ss-DNA) is a variant of the widely known biomolecule that consists only one
chain of alternating sugars and phosphates. They are often represented by sequences of the letters C, A, T, and G that
correspond to the different base units. It is understood that ss-DNA attaches to the CNT by the π − π stacking
interaction. MD simulations of ss-DNA adsorbing to a CNT used in this project have been done both at the
University of Pennsylvania and at the University of Puerto Rico at Humacao8,9.
3. Methods
3.1. computation of charges and electrostatic potentials
This software serves to visualize two different properties related to charged particles: the distribution of charges
throughout the space, and the Coulomb potential at each of the atoms as described in section 2.3. Sometimes it is
desirable in a simulation to view the distribution of the charges and the interactions between them. The problem is
that many algorithms used for this task are time consuming. A new approach is needed to speed up these
calculations. The technique used here helps to improve these calculations and show an average of the distribution of
charges and the electrostatic interaction among atoms. This approach takes less time to calculate an average of the
interaction among charges. The algorithm first takes a frame in the simulation. It then divides the frame in N x M x
L boxes. The mount of subdivisions is entered by the user.
3.1.1. charge's grid
This matrix (grid3D) represents a subdivision of the space in N x M x L cubes (Figure 1). Each matrix entry stores
the the sum of the charges of the atoms in the corresponding region. Later, in the computation of electrostatic
interactions between all atom pairs, a simulated atom at the center of the box with this sum of charges as its charge
will be used by substituting the computations corresponding to all the atoms in that box.
Figure 1.The space occupied by the atoms is divided by 3 x 3 x 3 boxes. The appropriate row or column of boxes is
added to compute false color in the 2D projections.
3.1.2. distribution of charges
234
Isosurfaces are often used to represent the different charge levels throughout a 3D space of continuous models. In
our instance we have discrete particles. Therefore a 2D discrete representation was chosen for this purpose. Atoms
are projected to a plane. The user may choose between three planes: the X-Y, X-Z, and Y-Z planes. Computing the
projections onto these planes is simple: take the corresponding coordinates from the three coordinates. For example,
in the X-Y projection,
.
(3)
The similar technique is applied to the grid3D described in section 3.1.1 to produce a 2D projection (grid2D). For
instance, in an XY projection, all the magnitudes in the corresponding column are added, that is,
.
(4)
3.1.3. electrostatic potentials
Electrostatic potentials are computed as in section 2.3, but for each atom, instead of computing the sum over all
other atoms, it is done over the simulated atoms at the center of the grid boxes. Even with the reduction in
computation accomplished by the technique used here, obtaining good approximations requires a grid with enough
elements. Assuming a grid with M x N x L cells, computing charges of all atoms takes O(N * M3). The
performance of Python results in a quest limitation.
As explained before, Python is an interpreted language, which makes it slow for big calculations. In order to
improve the time spent on calculations, a merge between programming languages was implemented. This merge
consists of the C++ and Python programming languages. Since C++ compiles into computer language directly, the
running time is faster than Python. To make this merge possible, the Simplified Wrapper and Interface Generator
(SWIG) library was used. SWIG is a software development tool that connects programs written in C and C++ with
a variety of high-level programming languages. SWIG is used with different types of languages including common
scripting languages such as Perl, PHP, Python, Tcl and Ruby5. Using SWIG libraries helped to make the main
calculations using C++ and the GUI in Python. For compiling the C++ files, GNU C++ version 4.3.2 compiler was
used.
SWIG libraries' array passing capabilities are limited. These libraries do not accept templates and reference
points, which makes it difficult passing the molecule as a parameter for the functions. To solve this just the
necessary atom information became the parameters, instead of the whole molecule. This helped the calculations
because only the essential atoms and information where used, which results in faster calculations.
Finally, an updated edition of Python is needed for the use of newer and better libraries. The Python plug-in in
VMD 1.8.6 uses Python 2.2 libraries. These libraries are not as sophisticated as more recent versions of Python.
The source code of VMD was edited, making the principal libraries of the Python plug-in be the Python 2.5 installed
in the computer instead of being an extra library that must be added to VMD. This improves the VMD, making use
of the most recent Python functions.
3.2. graphical user interface
In order to analyze and view the representation of the charges within the system shown in the VMD screen we
developed a GUI (Figure 2) that can be called with the VMD. The GUI is divided into two parts that work alongside
each other and are written in the same source code; the menu and the canvas. The menu handles the interaction with
the user in order to allow them to view the representation of the charges in the system. The canvas handles the calls
by the menu and dynamically changes in order to show the representation that the user desires.
3.2.1. menu and buttons
The menu and buttons bar were designed to be as simple as possible while allowing the user to fully understand how
each function on screen is intended to work. The buttons bar consists of various buttons where most are visually
represented by what each does. A selector menu allows the user to choose between the individual components
(residues) of the molecule in order to calculate the whole molecule or each component. This also decides what the
canvas will show for the user. The implementation for this selector was made by catching residual names of the
235
molecule loaded into VMD and displaying the names of the components on the menu and sending the selection as a
parameter to one of the canvas classes to display only the molecules with the sent name. The parameters menu
allows the user to change various parameters during the simulation, such as the subdivisions of the representations
of the charges in the canvas, the quantity of frames being analyzed, and the minimum and maximum of the color
representation of charges in the canvas and the VMD OpenGL display.
The save button stores the state of the simulation. When opened through the GUI it returns the user to the moment
of the simulation when it was last saved. Following the open button are three buttons called the XY view button, the
XZ view button, and the YZ view button, respectively. Each button changes the view of the canvas between each of
the main projections for the molecule selected as it is represented in the VMD. This does not change in any way the
view of the VMD, it is only relative to its view. Changes to the GUI screen occur after the program has calculated
the charges for that view. These calculations are done using the threaded code making the changes that occur within
the canvas dynamically.
The following button in the menu is the run button. When pressed, the program begins to make the calculations
necessary in order to change the representation of the molecule in the main VMD OpenGL display to show the
magnitude and direction of the electrostatic potential on each of the atoms that belong to the residues selected by the
researcher. The last button, close, invokes a small callback function that asks the user whether the application
should be closed.
Figure 2.Screen shot of all the components of the plug-in. The window in the upper left corner is used to control the
computations, projections and residue selection. Progress bars provide feedback about the computations. After
completion, electrostatic potentials are shown in the main VMD window (upper right).
3.3.3. representation of distribution of charges
Atoms are particles without colors or any determined shape. In order to represent the distribution of charges, a
spherical shape has been assigned to represent an atom (Figure 3). To represent the charge we assigned a false color
palette. Each charge will have a color depending on the value of the charge. The colors go from red (the maximum
value) to blue (the minimum value) and the other resulting colors are the spectrum between those colors.
236
3.3.1. pixel representation
With the creation of a grid and the algorithm to transform it into a 2D grid, the transformation of the coordinates into
pixel is simple. The representation of the coordinates into pixel is allowed by the following algorithm:
(5)
where α is the desired coordinate and D is the height, if a pixel of the Y coordinate is desired, or the width, if the
pixel from the X coordinate is desired. This algorithm allows the conversion of 2D projections by doing the
calculation already described by the formula.
Figure 3. A 3D representation of a carbon nanotube surrounded by water and its XY projection.
3.3.2. color representation
For a better analysis of the charges in the space study, we add color to the propagation of the charges in the studied
space. False colors where used to scale the charges. Red is the color of the more charged atom and blue is the color
for the less charged atom in this scale. To help the user analyze the charges, a color bar was added in which the
colors are sorted from maximum to minimum value. The maximum value of the charge found in the system is at the
top of this bar and the minimum value that can be found is at the bottom. This bar is shown in the study space. In
order to assign the colors we created a hexadecimal RGB palette and an algorithm to change from decimal base to
hexadecimal string base in order to use the color library of VMD. First the algorithm takes the decimal value of the
color and then converts it into a string equal to its hexadecimal value.
4. Results
Figure 4. Charge distribution on the nanotube (left) and electrostatic forces acting on it (right). Lines direct the
direction of the force.
237
4.1. agreement with expected results
In order to analyze our result we first compare our findings of the representation of the charges with previously
obtained information. When we represent a small CNT within water, no significant charges can be seen (Figure 4).
With the projections and the color representations of the charges a model or an idea in how the charges are
propagated in the polymer and the fibers can be seen. The charges and the trajectories for the projection and the
colors were previous calculated data. The result was a success since the projection and the colors met the
expectation.
4.2. performance
Over all, the GUI is satisfactory due to the threads used but can still be improved by adding other functions such as
an open button.
The edited version of VMD works successfully. The Python plug-in in VMD now uses Python 2.5 version. Also
the VMD libraries that can be imported in the original Python plug-in are still usable in this version. A few tests
where made using the pickel, sockets, threads and TkInter libraries (which were used for the GUI). The results show
that it is stable and the calculations are correct.
The improvement of calculating the charges using C++ was successful. The script was tested using a computer
with an Intel 2.66 GHz QuadCore processor and 3 GBs. The tests where done using the original VMD, the edited
VMD, with the code using pure Python and the embedded code (Figure 5). Also, the tests were made using two
subjects: a short CNT surrounded by water and a longer CNT-DNA hybrid in a water box. The results show an
improvement in time for calculating the charges.
Time Performance
400
350
Time (sec)
300
250
200
150
100
50
Subject 1
0
VMDPy thon2.5 &
VMD & C++
VMD-
VMD
Subject 2
Py thon2.5
C++
Dif f erent VMD's
Figure 5. Comparison in time between different versions of VMD and script.
5. Discussion
For future work, the GUI will implement a better selector tool. In the representation area a feature will be added to
rotate the 3D view of the VMD display when selecting a 2D representation. Also, the color bar of the electrostatic
potential representation will be added to the VMD display.
238
6. Acknowledgements
The authors wish to express their appreciation to the Penn-UPR Partnership for Research and Education in
Materials project (NSF-DMR-353730) and the Humacao Undergraduate Research in Mathematics to Promote
Academic Achievement program (NSA-H98230-04-C-0486). This project was proposed by Robert Johnson of the
Department of Physics and Astronomy, University of Pennsylvania in a recent visit to the UPR-Humacao. He also
gave advice on the physics of the project and provided simulated data for testing the software.
7. References
1.David M. Beazley, Python Essential Reference (Indiana: Sams Publishing, 2006).
2. Joel Adams and others, C++ An Introduction to Computing, 3rd ed. (Michigan: Calvin College, 2003).
3. Fredrik Lundh, An Introduction to Tkinter, Fredrik Lundh, (1999).
4. John W. Shipman, Tkinter Reference: a GUI for Python (New Mexico: New Mexico Tech Computer Center,
2008).
4. David Beazley, “SWIG: an easy to use tool for integrating scripting languages with C and C++”, (Proceeding
Of the 4th conference on USENIX Tcl/Tk Workshop), 2(1996):15.
5. Dhananjay Nene, “Performance Comparison”, http://blog.dhananjaynene.com/2008/07/performancecomparison-c-java-python-ruby-jython-jruby-groovy/.
6. Humphrey, W., Dalke, A. and Schulten, K., "VMD - Visual Molecular Dynamics", J. Molec. Graphics,
14(1996):33.
7. Myrna I. Merced Serrano, “Metrics for the Study of DNA-CNT Hybrids and a Prototype of MoSDAS Graphical
User Interface”, (PREM Technical Report), (2007).
8. Myrna I. Merced Serrano, “Graphical User Interface to Run Molecular Dynamics Simulations of CNT-Polymer
Hybrids in VMD”, (PREM Technical Report), (2007).
239