1
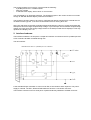
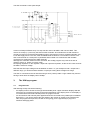
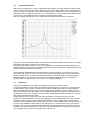
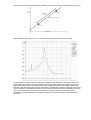
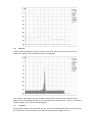
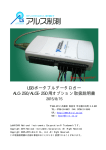
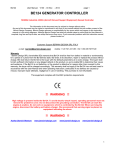
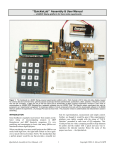
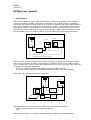
2002/9/4
Version 1.2
XYdisp user manual.
1. Introduction.
The XYdisp program is a tool for using an old DOS PC or laptop as XY display to show response
curves measured by a sweeper – log-detector combination. The sweeper is setup to repeatedly
sweep across the frequency band of interest, the frequency is applied to the device under test (DUT)
and the DUT’s response is measured with a log-detector. The DUT can be a device such as a filter,
attenuator or amplifier. The log-detector converts the input-level to a logarithmic DC level across a
wide frequency band. Suitable log-detectors could be the Philips NE604, Motorola MC3356, Analog
Devices AD606 or the newer AD83xx variants. A typical measurement setup would look like this:
Sweeper
Oscilloscope
Log-detector
Xout
Fout
Fin
Log-out
Yin
Xin
DUT
Sweeper setup using oscilloscope as XY display
Using an oscillloscope to display de DUT’ s response curve is not always convenient. More often
than not, the oscilloscope is already used monitoring some part of the DUT. The XYdisp program
runs on a simple PC or laptop and thus the oscilloscope is free for other uses. Also, using a PC to do
the display job brings other advantages:
- the PC can make screendumps of the display for documentation purposes
- the PC can make a dump of the datapoints measured for further use in a spreadsheet
Using a PC, the measurement setup would look like:
Sweeper
Log-detector
Xout
Fout
Fin
Log-out
PC
DUT
I2C
I/f
Xin
Yin
ADC
Sweeper setup using XYdisp
The disadvantage is, that the user has to construct two small pieces of hardware:
- an I2C interface between the PC’s parallel port and the
- ADC
Both pieces are however, very simple; they are described in detail in the following chapter.
The XYdisp program runs on all PC’ s that provide the following:
- a parallel port at LPT1 or address $378
- DOS 3.0 or better
- A 640x480 VGA display, either colour or monochrome
The VGA display is an important restriction. The XYdisp program in the current version is not smart
enough to deal with different display cards and resolutions.
This program has been written to be used on (old) 486 type laptops running DOS. It should also run
on faster Pentium type PC’ s, but has not been tested on PC’s running NT or XP.
Also note, that inputs to the ADC channels should range between 0 and 5V. XYdisp works best with
sweepers that use a triangle shaped sweep voltage. If your sweeper uses a sawtooth shaped sweep
voltage, the trace where the sweep voltage returns to the start point will also be displayed. This may
upset the line-display, see 3.13.
2. Interface hardware.
The interface hardware is in two parts: a simple I2C interface connected to the PC’s parallel port and
a four-channel 8-bit ADC controlled through I2C.
The I2C interface:
is the standard Philips schematic. It uses one 74LS05, a few resistors and a capacitor. The powersupply is external. The SCL, SDA and GND leads are wired to a convenient connector.
The interface could be built on a small piece of perfboard directly soldered to a DB25 connector.
The ADC schematic is also quite simple:
It uses one Philips PCF8591 chip. This chip has four 0-5V 8-bit ADC’s and one 8-bit DAC. This
version of XYdisp (1.1) uses only the first two ADC channels. All channels have a 100k resistor to
ground to prevent unconnected inputs adding noise to used inputs. Power is supplied externally: any
9-12V DC supply will do. The SCL, SDA and GND leads are wired to a convenient connector. The
ADC could be built on a small piece of perfboard and mounted in a screened box with suitable
connectors for at least the first two ADC channels.
Although the schematic shows four ADC channels, the XYdisp program only uses the X and Y0
channel. (See 3.13, where Y2 is also used)
Decoupling capacitors on the regulator’s input and output are important, as the 5V DC is also used as
the ADC’s reference voltage.
Note that the ADC input voltage must be between 0 and 5 V. If your sweeper X and Y output has a
different range, you should resistive dividers or op-amps to bring these voltages into range.
The ADC is connected to the I2C interface using a short (<50cm) cable. Longer cables may result in
having to slow down the display rate of XYdisp.
3.
The XYdisp program.
3.1
Program start.
After starting XYdisp checks the following:
- the display must be at least a VGA type with 640x480 pixels. Higher resolution displays will also
work but may not look as good due to the pixel interpolation of the display driver. If the display is
not VGA and has less than 640x480 pixels, the program will exit.
- An I2C interface with external power applied should be connected to the parallel port on address
$378 (LPT1). You cannot change the port setting in this version of XYdisp. If the interface test
fails, the program will report this, but will not exit, giving you the opportunity to plug in the
interface and apply power.
3.2
Program initialisation.
After startup, XYdisp will try to open an initialisation file xydisp.ini. This file contains a delay/no delay
option line (see 4) and two lines with calibration factors used to display dBm power levels along the
Y-axis. If this file is not present XYdisp will use default values. The first time you run the program, the
calibration values in xydisp.ini will result in an Y-axis starting at –10 and ending at 260. These values
are chosen so, that straight 8-bit ADC readings of 0-255 fall in this range.
After this, XYdisp will read the X and Y values and show these on the screen in a line plot:
Here, the Y-axis has the default range –10 to 260 and no frequency data or title is shown. In the right
hand part of the display the menu choices are shown.
The program shows the response curve of a HF preselector circuit peaked at 5 MHz. (Note that my
sweeper does not have sufficient harmonics suppression: the first small peak is caused by he second
harmonic when the sweeper is at 2.5 MHz)
XYdisp works by repeatedly taking samples of the Xin and Y0in input in an asynchronous manner.
This means that XYdisp is not in any way synchronised to the sweeper itself. It also means that the
display is slowly built up as more and more points along the x-axis get measured. Althoug display
refreshing maybe slow, changes in a response curve (after tweaking the DUT for example) are
generally easy to recognise, even if the curve is not completely updated.
3.3
Calibration.
The first thing that should now be done is calibration of the Y-axis. Select option c.
XYdisp will first ask for a high power level. Set the sweeper frequency to the DUT’ s peak response,
set the sweeper output level to a sensible value, read the actual power level from the log-detector
output or display and enter this value. Let us assume that the sweeper is set to a frequency of 5.0
MHz and an output level of app. 0 dBm. The log-detector would read a little less due to the losses in
the preselector, let us say –2.5 dBm. Enter this value. XYdisp will then make a number of Y-channel
ADC readings and average this value.
XYdisp will then ask for a low power level. Set the sweeper to a frequency well off from the
preselector’ s peak response. Let us say the log-detector reads –62 dBm. Enter this value. XYdisp
will again make a number of ADC readings and average this value. XYdisp will then calculate the
regression factors needed to plot the ADC values along a Y-axis with dBm labels. XYdisp will ask you
if you want the calibration values written in the xydisp.ini file, to be used the next time you start the
program. The Y-axis limits are determined by the high and low power levels you entered. Levels are
rounded to the nearest multiple of 10 and then an extra 10 is added in both the high and low range.
In the example above, the Y-axis limits are set to +10 and –80.
This procedure is a two-point calibration, assuming a linear log-response of the log-detector you use:
X
High
power level
ADC
value
Calibrated
range
ADCvalue=a x powerlevel +b
Low
power level
Power level
Y
After calibration, the response curve is shown with the correct power level on the Y-axis:
If your log-detecor does not provide a power level readout, the calibration could still be done if you
know at least the power level of the sweeper at one output level setting. Most often, the maximum
output level of the sweeper is specified. Connect a reliable attenuator to the sweeper and the logdetector to the attenuator output. Set the attenuator to a setting that provides a safe high power level
to the log detector. Calculate the resulting power level and use this level in the calibration procedure.
Then, set the attenuator to provide a low power level to the log detector, for example add an
attenuation of 60 dB. Calculate the resulting low power level and use this level in the calibration
procedure:
Sweeper
Log-detector
Xout
Fout
Fin
Log-out
PC
Attenuator
I2C
I/f
Xin
Yin
ADC
Calibration with an attenuator
3.4
Correct Xaxis labels.
The curve shown in 3.3 is not plotted along the full length of the X-axis. The reason is that the Xout
output of my sweeper has a maximum of app. 4.25V. This could (and should) be corrected in the
sweeper itself of course, but XYdisp has a x option to replot the X-axis labels in such a way that they
fit the curve. This is done after waiting a few sweeps for the curve to be complete and then typing x.
The program will then determine which X values at the left and right extreme of the ADC range have
not been measured, and replot the X-axis labels accordingly:
The tick mark at the centre of the X-axis is now at the sweeper’s centre frequency. This frequency is
shown on my sweeper’ s display, so I always know the frequency at this point.
3.5
Pixel plot.
XYdisp can plot the curve as a scatterplot using pixels only by choosing the p option. This was added
to slightly speed up the plotting. This option should also be used if your sweeper uses a sawtooth
shaped sweep voltage. The trace where the sweep voltage returns to its start point may be displayed
depending on the voltage of the log-detector.
3.6
Bar plot.
Another option is plotting the response curve as a bar chart. Choose b. This gives a more clear
display of a response curve with narrow peaks (a crystal filter):
Note however, that XYdisp uses an 8-bit ADC to determine the X value, meaning that only 256
different levels are available and that very narrow peaks in the response curve, such as in a spectrum
analyser display, may not be accurately displayed.
3.7
Line plot.
Entering option l will get you back to the line plot. This is also the default plot mode. Line plot may not
be the best option if your sweeper uses a sawtooth shaped sweep voltage. See 3.13.
3.8
Plot title.
For documentation purposes, a title and sub-title can be added to the display by choosing the t
option. The program will ask for a title and sub-title string with a maximum of 40 characters.
3.9
Frequency data.
Another option is f. This allows you to enter the centre frequency and frequency span. The frequency
data is displayed along the X-axis:
3.10
Dump data to file.
After entering option d, XYdisp will ask you for a filename and dump the X and Y data points to that
file for later analysis in perhaps a spreadsheet program. If you have entered frequency data, each
data point will be output with its (calculated) frequency, otherwise, the data points are output as the
X-number plus the accompanying Y-value:
1 ,
11.992242 , -68.996209
2 ,
11.992288 , -68.996209
3 ,
11.992333 , -68.473745
4 ,
11.992379 , -68.473745
5 ,
11.992424 , -68.996209
6 ,
11.992470 , -68.473745
7 ,
11.992515 , -68.473745
8 ,
11.992561 , -68.473745
9 ,
11.992606 , -68.473745
10 ,
11.992652 , -67.951282
11 ,
11.992697 , -68.473745
12 ,
11.992742 , -67.951282
13 ,
11.992788 , -67.951282
14 ,
11.992833 , -67.951282
. . . . .
If no frequency data has been entered, the second column in the data dump file will not be present.
3.11
Halt display.
Option h will halt the display update. The X- and Y-axis are replotted. In the left-hand corner of the
plot the text Stopped appears. This option is useful if you want time to study a particular plot or want
to make a screen-dump.
3.12
Resume display.
Option r will resume the display update.
3.13
Suppressing sweeper retrace.
Sweepers may use a sawtooth shaped sweep voltage with the result that the retrace part of the
sweep voltage may be shown in the display:
Version 1.2 of Xydisp has been extended with an option s to suppress this part. The user must then
supply a pulse with a voltage of more than 2.5V to the fourth ADC input (Yin2 in the ADC schematic)
during the retrace part. The retrace part will not be shown:
Option i switches back to normal (triangle shaped) sweep voltage.
3.14
Program end.
Option q (or typing the escape key) will end the program.
4
I2C and the speed of your PC.
XYdisp should run on slow 386 as well as on faster 486 PC’s. The PCF9851 is made for a 100kHz
I2C bus speed. This means having pulse-widths of app. 10 microseconds. In practice, using a short
I2C cable, pulse widths can be made as small as a few microseconds, speeding up the dataacquisition quite considerably. Timing of the I2C pulses is determined using timing routines that
should work independent of the speed of the PC. However, on slow 386 and 486 PC’ s, these
routines will cost too much time to call and therefore the first line in the file xydisp.ini with the text
delay, may be changed in no delay. Timing routines are then skipped entirely. If program appears to
work incorrectly, you should change the line back to delay.
5
Making screen dumps.
Screen dumps can be useful when you are documenting your work. Various programs are available,
I chose PCXDUMP because this program had the option to directly dump an inverted grey-scale
image of the display to a file. It is available on the SIMTEL website at www.simtel.net, search for
pcxdmp93.zip.
6
The XYdisp program source.
XYdisp is written in C. I used this language because of the availability of a free version of Borland’s
Turbo C (www.borland.com) and because I started with Peter Anderson’s C source of an I2C
example of controlling a Philips PCF8574 8-bit I/O extender (www.phanderson.com). I have modified
this source to the needs of the PCF9851 ADC/DAC. I used the Turbo C graphics examples to get the
plotting part going. The source is included with the executable and schematics, so you can modify or
extend the program to your needs.
7
What next?
Actually, you should ask yourself: “What can I do?” You could extend the program to plot two Ychannels instead of one, enabling you to do measurements with reflection bridges etc. You could add
other I2C IC’s, such as higher resolution ADC’s. You could try and measure the log-detector’s input
frequency as well, resulting in accurate X-axis labels. The limit to all this is nothing more than your
imagination…
Charlos Potma