1
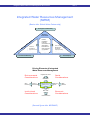
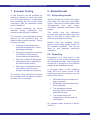
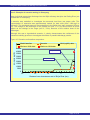
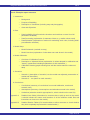
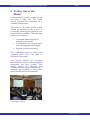
8.
Information
Exchange
7.
Conflict
Resolution
6.
Water
Saving
Society
5.
Economic
Tools
4.
Permitting
3.
Demand
Management
2.
IWRM
1.
WRA
Integrated Water Resources Management Documents
AN1.5
China – UK, WRDMAP
Integrated Water Resources Management
Document Series
Advisory Note 1.5: Use of Qual2K Water Quality
Model in IWRM Planning
May 2010
Integrated Water Resources Management Documents
AN1.5
Integrated Water Resources Management
(IWRM)
(Basics after Global Water Partnership)
Ecological sustainability
Enabling
environment
ts
en
m
ru
st
in
t
en
em •
g
Allocation
a
an
•
Regulations
M
•
•
Economic Tools
….
…..
•
•
•
•
•
Policies
Legislation
Fora and
mechanisms for
participation
International /
inter-provincial
co-operation
…..
….
•
•
•
•
In
st
itu
tio
na
Level of action l R
ol
es
Management
boundaries
Capacity building
…..
…..
Economic efficiency
Social Equity
Driving Elements of Integrated
Water Resources Management
Environm ental
Considerations
Water
Resources
Resource
Assessments
Institutional
Considerations
Regulation and Control
Water Permits
Water Resources
Management
Resource Charges
and
Water Tariffs
Social
Considerations
Water Use
Norms
Water
Demands
Economic
Considerations
Financial Resources
(Second figure after WRDMAP)
Integrated Water Resources Management Documents
Summary: This document is aimed at
practitioners
of
water
resources
management who are interested in
employing the Qual2K water quality model
as a tool to assist in that management.
An overview of the modelling process is
given here, including a description of the
Qual2K model, it’s data requirements and
functionality, as well as how to approach a
modelling project from scoping the study
to reporting the results.
This document covers the following topics:
•
Overview of the modelling process
•
Overview of the Qual2K model
•
Planning the modelling work
•
Data processing and estimation
•
Calibration
•
Modelling different scenarios
•
Interpreting and reporting model
results
•
Further uses of the model
This document is part of a series
addressing aspects of integrated water
resources management (IWRM) under
which water quality is increasingly viewed
as a critical component. It should be read
in conjunction with Thematic Paper 1.5
‘Use of Water Quality Modelling for Water
Protection’ and Example 1.5 ‘Water
Quality Modelling in Chaoyang, Liaoning
Province’.
The Ministry of Water Resources have
supported the Water Resources Demand
Management
Assistance
Project
(WRDMAP) to develop this series to
support WRD/WAB at provincial, municipal
and county levels in their efforts to achieve
sustainable water use.
AN1.5
1 Introduction
Water pollution is a health hazard to
people, and can be damaging to the
environment. Water quality modelling
can be used to better understand
sources of pollution and to understand
how the quality of the receiving waters
can be improved.
Practitioners of integrated water
resources management (IWRM) may
find water quality modelling useful for
informing decisions about pollution
control (such as discharge permitting)
or demand management (such as
abstraction permitting).
A model can be used to test “what if?”
scenarios which can demonstrate the
effect on water quality in a river due to
changes
in
abstractions
and
discharges, or changes in flow
volumes (e.g. drought conditions).
Conversely, discharge and abstraction
limits to achieve specific river water
quality targets can be investigated
using a water quality model.
Water quality models can be used for a
variety of different purposes including
analysing pollutant spills and predicting
long-term water quality in rivers.
This document focuses on the Qual2K
model and how it can be used. Further
details of the model are available in the
user guide (Chapra et. al., 2006).
For an overview of how water quality
modelling is currently used and
opportunities for future use in China,
see Thematic Paper 1.5 ‘Use of Water
Quality Modelling for Water Protection’.
Examples shown in this document are
from work undertaken with Qual2K in
Chaoyang, Liaoning Province. For
further details see Example 1.5 ‘Water
Quality Modelling in Chaoyang,
Liaoning Province’.
Page 1 of 19
Integrated Water Resources Management Documents
AN1.5
Model set up and calibration is an
iterative process. The results usually
raise questions about data gaps which
allow the investigators to focus their
attention on a particular data set.
2 Overview of the
Modelling Process
An overview of a typical modelling
process is shown in Figure 1. The
steps listed are described in more
detail in the remainder of this booklet.
Following calibration, the model can be
used to test possible future scenarios.
The model results should be analysed
carefully and reported thoroughly.
The modelling process should always
begin with a planning phase which
should establish the questions to be
answered using the model and the
availability of information.
Discussions with stakeholders (such
as other organisations involved in
water management) are important
throughout the modelling process.
Data is input to the model and
assumptions are made where no data
is available. The model is calibrated
based on the available data.
Figure 1 Overview of modelling process
Plan modelling work
Discussion with stakeholders
Begin model set up
Add available data to model
yes
Make assumptions for unavailable values
Calibrate model
(using reaction rates, coefficients, dummy
discharges, etc)
no
Check your
assumptions – can
you improve them?
no
Does the model
agree well with the
data?
yes
no
yes
Check the data – are
there errors or gaps?
Should you process it
differently?
Try a new “what if?” scenario
(keep the calibration reaction rates, coefficients etc)
Compare the new scenario with the baseline
Analyse and report on results
Discussion with stakeholders
Page 2 of 19
Integrated Water Resources Management Documents
3 Qual2K Overview
3.1 Obtaining the model
The Qual2K model is developed for the
United
States
Environmental
Protection Agency (USEPA).
You can download a zip file containing
the latest version of the model and
supporting documentation for free from
http://www.epa.gov/Athens/wwqtsc/ht
ml/qual2k.html. (Note that the user
manual is in English).
Model development is ongoing and
updates are issued on the website.
3.2 The model theory
The Qual2K model is a onedimensional model and so it is
assumed to be well-mixed in the
vertical and lateral directions. It is a
steady state model, so the flow and
water quality cannot evolve over time.
Diurnal variations in water quality (due
to the diurnal variation in temperature
and sunlight) can be simulated.
3.3 How the model functions
Full details of the model’s functionality
are given in the user guide (Chapra et
al, 2006); an overview is given here.
Qual2K is written in an Excel
spreadsheet with VBA macros and a
FORTRAN program to undertake the
calculations.
The user enters hydraulic, water
quality, and climatic data (see
Section 3.4). Figure 2 shows examples
of typical inflows, discharges and
abstractions that can be included in the
model. For all inflows and discharges,
both a flow rate and water quality
values must be provided. For
AN1.5
abstractions,
necessary.
only
a
flow
rate
is
Figure 3 shows examples of typical
hydraulic parameters that may be
included in the model. This includes
dimensions of river cross-sections,
dimensions
and
parameters
to
describe weirs, dams or waterfalls, and
the bed slope along the river. Where
sufficient data is available, rating
curves can also be included into the
model.
Guidance is given in the Qual2K user
manual on how to describe hydraulic
structures in the model.
In a Qual2K model, the river is divided
into several reaches then each reach
is divided into a user specified number
of
elements.
Abstractions
and
discharges can be positioned at any
point along the river. If a weir, dam or
waterfall is to be included in the model,
this must be positioned at the end of
the reach, and that reach must consist
of only one element.
Data at inflows are needed for the
model’s calculations and can be
entered into the model “Headwater”,
“Diffuse Sources” and “Point Sources”
worksheets. (Physical dimensions and
descriptors of the reaches should also
be
entered
into
the
“Reach”
worksheet.)
Water quality and flow data for
calibration should be entered into the
yellow “Hydraulics Data”, “Temperature
Data” and “WQ Data” worksheets.
These values are not used in the
model calculations but are plotted on
the output graphs for comparison with
the model output during the calibration
process.
Page 3 of 19
Integrated Water Resources Management Documents
AN1.5
Figure 2 Typical inflows and outflows required for a river water quality model
Upstream boundary
Inflow
Tributary
inflows
Direction of flow
Population
(sewage)
outflow
Agricultural
abstraction and runoff
Industrial
Downstream boundary
abstraction and discharge
Figure 3 Hydraulic data required for a one-dimensional model
Upstream boundary
Inflow
Weirs
Direction of flow
Reservoirs
& dams
outflow
Downstream boundary
Bed slope
Cross sections
& water level
Page 4 of 19
Integrated Water Resources Management Documents
3.4 Data requirements
Qual2K
requires
water
quality,
hydraulic and climatic data and
parameters for its calculations.
Additional information can be found in
the Qual2k user manual (Chapra et al,
2006).
It is possible to use estimates of many
data values if measured values are not
available - the effect of this is to reduce
the accuracy of the model output.
AN1.5
Hydraulic
required:
and
hydrological
data
•
Flow rates (m3/s) at headwaters,
point discharges / abstractions,
and diffuse discharges /
abstractions;
•
Dimensions for each river reach
(reach length, bed width, bank
slopes and bed slope);
•
Locations for upstream and
downstream ends of each
reach;
•
Height, width and shape of any
weirs, dams and waterfalls;
•
Rating curve parameters where
available (e.g. at gauging
stations);
•
Manning’s n for river reaches.
•
Rainfall runoff data
Gauging station in Liaoning
Page 5 of 19
Integrated Water Resources Management Documents
AN1.5
Daling River, Liaoning Province
Water quality data required (at
headwaters, point sources, and diffuse
sources):
Water quality and flow measurements
are also required at locations
throughout the model for calibration.
•
Temperature (OC)
•
Nitrate, NO3 (µg/l of N)
•
Conductivity (µsiemens)
•
Organic Phosphorus (µg/l of P)
•
Inorganic Solids (mg/l, dry
weight)
•
Inorganic Phosphorus (µg/l of P)
•
Dissolved Oxygen (mg/l of O2)
•
Air temperature
•
Phytoplankton (µg/l)
•
Wind speed
•
CBODslow (mg/l of O2)
•
Dew point temperature
•
CBODfast (mg/l of O2)
•
Percentage cloud cover
•
Detritus (POM) (mg/l, dry
weight)
•
Percentage shade
•
Pathogens (cfu/100 ml)
•
Organic Nitrogen (µg/l of N)
•
Alkalinity (mg/l of CaCO3)
•
Ammonia, NH4 (µg/l of N)
•
pH
The reaction rates and settling
velocities for the water quality
parameters are typically user defined
parameters. Default values for the
reaction rates and settling velocities
are provided in Qual2K but may be
adjusted during calibration.
Climatic data required:
Page 6 of 19
Integrated Water Resources Management Documents
4 Planning the Model
The modelling process should always
begin with a planning phase which
should establish the questions to be
answered using the model.
4.1 Mapping
When planning your model, always
start with map(s) of the area,
preferably using GIS software. Include
as many of the following things as
possible on the map(s):
AN1.5
Using these maps throughout the
modelling will help with planning the
model, processing the data, calibrating
the model and analysing the results.
4.2 Model scope
A scoping phase should be undertaken
before any modelling or data
collection. The following questions
should be considered:
•
What questions do we want the
model to help us answer?
•
What information and data is
available?
•
Where should we focus in on?
(e.g. highly polluted reaches)
•
River and tributary centrelines
•
Digital elevation map (DEM)
•
Catchment boundary
•
Reservoirs and lakes
•
Flow gauging stations
•
Water quality monitoring points
•
Areas of habitation
4.3 Model schematisation
•
Pollution discharge locations
•
Abstraction locations (where
water is extracted from the river,
not the location of the entity with
the abstraction license)
•
Structures affecting the flow
•
Drinking water supply zones
•
Agricultural areas
During the scoping stage, the model
schematisation should be determined.
Schematisation describes how the
model will be used to represent the
water bodies being studied. This
includes identification of the location of
the boundaries, nodes and reaches
required, as well as how to represent
features such as reservoirs or coastal
influences.
•
Groundwater abstractions
As you develop the model, you should
also include on the map(s):
•
Model boundaries
•
Model nodes and reaches
(numbered as in the model)
•
Contributing catchment for each
model reach
•
Names or identification labels for
any discharges, monitoring points
etc as included in the model
Using your map and the answers to
these questions, you can decide what
area the model will cover.
Model boundaries and calibration
nodes are usually determined by the
locations of gauging stations because
of the need for flow and water quality
data as model input. Other nodes can
be positioned at particular locations of
interest (where a result is required), at
confluences with tributaries, or at
physical features (such as dams)
which must be included in the model to
represent the hydraulics appropriately.
Care must be taken to represent the
hydraulics of the water bodies
Page 7 of 19
Integrated Water Resources Management Documents
appropriately so that the change in
conditions from one node to the next
can be successfully modelled. For
example, if a river system under study
using a 1D model contains a large
reservoir, model nodes and crosssections must be included to allow the
volume of the reservoir to be
represented. In large reservoirs,
residence time is sufficient for
significant water quality changes to
occur during the reservoir transit. It is
therefore necessary to include suitable
cross-sections within the reservoir so
that the model is able to approximately
reproduce the time delay and therefore
the decay processes taking place
within the reservoir body. In such a
circumstance just including a cross
section upstream of the reservoir and
one immediately downstream of the
dam would lead to erroneous results
from the model downstream of the
reservoir as the storage volume of the
reservoir would be grossly underrepresented. The reservoir dam must
also be included in the model to allow
the reservoir reach(es) to fill up with
water.
AN1.5
4.4 Stakeholder involvement
It is beneficial to involve other
stakeholders throughout the project,
but particularly at the planning stage.
Stakeholders might include other
agencies with some responsibility for
water quality such as municipal,
provincial and county level EPB, WAB,
and Hydrological Bureaux.
Benefits from stakeholder involvement:
•
Efficiency - multiple
organisations using a single
model can reduce costs
•
Information sharing – the more
data available, the better, so
share and discuss information
between all stakeholders
•
Improve model acceptance –
people who have been involved
in the modelling are more likely
to believe and understand the
results.
Involving stakeholders in the mapping stage
Page 8 of 19
Integrated Water Resources Management Documents
AN1.5
Figure 4 Example of map showing rivers, reservoirs, catchment boundary and DEM
Figure 5 Example of map of the reach to be modelled and monitoring locations
Page 9 of 19
Integrated Water Resources Management Documents
AN1.5
5.2 Simplifications for Qual2K
5 Data Processing and
Estimation
Simplified cross-sections
Qual2K requires a simplified crosssection that is defined by the bed width
and the slope of each bank. This
information can be taken from survey
data, or estimated during site visits.
5.1 How to use observed data
Observed data should be used at
model headwaters and for individual
enterprises (point sources). Other
observed data should be included in
the yellow data sheets for calibration.
For a low water level, it would be
inappropriate to simplify the entire
cross section shown in Figure 7. A
more suitable approach is to simplify
the small channel in which the water
actually flows at this flow rate. Figure
6 shows a small part of the surveyed
cross section (which represents the
river at low flow) on which a simplified
cross section has been superimposed.
A simplified cross-section for use
during high flows is shown in Figure 7.
Data sets should be consistent, i.e. all
data should be from the same
sampling round, or a long term
average. If no data is available for a
particular inflow for that monitoring
round then the data may be estimated
(based on other data if available).
Observed data values should NOT be
changed during calibration.
The estimation of the simplified crosssection is simply done by eye, with the
aid of a graphical comparison in an
Excel spreadsheet.
Figure 6 Cross-section for low flows
Figure 7 Cross-section for high flows
168
surveyed water level
164
E levation (m )
E levation (m )
165
167
166
165
surveyed water level
164
163
162
163
275
295
315
D istance from left bank (m )
70
170
270
D istance from left bank (m )
Page 10 of 19
Integrated Water Resources Management Documents
AN1.5
the Qual2K user guide (Chapra et al,
2006) Coefficient a is based on the
quality of the water flowing over the
weir and coefficient b is based on the
shape of the weir.
Rating curves
Qual2K can use a simplified cross-section
for weirs, dams, and waterfalls
Describing weirs
Qual2K models weirs, dams and
waterfalls in the same way. For each
structure the model requires the height
and width (in metres) and two
coefficients a and b. The coefficients
should be estimated using Table 7 in
Qual2K allows rating curves of the
form V=aQb and H=αQβ, where V is the
average velocity, Q is the flow rate, H
is the water level, and a, b, α and β are
coefficients
and
exponents
respectively. The values are entered
into the “Reach” or “Headwater”
worksheets as appropriate.
Rating curves were derived for
Chaoyang Gauging Station by creating
“best fit” curves for the data which fit
the Qual2K format for rating curves.
(See Figure 8 below.)
Figure 8 Example of rating curve
Water level (m above datum)
.
98.7
98.5
98.3
H = 0.11Q 0.49
98.1
97.9
0
5
10
3
Flow rate (m /s)
15
Page 11 of 19
Integrated Water Resources Management Documents
5.3 How to estimate data
Learning how to estimate successfully
takes practice. When estimating, try to:
•
Keep it simple – use a fast and
straightforward process.
•
Base estimates on data from
similar locations where possible.
•
Base estimates on local
knowledge and experience –
visit the site, perhaps some
parameters can be guessed
from local knowledge.
•
Consult the literature – there
may be an approximation that
can be adopted (e.g. Box 1).
Box 1: Adopting approximations
Qual2K includes CBOD, however this was
not measured in Chaoyang. Instead,
BOD5 and CODcr values were measured.
A literature search revealed a number of
possible ways to estimate CBOD from
COD or BOD. The most appropriate
approximation was to assume that CODcr
≈ CBOD (Bartram and Ballance, 1996).
Estimated data values should be
clearly marked as such (e.g. use bold
red text in the model for estimated
values). A record should always be
kept of how values were estimated
(even if it just says, “Mr Liu suggested
this value based on his experience”).
5.4 Quality control
AN1.5
Begin by reviewing and checking the
data. This may be most easily
accomplished by plotting the data as a
visual aid. Ask yourself:
•
Is the data believable? (If you
are not familiar with local water
quality, ask someone who is.)
•
Is the data consistent? (E.g. is a
high water temperature
observed with a low air
temperature? Is the data
unexpectedly dramatically
different at one location?)
•
Is the data similar to the data
from last time? (Compare with
the last sampling round, or with
data from a year ago.)
•
Is there any data missing?
(Check the data against the
map of sampling points – is
everything there?)
Keeping records
Always record what data has been
received and any changes made to the
data (such as data processing,
correction of erroneous data, etc.) as
well as any assumptions made This
will help you to trace back through
what was done if you need to find an
error or check an assumption.
Check data processing
Data processing work should always
be checked independently. Mistakes
are easy to make and can be difficult
to find later – a lot of time can be
saved by checking the data processing
early.
Checking incoming data
Data should be checked as soon as it
is received. Any errors or omissions
will be easier to correct straight away.
Page 12 of 19
Integrated Water Resources Management Documents
AN1.5
Table 1 Interdependencies between water quality determinands
Parameter
Dependency (↑ = increases due to; ↓ = decreases due to)
Water temperature
Affected by conduction, convection (affected by air temperature and wind
speed)
↑ Solar radiation (↓ shade and cloud cover) and atmospheric long-wave
radiation (↑ air temperature)
↓ evaporation (affected by water and air temperatures)
↑ hydrolysis
↓ settling
↑ plant photosynthesis and reaeration if water is under-saturated
↓ CBODfast oxidation, nitrification, plant respiration and reaeration if water is
over-saturated
DO saturation is dependent on the water temperature (increased water
temperature leads to saturation at lower DO concentration)
↑ dams/weirs/waterfalls
In other reaches, can be specified by the user, otherwise:
↑ increased water velocity, increased wind speed,
↓ increased water depth
↑ detritus dissolution
↓ hydrolysis and oxidation
↑ detritus dissolution and hydrolysis of CBODslow
↓ oxidation and denitrification
↑ plant death
↓ hydrolysis and settling
↑ organic nitrogen hydrolysis and phytoplankton respiration
↓ nitrification and plant photosynthesis
↑ nitrification of ammonia
↓ denitrification and plant photosynthesis
↑ plant death
↓ hydrolysis and settling
↑ organic phosphorus hydrolysis and phytoplankton respiration
↓ plant photosynthesis (and settling if sorption onto settleable particulate
matter such as iron oxyhydroxides occurs)
↑ photosynthesis
↓ respiration, death, and settling
↑ plant death
↓ dissolution and settling
↓ death (natural die-off and light) and settling
↑ plant respiration, organic nitrogen and organic phosphorus hydrolysis,
and denitrification
↓ nitrification
Also affected by plant photosynthesis, but this can be ↑ or ↓
Dependent on alkalinity, total inorganic carbon, dissolved carbon dioxide
Conductivity
Inorganic Solids
Dissolved Oxygen
Reaeration
CBODslow
CBODfast
Organic Nitrogen
Ammonia, NH4
Nitrate, NO3
Organic Phosphorus
Inorganic Phosphorus
Phytoplankton
Detritus
Pathogens
Alkalinity
pH
Total inorganic carbon
Dissolved CO2
↑ CBODfast oxidation and plant respiration
↓ plant photosynthesis
Calculated from the DO reaeration rate
Italic text: parameters which are calculated by the model or set during calibration rather than input to the model.
Page 13 of 19
Integrated Water Resources Management Documents
may be useful for reaches such as
reservoirs that behave differently).
6 Calibration
6.1 The calibration process
It is standard practice to begin with the
default parameters (unless measured
values are available), then adjust them
as necessary during calibration.
Calibration is an iterative process:
•
the model is run with the
available data and initial
estimates of reaction rates,
settling velocities, etc.;
•
the co-located modelled and
observed values are compared;
•
the estimated calibration
parameters are adjusted until a
reasonable match is achieved
between modelled and
observed values.
Values for substance concentrations,
flow rates, and/or water depths are
typically compared during calibration.
Qual2K stores observed data
calibration in yellow “data” sheets.
AN1.5
for
Note that tributaries should be
calibrated
before
attempting
to
calibrate the main river. This is
because the tributary discharge will
affect the river water quality.
When adjusting the reaction rates and
settling velocities during calibration,
care should be taken to ensure that the
resulting values remain realistic.
Examples of realistic reaction rates
and settling velocities can be found in
standard texts (e.g. Bowie et al, 1985).
If there is concern over a particular
value, sensitivity tests can be
conducted. During sensitivity testing a
range of values are used for the
uncertain
parameter
and
the
differences in the model results are
assessed. This can give an indication
of how critical that particular value is.
Observed data values should NOT be
changed during calibration.
The calibration procedure usually
raises questions about data gaps;
ways to deal with these issues are
described below.
6.2 What can be adjusted
during calibration?
During calibration, any estimated
values can be adjusted (within realistic
bounds).
The reaction rates and settling
velocities for the water quality
parameters
are
typically
userestimated parameters. They can be set
for the entire model in the “Rates”
worksheet, or for individual reaches in
the “Reach Rates” worksheet (which
Locals and construction in the Daling River
Page 14 of 19
Integrated Water Resources Management Documents
AN1.5
6.3 What if calibration cannot
be achieved?
•
Groundwater infiltration volumes
•
Individual abstractions
Sometimes changing typical calibration
values such as Manning’s n and
reaction rates (within reasonable
values) cannot force the model to
match the observed data.
•
Individual discharges
In the longer term, data should be
collected for these missing values,
however in the first instance the
missing values can be estimated
during the calibration process and the
estimates introduced to the model as
“dummy” values.
In this situation, the first action should
be to check the input data and data
processing again. The assumptions
should also be checked and revisited
to ensure realistic values.
Model results can therefore indicate
the scale of the unavailable information
such as ungauged pollution discharges
or groundwater infiltration.
When calibration in this manner is not
possible, it may be because some
information is missing such as:
Box 2: Calibration example
During calibration of the Chaoyang model it became clear that large amounts of water are
lost along some reaches of the main river. These losses were determined (based on local
knowledge) to be due to groundwater infiltration, which is exacerbated by local groundwater
abstraction for irrigation. An estimate of this infiltration was included in the Qual2K model as
a “dummy” diffuse abstraction to match the flows observed in the river. The results of this
rough calibration are shown in Figure 9.
At some other locations there was a clear discrepancy between the observed data and the
model results; it was assumed that this was due to unknown abstractions and discharges.
These were included as “dummy” point sources in the model.
Figure 9 Effect of infiltration estimate on model predicted flows
a) without infiltration
b) with estimate of infiltration
6.00
6
Flow (cumecs)
5.50
5.00
5.00
4.50
4.50
4.00
4.00
3.50
4
3.50
3.00
3.00
2.50
3
2.50
2.00
2.00
1.50
2
1.50
1.00
1.00
0.50
0.50
5
5
4
3
2
1
0.00
180
1
160
160
140
120
120
100
Q, m3/s
80
60
80
Q-data m3/s
40
40
20
0
0.00
180
160
160
140
120
120
100
Q, m3/s
80
60
80
Q-data m3/s
40
40
20
0
Distance from downstream end of model (km)
Page 15 of 19
Integrated Water Resources Management Documents
AN1.5
7 Scenario Testing
8 Model Results
A new scenario may be modelled by
making a change to some input data
(e.g. the water quality of a discharge)
and comparing the new model result
(“scenario”) with the calibrated model
result (“baseline”).
8.1 Interpreting results
For scenario modelling, the values
adjusted during calibration (e.g.
reaction rates) should be retained.
The scenario runs undertaken should
depend on the questions that the
model is being used to answer. Typical
scenario runs are:
•
Changes to discharges from
individual enterprises to inform
discharge permitting
•
Changes to abstraction volumes
for individual enterprises to
inform abstraction permitting
•
Removal of artificial discharges
and abstractions to estimate of
the natural water quality
•
Decrease in headwater inflows
and rainfall runoff to inform
drought management planning
The results of the scenario test should
be compared with the baseline results,
see Box 3 for an example.
Always discuss the results with people
who know the local area and water
quality. They may be able explain data
discrepancies
and
may
notice
unrealistic (possibly erroneous) data
values.
The results from the calibration
process may indicate where there are
gaps in the data or where there are
unknown processes occurring.
Results from the scenario testing
predict future water quality based on
the scenario conditions. This can be
used to test proposed permitting
conditions.
8.2 Reporting
Preparation of a final report is the
conclusion of the model development
and operation process. The final report
should be a synopsis of the different
stages of the modelling process.
A thorough report of the modelling
study will be a useful record of the
following for anyone wanting to use the
model in the future:
•
What data was used and how it
was processed.
•
Estimated values and how they
were estimated.
•
The calibration process
including which values were
adjusted and why.
•
The model results, the
interpretation of these and the
conclusions.
An example report structure is shown
in Box 4.
Page 16 of 19
Integrated Water Resources Management Documents
AN1.5
Box 3: Example of scenario testing in Chaoyang
Many individual enterprises discharge into the Shijia tributary that joins the Daling River just
downstream of Chaoyang.
A scenario was modelled to investigate the ammonia load from two paper mills. The
concentration of ammonia was approximately halved for both mills (from ~200 mg/l to
100 mg/l). The predicted ammonia concentrations in the Shijia river were compared (Figure
10). The change to the discharge of the smaller mill (mill 1, 0.7 l/s) did not have as much
impact as the change in the larger (mill 2, 70 l/s) because of the relative sizes of the
discharges.
Although this was a hypothetical scenario, it clearly demonstrates the usefulness of the
scenario modelling process to investigate the effects of possible discharge permits.
Figure 10 Scenario and baseline comparison
Model baseline
Minimum NH4-data
Scenario
Maximum NH4-data
NH4 (ugN/L) data
Ammonia (ug/l N)
45000
Paper mill 2
40000
35000
30000
Paper mill 1
25000
20000
15000
10000
5000
0
20
15
10
5
0
Distance from downstream end of Shijia River (km)
Page 17 of 19
Integrated Water Resources Management Documents
AN1.5
Box 4: Example report structure
1.Introduction
o
Background
o
Purpose of Modelling
o
Description of Catchment (including map and photographs)
o
Aims and Objectives
o
Data Availability (list all monitoring locations and positions on map, list of all
parameters available)
o
Data Processing (explanation of treatment of data, e.g. median values used)
o
Data Estimation (explanation of method for estimating each value, including initial
pre-calibration estimate)
2.Data
3.Model Setup
o
Model Schematic (overlaid on map)
o
Model Overview (explanation of what data was used where in the model)
4.Model Calibration
o
Overview of Calibration Process
o
Description of Adjusted Values (explanation of values adopted for calibration and
“dummy” parameters including explanations of their estimation.)
o
Calibration Results (graphs showing how well the results match the observed
data)
5.Scenarios
o
Scenario 1 (description of scenario, how the model was adjusted, presentation of
results and discussion.)
o
Scenario 2… etc (same for each scenario)
6.Conclusions
o
Conclusions (summary of conclusions from model calibration, results and
scenario runs)
o
Assumptions (summary of assumptions and estimations made in the model)
o
Limitations (what the model is appropriate for, what it should not be used for)
Appendix A
Detailed User Guide (Information for someone else to pick up and run the model.
It should include the names and locations of all the different model files and
instructions on how to run the model.)
Appendix B
Detailed Results Tables (Full results tables to allow someone to check whether
they have completely reproduced the model results.)
Page 18 of 19
Integrated Water Resources Management Documents
AN1.5
9 Further Use of the
Model
Development of a water quality model
can incur a high cost. The model
should therefore be considered as a
valuable capital asset.
This type of 1D water quality model
should be developed with a view to
continually updating the model as new
data becomes available. This new data
might be the result of:
•
Focussed data collection for
expanding the model
•
Investigation into “missing” data
such as ungauged discharges
•
Regular routine monitoring
The calibration process should be
repeated each time new data is
included in the model.
The model should be reviewed
periodically to ensure it still adequately
represents the river system. This
review should be reported with
evidence to back up the conclusions. If
changes are required to the model,
these should also be documented.
Presentation of model results in
Chaoyang, Liaoning
Page 19 of 19
Integrated Water Resources Management Documents
AN1.5
Document Reference Sheet
Glossary:
Baseline
Calibrated model result showing the existing conditions.
Boundaries
The edges of a model – for a 1D model, upstream and
downstream boundaries are required. Data is required to establish
conditions at the boundaries – typically flow, water level, and water
quality conditions.
Calibration
Calibration is the process whereby estimated model parameters
(e.g. reaction rates) are adjusted so that the result agrees with the
available data.
Cross-section
Profile of the river bed and banks, perpendicular to flow direction.
DEM
Digital Elevation Model – a GIS based data set comprised of
topographic data.
Dummy value
Estimated value to account for an unknown or ungauged
discharge or abstraction, e.g. dummy diffuse abstraction to model
groundwater infiltration.
GIS
Geographical Information System – software for storing and
displaying spatially referenced data, e.g. ArcGIS software.
Headwater
The upstream end of a watercourse. Model headwaters may be
located in the middle of a river; in this case it is the upstream
boundary of the model.
Manning’s n
Roughness coefficient used in open channel flow equations. It is
estimated from the channel conditions and optimised during
calibration.
Node
Many models use “nodes” which are point locations at which the
hydraulic and/or water quality calculations are made. Some
models are cell based instead, and calculate values at cell centres.
Numerical
Numerical models use equations without an exact solution.
Numerical (typically computational) methods are used to solve the
equations.
Rating curve
A relationship between flow and water depth at a specific location.
Reach
A length of river, usually between two nodes.
Scenario
A hypothetical situation modelled by adjusting input parameters to
predict a possible future water quality, e.g. river water quality
resulting from a stricter discharge permit.
Steady-state
When conditions do not change with time; an equilibrium condition.
Integrated Water Resources Management Documents
AN1.5
Document Reference Sheet
Bibliography:
Bartram, J. and Ballance, R. (1996), Water quality monitoring, Spon, London, UK.
http://www.who.int/water_sanitation_health/resourcesquality/wqmonitor/en/index.html
Bowie, G.L., et. al. (1985), Rates, Constants, and Kinetics Formulations in Surface
Water Quality Modeling (2nd ed.), US EPA (document EPA/600/3-85/040).
http://www.ecy.wa.gov/programs/eap/models/rates_and_constants/index.html
Chapra, S.C. (1997), Surface Water Quality Modelling, McGraw-Hill
Chapra, S.C., Pelletier, G.J. and Tao, H. (2006). QUAL2K Documentation and Users
Manual. Civil and Environmental Engineering Dept., Tufts University, Medford, MA.
http://www.epa.gov/athens/wwqtsc/html/qual2k.html
Related materials from the MWR IWRM Document Series:
Thematic Paper 1.5
Use of Water
Protection
Quality
Modelling
for
Water
Example 1.5
Water Quality Modelling in Chaoyang, Liaoning
Province
Advisory Note 1.7
Designing a Monitoring Programme for Water
Quality Modelling
Advisory Note 8.4
Inter-agency Agreements for Collaborative Water
Quality Management
Where to find more information on IWRM – recommended websites:
Ministry of Water Resources: www.mwr.gov.cn
Global Water Partnership: www.gwpforum.org
WRDMAP Project Website: www.wrdmap.com
Integrated Water Resources Management Documents
AN1.5
Integrated Water Resource Management Documents
Documents will comprise of:
Thematic Papers
3.
Demand
Management
2.
IWRM
Produced under the Central Case Study Documentation
Programme of the GoC, DFID funded, Water Resources Demand
Management Assistance Project, 2005-2010.
1.
WRA
China – UK, WRDMAP
Training Materials
IWRM Document Series materials, English and Chinese
versions, are available on the following project website
5.
Economic
Tools
Examples
6.
Water
Saving
Society
Manuals
4.
Permitting
Advisory Notes
8.
Information
Exchange
Advisory Services by : Mott MacDonald (UK) leading a consultancy team
comprising DHI (Water and Environment), HTSPE (UK), IWHR, IECCO
(Comprehensive Bureau), CIAD (China Agricultural University), Tsinghua
University, CAAS-IEDA, CAS-CWRR, Gansu WRHB and Liaoning WRHB.
7.
Conflict
Resolution
WRDMAP Project Website: www.wrdmap.com