1
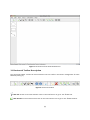
 Value Network Tool: A tool for Modeling, Simulating and Representing Value Networks Apostolos Zarras Computer Science Department, University of Crete, GREECE [email protected] Abstract The evolution of service systems has changed economic structure towards a service oriented ecosystem combining social science and technology. Service systems form networks in which value is created and captured by their members. The rapid growth and the increased complexity of service systems raises many challenging issues in their design and improvement. This document presents the value network tool which provides a range of graph drawing functionality, visualization and interactions within value networks. 1 Introduction The purpose of the Value Network Tool (VNT)1 is to provide a range of drawing functionalities in order to visualize and describe interactions within value networks. In addition, VNT provides value calculations based on the value analysis method which is proposed in [1]. VNT provides an approach to calculate value for every participant or the total value of the network. The benefits of understanding value networks are to determine which members are effective or not, how values change, how value networks evolve in the future, how value networks may be replaced by other value networks that are perceived as more competitive, how to quickly react to market changes, how to improve networks competitiveness, how do companies in a value network decide whether or not to accept a newcomer and how a company decides which network to join. These benefits are key questions that strategists, planners and information technology professionals have to answer on a continuous basis today. 1
http://vnt.tsl.gr/ 2 Graphical User Interface VNT creates a visual representation of a value network. VNT uses shapes as circles, rectangles and arrows (single, double). Also, supports standard editing functions as cut, copy, paste and delete, drag and drop operations for drawing components and finally provides zoom functions. The user is able to move components inside the editor to have a better positioning, edit the size and the label of each component displayed, undo and redo actions, group and ungroup components and finally save and open value networks. The tool provides the possibility of printing the value network that is been created. The user is free to determine the printer that he wants to use, allowing him at the same time to modify it in the way he wants even if it is part of a network. In concrete cases, VNT can also export the drawn Value Network in other formats as pdf, PostScript etc. The results are exported in xml which obey in concrete models and international standards. In this way it can portray value networks that have not been manufactured with the particular tool. This is very useful, especially in cases of corporation among different tools. Finally it can export suitably shaped xml, which can be imported in the IBM WebSphere Business Modeler4. The interface consists of a central window with two toolbars (one vertical and one horizontal), one menu bar and one status bar. The vertical toolbar contains buttons for the creation of participants and the connection between them, while the horizontal contains all the commands available in the tool. The menu bar offers the same operations with the two toolbars, as well as, some further operations for the xml export; the tool connection with the IBM WebSphere Business Modeler and for the way the one participant influences the other. 3 Components Description This section describes each component of VNT (see Fig. 1). 4
http://www‐306.ibm.com/software/integration/wbimodeler/ [2] Figure 1. Screenshot of the Value Network Tool 3.1 Horizontal Toolbar Description The horizontal toolbar contains all these elements that are useful in the better management of Value Network (see Fig. 2). Figure 2. Horizontal Toolbar New File. Create a new value network. Click on the new file icon or go to: File Æ New File. New Instance. Create new Instance. Click on the new instance icon or go to: File Æ New Instance. [3] Open. To open a value network file, click on the open icon or go to: File Æ Open and choose the name of the value network file to open. Make sure to have saved all previous work before opening a new value network file. Save. For the storage of value network, is allowed the choice of particular button or alternative the following path: File Æ Save. Afterwards, becomes the choice of the name and the file saved destination. After the file save, the name of the window is automatically been changed. If the file has already been saved one time, the previous steps will not be executed. Save As. For the storage of value network, is allowed the choice of particular button or alternative the following path: File Æ Save As. Afterwards, becomes the choice of the name and the file saved destination. After the file save, the name of the window is automatically been changed. Print. For the printing of value network, is allowed the choice of particular button or alternative the following path: File Æ Print. Afterwards, the user is free to determine the printer that he wants to use, allowing him at the same time to modify it in the way he wants even if it is part of a network. In concrete cases, VNT can also export the drawn Value Network in other formats as pdf, PostScript etc. Undo. For the undo the last actions, is allowed the choice of particular button or alternative the following path: Edit Æ Undo. Redo. For the redo the last actions, is allowed the choice of particular button or alternative the following path: Edit Æ Redo. Cut. Cut the selected item(s). To cut, select the component(s). To select a component, just click on the component. To select a group of components, drag the mouse to draw a selection square enclosing all the desired components. Selected components will be highlighted. Once the components are selected, click on the copy icon or go to: Edit Æ Cut. Copy. Copy the selected item(s). To copy, select the component(s). To select a component, just click on the component. To select a group of components, drag the mouse to draw a selection square enclosing all the desired components. Selected components will be highlighted. Once the components are selected, click on the copy icon or go to: Edit Æ Copy. Paste. Paste a copied or cut component(s). If there are some components previously cut or copy, you can paste them by clicking on paste icon or going to: Edit Æ Paste and they will appear on the value network. Delete. Delete component(s). To delete a component, select the component and click the delete icon or press the delete button of the keyboard of go to: Edit Æ Paste. If a group of components is selected, all the components will be removed. [4] Actual Size. Return the normal scale of the value network. To return to normal scale click on the actual size icon or go to: View Æ Actual Size. Zoom In. Zoom in the value network. To zoom in the value network click on the zoom in icon or go to: View Æ Zoom In. Zoom Out. Zoom out the value network. To zoom out the value network click on the zoom out icon or go to: View Æ Zoom Out. Group. Grouping is the concept of logically associating components with one another. Grouping involves one or more vertices or edges. Once grouped, the group component may be moved and resized like a stand‐alone component. Click on the group icon or go to: View Æ Group. Ungroup. For the ungrouping of objects that previously has been grouped, is allowed the choice of ungroup button or alternative the following path: View Æ Ungroup. When the objects ungrouped, can behave independent the one from the other. 3.2 Vertical Toolbar Description The vertical toolbar contains all these elements that are essential for the designing of value network. In these elements are contained circles, rectangles, as well as, single and double arrows (see Fig.3). Figure 3. Vertical Toolbar [5] Circle. The circle represents the participants. To entry the circle clicks on the circle icon or go to: Insert Æ Circle. Rectangle. The rectangle represents a nested value network. To entry the rectangle clicks on the rectangle icon or go to: Insert Æ Rectangle. Arrow. The single arrow represents the one way connection between two participants. It is usually used in order to declare that in collaboration between two participants, the source has profit while the destination has cost. Double Arrow. The double arrow represents the double way connection between two participants. It is usually used in order to declare that in collaboration between two participants, both the source and the destination have at the same time cost and profit. The icon that is meeting in the vertical toolbar represents the arrow that is activated the present moment. User can change the activated arrow by clicking on it. At the same time, will be change apart from the arrow and the attributes that each arrow has. The union between two participants becomes with the following way. Provided that it has been selected the suitable arrow (with the way that mentioned in the previous paragraph), the user can just select the source participant and by keeping stepped the left winger key mouse, he pulls the arrow to the destination participant. When afterwards, the left winger key mouse is been released, the arrow will continue linking two participants. Simultaneously, it will have been created in the participants properties the elements that resulted from this union. Remark. In the case that the left winger key mouse is released before the union between source and destination participant has been placed, then the arrow is been lost and does not exist union between two participants. 3.3 Menu Bar Description Menu Bar contains all these elements that are useful in the treatment of elements of value network, as well as in the calculation and export of data (see Fig. 4). Figure 4. Menu Bar 3.3.1 File Menu Description The File Menu contains the attributes that concern the way which are been imported and exported the data from the tool (see Fig. 5). [6] Figure 5. File Menu New File. Create a new value network file. New Project. Create a new value network project. Open. Open a value network file. Choose the name of the value network file to open. Make sure to have saved all previous work before opening a new value network file Save. Save a drawn value network. Afterwards, becomes the choice of the name and the file saved destination. After the file save, the name of the window is automatically been changed. If the file has already been saved one time, the previous steps will not be executed. Save As. Save a drawn value network. Afterwards, becomes the choice of the name and the file saved destination. After the file save, the name of the window is automatically been changed. Print. Print the drawn value network. Afterwards, the user is free to determine the printer that he wants to use, allowing him at the same time to modify it in the way he wants even if it is part of a network. In concrete cases, VNT can also export the drawn Value Network in other formats as pdf, PostScript etc. Import: • Import from VNT XML. Import xml files that represent a value network. • Import Selected Items. Import xml files that represent some elements been chosen from a value network. This feature is useful for the elements import from a value network to another. Export: • Export to VNT XML. Export xml files that represent a value network. • Export to WBI Modeler XML. Export xml files that represent a value network in a readable from the IBM WebSphere Business Modeler format. [7] •
Export Selected Items. Export xml files that represent some elements been chosen from the drawn value network. This feature is useful for the elements export from a value network to another. Exit. Exit from the tool. The user can save the drawn value network if he has forgotten it. 3.3.2 Edit Menu Description Edit Menu contains the attributes that concern the way which the data of the tool are been managed (see Fig. 6). Figure 6. Edit Menu Undo. Undo the last actions. Redo. Redo the last actions. Cut. Cut the selected item(s). To cut, select the component(s). To select a component, just click on the component. To select a group of components, drag the mouse to draw a selection square enclosing all the desired components. Selected components will be highlighted. Copy. Copy the selected item(s). To copy, select the component(s). To select a component, just click on the component. To select a group of components, drag the mouse to draw a selection square enclosing all the desired components. Selected components will be highlighted. Paste. Paste a copied or cut component(s). If there are some components previously cut or copy, you can paste them and they will appear on the value network. Delete. Delete component(s). If a group of components is selected, all the components will be removed. 3.3.3 View Menu Description View Menu contains the attributes that concern the way which the data of the tool are been portrayed (see Fig. 7). [8] Figure 7. View Menu Actual Size. Return the normal scale of the value network. Zoom In. Zoom in the value network. Zoom Out. Zoom out the value network. Group. Grouping is the concept of logically associating components with one another. Grouping involves one or more vertices or edges. Once grouped, the group component may be moved and resized like a stand‐alone component. Ungroup. Ungrouping the objects that previously has been grouped. When the objects ungrouped, can behave independent the one from the other. 3.3.4 Insert Menu Description Insert Menu contains the attributes that concern the way which the elements are been inserted in the tool (see Fig. 8). Figure 8. Insert Menu Circle. The circle represents the participants Rectangle. The rectangle represents a nested value network. 3.3.5 Calculation Menu Description Calculation Menu contains the attributes that concern the way which the data are been calculated(see Fig. 9). [9] Figure 9. Calculation Menu First Model. Model for the data calculation. Second Model. Model for the data calculation. Third Model. Model for the data calculation. 3.3.6 Help Menu Description Calculation Menu contains the attributes that concern the way which the user will be helped. Moreover offers some manufactured information (see Fig. 10). Figure 10. Help Menu VNT Help. It constitutes one complete menu, with regard to the attributes of tool. Users could send if they want e–mail in the constructional team, with regard to any queries that concern the tool or for any pointing out of problems. About TSL. It constitutes information for the Transformation Service Laboratory. About VNT. It constitutes general information for the tool. About VNT Team. It constitutes information about the constructional team. 3.4 Status Menu Description The Status Bar contains some basic information about the laboratory that the implementation took place. The most important part of the Status Bar is the memory usage monitor. The monitor shows the memory usage (1MB in the figure) and the memory allocated (2MB in the figure) by the application. Figure 11. Status Bar [10] 3.5 Elements Description Follow a description of attributes of each element. The description is similar even if the element is a participant of if it is a relation between participants (offering) Figure 12. Pop–Up Menu. Figure 12. Pop–Up Menu In order to become changes in the attributes of some elements of value network, the element must be first selected and afterwards be clicked the right key mouse. Rename. Change the name of an element. As soon as, it is activated the particular choice, a window is appeared that asks from the user to place the new name. After the new name insert the user click on the OK key, to activate the change. In the case that he clicks on the Cancel key, the name remains as it was before. In every case all the other elements are been informed about the results of this action. Properties. It appears a window with all the attributes of each element. There are two different cases depend on the element. If the element is a participant, the user cannot change the participant attributes. He only can observe the transactions that participant has with the other participants, as well as total income, expenses and profits of each participant. If the element is an offering, the user can change the data. He can determine the prices that participants take. Depending on the case, if it is one way or double way relation, he is determined also the extent of attributes. In every case all the other elements are been informed about the results of this action. Extra Info. It appears a window with the additional attributes that an element can have. It is similar so much for the case of participants what for the case of offerings. Priority. This choice is appeared only in the case of participants. It appears a window that a user inserts the priority of the participants. This is very useful especially in the case that there is connection between the VNT and the IBM WebSphere Business Modeler. 3.6 More Features When the user selects a vertex, will notice small handles (rectangles that you can grip for sizing) in the vertex’s corners and along its sides. Similarly, the selection of an edge results in handles at the source and target of that edge. These handles make it possible to resize the vertex or edge. Accomplish that task by using the mouse to select and drag a handle. The vertex or edge resizes in that direction. For [11] example, resize the vertex by selecting that vertex, gripping the handle in the lower‐right corner, and dragging the handle downward and to the right. He also can select a combination of vertices and edges by holding down Shift during the selection process. If he accidentally selects a vertex or edge that he does not want to be included, release Shift and press Ctrl to deselect that vertex or edge. Resizing or dragging a selection is accomplished through a cell handle. A cell handle uses means such as performing a color change and showing grayed edges in their new locations to provide users with visual feedback on how a graph will look after the change has been made. This feature is known as live–
preview. The presence of groups within a graph affects the selection process. When selecting a vertex or edge within a group, the first mouse click on the vertex or edge selects the group; the second mouse click selects the vertex or the edge. If groups are nested within other groups, it can take multiple clicks on the vertex or edge before that vertex or edge is selected. You can select multiple groups, vertices, and edges by pressing Shift and clicking each entity. If these entities exist within a rectangular area, an easier way to accomplish this task involves marquee selection. Marquee selection is a selection mechanism in which the user moves the mouse pointer to any location in the graph and presses a mouse button. As he drag the mouse pointer, he observes a rectangle – known as a marquee – that expands or contracts, based on the direction of movement. When he releases the mouse button, the marquee disappears; all groups, vertices, and edges completely within the marquee are selected. Sometimes, he will want to more accurately place a vertex, an edge, or a group during a drag operation—by constraining the drag to horizontal and vertical movement. In other words, he does not want to drag diagonally. That operation requires from him to hold down Shift while dragging the mouse. The clone selection feature is the duplication of a vertex, an edge label, or a group by holding down the Ctrl key while dragging the mouse. 4 Construction Technologies For the tool creation it was used the Java version 1.5 [5]. Furthermore, the graphical interface constructed with the JGraph API [6 – 11]. The advantages that offer this construction technology are the following: • Construction facilities. • Simple process of management, control and debugging. • Collaboration with other applications. • Extension possibility. 5 Functional Requirements The system requirements are summarized below: • System Directness. With the main buttons immediately available in obvious point of window, it is ensured that the user will select fast the desirable energy that he wants to fulfill. [12] •
•
•
•
•
Program Learning. The icons and the descriptions help the user to become familiar with the program in a short time. Also, the existence of help for each operation, ensure the fast familiarization with the application. Functionality. The tool will remain functional for enough time, according to the existing theory of value networks. Access and use. Is not required access code or any license, consequently is provided free access and use in all users of VNT. Environment. It is used a highly supportive interface with logical and clear structure. Extensiveness. The tool can be extended easily and fast. This provides the possibility of adding a lot of new attributes. 6 Execution The execution of tool becomes via the executable file VNT.jar and with the use of command: • java ‐ jar VNT.jar from the running directory. Alternative it can be also executed with the use of double click on the icon of VNT. The execution requirements are the following: • Existence of Java Virtual Machine (is recommended publication at least 1.5). • Existence of functional environment in which runs Java Virtual Machine. 7 Conclusion & Future Work There are only few tools that deal with the design of value networks [12]. This paper presents a brief description of VNT, mostly in the field of the user interface and the interaction with the user, a currently developed value network tool, offering a wide spectrum of functionalities in modeling, simulation and representation of value networks. Another distinctive characteristic of VNT is that offers ready calculations based on mathematical and economical types. The connection with other applications helps the user to familiarize with the whole business processes and business consulting. The future work of tool it concerns mainly in the sector of depiction nested value networks. The term “Nested Value Network” is reported in one entire Value Network which can find itself incorporated in some other. The existence shape of rectangle helps in this creation. It will be provided the choice of “export Value Network”. With this choice it will open a new window in that will exist incorporated the interior Value Network. Also, it will not exist restriction in the nested depth and consequently is increased the size of Value Network that is supported. [13] References 1. N.S. Caswell, C. Nikolaou, J. Sairamesh, M. Bitsaki, G. D. Koutras and G. Iacovidis, “Estimating value in service systems: A case study of a repair service system”, IBM Systems Journal 47, No. 1 (2008), http://www.research.ibm.com/journal/sj/471/caswell.pdf. 2. V. Allee, The Future of Knowledge: Increasing Prosperity through Value Networks; Butterworth – Heinemann, Boston (2002). 3. V. Allee, “Reconfiguring the Value Network”, Journal of Business Strategy 21, No. 4 (2000), http://www.vernaallee.com/value_networks/Reconfiguring_the_Value_Network.pdf. 4. V. Allee, Understanding Value Networks, Verna Allee Associates, http://www.vernaallee.com/value_networks/Understanding_Value_Networks.html. 5. The Java Language Specification, Third Edition, Sun Microsystems: http://java.sun.com/docs/books/jls/third_edition/html/j3TOC.html. 6. Tools of the Trade, Building Graphs with JGraph: http://www.samspublising.com/articles/article.asp?p=431106&seqNum=1&rl=1. 7. JGraph User Manual: http://www.jgraph.com/pub/jgraphmanual.pdf. 8. JGraph Source Code Distribution: http://www.jgraph.com/pub/jgraph‐latest‐lgpl‐src.jar. 9. JGraph Community Help Forum: http://www.jgraph.com/forum. 10. JGraph API specification: http://www.jgraph.com/pub/api. 11. JGraph Frequently‐Asked Questions: http://www.jgraph.com/faq.html. 12. Social Network Image Animator: http://www.stanford.edu/group/sonia/. [14]