1
Murdoch University
Engineering Internship Report – ENG450
“Condition Monitoring of Points Machine motors using a PIC
microcontroller”
Cory Spiers
19/11/2013
In Association with the Public Transport Authority of WA
Supervisor: Dr Gareth Lee
ENG450 – Engineering Internship
Page 1
Abstract
The Public Transport Authority of WA is responsible for delivering public transport services to
members of the public in Western Australia. The internship participated in, as part of requirements
of ENG450 was carried out in the control, communications and signals branch of Network &
Infrastructure within the engineering department. This branch is primarily concerned with railway
engineering. An important element within the rail networks are points machines, since are
responsible for allowing trains to change tracks.
Eliminating points machine failures would be a advantage to the PTA as this would minimise traffic
delays on the system. The proposed way of helping to eliminate these failures is to introduce
condition monitoring – a form of pre-emptive maintenance to the machines.
A device was researched and designed from scratch that will be used for condition monitoring of the
points machines. The design included building an electronic circuit, programming a microcontroller,
implementing an external memory chip, adding all required sensory equipment and power supplies
as well as assembling it within an enclosure.
Thorough simulations and testing were performed and documented to ensure the prototype
performed to a satisfactory level. The simulations and tests performed were all successful, except for
the failure of the high voltage regulator. The mistake has been identified and learnt from, and a new
contingency plan is in place to rectify the mistake.
The final project at the time of this report resulted in a device that could log a measured current at a
very high sampling rate. The only reason this project hasn’t reached full completion, which is reading
current from points machines, is the impending arrival of a DC-DC converter which is overdue.
Many vital skills had been gained during this internship placement such as research, design and
development in electrical engineering, time management, communication and consultation with
other stake holders and a better understanding of how the workplace and businesses operate on a
day to day basis.
ENG450 – Engineering Internship
Page 2
Acknowledgements
The following acknowledgements would like to be made a measure of gratitude to the following:
Rebecca Taylor – Principle Signals Engineer & Industry Supervisor, PTA.
Dr. Gareth Lee – Academic Supervisor, Murdoch University.
Mr Yang-Lit Phay – Signals Engineer, PTA.
A/Prof Graeme Cole – Senior Lecture in the Industrial Computer Systems stream, Murdoch
University.
Dr. Linh Vu – Senior Lecturer in the Instrumentation & Control stream, Murdoch University.
Acknowledgements are also given to all other academic and technical staff from Murdoch University
and all engineering and technical staff at the PTA.
ENG450 – Engineering Internship
Page 3
Contents Page
Abstract ................................................................................................................................................... 2
Acknowledgements................................................................................................................................. 3
1.0
Introduction ................................................................................................................................ 7
1.1
Problem Definition .................................................................................................................. 8
1.2
Project Scope ........................................................................................................................ 10
1.3
The Public Transport Authority of WA .................................................................................. 11
2.0
Condition Monitoring................................................................................................................ 11
3.0
Components .............................................................................................................................. 14
3.1
PIC24FJ64GA002 Microcontroller ......................................................................................... 15
3.2
MPLAB C programming compiler .......................................................................................... 17
3.3
Current Transducer ............................................................................................................... 19
3.4
Memory................................................................................................................................. 22
3.4.1
SRAM ............................................................................................................................. 22
3.4.3
SD Card .......................................................................................................................... 24
3.5
Circuitry ................................................................................................................................. 24
3.6
Sallen Key Filter ..................................................................................................................... 27
3.7 Circuit Protection ........................................................................................................................ 28
4.0
Pin-Out Configuration ............................................................................................................... 28
5.0
Simulations................................................................................................................................ 30
5.1
ADC Values v Voltage Linearity Test ..................................................................................... 31
5.2
Simulating a Points Swing in a Laboratory Environment ...................................................... 32
6.0
Testing ....................................................................................................................................... 36
6.2
Field Testing .......................................................................................................................... 37
6.1.1
Test 1 ............................................................................................................................. 37
6.1.2
Test 2 ............................................................................................................................. 38
7.0
Results ....................................................................................................................................... 41
8.0
Problems Encountered ............................................................................................................. 41
9.0
Future Improvements and Recommendations ......................................................................... 43
9.1
Increased Memory Capabilities ............................................................................................ 43
9.2
Increased I/O Functionality ................................................................................................... 44
9.3
Wireless monitoring .............................................................................................................. 45
9.3.1
9.4
Alarming ........................................................................................................................ 45
PCB Design ............................................................................................................................ 45
ENG450 – Engineering Internship
Page 4
9.5
Enveloping ............................................................................................................................. 45
9.6
Wiring .................................................................................................................................... 46
9.7
Data Processing ..................................................................................................................... 46
9.8
Additional Features ............................................................................................................... 46
10.0
Conclusions and Achievements ................................................................................................ 48
11.0
References ................................................................................................................................ 50
12.0
Appendices ................................................................................................................................ 53
12.1
Appendix A – C Code used for the MCU ............................................................................... 53
12.2
Appendix B – User’s Documentation on operation of the system. ...................................... 64
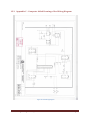
12.3
Appendix C – Computer Aided Drawing of the Wiring Diagram........................................... 66
ENG450 – Engineering Internship
Page 5
Table of Figures
Figure 1: Schematic of a Points Machine [1] ............................................................................................ 9
Figure 2: Normal to Reverse swing of points 1051 at Cockburn Central .............................................. 13
Figure 3: The PIC24FJ64GA002 microcontroller ................................................................................... 15
Figure 4: Pin Diagram for PIC24FJ64GA002 [7] ...................................................................................... 16
Figure 5: MPLAB programming environment ....................................................................................... 17
Figure 6: MPLAB ICD 3 In-Circuit Debugger .......................................................................................... 19
Figure 7: A graph showing the relationship between the current source and the transformed
current .................................................................................................................................................. 20
Figure 8: LEM LA 55-P/SP1 Current Transducers..................................................................................21
Figure 9: Circuit board with shunting resistors, capacitors and protection diode ............................... 21
Figure 10: 23LCV1024 Pin Diagram [12] .................................................................................................. 23
Figure 11: SPI read and write sequence [13] .......................................................................................... 23
Figure 12: DC-DC Buck Converter ......................................................................................................... 24
Figure 13: Summing Circuit ................................................................................................................... 25
Figure 14: DAQ signal processing [14] ..................................................................................................... 27
Figure 15: Simulation Set-up ................................................................................................................. 30
Figure 16: ADC Values v Voltage Linearity Test .................................................................................... 32
Figure 17: Terminal Emulator receiving logs ........................................................................................ 34
Figure 18: Relationship between ADC values and time ........................................................................ 35
Figure 19: Relationship between simulated current and time ............................................................. 35
Figure 20: The unit fully assembled in an electrical enclosure ............................................................. 37
Figure 21: Regulator integrated circuit damage ................................................................................... 39
Figure 22: Traco Power DC-DC Converter [22] ........................................................................................ 40
Figure 23: Example of how to wire into the relay................................................................................. 64
Figure 24: Q Style relay ......................................................................................................................... 65
Figure 25: CAD Wiring Diagram ............................................................................................................ 66
ENG450 – Engineering Internship
Page 6
1.0
Introduction
The aim of this report is to outline the project’s proposal, concepts and results for the purpose of
completing an internship with the Public Transport Authority of WA (PTA) as a part of the fulfilment
of ENG450/Engineering Internship.
The report will aim to give the reader an insight into the rail industry and specifically condition
monitoring of points machines. It will discuss all the components used, circuit design and
simulations. Physical results from the device being used on points machines in the PTA network will
then be discussed.
Finally, the report will give some insight to the reader of the problems encountered during the
project and also propose some future improvements.
Appendices are also included which will contain program code, an operation manual and a wiring
diagram.
ENG450 – Engineering Internship
Page 7
1.1
Problem Definition
Points machines are both a vital and critical system for the operation of any rail network in the
world. The points machine is responsible for directing rail traffic from one line of rail to another.
These manoeuvres happen frequently around depots and stations and are also performed in other
sections of the line. Public transport networks, such as the Perth suburban network operated by the
Public Transport Authority of Western Australia relies heavily on the points machines operating
efficiently. Failure of these points machines and the delay of trains have possible implications such
as:
Commuter chaos – This could leave the CBD at a standstill, as recent estimates claim that
over 75 000 people commute into the CBD of Perth every week day [1].
Productivity – As a result of people being stranded and not getting to work, the economic
result has the potential to cause losses for companies within the CBD.
Education – Many primary, secondary and tertiary students rely on trains to get to their
institutions. Failure to do so could have negative impacts - missing an exam for example.
Media – Negative media reports impact on people’s perception of public transport, this can
lead to people choosing to use their cars instead therefore creating more congestion on the
roads.
Congestion – Perth’s freeways are already at choking point and adding more cars would
results in increased commuting time to the city.
Regular maintenance is the best form of defence against a points failure. However, a more proactive
way of being able to predict when a points failure will occur, and being able to fix it before it
becomes a problem would an ideal solution. The answer to this is the use of condition monitoring.
Figure 1 shows a schematic of a points machine connected to a set of points, the grey area in the
schematic is points machine.
ENG450 – Engineering Internship
Page 8
Figure 1: Schematic of a Points Machine
ENG450 – Engineering Internship
[1]
Page 9
1.2
Project Scope
The proposed solution to minimizing points machine failures is to introduce condition monitoring.
The points turnouts are operated by points machines which are driven by DC motors, the forces
from these motors drive the blades of the rail. The PTA currently does not currently have any
condition monitoring devices across the network. The cost of installing the equipment would run
into millions of dollars [2]. The proposal is to create a portable device at a fraction of the cost.
Utilizing previous knowledge from the Industrial Computer Systems and Instrumentation Control
majors, the proposed project will involve creating a condition monitoring device using
microcontroller technology, creating an electronic circuit, using sensory devices and utilizing existing
power supplies.
A Microchip PIC24FJ64GA002 microcontroller along with other electrical components will be utilized
in order to perform the condition monitoring task.
ENG450 – Engineering Internship
Page 10
1.3
The Public Transport Authority of WA
The Public Transport Authority (PTA) is a government department responsible for providing the
Western Australian public with public transport services. It is comprised of Transperth, TransWA and
Transperth School Bus Services. Public transport services include trains, buses and ferries. Due to
Perth’s large recent population growth, public transport usage has also increased [3].
The public transport corridors of metropolitan Perth are amongst the largest public transport
corridors of any city in the world [3]. The rail services in particular require a large amount of
engineering support from:
Signals;
Communications;
Overhead transmission;
Power distribution;
Control systems;
Infrastructure;
Civil works.
The PTA must provide this engineering support and employs many staff in these areas under the N&I
division. N&I are primarily involved with maintenance but must also complete smaller projects and
commissionings.
2.0
Condition Monitoring
Condition monitoring can be defined as “the process of monitoring a parameter of condition in
machinery (vibration, pressure, current, temperature etc), in order to identify a significant change
which is indicative of a developing fault. It is a major component of predictive maintenance” [4].
In the terms of this project, monitoring the current of the DC motor as the points swing can indicate
if there are performance issues. Issues which can be diagnosed from identifying irregularities in the
current v time graphs include:
Obstruction between the two blades of the rail, for example ballast;
The clutch slipping;
Motor not being sufficiently greased;
Drive bar being damaged of bent.
Each of the above scenarios result in different characteristics in current graphs, for example:
ENG450 – Engineering Internship
Page 11
An obstruction between the blades will result in a higher current draw towards the end of
the swing as the motor is forced to work harder to swing the blade.
If the clutch is slipping this can lead to a higher current draw than usual for the inrush
current. DC motor fundamentals indicate that torque is proportional to current [5]; a slipping
clutch can therefore cause a higher RPM in the motor and therefore throwing the points
quicker which can result in damage. The excessively high current can also damage the
motor.
The motor not being greased sufficiently can lead to increased friction and may result in the
blade not throwing at all. In this case, there may or may not be an inrush current (depending
on just how much friction there is) and if operation fails, then little to no current would be
expected afterwards.
A damaged bar can lead to current irregularities at any stage of the current graph depending
on what the damage actually is.
A study was conducted in from 1994 to 1998 in England on a 13 mile stretch of track which uses
Westinghouse (now Siemens) points machines [6]. There were 170 points machines is this section of
track. As of December 21 1998, there were 937 faults recorded. The objective of this study was to
determine whether these faults could have been identified by the application of suitable sensors and
predictive monitoring equipment and by doing so, provide an advanced warning of failure or
whether maintenance is required . Table 1 shows a breakdown of fault categories and it was
identified that implementing condition monitoring equipment could lead to a reduction in these
failures particularly inside and external to the machine.
Table 1: Points Machine Fault Categories
ENG450 – Engineering Internship
[6]
Page 12
A thorough knowledge of what normal current graphs look like is important as this then allows the
observer to diagnose irregularities. Figure 2 was obtained from the only permanent condition
monitoring device on the PTA network located at Cockburn Central station which is located on the
Mandurah rail line, the downside to this device is that it is permanent and cannot be moved around
to access other points, it is also very expensive (in the tens of thousands of dollars range). This
existing condition monitoring device is accessed via a web server and support is provided from CDS
Rail. Figure 2 was highlights points 1051 at Cockburn station swinging from their normal to reverse
position.
Figure 2: Normal to Reverse swing of points 1051 at Cockburn Central
Once knowledge of what a normal swing looks like is known, a technique known as enveloping can
be applied. Enveloping gives a ±percentage around a given value at a given time. If a value falls out
of this enveloped range during a points swing, this can be identified as an issue.
The major issue with enveloping is it does not take into account the atmospheric temperature. As an
example, the first points swing on a cold winter’s morning will have a significantly higher current
draw than a points swing (which has previously been swung numerous times) in the middle of a
warm spring day. This is known as cold load pickup [10]. A major cause of the cold load pickup is
thermal conductivity.
Cold load pickup is more of an issue in other power related industries where, for whatever reasons,
(power outage, a shutdown for maintenance etc.) a power system is left offline for a period of time
and then re energised. Almost all industrial power systems have protection relays. Due to the cold
load pickup affect, and a higher current being drawn when the systems are energized, this higher
current can cause relays to trip or fuses to blow thus shutting the system down.
ENG450 – Engineering Internship
Page 13
For enveloping, this can indicate a failure when a failure hasn’t occurred. It is therefore essential to
be able to identify a points swing which is abnormal due to cold load pickup from a fault.
3.0
Components
The selection process for choosing the components involved considering what was essential to
perform condition monitoring. Major consideration included:
A microcontroller with sufficient I/O capabilities, keeping in mind that a lot of I/O (for chip
selection, clock input, data in and out etc.) was required for writing data to memory chips.
A microcontroller with a universal programming language, this was essential as other users
would also need to know how to change/improve the program code.
Sufficient memory capabilities to store day(s) worth of data.
High sample speeds for the analog input in order to capture current impulses.
A current transducer which was inexpensive and could measure currents of up to 20
amperes.
A circuit design that would minimise the amount of supporting circuitry needed in order to
minimise space and therefore create a small compact unit.
All components to be cost minimized, part of the project scope is to create a cost efficient
condition monitoring solution.
Essentially, using all individual components and a microcontroller, the condition monitoring device
will be a customized data acquisition device built from scratch.
ENG450 – Engineering Internship
Page 14
3.1
PIC24FJ64GA002 Microcontroller
Figure 3: The PIC24FJ64GA002 microcontroller
The PIC family of microcontrollers, developed and produced by Microchip provide solutions for the
entire performance range of 8-bit, 16-bit and 32-bit microcontrollers. PICs are renowned for having a
powerful architecture, flexible memory capabilities, comprehensive easy-to-use development tools,
complete technical documentation and online support [7]. PIC microcontrollers are both ideal and
readily used in a range of industries such as:
Electrical goods (such as washing machines).
Motor controllers.
Alarm systems.
Electronic systems.
Control systems.
The reason PIC microcontrollers are so readily used in industry is their reliability and robustness,
many of them can operate in temperatures up to 70 degrees.
PIC microcontrollers are also used in home DIY projects and as a learning tool for students in
university. [8]
ENG450 – Engineering Internship
Page 15
Features of the PIC24FJ64GA002 [7] meet the project requirements include the following:
7.37 MHz crystal, allows for very quick program execution and therefore sampling speeds.
10 bit ADC converter allows a high level of accuracy when converting a 0-3.3V range into a
value between 0-1023. This means every voltage change of 32mV will represent a change in
the ADC value. Factors that include maximum sample speed include the amount of code
which needs to be executed, interrupts are often used in this case to minimise code
execution time therefore maximising sampling rates. Theoretically, with no code ex
UART communication via USB bridge. Essential for uploading the data to a PC.
28 I/O channels which up to 5 can be configured for ADC conversions.
SPI/I2C bus protocols supported. This is essential for writing to memory chips.
Can operate efficiently between temperatures of -5°c and 70°c. These are satisfactory
limitations for a rail environment in Perth.
Programmed with the C programming language.
Can operate with external 9V DC power supply.
The development board which houses the PIC also has a 3.3V and 5V regulators, these will be used
as power supplies for the electronic circuit required for the project.
Figure 4: Pin Diagram for PIC24FJ64GA002
ENG450 – Engineering Internship
[7]
Page 16
3.2
MPLAB C programming compiler
The MPLAB compiler for PIC24 microcontrollers is a full feature ANSI compliant C compiler for
Microchip 16-bit devices.[9] MPLAB is a 32-bit Windows console application and allows source level
debugging with the MPLAB Real Ice emulator and the MPLAB ICD 3 In-Circuit Debugger . Features
include:
ANSI compliant with standard, math, memory, data conversion and math libraries;
Optimized to generate as much as 30% less code than other 16-bit MCU compiler;
Peripheral library for quick coding using Microchip device peripherals;
Allows code and data to be located at absolute addresses.
MPLAB not only provides a programming environment, but with the MPLAB ICD 3 In-Circuit
Debugger also provides a debugging environment. This allows the user to step through and execute
the code one line at a time whilst monitoring register values. The user can see can the code
executions one line at a time and know whether the code is executing as expected.
Figure 5 shows what the programming environment looks like.
Figure 5: MPLAB programming environment
ENG450 – Engineering Internship
Page 17
The programming environment has some key features such as:
Source & Header files – This section allows the user to move between C code files and
header files.
Memory Usage Gauge – This allows the user to know how much space their program is
taking up in the MCU’s program memory as well as how much data memory is being stored.
Output – The output notifies the user to errors in the code when the user attempts to
compile.
Watch – The watch window is useful for debugging as this is where the user can monitor
register values.
When the MPLAB ICD 3 In-Circuit is connected between the PC and the MCU, the animate option or
step into option within MPLAB can be utilized. The animate option can be executed be clicking the
“fast forward” icon on the MPLAB display. Animate executes the code at a much slower rate than
when it is running normally, allowing the user to monitor conditions. The downside when using this
option is that, if the user’s code is executing a loop for example 1000 times a second, it can take
minutes before 1000 executions are complete.
The step into option in this case is ideal, the user can step into a statement that perhaps only
executes every 1000 cycles and monitor register values without having to wait minutes, which is
likely when using animate. The step into command can be triggered by clicking F7.
Breakpoints are another feature which also aids the user in debugging. A breakpoint can be set and
if the code is executed, it will stop where the breakpoint has been set. The user can then observe
register values and see if the code is executing as desired.
ENG450 – Engineering Internship
Page 18
Figure 6: MPLAB ICD 3 In-Circuit Debugger
Figure 6 shows the MPLAB ICD 3 In-Circuit debugger. It also features LEDs to indicate whether it’s
powered, active and the current status.
3.3
Current Transducer
The current transducer (CT) used is a LEM LA 55-P/SP1 rated to measure 50A. It is then embedded in
a PTA made circuit board that converts the transformed current into a voltage signal. For the
purpose of this project, the shunting resistor was removed. The board was designed by signals
engineer Andrew Ting.
The CT use the Hall Effect principle to measure and transform the current. As the actual LA 55-P/SP1
CT had been purchased many years ago, their accuracy was questionable and therefore thorough
testing was required to examine their suitability. The shunting resistor was removed and currents
from the current source and the CT outputs were both measured and recorded. Ideally, a linear
trace would relate each of the currents. Figure 7 shows the relationship between the measured
current from a current source, and the transformed current from the CT.
ENG450 – Engineering Internship
Page 19
Transduced Current (A)
Current vs Transformed Current
-15
-10
0.03
0.025
R² = 0.9974
0.02
0.015
0.01
0.005
0
-5-0.005 0
5
10
15
-0.01
-0.015
-0.02
Real Current (A)
Current vs transduced current
20
Linear (Current vs transduced
current )
Figure 7: A graph showing the relationship between the current source and the transformed current
This graph shows what can be considered a linear relationship. The R2 value (the correlation coefficient) has a value very close 1. A perfect linear line wasn’t expected for a range of reasons such
as:
The multimeter not calibrated perfectly;
Changes in temperature;
Age of the equipment used for the test.
The datasheet states the windings ratio to be 1:2000. [11] To test this figure, 3 loops of wire were run
through the CT. Theoretically this should give a ratio of 3:2000 or 1:667. This value was calculated to
be 1:650. This result showed a 2.5% error and for the purpose of this project was not an issue.
As points machines do not draw a current of greater than 15A (even 15 is considered to be an
error/problem) anything higher than this can be assumed a problem. 15A correspond to
approximately 24mA. This -24mA to 24mA range will help choose an appropriate burden resistor
range to convert to a 0-3.3V signal for the ADC conversions.
The following figures 8 and 9 show the CT and the circuit board they are embedded on.
ENG450 – Engineering Internship
Page 20
Figure 8: LEM LA 55-P/SP1 Current Transducers
Figure 9: Circuit board with shunting resistors, capacitors and
protection diode
In order to choose the appropriate resistor value, some basic calculations were performed:
1:2000 is the transformed current ratio, to increase accuracy there are 3 loops around the CT.
3:2000 or
1:667
Maximum theoretical current of:
V = IR
3.3 = 0.0224 x R
Therefore, R = 147Ω. For reasons discussed at a later stage during the report, this resistance figure
must be doubled.
ENG450 – Engineering Internship
Page 21
3.4
Memory
Memory limitations are always an issue when using microcontrollers as they inherently have little
memory storage. The PIC24FJ64GA002 is limited by only having 64KB of RAM [7] available for data
storage. This meant external memory had to included.
Three different external memory devices were shortlisted. External SRAM chip(s), flash memory
chips and an SD card were all considered.
3.4.1
SRAM
The Microchip 23LCV1024 [12] is a 1 megabit serial SRAM device. The memory is accessed via a serial
peripheral interface (SPI) compatible serial bus. The bus signals required are a clock input (SCK) and
separate data in (SI) and data out (SO) lines. Access to the chip is controlled through the chip select
(CS) input. A major advantage to using this SRAM chip is that it supports an infinite amount of read
and writes to the memory array as well supporting data back up via an external battery (Vbat).
The Serial Peripheral Interface (SPI) has been developed by Motorola to serve as a serial
communication protocol to interface a great deal of hardware such as memories, ADCs, real-time
clocks, sensors and even other MCUs [12]. The maximum transfer rate is 39400 bits per second (BPS)
however for this application, 9600 BPS is used.
It is a serial data link standard that works in a synchronous way, meaning that all transmissions
are referred to a common clock, generated by the device working as master. The receiving
peripheral is termed slave and by using the clock it synchronises its transmission with the master.
One advantage of SPI is the capability of having multiple slaves controlled by the same master,
therefore eliminating the need for extra wires. Slave devices are controlled by a chip-select input,
thus interfacing with the master only when necessary [12].
Figure 10 shows the pin out configuration of the chip.
ENG450 – Engineering Internship
Page 22
Figure 10: 23LCV1024 Pin Diagram
[12]
Limitations to this chip are the relative small memory capabilities. The 1 megabit is the equivalent to
128KB. Although small, this is still double of what the PIC’s RAM memory has to be offer, and
multiple SRAM chips can be implemented using the chip select pins. The data being transmitted is 10
bit, therefore must be broken up into two separate 8 bit portions and then reassembled, due to this,
the chip effectively operates with 64KB of memory. If a sampling speed of 1ms is chosen, and the
average points swing lasts three to four seconds, resulting in 3-4KB of memory being occupied per
swing, this would give rise to approximately 15 to 20 points swings before the chips memory is full.
Figure 11: SPI read and write sequence
[13]
Figure 11 shows the read and write sequences required to store data to the chip and read from it. A
large period of time was spent understanding this read/write sequence and implementing it.
ENG450 – Engineering Internship
Page 23
3.4.3
SD Card
Implementing an SD card would have allowed for far greater memory storage in the order of
gigabytes. The major issue with implementing an SD car was the time frame. This project was
required to be completed in 17 weeks. Implementing SD cards using the SPI protocol is difficult and
is better suited to using I2C. Having already had an understanding of SPI, it was decided not to use
another protocol and remain using the SRAM via a serial bus.
3.5
Circuitry
A circuit with many components (discussed below) was used to perform voltage step downs from
the supplies, to read/write to the SRAM, to convert positive voltage to negative voltage and to sum
the voltages in order to be read by the ADC.
LM317Hv Voltage Regulator – This is a high voltage adjustable regulator capable of regulating
voltages of up to 60V. The location cases where the condition monitoring unit will be placed have all
got 50V DC supply rails. To power the amplifier within CT, 12V is required. This voltage regulator
takes the 50V and regulates it to 30V. The reason for only regulating to this voltage is because of
power dissipation. There is a 2A fuse in the location case so power can never exceed 100W (which
would be an impulse). Realistically, a conservative figure of the current draw would be 100mA (most
of the time it is a lot less). 100mA multiplied by 20V (50V-30V) gives 2W of power to be dissipated.
2W of power being released as heat shouldn’t cause overheating and therefore this is the reason of
regulating the voltage to 30V.
The assumption of the current draw will be discussed at length in the testing part of the report.
DC-DC Buck Converter – The buck converter then proceeds to convert the 30V from the high voltage
regulator to 12V to supply the CT. The buck converter has an onboard trim-pot for tuning the desired
output voltage.
Figure 12: DC-DC Buck Converter
ENG450 – Engineering Internship
Page 24
DC Charge Pump – The DC charge pump is required to create a negative supply rail in order to power
the op amps. Negative supply is required rather than a ground as negative currents, when shunted
across a resistor produce a negative voltage. Microchip’s TC7662B Charge pump DC-To-DC voltage
converter was used. The charge pump draws +5V from the MCUs supply rail. Charge pumps operate
by using capacitor(s) as energy storage elements as well as some sort of switching device, typically at
megahertz frequencies.
Summing Circuit – The summing circuit is responsible for adding the voltage signal from the DC
motor to a 1.65V bias. This bias is required as the ADC only reads positive values. Figure 13 shows
the circuit diagram of the summing circuit.
Figure 13: Summing Circuit
The circuit operates in the following way:
R1 (294Ω) shunts the current and creates a voltage between 0-3.3V.
The voltage then passes operational-amplifier 1, which acts as a buffer. This buffer is
required so that any large imbalances between different nodes (without a buffer present)
don’t try to drive each other under no load conditions.
The summing then takes place. Equal resistors are placed in a voltage divider configuration.
The output voltage from the divider equals the sum of the two potentials divided by 2. To
make use of the full 10bit ADC, the resistance must be double (creating a higher voltage) to
ENG450 – Engineering Internship
Page 25
compensate this summation. Not doing this would in essence only make use of half the ADC
range, or turn the 10bit converter into a 9bit converter. As an example:
Assume 10A comes through the current source.
10/633 = 15.8mA
0.0158*147 = 2.3V
The summed voltage is 1.975V as compared to:
0.0158*294 = 4.64V
The voltage then passes buffering operational-amplifier 2. This is just to help the circuit and
isolate it to prevent currents/voltages affecting other parts of the circuit.
The final part of the circuit goes through a Sallen Key filter operational-amplifiier
configuration. Due to high sampling speeds (as the output is sent to the ADC of the MCU)
and Nyquist’s Theorem, a filter is also included. This will be discussed at length in the next
part of the report.
The output is then wired into a pin configured for analog input on the PIC MCU.
ENG450 – Engineering Internship
Page 26
3.6
Sallen Key Filter
Essentially, this whole system is acting as a data acquisition system. Within many data acquisition
systems there are power supplies, communication wiring (RS232 etc), LCD displays etc. All these
devices create additional noise superimposed to the signal being processed. This addition of noise is
the result by induction from the above devices.
In this application, a 10-bit ADC converter is being used. For a corresponding voltage that is
equivalent to a value of 800 on the ADC, addition noise may be added to signal from the power
supply and other active/passive elements radiating noise also. This could lead to a signal being
increased and therefore resulting in an ADC value of 820.
Figure 14: DAQ signal processing
[14]
Figure 14 shows a typical DAQ signal processing flow chart. The digital filter is included in the PIC
MCU however an analog low pass filter must be added. A 1 KHz Sallen Key Filter has been added to
the signal around the final op-amp, chosen because the desired sampling rate is 2 Khz. Nyquists
theorem sais that the minimum sampling rate must be at least twice the rate of the signal being
sampled. The ADC interrupt has been configured to sample at 2Khz, when the data is then processed
on excel, 2 consecutive values are added together and divided by 2 creating a 1khz sample rate with
higher accuracy. The Sallen Key Filter is a second order filter and its schematic is shown in figure 13.
ENG450 – Engineering Internship
Page 27
3.7 Circuit Protection
The only circuit protection currently within the circuit is the 2A fuse on the 50V supply located within
the location case. It is proposed that further circuit protection be added to the circuit to prevent
damage.
4.0
Pin-Out Configuration
The following figure represents the PIC24FJ64GA002 pin-out assignments. To keep track of which
pins are and aren’t in use as well keeping track of which pin is responsible for what, pin out
assignments are essential. Table 1 shows the pin assignments:
Pin
Pin Name
Configuration
Description/Assignment for Pins
1
MCLR
Digital Input
Reset Chip
2
VRef+
Analog Input
+ Voltage Ref
3
VRef-
Analog Input
- Voltage Ref
4
RP0
Digital Input
Not Used
5
RP1
Digital Input
Not used
6
RP2
Digital Input/Output
Not Used
7
AN5
Analog Input
Analog Input from N/RWR Link (Current)
8
Vss
Ground Pin
Ground
9
OSC1
Digital Input
Crystal Oscillator
10
OSC2
Digital Input
Not Used
11
RP4
Digital Output
Tx – Communication with Debugger
12
RA4
Digital Input
Rx – Communication with Debugger
13
VDD
Digital Output
Voltage source
14
RP5
Digital Input/Output
Not Used
15
RP6
Digital input
Data Read Pin from SRAM
16
RP7
Digital Output
Clock input for SRAM
17
RP8
Digital Output
Tx for UART
18
RP9
Digital Input
Rx for UART
19
DISVREG
Configurable
Not Used
20
VCC
Digital Output
Power for SRAM
21
RP10
Digital Output
Data write to SPI
ENG450 – Engineering Internship
Page 28
22
RP11
Digital Input/Output
Not Used, Pin doesn’t work
23
RP12
Digital Input/Output
Not Used
24
RP13
Digital Input
RWR Relay
25
RP14
Digital Input
NWR Relay
26
RP15
Digital Output
Chip Select for SRAM
27
VSS
Digital Output
Voltage Source
28
VDD
Ground Pin
Ground
Table 2: Pin-Out Assignments
ENG450 – Engineering Internship
Page 29
5.0
Simulations
Due to the limited resources available in the testing room, simulations were used in place of
resources.
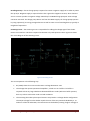
Figure 15 shows the simulation set-up. Voltage sources are used to provide 12V DC to the circuit and
a current source supplies the current to represent the motor. Figure 15 also shows the lack of
presence of the DC-DC converter and the high voltage regulator, these had been omitted (due to no
50V DC source being available at the time) and a 12V supply used straight from a voltage source in
this scenario.
Figure 15: Simulation Set-up
ENG450 – Engineering Internship
Page 30
5.1
ADC Values v Voltage Linearity Test
The first simulation involved was boosting the current source from 1A to 10A and then testing for
the corresponding ADC values throughout this range. This test was to ensure the ADC was
interpreting values correctly over a full range of expected currents and operating linearly.
The current source used can only produce currents between -1A and 1A. To compensate this, wire
was passed through the current transducer 10 times, effectively multiplying the current by 10. This
then gave an equivalent of ±10 amps. Corresponding voltages which had been shunted were
measured and then a program was run to read the ADC value. Table 2 shows the raw results of the
test.
Current Source (A)
Simulated Current (A)
Voltage (V)
ADC Value
-0.9
-9
0.73
233
-0.8
-8
0.81
251
-0.7
-7
0.91
285
-0.6
-6
0.99
307
-0.5
-5
1.06
327
-0.4
-4
1.17
361
-0.3
-3
1.24
385
-0.2
-2
1.34
416
-0.1
-1
1.53
479
0
0
1.63
506
0.1
1
1.74
544
0.2
2
1.86
583
0.3
3
1.96
613
0.4
4
2.04
638
0.5
5
2.12
665
0.6
6
2.22
692
0.7
7
2.30
718
0.8
8
2.41
751
0.9
9
2.48
772
1.0
10
2.62
818
Table 3: Table of raw results for the ADC Values v Voltage Linearity Test
ENG450 – Engineering Internship
Page 31
This test was important as if there were any issues with the ADC (and/or the circuit); further testing
in a track environment would be unsuccessful. It was expected that when 0 current was recorded,
1.65V would be produced and yield an ADC value of 0. Similarly, when -15A is recorded, 0V would be
produced with a corresponding ADC value of 0 and when +15A is recorded; 3.3V is produced with a
corresponding ADC value of 1023.
This test only covered the ±10 range however it would cover two thirds of the ADC range and, if
linear, could be extrapolated to find expected values at the extremities of the range. Figure 16 shows
a linear relationship between voltage and ADC values with a correlation coefficient of 0.9998.
ADC values v Voltage Linearity Test
900
R² = 0.9998
800
ADC Value (0-1023)
700
600
500
ADC values v Voltage
Linearity Test
400
Linear (ADC values v
Voltage Linearity Test)
300
200
100
0
0
0.5
1
1.5
2
2.5
3
Voltage (V)
Figure 16: ADC Values v Voltage Linearity Test
5.2
Simulating a Points Swing in a Laboratory Environment
The next simulation involved simulating a points machine swing in a laboratory environment. In
order to represent a points swing, the toggle on the current source must be turned high very quickly
and then released in a manner which would represent a 1st order response or a discharge. Turning
the toggle this way gives rise to an initial peak followed by a downwards curve eventually developing
into a tail similar to figure 1.
This data would then pass through the MCU’s ADC and be logged. To extract this info (without just
visually monitoring the watch window in the debugger), UART communications would be required.
The terminal program ‘Hercules’ is used as the serial terminal.[15]
ENG450 – Engineering Internship
Page 32
An understanding of how the system will physically operate on track is also required. As an example,
the user would not want to have the MCU continuously logging. This would take up too much
memory space too quickly and will consume power. The idea of this system is to only log when a
points machine is swinging. This can be achieved by only logging when the NWR (normal points
relay) and RWR (reverse points relay) relays pick. When this happens, they send a digital input signal
to the MCU and code can be written to log when this statement is true. To simulate this, digital push
buttons are used.
The major complication with this test is deciding how to send the 10 bit ADC measurements over the
UART. If the data is sent as 8 bit data, it must be broken up to two separate lots of 8 bits, effectively
being a 2 bit component and an 8 bit component and then re-assembled on the PC. This method is
how the 10 bit ADC values are written to the SRAM via SPI. Another method however which is more
effective is to send the data through the UART as ASCII values. This means a simple conversion is all
that is needed on the PC. Once these ASCII values have been converted (the terminal emulator
program Hercules has an option of how to display the data. In this case, it reads the data as ASCII
values, the option to display as decimal values has been selected), the data can be entered into an
excel spreadsheet and a chart created to view the current curve. Additionally, the unit will not
always be connected to a PC, therefore UART transmissions would only want to be configured when
the user wishes to download the logs. The symbols “D” and “E” have both been programmed so that
when connected to the terminal emulator program Hercules, D represents download and E
represents erase. This means the logs can all be downloaded/erased upon entering a command.
Finally, the purpose of this simulation is to ensure the system functions as it is supposed to. That is,
does the MCU log data when a simulated relay is picked and can this data be sent through to a PC via
UART? Although the data will attempt to represent a current curve, what the curve looks like is
irrelevant. The simulation can be deemed successful if the above criteria are met.
Two charts were obtained and a further image representing the program running and the terminal
emulator downloading logs. Figure 18 shows the relationship between time and ADC values and
figure 19 shows the relationship between the simulated current and time. During the simulation, the
data has been simulated in an attempt to represent a points swing.
Important things to note during this simulation:
Sampling time was reduced to 100ms, reasons being:
o
Transmitting data back via the UART with a baud rate of only 9600 bits per second
could result in taking a period of time to upload the data. Due to time limitations as
ENG450 – Engineering Internship
Page 33
well as only being a simulation, it was decided that a slower sample speed could be
tolerated.
o
Memory on the SRAM – The higher sampling speeds would occupy more memory on
the SRAM which could have resulted in the memory exceeding capacity.
A simulated current was used. The ±1A source was again used and was looped 10 times
through the CT.
No real time clock has been used. (Time elapsed is known however through sampling time)
The real time clock addition is mentioned more thoroughly in the future recommendations
section later in the report.
Figure 17 below shows the terminal emulator program Hercules is receiving data via the UART.
Figure 17: Terminal Emulator receiving logs
ENG450 – Engineering Internship
Page 34
A Chart showing a Simulated Points Swing
1000
900
ADC Value (0-1023)
800
700
600
500
ADC v Time
400
300
200
100
0
0
2
4
6
8
10
12
Time (s)
Figure 18: Relationship between ADC values and time
A Chart showing a simulated Points Swing
Current v Time
10
8
6
Current (A)
4
2
0
-2
0
2
4
6
8
10
12
Current v Time
-4
-6
-8
-10
Time (s)
Figure 19: Relationship between simulated current and time
ENG450 – Engineering Internship
Page 35
The simulation involved a reverse points swing initially (negative current) and then a normal points
swing (positive current). The results of this simulation have revealed that the system has operated
satisfactory in reference to what was expected. Based on these results, the system is deemed to be
ready for field testing.
Now having the simulations completed, to prepare the unit for field testing, a few more
modifications are required such as:
Increasing the sampling speed;
Changing to turns ratio through the CT;
Due to changing the turns ratio, a new shunting resistor value is also required;
Adding a fuse from the 50V DC supply within the location case to add protection to the
internal circuitry;
Ensuring the wire through the CT has a suitable cross sectional area for handling high
current;
6.0
Assembling the unit within an electrical enclosure box.
Testing
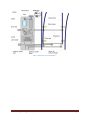
After the successful completion of simulations, testing was required before the unit could be
commissioned. Everything within the circuit had previously been tested or simulated except the high
voltage regulator, due to no 50V DC source being available in the laboratory area. All wiring was also
completed within the electrical box enclosure so that the unit could easily be wired to outside
location cases. Figure 20 shows the unit assembled within an electrical enclosure box.
ENG450 – Engineering Internship
Page 36
Figure 20: The unit fully assembled in an electrical enclosure
6.2
Field Testing
Field testing involved selecting a suitable location case across the network that had a points machine
wired into it. Limitations in this selection were:
Not to interrupt rail traffic.
Interlocking was not to be disrupted.
Did not want to disrupt train control – so an off peak time was ideal.
It was necessary choose and appropriate time when a technician was available.
Based on all the above criteria, location case F4 was chosen which had points machine 776 wired
into it. The location case is in East Perth and was ideal as it is rarely used (only used when the Indian
Pacific’s locomotive needs to turn around, which is twice a week). The initial test was planned for
11am (off peak) on the 30th October 2013.
6.1.1
Test 1
Since technicians would only be available for 1 hour (as they themself are busy doing maintenance
etc during the day), careful planning had to be in place to ensure the test was a success. Diagrams
were needed to assist the technicians as to where they should be wiring to. Multimeters are also
needed to test for voltages in particular places. The program’s memory also needed to be cleared to
that a fresh set of data could be logged.
ENG450 – Engineering Internship
Page 37
After the unit was wired up, the ‘power on’ LED indication light on the microcontroller was not lit.
This led to a suspicion that the unit wasn’t receiving power. The terminals on the location case were
tested and 50V was measured across them. The terminals on the electrical box were then measured
and 50V was also measured across them. The input to the high voltage regulator was measured and
0V was measured. Upon close inspection, it was revealed that a wire had broken free from its solder
creating an open circuit. The result of this open circuit was that the microcontroller and all other
components within the circuit were not receiving any power and therefore nothing would operate.
The test was therefore deemed a failure.
6.1.2
Test 2
After returning to the office to re-solder the wire it was decided that every wire should be bell
tested (continuity tested) to ensure all solder joints had been made correctly. As there are many
nodes to be tested, this process took a long time and also had to be checked off against a drawing to
keep track of what had been tested. The bell testing also revealed a short circuit where too much
solder had been applied to a resistor and the solder had made contact with another wire. Had the
previous test no had an open circuit and powered up, it is unknown what the consequences of the
short circuit could have been.
When confident the circuit was sound, and short circuits had been eliminated, a technician was
again book for an hour on 7th November 2013.
Test 2 involved the same process as test and the same location case was selected. When the circuit
was connected, sparks flashed from the high voltage regulator and essentially destroyed it. Figure 21
shows the damage suffered to the integrated circuit. It was also feared that this may have damaged
other critical components within the circuit. The unit was taken back to the office for analysis.
ENG450 – Engineering Internship
Page 38
Figure 21: Regulator integrated circuit damage
The suspicion was that the regulator and its associated heat sink could not handle the power
dissipation. To prove this, some calculations were required. Before the heat sink was selected, a
calculation was applied to ensure that it could handle the voltage drop. The calculations are as
follows:
RJ-A = RJ-C + RC-H + RH-A
Where R is measured in (°C/W) [16]
ΔT = P x RJ-A
The current assumed for the RJ-A calculation is 100mA (critical mistake)
P = 20V x 100mA
P = 2W
ΔT = TMAX - TAMB (Both assumptions)
ΔT = 80 – 60
= 20°C
Therefore,
20°C = 2W x RJ-A
RJ-A = 10°C/W
Therefore,
ENG450 – Engineering Internship
10°C/W = 5°C/W + 2°C/W + RH-A
Page 39
RJ-C and RC-H obtained from specifications sheet of LM317HV [17].
RH-A = 3°C/W
With the RH-A values known, a respective heat sink can be chosen. The fatal flaw in this calculation
was that RJ-A (junction minus ambient) value was assumed to be 100mA. This assumption was made
on the basis the circuit would not consume too much power. This assumption proved to be the
worst error made during this project.
Since the actual current draw of the circuit (this is without the 50V supply) from 12V supplies was
unknown, it was decided to measure it. The measured current draw was 404mA. This value is
significantly higher than the assumed value and would therefore effect the heat sink calculations.
When the regulator, DC-DC converter and 50V are added into the circuit, the current draw could be
assumed to be higher. This calculation has therefore been proven to be far from correct and as a
result, blew apart the regulator chip. Other circuit components were tested and nothing else was
found to have suffered any damage from the incident.
Due to the significant amount of current present in the circuit, it has been decided that due to
available room within electrical enclosure restrictions that there isn’t a suitable size heat sink
available. The proposal is to use a larger scale DC-DC converter capable of converting a 50V input to
a 12V output. The component which was purchased was Traco Power’s TMR 3-4812 DC-DC converter.
Being a Melbourne based supplier and having to go through purchase orders etc, it has been two
weeks and the part still hasn’t arrived. The converter is capable of converting input voltages of 3675V DC to 12V DC. It is also rated to handle 0.75A.
Figure 22: Traco Power DC-DC Converter
ENG450 – Engineering Internship
[22]
Page 40
7.0
Results
At the conclusion of the DE2 period, only simulated results and a new design using a DC-DC
converter were available. It is however proposed, that work will continue on the project for the PTA
until the 29th of November by which date the unit should be operating effectively as designed.
Much had still been achieved however, such as successful simulation results (proof that all the circuit
apart from the high voltage regulator did in fact work as designed) and successful implementation of
the C code used to program the MCU.
8.0
Problems Encountered
Many problems were encountered during the project. A list summarizing the larger problems is as
follows:
Learning the C programming language;
Circuit Design;
Component selection;
Meeting time constraints;
Calculations;
Testing.
Problems are not always necessarily a major issue; a major component of completing a
thesis/internship is solving these problems as this is a powerful learning tool. The next discussion will
focus more so on how these problems were solved rather than the problems themselves.
Learning the C Language – This part is also touched on in the appendices of the report. Having not
learnt or seen the C programming language before it was potentially daunting. Going through PIC
tutorials of basic digital I/O to switch on LEDs was a starting point which eventually culminated in
implementing interrupts and full program code which was very successful. Other tools used to learn
the language include PIC programming books, internet forums, internet websites as well as
consulting with other engineers who had experience in the C programming language.
Circuit Design – The major issue encountered in the circuit design stage was figuring out how to sum
the signal voltage and bias voltage. The initial idea was to use a traditional operational amplifier
summing circuit, the following equation for this circuit is:
ENG450 – Engineering Internship
Page 41
(For inverting set-up)
When simulating this circuit using NL5 [18] (the circuit simulation software) this set up worked fine.
However, when built and tested in the testing area, Vout was always higher than expected, and
typically of values around 30-70mV. As the input signal got greater, this discrepancy got smaller. The
problem was that due to a real op-amp not having infinite input impedance and realistically having
input impedance in the range of 10s of KΩs, this allowed current to drive around the other input of
the circuit therefore creating a voltage. This meant, the summing amplifier was in fact doing its job,
however without having infinite input impedance, this set-up was not suitable.
The solution was to buffer the input signal around the first op-amp and then add this signal to a
voltage divider afterwards with the bias signal. This set-up worked very effectively.
Component Selection – There are quite literally thousands of op-amps, resistors, capacitors and
voltage regulators available for purchase so how you choose the right one. That is a question that
was required to be answered and with limited knowledge of what to exactly choose, other engineers
were consulted and their opinions were often followed in order to select the appropriate
components.
Meeting time constraints – This was perhaps one of the greatest issues. Doing an industry-based
internship meant following company protocol to purchase items required for the project. This meant
having to have relevant area manager’s signatures on purchase orders. Of course, managers are
inherently busy people and gathering the required signatures can take any where from minutes to
days. Relying on courier companies to deliver components also takes days and this was another
cause of frustration.
Inevitably, mistakes where made and these also caused delays on the project, as an example, it took
two days to figure out how to set up to code to implement an interrupt. Once this knowledge was
known, setting the next one took half an hour to implement.
A Gantt chart was also constructed at the beginning of the project and it was attempted to keep on
schedule with it. This was done with a small degree of success as the project never fell more than
two weeks behind the Gantt chart schedule.
Calculations – Most of the calculations required in this project were not too mathematically intense.
Basic Ohms law, second order low pass filter and heat calculations were required. All calculations
were performed on paper (eg, calculating the shunt resistance) or with online calculators (for the
sallen key filter). The heat sink calculation was incorrect due to human error in assuming the RJ-A
ENG450 – Engineering Internship
Page 42
value of 2w. This was assumed as this value can be calculated through the power dissipated through
the junction of the chip and the ambient temperature. So 20V reduction multiplied by an assumed
value of 100mA is 2W. This is the reason the chip blew as the heat sink wasn’t big enough. Upon
further testing the current was found to be greater than 400mA, and therefore greater than 8W. A
solution to this problem is the purchase of a DC-DC regulator to take the 50V DC directly to 12V DC.
Testing – The issues experienced with testing the project include the requirement of having to book
a technician to setup the project within a location case in the rail environment. This meant having to
plan tests days before they were due to take place. Due to the high voltage nature of a location case,
an electrical license is required to perform wiring and testing on them.
Another issue was the inability to test the high voltage regulator in a laboratory set-up because
there were no 50V DC supplies. This could only be compensated for by testing it on track, which
proved to be a failure and a hurdle in actually getting final test results and therefore delaying the
commissioning date. Again, this problem has been dealt with by purchasing a DC-DC regulator
capable of taking the 50V DC supply and converting it to 12V DC.
9.0
Future Improvements and Recommendations
As is the case in many projects, expansions and future improvements are always possible. The
current project is limited by problems such memory and I/O. These limitations aside, other functions
such as wireless monitoring would allow the device to provide real time monitoring of points
machines. Adding further sensors such as strain gauges, temperature and vibration sensors can also
give a further insight to the mechanical behaviour of the points machine and rail tracks. This further
information would be vital in painting a complete image of what is happening inside the machine. As
an example, a strain gauge and condition monitoring the current output would help diagnose an
obstruction in the rails without any visual inspection required. The current graph’s tail end would
increase as well as the force graph towards the tail end.
9.1
Increased Memory Capabilities
There are three proposed paths to increase memory capabilities:
Additional SRAM chips;
Flash memory chips;
SD card implementation.
ENG450 – Engineering Internship
Page 43
Each of the above options has their pros and cons. These options must be carefully weighed up
before a final decision is made.
The SRAM has an advantage of infinite read and write cycles (as compared to a USB stick which may
only have 10 000 or so). Another advantage is data can be backed up through wiring a small battery
into the VBAT pin in the case of a power outage. The major downside is that the largest chip currently
on the market is only 1 megabit. Using the chip select pin however, multiple SRAM chips can be
placed in series to increase memory capabilities.
Flash memory chips only have a finite read write cycle (usually in the order of tens of thousands [19]),
this is unlikely to be an issue as, after thousands of uses, a newer technology is likely to be
implemented. If the chip is to be powered by the MCU, then there is no alternative battery backup.
Flash memory chips typically store more data and can similarly to SRAM chips be connected in series
using their chip select pins to increase memory capabilities.
Implementing an SD card would perhaps be the most efficient option. The circuitry becomes more
complicated however the SPI protocol can still be used. They can support substantially larger
amounts of memory however, in the range of 32GB. This allows them to store week’s worth of data.
Another advantage is that an engineer/technician can go out to where the system is located, take
out the SD card and replace it with another SD card, return to their office or PC and analyse the data
while the unit remains in place and logging.
All three options discussed are cost efficient and readily available. Based on the above analysis of
each options feature(s), it will be proposed to implement an SD card via SPI protocols as a means of
increased data storage.
9.2
Increased I/O Functionality
Some locations in the PTA network have up to 6 points machines within the one location case. This
means that potentially, 6 machines may be required to be monitored.
With the current structure of the project, each points machine requires 2 digital inputs, 1 analog
input, and 2 digital inputs and outputs for the SRAM chips. This is a total of 7 pins.
If 6 points machines were required to be concurrently monitored, a minimum of 43 pins plus
additional pins for voltage references, UART communications, debugging communications and a
reset button are still required.
ENG450 – Engineering Internship
Page 44
The PIC24 family has additional microcontrollers which have suitable I/O functionality such as the
PIC24FJ64GA008 – which has 69 pins as well as 14 analog inputs [20].
If the scope of the project changed to monitoring multiple points machines, it would be proposed to
use the same family of MCUs, and use the PIC24FJ64GA008 chip instead.
9.3
Wireless monitoring
Adding wireless monitoring to the system would allow real-time monitoring of the condition of the
points machines via a web server. The potential advantages of this include:
Allowing a technician or engineer to read logs and potentially diagnose failures outside of
work hours. E.g, a failure occurring in the middle of the night;
To store graphs on a daily basis into a database and monitor day by day changes. This could
enhance predictability of an immanent failure as well as more accurately assess when
maintenance is required;
A technician or engineer would not be required to spend time travelling to the location case
where the system is set up in order to retrieve it to gather logs. This would allow for their
time to be utilized elsewhere.
It is proposed to utilise an existing Wi-Fi network if this path was to be considered.
9.3.1
Alarming
Wireless monitoring would also be beneficial if a failure occurs, or an impending failure is imminent.
An alarm management system could be created to instantly notify the appropriate technicians and
engineers via e-mail, sms message, indicator lights at a PC etc. Again, this allows for round the clock
management and notification of the condition of the points machine.
9.4
PCB Design
A printed circuit board was initially favoured. However due to time constraints, at the stage when
the circuit was tested to prove it performed as wanted, the company which was quoted to do the
job (ExpressPCB) estimated that delivery of the final product would take between two and three
weeks. Due to this constraint, the circuit was constructed in a messy fashion on a regular copper
laminated circuit board. The circuit still performs the same operations, however without a schematic
it is hard to follow. It is recommended a PCB board be developed in the future.
9.5
Enveloping
Enveloping is a technique which can be used to determine if a points swing is operating as expected
without having to manually analyse the data. Tolerance levels, for example ±10% can be set around
ENG450 – Engineering Internship
Page 45
“normal” data forming an envelope. As the points swing, if they register a reading outside of this
envelope, code either within the MCU program or a post data processing program (such as VBA) can
be used to identify data outside of the envelope and therefore indicate an issue or failure has
occurred. Alarming could also be incorporated within enveloping, as an example, if data fell outside
of the enveloped region, this data could then trigger an alarm.
9.6
Wiring
In the future it would be recommended that the wiring be certainly cleaned up. The current wiring is
in a poor state, this was mainly due to a wire as you go method when wiring the system. Had
schematics been available (e.g, a CAD diagram) then units could be individually wired a neat way and
perhaps cable tied. Tidy wiring can also help signal transmission. When wiring is sagging in a
catenary fashion, or too close at times to other wires, they can interfere with surrounding wires
from the small induction fields.
9.7
Data Processing
Currently, when data is received in the terminal emulator program Hercules, the user must copy and
paste it into processing software such as Excel. From here, charts can be plotted and the data
analysed. A way to optimize this process would be to create a VBA program that can create all the
charts and identify outliers outside an envelope range at the click of a button.
Another option, which would involve creating networks and possible wireless communications,
would be to log the data directly to a database. This is a fairly complicated process and hasn’t been
looked into during this project but would be recommended as a future improvement.
9.8
Additional Features
Additional features which could also be implemented include the addition of a real time clock. The
MCU does have registers which can be programmed to include a real time clock. The major issue
however is that the real time clock resets every time power is lost. An external real time clock is
proposed.
Adding a temperature sensor and logging temperatures every 10 minutes (or any other given period
of time) can also alert to potential issues in current curves. As previously stated in the report, a
points machines first swing on a cold winter’s morning will have a higher current draw than a swing
in the middle of the day during summer. Without a real time clock to indicate immediately that this
point swing happened at 4am on a winter’s day, a temperature reading of perhaps 1C logged at the
same time would indicate that perhaps this is the first swing of the morning and that there isn’t
really an issue. That would explain the extreme behaviour.
ENG450 – Engineering Internship
Page 46
Including a strain gauge within the rails and logging force against time concurrently with current
against time could also assist in problem diagnoses. Similarly to what was previously mentioned, an
obstruction in the rails would easily be diagnosed if the graphs of the force and current look similar.
Torque is directly proportional in a motor to the current flowing through it,
T (Nm) ∝ i (A)
Torque is the rotational force of the motor measured in Newton meters. This relationship proves
that an increase in force results in an increase in current and this is the relationship expected to be
found in the case of an obstruction between the rails affecting a points swing.
Safety is another feature which is paramount. It is proposed that instead of using banana plug wires
that male/female socket leads are instead used. This leads are much more difficult to be displaced
thus making them safer in regards to not giving potentially somebody an electric shock. Although the
highest voltage this device uses is 50V DC, the highest voltage a person can use without an electrical
trades license [21], warning signs and user documentation will also be provided to notify the user of
any dangers. LED indicator lights to notify that the system is operating (or that it is receiving voltage
as intended to) will also be added, this means the user will not have to measure across terminals in
order to check whether it is operating and potentially come into contact with live wiring.
ENG450 – Engineering Internship
Page 47
10.0 Conclusions and Achievements
This project had both positive and negative results, however an emphasis from learning from failures
was paramount. This meant that negative outcomes could always be considered a positive providing
something was learnt about the error. The important thing with design projects is the way errors are
managed and handled and minimising their repercussions. Time and money in industry are usually
the two key elements which are affected the most by these errors and this project was no different.
This project included many stages such as:
Research;
Design;
Construction;
Simulating;
Testing;
Commissioning (to come).
With the successful implementation of the above stages, it can be concluded that vast experience
and knowledge was gained throughout the project. The following achievements were identified and
listed as follows:
Researching topics outside of comfort zone (eg, C programming and electronics);
Design of a summing electronic summing amplifier circuit;
Implementing the SPI Bus;
Using a new microcontroller with no prior experience;
“Planning” simulations, creating tables to enter data and analysing the data obtained, as
compared to a doing simulations with expected results and then continuing;
Following up from the previous dot point, documenting each part of the project thoroughly;
Performing calculations correctly and incorrectly, and in the case of the latter, learning from
the mistakes made;
Successfully monitoring current, and logging the data to the external SRAM and then being
able to download this data to a PC via UART;
Creating a Gantt chart and staying on schedule / Time management skills;
Liaising with stakeholders and other interested parties.
ENG450 – Engineering Internship
Page 48
Overall, this project has been a success, at the time of the thesis report being due; the project had
reached 95% completion, with only delays due to manufacturers and or couriers holding the project
from full completion.
ENG450 – Engineering Internship
Page 49
11.0 References
[1]
Railway Points Machines, University of Oxford, 2002, accessed 10/10/13,
http://www.eng.ox.ac.uk/InvensysUTC/other%20research/railway-points-machine
[2]
Points Condition Monitoring – A flexible and intelligent solution to maximise availability and
reduce cost, CDSRail, 2007, accessed 14/10/13,
http://www.cdsrail.com/eng/support/brochures/Points%20Monitoring%20Brochure.pdf
[3]
Annual Report 2012, Transperth,2012, accessed 10/10/13,
http://www.pta.wa.gov.au/portals/0/annualreports/2012/report/transperth/transperth-trains.html
[5]
Brushed DC Motor Theory, Neuroscience and Robotics Lab, 16/02/11, accessed 17/12/13,
http://hades.mech.northwestern.edu/index.php/Brushed_DC_Motor_Theory
[6]
Sondalini, Mike; How to use Condition Monitoring as a Proactive Equipment Reliability
Improvement Strategy, Lifetime Reliability Solutions, 2013, accessed 01/11/13, http://www.lifetimereliability.com/free-articles/maintenance-management/condition-monitoring-as-a-reliabilityimprovement-strategy.html
[7]
PIC24FJ64GA002 User’s Manual, Microchip, 05/04/13, accessed 06/08/13,
http://www.microchip.com/wwwproducts/Devices.aspx?dDocName=en026374
[8]
Microchip Technology’s Academic Program, Microchip, 2013, accessed 18/09/13,
http://www.microchip.com/developmenttools/academics.aspx
[9]
HI-Tech C Compiler for PIC24 MCUs, Microchip, 2012, accessed 01/11/13,
http://www.microchip.com/stellent/idcplg?IdcService=SS_GET_PAGE&nodeId=1406&dDocName=en
542865
[10]
Cold Load Pickup Issues, The IEEE Power Society, 2008, accessed 08/10/13,
http://www.google.com.au/url?sa=t&rct=j&q=&esrc=s&frm=1&source=web&cd=7&ved=0CGAQFjA
G&url=http%3A%2F%2Fwww.pespsrc.org%2FReports%2FCold_Load_Pickup_Issues_Report.pdf&ei=5XVkUsC2LeSWiQeKwYDQCA&usg
=AFQjCNE3tzx5zu63d07OQ_mauk0iBENORg&sig2=gCjdY_ry25YGWpVqpS5YjA
[11]
Current Transducer LA 55-P Datasheet, AllDataSheet, 2013, accessed 10/11/10,
http://pdf1.alldatasheet.com/datasheet-pdf/view/114818/LEM/LA55-P.html
[12]
23LCV1024 Data Sheet, Microchip, 2012, accessed 06/08/13,
http://ww1.microchip.com/downloads/en/DeviceDoc/25156A.pdf
[13]
SPI Bus Interface, EE Herald, 2006, accessed 06/08/13,
http://www.eeherald.com/section/design-guide/esmod12.html
ENG450 – Engineering Internship
Page 50
[14]
Quinn, David; The Advantages of Using FPGAs in High Speed, High Density Data Acquisition
Systems, Nutaq, 18/03/13, accessed 21/10/13, http://www.nutaq.com/en/blog/advantages-usingfpgas-high-speed-high-density-data-acquisition-systems
[15]
Hercules Setup Utility, HW Group, 2013, accessed 19/10/13, http://www.hwgroup.com/products/hercules/index_en.html
[16]
Thermal Design, SMPS, 2013, accessed 01/11/13, http://www.smps.us/thermal.html
[17]
LM117HV/LM317HV 3-Terminal Adjustable Regulator, Texas Instruments, April 2013,
accessed 18/09/13, http://www.ti.com/lit/ds/symlink/lm317hv.pdf
[18]
SidelineSoftware, NL5 Circuit Simulator, created by Alexei Smirnov, last modified: August 08,
2013, accessed from September 2013.
[19]
Brown, Michael; Flash Memory, Maximum PC, 11/05/07, accessed 17/12/13,
http://www.maximumpc.com/article/white_paper_flash_memory
[20]
PIC24FJ64GA002 DataSheet, Datasheet Direct, 12/04/13, accessed 09/10/13,
http://www.datasheetdir.com/PIC24FJ64GA008+PIC-Microcontrollers
[ 21]
Electricians License, Energy Safe Victoria, 2013, accessed 08/11/13,
http://www.esv.vic.gov.au/Electricity-Professionals/Licensing-and-registration/Electricians-Licence
[22]
DC/DC Converters, Traco Power, 2011, accessed 10/11/13,
http://www.tracopower.com/products/dc-dc-converters/
Other sources used in order to research this project, but which were not directly referred in this
report.
C Programming Tutorial, Cprogramming, 2011, accessed 12/08/13,
http://www.cprogramming.com/tutorial/c-tutorial.html
Gookin, Dan; C for Dummies, For Dummies, 2013, accessed 12/08/13,
http://www.dummies.com/how-to/content/the-importance-of-the-main-function-in-cprogrammi.html
Amplifiers, All About Circuits, 2012, accessed 01/09/13,
http://www.allaboutcircuits.com/vol_3/chpt_1/3.html
MPLAB ICD In Circuit Debuggers, Mircrochip Forums, 2013, accessed 14/09/13,
http://www.microchip.com/forums/f49.aspx
ENG450 – Engineering Internship
Page 51
C Programming – The Basics, Stackoverflow, 2013, accessed 13/09/13,
http://stackoverflow.com/search?q=c+programming
Application Development, ProgrammingForums, 2013, accessed 20/09/13,
http://www.programmingforums.org/forum60.html
Op-Amp Varieties, Hyperphysics, 2013, accessed 18/09/13, http://hyperphysics.phyastr.gsu.edu/hbase/electronic/opampvar.html
DC-DC Converter Tutorial, Maximum Integrated, 29/11/2011, accessed 18/09/13,
http://www.maximintegrated.com/app-notes/index.mvp/id/2031
General Purpose Electrical Enclosures, B&R Enclosures, 2013, accessed 01/11/13,
http://www.brenclosures.com.au/general_purpose.htm
Storr, Wayne; The Summing Amplifier, Electronics-Tutorials, 2013, accessed 1/09/13,
http://www.electronics-tutorials.ws/opamp/opamp_4.html
Sallen-Key Low-pass Filter Design Too, Okawa Electric Design, 2008, accessed 25/10/13,
http://sim.okawa-denshi.jp/en/OPseikiLowkeisan.htm
ENG450 – Engineering Internship
Page 52
12.0 Appendices
Two appendices are included in this thesis as well as manuals which will be included in the electronic
submission. Appendix A discusses the C code used for the project as well a copy of the full code.
Appendix B acts as a user manual of how to operate the system when it is connected to a location
case and actually measuring current.
12.1 Appendix A – C Code used for the MCU
The code used in this project is extensive. Being a lower level programming language, this had
advantages such as being able to program the MCU at the register level as well as implementing
interrupts. The code initially had over 300 lines of code, this had been reduced and optimised to 267
lines. Features of the code include:
The main program.
Setting up SPI registers, then implementing code to read and write 10 bit data to the SRAM
chip. As serial data is 8 bit, the 10 bit data had to be broken up into two 8 bit sections. Vice
versa, when the code is to be read from the chip, this data had to be reconstructed.
Setting up the ADC registers.
Setting up the timing registers.
Setting up the UART registers.
The interrupts.
Having never used or learnt the C programming language before, consultation from various array of
sources were required to learn the language. These sources included:
Microchip manuals.
PIC C programming books.
Online forums.
Online websites.
Engineers who had previous knowledge.
The program relies on receiving a digital input from either the RWR relay or the NWR relay, while
this signal is true, the program logs the data and writes it to the SRAM chip. When there is
connection with a serial terminal on a PC, if the user wishes to erase or download the logged data,
this is done via pressing E or D on the keyboard and the data will be erased or downloaded through
the terminal emulator. From this stage, the user can then copy and paste the data into a program
such as Excel to interpret the data.
ENG450 – Engineering Internship
Page 53
The full program code is as follows, in code commenting is included.
#include "p24fj64ga002.h"
#include "libpic30.h"
#include "adcDrv1.h"
#include "stdio.h"
#include "string.h"
// the above include path may be different for each user.
If a compile
// time error appears then check the path for the file above and edit
// the include statement above.
_CONFIG1( FWDTEN_OFF & JTAGEN_OFF );
speed, 16M = ~1 second
// Set internal clock
_CONFIG2( POSCMOD_XT & FNOSC_PRIPLL & FCKSM_CSDCMD );
internal clock speed, 16M = ~1 second
// Set
#define XTFREQ
frequency
7372800
//On-board Crystal
#define PLLMODE
2
//On-chip PLL setting
#define FCY
XTFREQ*PLLMODE
#define BAUDRATE
#define BRGVAL
9600
//Instruction Cycle Frequency
//Define baud rate
((FCY/BAUDRATE)/16)-1
void IOInit(void);
all functions required
//call
void initAdc1(void);
void initTmr3(void);
void initSram(void);
void WriteSPI(char data);
char ReadSPI();
void WriteSRAM(long address, int value);
int ReadSRAM(long address);
void initUART();
ENG450 – Engineering Internship
Page 54
void SendIntUART(int intdata);
unsigned int SRAMaddress;
int main() {
program begins here
//
//main
CLKDIVbits.RCDIV = 0;
IOInit();
these functions so they are all initialized
//call
initAdc1();
initTmr3();
initSram();
initUART();
unsigned long i;
int datain;
program executes here
//main
for(i=0;i<65535;i++) {
steps of 1
//increment in
datain = ReadSRAM(i);
corresponding incremented value
//datain = SRAM
if(datain == 0) {
//if datain = 0
(and therefore blank) Sramaddress =1, this means start here on next set of
logs
SRAMaddress = i;
break;
}
}
if(i==65535) SRAMaddress = 65535;
T3CONbits.TON = 1;
timing bit
ENG450 – Engineering Internship
//Turn on
Page 55
while(1) {
//this
ensures main code is always executing and returning a value, as it must in
C
Nop();
}
return(0);
}
void WriteSPI(char data) {
WriteSPI function
//This is the
while(SPI1STATbits.SPITBF);
transmit data buffer is true
//while the
SPI1BUF = data;
data in the buffer is now called the variable "data"
//the
while(!SPI1STATbits.SPIRBF);
char dummyread;
the receive data buffer is true
dummyread = SPI1BUF;
the buffer is now called the variable "dummyread"
//while
//the data in
}
char ReadSPI() {
ReadSPI function
//This is the
while(SPI1STATbits.SPITBF);
trasnmit data buffer is true
//while the
SPI1BUF = 0xFF;
ones in the 8 bit character
while(!SPI1STATbits.SPIRBF);
buffer is true
//Writes
//while the receive
char dummyread;
dummyread = SPI1BUF;
the data in the buffer
//dummyread =
return dummyread;
}
ENG450 – Engineering Internship
Page 56
void WriteSRAM(long address, int value) {
the actual SRAM chip via spi bus
//This function writes to
address = address * 2;
represents 2 lots of 8 bit data
//address*2
address = address & 0x00FFFFFF;
through the address
//Write ones
LATBbits.LATB15 = 1;
select high (initializing)
//Turn Chip
Nop(); Nop(); Nop();
//Wait 3 clock
ticks (just to give enough time to ensure chip select is on)
LATBbits.LATB15 = 0;
select low
WriteSPI(0x02);
sequence
//Turn chip
//write
WriteSPI((address >> 16) & 0xFF);
//this part of the
code helps write the 10 bit data into 2 seperate 8 bit chunks
WriteSPI((address >> 8) & 0xFF);
WriteSPI(address & 0xFF);
WriteSPI((value >> 8) & 0xFF);
WriteSPI(value & 0xFF);
LATBbits.LATB15 = 1;
chip select back to high, finishing the write sequence
//Toggle the
}
int ReadSRAM(long address) {
responsible for read the data back from the sram
//This function is
int uppernibble = 0;
top 8 bits of data
//Uppernibble =
int lowernibble = 0;
bottom 8 bits of data
//Lowernibble =
int value;
address = address * 2;
address = address & 0x00FFFFFF;
LATBbits.LATB15 = 1;
sequence again
//Chip select
Nop(); Nop(); Nop();
LATBbits.LATB15 = 0;
ENG450 – Engineering Internship
Page 57
WriteSPI(0x03);
sequence
//read
WriteSPI((address >> 16) & 0xFF);
WriteSPI((address >> 8) & 0xFF);
WriteSPI(address & 0xFF);
uppernibble = ReadSPI() & 0x00FF;
lowernibble = ReadSPI() & 0x00FF;
value = (uppernibble << 8) | lowernibble; //shift uppernibble down
and or with lower nibble to return origninal 10 bit value
LATBbits.LATB15 = 1;
chip select back to high, finishing the read sequence
//toggle the
return value;
}
void IOInit(void) {
//initialize IO, turn on/off pins, set them high/low etc
PADCFG1 = 0xFF;
AD1PCFG = 0xFFFF;
//
TRISAbits.TRISA0 = 1;
//
TRISAbits.TRISA1 = 1;
program
TRISBbits.TRISB15 = 0;
output, 1 = input
//
// Define main
// Set as output. TRISBbits 0 =
TRISBbits.TRISB14 = 1;
TRISBbits.TRISB13 = 1;
//
TRISBbits.TRISB12 = 1;
TRISBbits.TRISB5 = 1;
TRISBbits.TRISB3 = 1;
//
TRISBbits.TRISB0 = 1;
//
TRISBbits.TRISB1 = 1;
//
PORTB = 0;
are for UART
//These pins
RPINR20bits.SDI1R = 10;
ENG450 – Engineering Internship
Page 58
RPOR3bits.RP7R = 8;
RPOR3bits.RP6R = 7;
}
void initAdc1(void) {
ADC registers
AD1CON1bits.FORM = 0b00;
//This function is setting up the
// Initialize data output bits to
0
AD1CON1bits.SSRC = 2;
and starts conversion
AD1CON1bits.ASAM = 1;
//Timer 3 compare ends sampling
// A/D enable bit turned on
AD1CON2bits.SMPI = 0;
// Sample/Convert per interrupt
selection bit, interrupts at the completion of each conversion
AD1CON2bits.BUFM = 0;
word buffer
// Buffer configured as on 16
AD1CON3bits.ADRC = 0;
//Clock derived from system clock
AD1CON3bits.ADCS = 31;
//ADC conversion clock select
bits
AD1CHS = 5;
register (analog input pin)
// ADC input select
AD1PCFGbits.PCFG5 = 0;
ADC sample pin voltage
//Pin configured in analog mode,
AD1CSSL = 0x0000;
to zero for safety
//register ot required, all set
IFS0bits.AD1IF = 0;
//interrupt enable bits
IEC0bits.AD1IE = 1;
AD1CON1bits.ADON = 1;
ODCAbits.ODA0 = 0;
TRISAbits.TRISA0 = 0;
ENG450 – Engineering Internship
Page 59
//int adcdata;
//adcdata = ADC1BUFF;
}
void initTmr3(void) {
//Timer function
TMR3 = 0x0000;
all values as 0
PR3 = 250;
// initialize
// ~10 Hz @ PR3 = 23000
IFS0bits.T3IF = 0;
enable bits
PR3 used for scaling
// interrupt
IEC0bits.T3IE = 0;
T3CON = 0x0020;
clock prescale select bits (1:64)
// Timer input
}
void initSram(void) {
registers
//Initialze SRAM
SPI1CON1 = 0x0000;
everything to 0 to initialize
// set
SPI1CON1bits.CKE = 1;
// serial output data
changes on transition from active clock state to idle
SPI1CON1bits.SPRE = 0b000;
// prescaler set to
8:1
SPI1CON1bits.PPRE = 0b11;
set to 1:1
SPI1CON1bits.MSTEN = 1;
// primary prescaler
// master mode enable
bit on
SPI1STAT = 0x0000;
SPI1STATbits.SPIEN = 1;
configured, SCK, SDO, SDI and SSx serial port pins
//enables module and
}
void initUART() {
//initialize UART registers and set them up
CLKDIVbits.RCDIV = 0;
RPINR18bits.U1RXR = 9;
ENG450 – Engineering Internship
// Make Pin RP9 U1RX
Page 60
RPOR4bits.RP8R = 3;
// Make Pin RP8 U1TX
PADCFG1 = 0xFF;
// Make analog pins digital
LATB = 0x0;
TRISB = 0x0FFF;
U1BRG
// Configure LED pins as output
= BRGVAL;
U1MODE = 0x8000;
// Reset UART to 8-n-1, alt pins, and enable
U1STA
// Reset status register and enable TX & RX
= 0x0440;
IFS0bits.U1RXIF = 0;
//enable the interrupt
IEC0bits.U1RXIE = 1;
}
void SendIntUART(int intdata) {
communicate between the chip and PC
//this functions the UART to
while(!U1STAbits.TRMT);
the transmit buffer
//While there is "something" in
char stringout[8];
(ASCII)
//send data as a string
sprintf(stringout, "%d\n\r", intdata);
to string to be displayed
//define how the user wants
int i, slen;
slen = strlen(stringout);
for(i=0;i<slen;i++) {
U1TXREG = stringout[i];
transmit register
//write stringout into the
while(!U1STAbits.TRMT);
}
}
void __attribute__((interrupt, no_auto_psv)) _ADC1Interrupt(void) {
ENG450 – Engineering Internship
Page 61
int adcdata;
adcdata = ADC1BUF0;
//adc values stored in the buffer
are now represented as the variable dacdata
if(PORTBbits.RB13 == 1 && SRAMaddress < 65535) {
//IF digital input from relays (which have been OR'd) is true AND
there is available memory
WriteSRAM(SRAMaddress,adcdata);
//WriteSRAM into whichever SRAMaddress is available, priority
is first address and write corresponding adcdata
//int readdata = ReadSRAM(SRAMaddress);
if(SRAMaddress < 65535) {
//Increment SRAM address by 1 if memory isn't full
SRAMaddress = SRAMaddress+1;
}
}
IFS0bits.AD1IF = 0;
//clear the interrupt flag
}
void __attribute__((interrupt, no_auto_psv)) _U1RXInterrupt(void) {
//UART interrupt
char datain;
int readdata;
unsigned int psram = 0;
if(U1STAbits.URXDA) {
//If the receive ruffer data available bit is
true (read from terminal emulator)
datain = U1RXREG;
//Datain = what the value entered is ...
Erase or Download
if(datain == 'E') {
//If datain = E (Erase)
unsigned int i;
ENG450 – Engineering Internship
Page 62
for(i=0;i<65535;i++) {
//Then for all values from 0 to 65355
WriteSRAM(i, 0);
//Write zeros to these addresses, effectively
clearing memory
SRAMaddress = 0;
//Return back to initial SRAM address
}
}
if(datain == 'D') {
//If datain = D (download logs)
psram = 0;
//begin at first SRAM address
while(1) {
readdata = ReadSRAM(psram);
//Readdata = read from SRAM addresses one at
a time
if(psram < 65535) {
//For all logs located within the
address
if(readdata == 0 || psram == 65535) break;
//Read until memory is full OR there are zeros
(memory not full)
SendIntUART(readdata);
//Send the readdata values via UART to the
terminal emulator
psram++;
//increment by one a repeat
}
}
}
}
IFS0bits.U1RXIF = 0;
//Clear the interrupt flag
}
ENG450 – Engineering Internship
Page 63
12.2 Appendix B – User’s Documentation on operation of the system.
The following appendix provides a user guide on how to operate the system in the PTA rail
environment. Within the electrical enclosure unit in which the system is located in, there are 7 I/O
holes drilled to allow wiring to be done safely to the location case. The I/O represents:
Digital Inputs from the NWR and RWR relays.
12V power to supply the relay contacts.
50V input from location case power supply.
Current Loop.
The system should be taken onsite, with an appropriately qualified person to wire and install the
unit. Drawings should be referred to in order to find spare relay contacts and fused 50V power
supplies. Once the appropriate relay is found, the 12V output should be wired into it the NWR and
daisy chained into the RWR relays. This provides power, so that when picked, will trigger a voltage or
a “true” value back into the MCU. Figures 23 and 24 show examples of the wiring.
Figure 23: Example of how to wire into the relay
Drawings should also be referred to locate the N/RWR link, when this link is located, the fuse should
be removed and wires placed in a parallel arrangement, this directs the current flow to the device
and subsequently through the Hall Effect sensor.
ENG450 – Engineering Internship
Page 64
The user should double check that the green LED indication is apparent on the MCU. If the light is
on, this should indicate that the system is receiving power and will begin logging when the
appropriate signals are triggered (NWR or RWR relay picking and therefore points machine in
operation). When the unit is removed, the wires must be pulled out. The unit should be taken to an
appropriate location nearby a PC. The USB cable should then be connected and a terminal emulator
program opened up. For this project, the emulator program “Hercules” was used. When serial
communications have been established (important, user must choose 8 bit data, 1 stop bit and no
parity bit and a baud rate of 9600), to download the logs the user must press “D” into the emulator
program.
The logs should now download and can then be copy and pasted into a spreadsheet to then be
plotted. Once plotted, the data can be analysed and discrepancies can be identifying and
recommendations based on the data made.
Figure 24: Q Style relay
ENG450 – Engineering Internship
Page 65
12.3 Appendix C – Computer Aided Drawing of the Wiring Diagram
Figure 25: CAD Wiring Diagram
ENG450 – Engineering Internship
Page 66