1
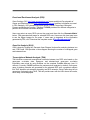
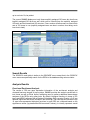
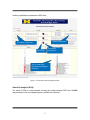
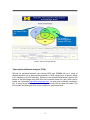
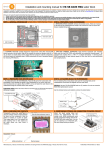
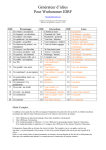
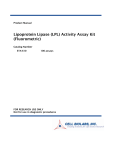
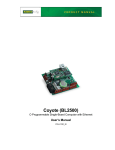
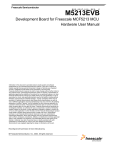
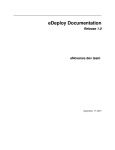
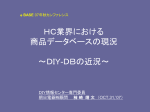
Diabetic Neuropathy Microarray
Knowledge-Base (DNMKB)
User’s Manual
(Released on 1/2/2014)
http://jdrf.neurology.med.umich.edu/DNMKB/
Copyright 2013 Program for Neurology Research and Discovery.
All rights reserved.
Feldman Laboratory
Program for Neurology Research and Discovery
University of Michigan
Ann Arbor, MI 48109, USA
Email: [email protected]
1
Table of Contents
Introducing DNMKB ........................................................................... 1
Statistics ............................................................................................................... 3
Accessing DNMKB ............................................................................................... 4
Features ............................................................................................................... 4
Starting DNMKB.................................................................................. 6
Login .................................................................................................................... 6
Select Options ...................................................................................................... 6
Main Menu ........................................................................................... 7
Browse Menu ....................................................................................................... 7
Search Menu ........................................................................................................ 8
Analysis Menu ...................................................................................................... 9
Understanding Results .................................................................... 11
2
Introducing DNMKB
Diabetic neuropathy (DN) is the most common and debilitating complication of diabetes,
but the pathogenesis is not fully understood despite extensive research. Recently, the DN
research community employed high-throughput technologies to examine DN-associated
transcriptomic changes in human and animal models. To comprehensively understand the
complex systems associated with DN, it is critical to have a disease-specific data storage
and analysis system to facilitate effective mining and seamless integration of the enormous
amount of data.
Here, we present the Diabetic Neuropathy Microarray Knowledge-Base (DNMKB), a
centralized repository and analysis portal of diabetic neuropathy (DN)-related
transcriptomics data. DNMKB has been developed to facilitate the efficient storage and
exploration of the high-volume microarray data. Table 1 lists the current data sets (as of
12/19/2013), including both published and unpublished data. While access to unpublished
data is currently limited to laboratory members, it will also be made publicly available once
the associated studies are published.
Table 1. Overall statistics
Total Number
Number of experiments
Number of DEG sets
Species
13
52
Human, mouse, and rat
Statistics
DNMKB currently contains 52 differentially expressed gene (DEG) sets from 13 DN-related
microarray data sets, including transcriptomic profiles in peripheral (dorsal root ganglia,
sciatic nerve, and sural nerve) and central (hippocampus) nervous tissues from several
mouse models (db/db, BTBR ob/ob, high-fat diet, and Streptozotocin-induced) and human
subjects. The details of the current transcriptomics data sets are summarized in Table 2.
Four microarray data sets from other investigators, identified from a public microarray
database ArrayExpress (http://www.ebi.ac.uk/arrayexpress/), were processed by our inhouse analysis pipeline and included to maximize the data comparability.
3
Accessing DNMKB
DNMKB is accessible at http://jdrf.neurology.med.umich.edu/DNMKB/. Public users can
access any published microarray data, while the Feldman Lab members or collaborators
have unrestricted access to the database. Member login ID and password are given by the
system administrator and non-members can use the following login:
Email:
Password:
public@access
public
Table 2. Summary of current transcriptomics data in DNMKB
Data Set Name
Species
Type
Genotype/BG
Age
Tissue
# of
DEG
sets
db/db
mouse
2
BKS db/db
8~24 wks
SCN, DRG
10
Mostly
db/db autonomic
mouse
2
BKS db/db
24 wks
AG
1
No
HighFat
mouse
2
C57BL/6
36 wks
SCN, DRG
2
No
DBA2
mouse
1
DBA2J
34 wks
SCN
3
Rosiglitazone
Yes
PIO
mouse
1&2
BKS db/db
16 wks
SCN, DRG
8
Pioglitazone
No
obob-male
mouse
2
BTBR ob/ob
5~13 wks
SCN
6
No
obob-female
mouse
2
BTBR ob/ob
26 wks
SCN
1
No
SOD1
mouse
NA
C57BL/6
2~30m
SCN
7
Yes
Human DN
human
1&2
NA
NA
Sural
2
Yes
Pub1-Rat
rat
1
Goto-Kakizaki
10 wks
Hippocampus, Cortex
2
Yes
Pub2-Rat
rat
1
Sprague–Dawley
6~8 wks
DRG
3
Yes
Pub3-Rat
rat
1
Wistar
6~13 wks
DRG
5
Yes
Pub4-Ins2Akita
mouse
1
Ins2_Akita/+
20~26 days
SCN, DRG
2
Yes
Treatment
Published
d * DRG: dorsal root ganglia, SCN: sciatic nerve, AG: autonomic ganglia
Features
DNMKB allows users to explore the compendia of genes and biological functions
(pathways) perturbed in the neuronal tissue by diabetes or drug treatment. Users can
easily identify the most frequently and highly regulated genes in either all or selected
datasets (across different animal models, tissues, and ages). Users can search the
database using various criteria such as gene name, Entrez ID, gene symbol (or synonym),
and associated biological function (Gene Ontology term and KEGG pathway name or their
respective ID) and explore gene regulation across studies. All the results are
downloadable in Excel spread sheets to facilitate the users’ downstream analyses.
4
Browse mode
Users can browse the compendia of the transcriptomics datasets. The full list of
differentially expressed genes (DEGs) will be available for any selected dataset using
user-defined significance level and fold-change criteria.
Search mode
Users can search the database using various criteria such as gene name, Entrez ID, gene
symbol (or synonym), and associated biological function (Gene Ontology term and KEGG
pathway name or their respective ID).
Analysis mode
Users can perform various analyses on the DEG sets. Currently supported features
include functional enrichment analysis for identifying enriched biological functions among
the DEGs, gene set analysis for identifying the gene-level overlap among selected DEG
sets, and transcriptional network analysis for network-level comparison of two selected
DEG sets.
5
Starting DNMKB
Login
Click the ‘LOGIN' button on the front page of DNMKB and proceed with registered or
public ID and password. Public users can enter 'public@access' as email and 'public' as
password, or simply click the 'Public Login' button.
Figure 1. Login
Select Options
Figure 2. Select options
The first step after login is to retrieve the available microarray data sets and filter them
using four major criteria and/or simple keywords.
6
•
•
Drop-down menu: Select options for ‘Species’, ‘Tissue’, ‘Age’ and ‘DEG tool’ or
type search keywords into the textbox to retrieve microarray dataset. Then click
‘Retrieve Available Microarray List’ button. It should be noted that this filtering
step is optional, but users must click the retrieve button to proceed.
Reset: Click ‘Reset to Defaults’ button to reset all selected options to their default
values.
Main Menu
Browse Menu
‘BROWSE’ provides users with an efficient way to retrieve all DEGs with their fold-change
information. The results can be sorted by different criteria such as the number of
experiments having each gene as a DEG or by the fold-changes in a specific DEG set.
DEGs from different species will be automatically mapped across different species using
the NCBI HomoloGene database (http://www.ncbi.nlm.nih.gov/homologene).
Users should first select datasets to browse. Optionally, users can adjust the sorting and
handling species options before retrieving the results. Users can also specify the
significance value or minimum fold-change cutoff to limit the results to highly significant
DEGs. If these values are not specified, the default values (each DEG set have their own
default criteria) will be automatically used.
Once all options are chosen, users need to click the ‘Generate Matrix’ button to proceed.
Figure 3. Browse menu
Sort by
This option specifies how the retrieved DEGs in the result page are ordered. The default is
‘# of experiments with DEGs’, putting the most frequently perturbed DEGs across multiple
conditions on the top list. If a specific dataset is selected, then the genes will be sorted by
the fold-change values in the selected dataset. The list of sorting options in the drop-down
7
menu is different based on the selected datasets resulting by the previous step.
Combine multiple species
This option specifies how genes from multiple species are handled and displayed. The
default is ‘use mouse gene as base’ as the majority of the datasets are using mouse.
Search Menu
‘SEARCH’ provides users with search flexibilities to retrieve specific DEGs of interest. As
in Browse menu, users can provide custom significance and fold-change cutoffs. If these
values are not specified, the default values for each DEG set will be used.
Once the keywords or significance and fold-change cutoff values are typed, users click the
‘Generate Matrix’ button.
Search criteria
DNMKB supports seven types of search criteria. Only one search criterion should be used
for each query, although multiple keywords are allowed in selected criteria (noted as
MULTI below). Allowed separators include ‘semicolon’, ‘comma’, ‘tab’, ‘space’, ‘newline’.
•
•
•
•
•
•
•
Gene IDs: Entrez gene IDs [MULTI]
Gene Symbols: Entrez gene symbols (either official or synonyms) [MULTI]
Gene Names: Entrez gene name (either complete or partial names)
GO IDs: Gene Ontology IDs [MULTI]
GO Term: Gene Ontology term (either complete or partial terms)
KEGG IDs: KEGG Pathway IDs [MULTI]
KEGG Pathway Name: KEGG pathway (either complete or partial names)
Show non-DEGs option
This option specifies if the result matrix will include any non-DEGs. This feature is useful in
case the genes of users’ interests do not show up in the matrix and users want to make
sure if the genes are included in the array platform. The default is ‘Do NOT show any nonDEGs’. If ‘Show any non-DEGs’ is selected, the following colors will be used to represent
different DEG types:
•
•
•
Green: included in the array and a DEG
White: included in the array but not a DEG
Gray: not included in the array
All other features in the ‘SEARCH’ menu are identical to those in the ‘BROWSE’ menu.
8
Figure 4. Search Menu
Analysis Menu
‘ANALYSIS’ provides users with further analysis tools to identify meaningful information
from selected DEG sets. Three different analysis methods are currently supported in
DNMKB; ‘Functional Enrichment Analysis’, ‘Gene Set Analysis’ and ‘Transcriptional
Network Analysis’.
Figure 5. Analysis menu
9
Functional Enrichment Analysis (FEA)
Gene Ontology (GO; http://www.geneontology.org/) terms and Kyoto Encyclopedia of
Genes and Genomes (KEGG; http://www.genome.jp/kegg/) pathway information are used
in FEA. Basically, GO is classified by three groups; Cellular Component, Biological
Process and Molecular Function. Therefore, DNMKB provides four different categories to
perform the functional enrichment analysis.
Users can select as many DEG sets as they want and then click the ‘Generate Matrix’
button. FEA generates heat maps for selected DEG sets. Users can click heat map icons
to see the bigger images for the maps. If users want to download all the information
generated by FEA, click ‘Download the complete results (FuncEnrichment.zip)’
Gene Set Analysis (GSA)
GSA is done by clicking the ‘Generate Venn-Diagram’ button after selecting between two
and 5 DEG sets. GSA provides a Venn-diagram showing the number of overlapped gene
sets between them.
Transcriptional Network Analysis (TNA)
TNA identifies conserved transcriptional networks between two DEG sets based on the
gene-gene co-citation data. Sentence- and abstract-level gene-gene co-citation
information was mined by using SciMiner on the complete PubMed abstracts (over 21
millions). Currently, DNMKB performs the sentence-level analysis by default. Once genegene co-citation networks are generated for the selected DEG sets, a graphical analysis
tool TALE identifies sub-networks shared by two DEG networks. Since it takes long time to
generate a final graph using TALE, TNA will provide users with the URL where the results,
once ready, will be displayed.
10
Understanding Result Tables
The figure below illustrates an example of the matrix.
Browse Results
Figure 6. Browse Menu Result Table
•
•
•
•
•
The matrix is downloadable in Excel file.
Clicking the column headers will sort the table.
Clicking gene IDs will show the detailed gene information (NCBI Entrez Gene
database)
Clicking symbols will create a summary page of biological functions (GO and
KEGG pathway) associated with the selected gene.
The values correspond to the fold-changes between control and diabetes,
unless specified otherwise. Positive values: up-regulated in diabetes and
negative values: down-regulated in diabetes. The degree of fold-change is
also represented by color gradient of the cell (red vs blue)
As shown above, clicking symbols will create a summary page for biological functions in
terms of GO and KEGG pathway associated with the selected gene (in a new window).
Depending on the number of associated function, the loading time of this page may take
11
up to a minute. So, be patient.
The current DNMKB displays not only those explicitly assigned GO terms but also those
implicitly assigned GO terms as well, which can be inferred from the explicitly assigned
GO terms and the hierarchical GO structure. Future version will allow users to select which
sets of GO terms to use (explicitly assigned terms are less in number, thus taking much
less time to load).
Figure 6. Summary Table for Biological Functions
Search Results
The ‘SEARCH’ result table is similar to the ‘BROWSE’ menu except that in the ‘SEARCH’
menu users can specifically search for the DEGs in the database using various criteria.
Analysis Results
Functional Enrichment Analysis
The results of FEA are gene annotation information of the enrichment analysis and
clustered heat-map images of top functions. DNMKB provides the analysis results both in
text format as well as Excel format, facilitating users to perform additional down-stream
analyses of the DEGs using other tools. By default, biological functions in terms of GO
terms and KEGG pathways with a Benjamini-Hochberg (BH) corrected P-value < 0.05 are
deemed significant and will be included in the heat-map. The heat-map will include the top
10 most over-represented biological functions in each DEG set, clustered based on the
significance values (log-transformed BH-corrected P-values), to visually represent overall
12
similarity and difference between the DEG sets.
Cluster information
The name of DEG set
Heat map
Annotation
information
Top 10 most overrepresented biological
functions
Figure 7. Functional Enrichment Analysis Results
Gene Set Analysis (GSA)
The result of GSA is a Venn-diagram showing the overlap between DEG sets. DNMKB
also provides the list of overlapping genes, available for download.
13
The name of DEG
set
The number of
intersection genes
between DEG sets
Figure 8. Gene Set Analysis Results
Transcriptional Network Analysis (TNA)
TAN will be performed between two selected DEG sets. DNMKB will use 6 levels of
allowed mismatch (a.k.a. approximate parameter in TALE) ranging from 0 (perfect match)
to 0.5 (allowing up to 50% mismatch). Summary of the shared sub-networks is given at the
bottom of the result page along with links to the network format file (.gml), which can be
loaded into Cytoscape (http://www.cytoscape.org/), an open-source network visualization
tool. A simple image will be generated for those networks with less than 300 nodes. The
list of genes (as entrez gene IDs) will be available for download as well.
14
END OF THE USER’S MANUAL
15