1
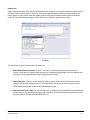
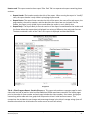
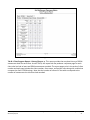
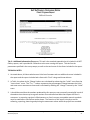
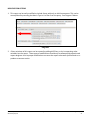
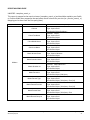
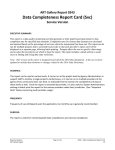
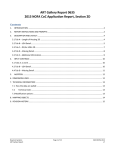
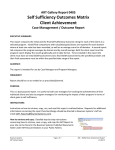
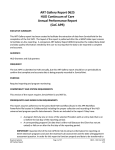
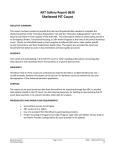
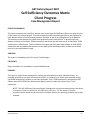
ART Gallery Report 0407
Self Sufficiency Outcomes Matrix
Client Progress
Case Management Report
EXECUTIVE SUMMARY:
This report compares the initial (first) and the most recent (last) Self Sufficiency Outcome rating for each
of the clients in a selected project. First/last comparisons with calculated gains/losses are reported for
each domain where at least one value has been recorded, as well as an average score for all domains.
This summary report displays the results both graphically and in table format. A second report tab
displays a history of the clients’ SSOM assessment, and shows the raw scores on all of the clients’ SSOM
assessments in table format. To be included in this report the client must have at least an initial SSOM
assessment and one additional assessment of any type by the specified provider, at least one of which
must be in the specified date range.
AUDIENCE:
The report is intended primarily for use by Case Managers.
FREQUENCY:
Report should be run as needed or as proscribed/planned.
PURPOSE:
This report is useful to case managers for tracking the achievements of their individual clients. It is
intended primarily for use with current/active clients, as it reports on all clients who have had at least
two SSOM assessments, whether or not they have had a “final” SSOM assessment, as opposed to ART
Gallery report 405 (SSOM Client Achievement Report) which includes only clients with a “final”
assessment.
NOTE: The Self-Sufficiency Outcomes Matrix is designed as a long-term measurement instrument
to measure a client’s transition to self-sufficiency over time. For this report to function
accurately there should only be one matrix record per person per reporting period for the project
selected.
Bowman Systems
ART Gallery Report
Page 1 of 10
407 – SSOM Client Progress Report
v4
INSTRUCTIONS:
The easiest way to start using this report is to navigate to the automapper. This is a folder that has the
reports automatically mapped to your site, so that you don’t have to map them yourself. You can
navigate to the automapper as shown in Figure 2.1 below:
Figure 2.1
Requests for additional information concerning the report function/design should be directed to
Bowman Systems’ Customer Support Specialist (CSS) staff.
Before running the report: Prior to running the report the User must determine the provider to be
included in the report and a date range on which to base the results. The report includes two date
prompts and takes into account the SSOM exit records that occurred during the date range and the
initial matrix created for each exit matrix record found.
Bowman Systems
ART Gallery Report
Page 2 of 10
407 – SSOM Client Progress Report
v4
How to run:
Upon opening the report, the User will be prompted (see Diagram 1) to specify parameters which control
the data returned by the report. Once the User has provided these parameters by responding to the
user prompts, a green check-mark will appear next to each field to indicate that a selection has been
made. The User should then single-click the “Run Query” button to generate the report.
Diagram 1
The three user prompts contained in this report are:
1. Select Matrix Record Provider: Click the “refresh list” icon and wait for the left window to
refresh. Now select a single provider (project) to include by highlighting it in the left window and
moving it into the right window using the right selection arrow.
2. Enter Start Date: The user should enter (or select from the calendar) the first day of the date
range for the desired reporting period. To be included in the report at least one of the clients
SSOM assessments must fall within the specified date range.
3. Enter End Date PLUS 1 Day: The user should enter (or select from the calendar) the day following
the last date for the desired reporting period. (Example. If the desired reporting period is for the
month of March, the end date should be April 1st.)
Bowman Systems
ART Gallery Report
Page 3 of 10
407 – SSOM Client Progress Report
v4
How to read: This report contains three report Tabs. Each Tab is a separate sub-report containing three
sections:
•
•
•
Report Header: The header contains the title of the report. When running the report in “modify”
view, the report header is only visible in print/page layout mode.
Report Footer: The report footer contains the title of the report, the name of the sub-report, the
page number, the version number, and the date/time the report was run /printed. Like the
header, the footer is only visible in print mode when the report is run in modify view.
Report Body: The Report Body is the main section of the report located between the header and
the footer where the reports data is displayed in a variety of different chart and graph formats.
The data contained in each of the Tabs in this report is displayed and described below:
Diagram 2
Tab A – Client Progress Report - Results (Diagram 2): This report tab produces a separate page for each
client who has had at least an initial and one additional SSOM assessment recorded. The report pages
print in the order of client number and each page includes the client number, client name, and project
name along with a table and a bar graph that compare the client’s initial and most recent. This
comparison also includes the net change and percentage change in the client’s average ratings (over all
domains where both the initial and most recent scores are non-null values).
Bowman Systems
ART Gallery Report
Page 4 of 10
407 – SSOM Client Progress Report
v4
Diagram 3
Tab B – Client Progress Report – History (Diagram 3): This report provides the complete history of SSOM
assessment detail for each client. As with Tab A, this report tab also produces a separate page for each
client who has had at least two SSOM assessments recorded. The report pages print in the order of client
number and each page includes the client number, client name, and project name along with a table that
compare the client’s SSOM ratings. Note that the number of columns in the table correspond to the
number of assessments the client has had recorded.
Bowman Systems
ART Gallery Report
Page 5 of 10
407 – SSOM Client Progress Report
v4
Diagram 4
Tab C – Additional Information (Diagram 4): This tab is the standard appendix that is included in all ART
Gallery reports, and is provided as a reference to the user running the report. This tab lists the
parameters specified in the user prompts, as well as the total count of the clients included in the report.
TECHNICAL NOTES:
1. As stated above, all clients who have an initial set of answers and one additional set are included in
the report and the report includes both clients with “final” ratings and those without.
2. In Tab A, the values in the “Change“column are calculated by subtracting the “initial” score from the
”most recent” score. The “% +/- “ column represents the percentage of change between the initial
and most recent assessment scores and is calculated by dividing the “change” amount by the “initial”
score.
3. It should be noted that the numbers produced by this report are not necessarily meaningful in and of
themselves since there may be a great number of uncontrolled variables that impact the client’s
outcomes. In assessing a project’s effectiveness or a client’s success, acceptable research methods
must be used before conclusions can be drawn. The function of this report is simply a tool for
collecting, reporting, observing and printing the assessment values which the project has recorded.
Bowman Systems
ART Gallery Report
Page 6 of 10
407 – SSOM Client Progress Report
v4
ALERTER
Diagram 5
In cases where a client has more than one initial matrix record for the client/provider/time period
selected the user will receive an alerter (see Diagram 5) that indicates there is a matrix record that must
be addressed. User should run the 0508 SSOM Domains at Population Entry report to see the client deal
and address the data quality issue.
REPORT MODIFICATION
Users with ad-hoc ART licenses may wish to modify/customize this report to better suit their needs and
purposes. When modifying an ART Gallery report such as this one, the user will need to make a copy of
the original report into a different folder. This copy can be created either by using the “save as” feature
or by clicking on the “organize” icon in folder view.
NOTE: The original un-modified version of this report is a template and is retained in ART Gallery
Templates folder structure. These template folders are read-only and any reports must be copied to a
location in the user’s site (Favorites or Public Folders) then mapped to the site’s data.
Bowman Systems
ART Gallery Report
Page 7 of 10
407 – SSOM Client Progress Report
v4
MODIFICATION OPTONS
1. This report can be easily modified to include clients with only an initial assessment. This can be
accomplished by removing the Matrix Type In List filter from the query. See Diagram 5 below:
Diagram 5
2. Other variations of this report can be created by adding drill filters, or by incorporating other
variables into the report. These types of modifications should only be attempted by experienced
report designers since improper modification can cause the report to become dysfunctional or to
produce erroneous results.
Bowman Systems
ART Gallery Report
Page 8 of 10
407 – SSOM Client Progress Report
v4
REPORT MAPPING GUIDE
UNIVERSE: template_matrix_u
This report is mapped to the matrix universe. (template_matrix_u) and should be copied to your Public
or Favorite folder then mapped to the equivalent matrix universe for your site (ex. yoursite_matrix_ u).
Mapping can be done from the first query (data).
QUERY NAME
FIELD NAME
Client Id
Client First Name
Client Middle Name
Client Last Name
Matrix Answer Score
Matrix Question Name
BISdata
Matrix Question Id
Matrix Record Id
Matrix Record Type
Matrix Record Provider
Matrix Record Date
Matrix Record Group Id
Bowman Systems
ART Gallery Report
LOCATION/TYPE/USE
Location: Clients
Type: System Field
Use: Results Object/Sub Query
Location: Clients
Type: System Field
Use: Results Object
Location: Clients
Type: System Field
Use: Results Object
Location: Clients
Type: System Field
Use: Results Object
Location: Matrix Measures
Type: System Measure
Use: Results Object
Location: Matrix Measures
Type: System Field
Use: Results Object
Location: Matrix Measures
Type: System Field
Use: Results Object
Location: Matrix Records
Type: System Field
Use: Results Object /Sub Query
Location: Matrix Records
Type: System Field
Use: Results Object / Sub Query Filter (X2)
Location: Matrix Records
Type: System Field
Use: Results Object / Sub Query Filter (X2)
Location: Matrix Records
Type: System Field
Use: Results Object / Sub Query Filter
Location: Matrix Records
Type: System Field
Use: Results Object
Page 9 of 10
407 – SSOM Client Progress Report
v4
REVISION HISTORY:
Version
V11.04.13
V3
V4
Bowman Systems
ART Gallery Report
Description of Changes
Original version –BETA
Revision: Added note that each client should have only one Matrix Record per provider per reporting period
selected for accurate calculation. Updated Mapping information. Added alerter to refer user to
documentation to resolve issues with multiple initial matrices for client. Added Revision History.
Revision: Updated language from “program” to “project” to meet 2014 Data Dictionary updates; added filter
for Matrix name for Matrix Universe changes.
Page 10 of 10
407 – SSOM Client Progress Report
v4