1
448 • 12 Graphics
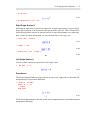
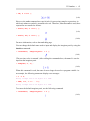
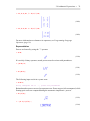
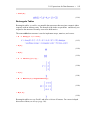
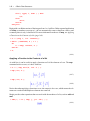
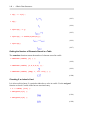
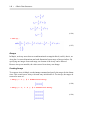
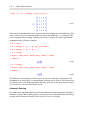
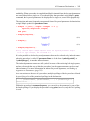
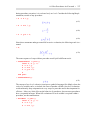
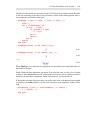
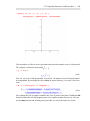
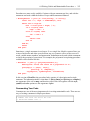
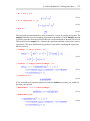
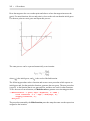
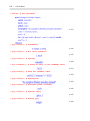
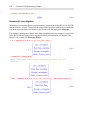
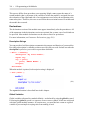
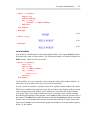
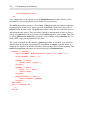
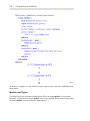
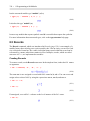
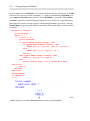
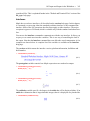
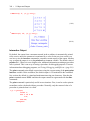
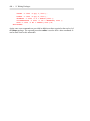
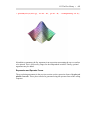
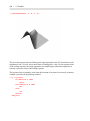
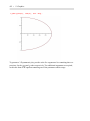
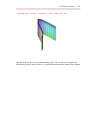
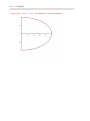
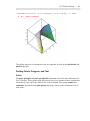
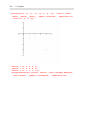
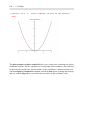
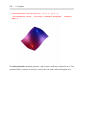
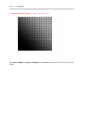
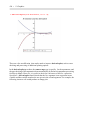
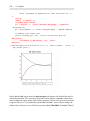
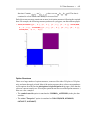
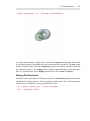
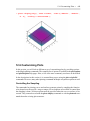
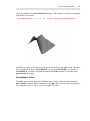
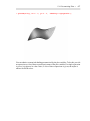
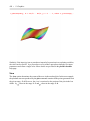
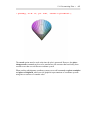
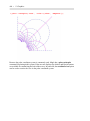
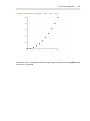
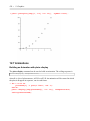
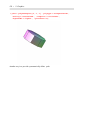
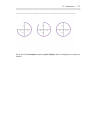
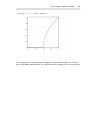
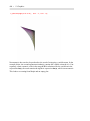
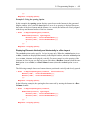
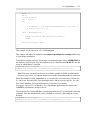
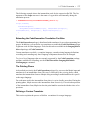
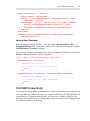
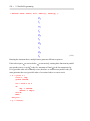
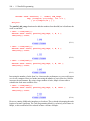
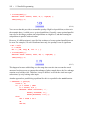
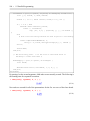
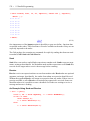
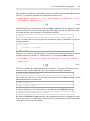
> plots[display]([p, pr], 'scaling'='constrained', 'axes'='boxed');
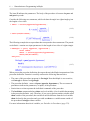
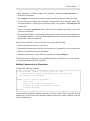
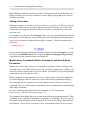
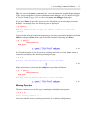
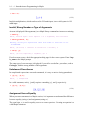
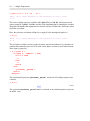
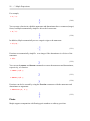
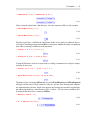
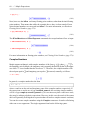
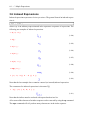
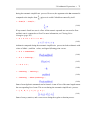
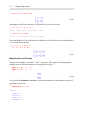
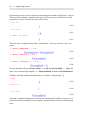
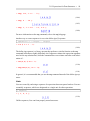
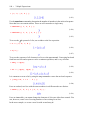
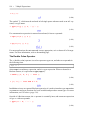
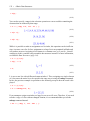
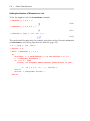
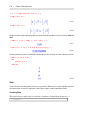
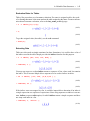
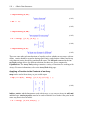
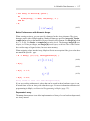
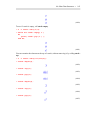
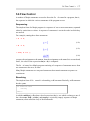
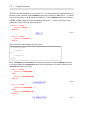
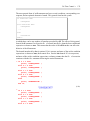
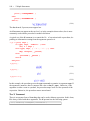
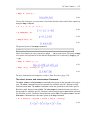
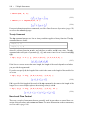
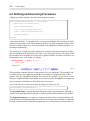
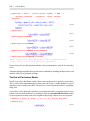
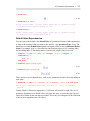
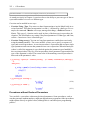
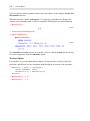
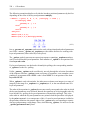
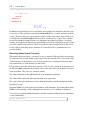
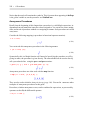
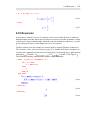
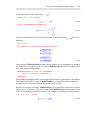
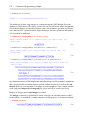
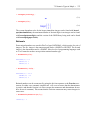
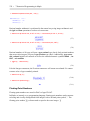
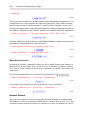
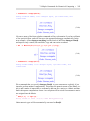
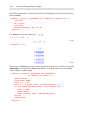
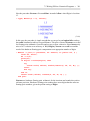
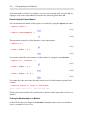
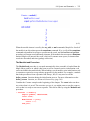
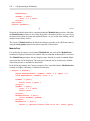
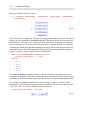
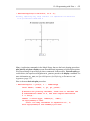
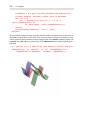
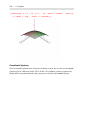
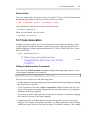
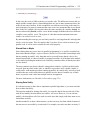
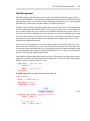
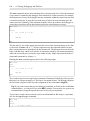
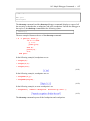
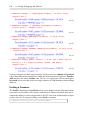
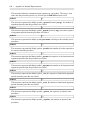
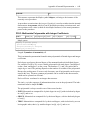
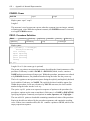
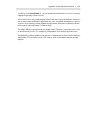
You can apply an arbitrary transformation to a 2-D or 3-D plot using the plottools:-transform command. To do this, defin a procedure f that represents a mapping from
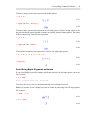
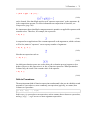
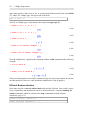
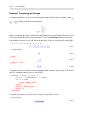
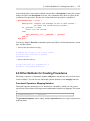
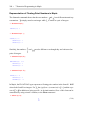
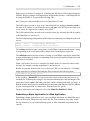
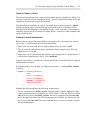
to
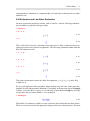
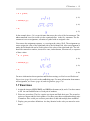
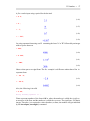
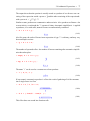
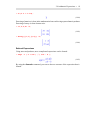
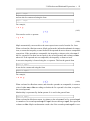
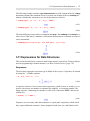
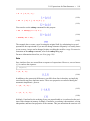
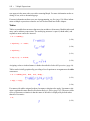
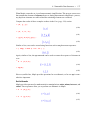
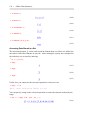
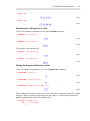
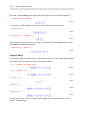
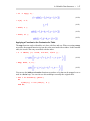
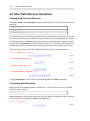
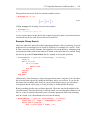
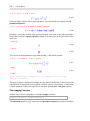
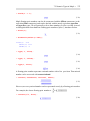
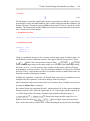
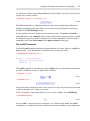
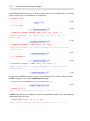
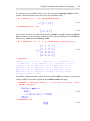
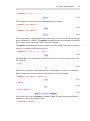
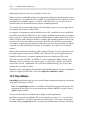
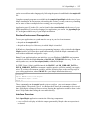
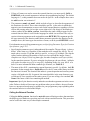
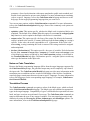
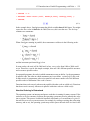
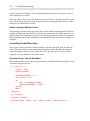
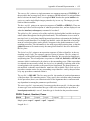
, where and can take values 2 or 3. The procedure must take as input arguments
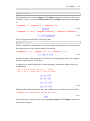
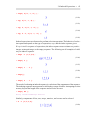
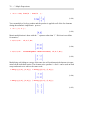
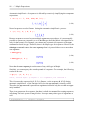
and return a list of components. If you pass f to the transform command, it returns a
procedure that takes a 2-D or 3-D plot data structure as its argument and returns a transformed
plot.
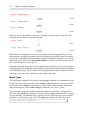
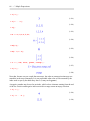
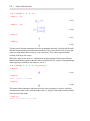
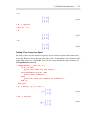
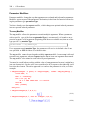
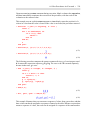
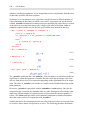
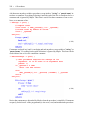
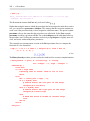
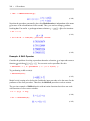
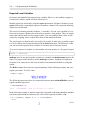
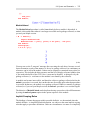
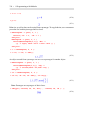
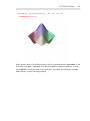
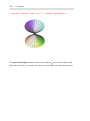
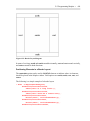
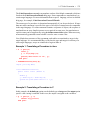
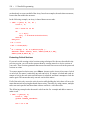
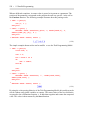
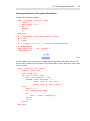
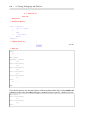
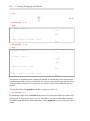
> p := plots:-contourplot(2*x^2+y^2, x=-3..3, y=-3..3, 'filled',
'coloring'=["Purple", "Teal"]):
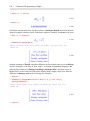
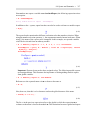
> f := (x, y)->[x, y, 0]:
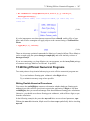
> tf := transform(f):