1
USAID FUNDED PROJECT FOR THE ECONOMIC COMMUNITY OF WEST AFRICAN STATES, ECOWAS,
AND THE WEST AFRICAN POWER POOL, WAPP, IN COLLABORATION WITH
THE ASSOCIATES FOR INTERNATIONAL RESOURCES AND DEVELOPMENT, AIRD
LONG-TERM ELECTRICITY
TRADE MODEL
GRAPHICAL USER INTERFACE
GUI VERSION 3.0
GUI DEVELOPERS
MANUAL
HOW TO USE THE POWERTOOLS V3 WITH AN
APPLICATION PROGRAMMING INTERFACE API
GEOFFREY M. GRANUM
SHIMON K. MODI
F. T. SPARROW
BRIAN H. BOWEN
PURDUE UNIVERSITY
SEPTEMBER 2004
LONG- TERM ELECTRICITY TRAD E MODEL, GRAPHICAL USER IN TERFACE V3
2
BACKGROUND AND INTRODUCTORY DOCUMENTS
The Purdue long-term electricity trade and capacity expansion model (LTETM) was developed
from 1996 to 2000 for the Southern African Power Pool, SAPP. During 2000 an initial graphical
user interface was written. From 2001 to 2003 an improved interface was developed for the West
African Power Pool, WAPP. Then in early 2003 the interface was totally restructured to allow for
increased and more sophisticated functionalities. In April 2004 the Version 3.0 of the interface, was
presented to the Economic Community of West African States, ECOWAS, at the Accra, Ghana
meeting of the WAPP delegations. Funding has been provided by the United States Agency for
International Development, USAID, to assist in training WAPP personnel and for giving support to
the West African electricity grid infrastructure development. The Version 3.0 of the interface was
part of a major training activity in collaboration with the WAPP Technical Working Group.
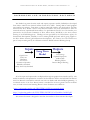
Inputs Long Term
Capital Costs
Fuel Costs
Heat Rates
Line Losses
Generation Capacities
Reliability Standards
Country Autonomy Standards
Model
Outputs
Cost Savings
Optimal Expansions
Trade Tariffs
Wheeling Effects
Reserve Margin Planning
All of the input and output results are displayed through the graphical user interface (GUI). The
model formulation and optimization constraints are described in detail in the LTETM User Manual.
This User Manual is intended for technical users who are familiar and with GAMS programming. A
condensed version of the User Manual, which is intended for the more general and non-technical
users, is found in the General Training Manual. These documents are available at:
https://engineering.purdue.edu/IIES/PPDG/SAPP/user-manual.whtml
https://engineering.purdue.edu/IIES/PPDG/MODEL/GenTrainMan-Oct2003.pdf
This current document is designed to introduce the interface to future technical developers.
LONG- TERM ELECTRICITY TRAD E MODEL, GRAPHICAL USER IN TERFACE V3
3
THE MULTI-NODE FUNCTIONALITY IN THE GUI VERSION 3 (GUI V3)
The structure of the GUI has been dramatically improved to allow extra modeling flexibility and
potential for future additional improvements. The most important new functionality with this
Version 3 is that it allows the general user to specify the number of nodes that are required to be in a
new model. Prior to the V3 the number of nodes was limited to 14. No more nodes could be added
or taken away. It was a “hard wired” parameter.
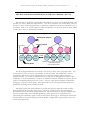
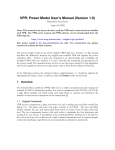
Long-Term Electricity Trade Model GUI Version 3.0
Sub-Regional Outputs
Country Outputs
Post Optimal
T
Urban
T
Rural
Utility Nodes
Utility
& IPP
Trade
T
West of
Country
T
East of
Country
T
Utility
Multiple nodes in a country can be defined for
(a) Geographic reasons
& (b) Ownership reasons
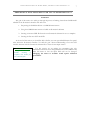
The above diagram illustrates the structure of the nodes, country nodes, and super nodes. Any
country with V3 can now have its’ own number of nodes specified. This means that a national
transmission grid can also now be represented by the long-term electricity trade and capacity
expansion model. If a country is represented by two nodes (say to distinguish between the urban
community or the rural community or between an industrial load and a residential load) then this can
easily be accomplished through this new version. The two nodes (blue in diagram) are defined as
belonging to a specific country (pink). Then super-nodes are the sub-regional nodes and are user
specified by allocating certain countries to them.
The initial request from the WAPP was to provide sub-regional output files which would be
Zone A and Zone B of the West Africa region. All Zone A countries are in the eastern half of
ECOWAS and Zone B countries in the western half. This functionality has been provided through
this new interface while at the same time permitting a much greater level of sophistication in
representing the transmission grids of each country and the whole region. International and national
transmission lines can now be represented in the models. Output files are generated for each node
and for each super-node.
LONG- TERM ELECTRICITY TRAD E MODEL, GRAPHICAL USER IN TERFACE V3
4
WHAT YOU NEED TO KNOW BEFOREHAND
GENERAL INFORMATION
Within this document are tutorials for the advanced user; a pseudo-developer if you will. The
tutorials do not in general assume that the reader will be modifying the Java source code. One
tutorial covers the creation of new output files. Another covers the modification of allowable input
ranges for individual fields, etc. The tutorials aim to allow the dedicated user to utilize the advanced
capabilities inherent in PowerTools V3. In addition, tips, code hints and thoughts on where
improvements could be made are included as comments by the authors.
Potential developers must obviously understand in depth how these ‘advanced user’ tools work
before modifying their functionality. The hope is that this document will provide the required
stepping blocks, allowing a potential developer to begin to understand the underlying structure
enough to grasp the comments which are included in the code itself. However, a warning: it is
unlikely that Purdue will be able to supply a developer with significant skill to make any serious
modifications to this program. Expect a year of ‘training’ at minimum – that year should not be
wasted, much useful work could be done while learning the code itself.
The current interface for the Purdue power modeling, PowerTools v3, has been developed
using a number of different tools. As much as possible those tools were kept segregated: before
jumping in you must be certain that you have at least a basic understanding of all of them, and a
significant talent in one or more.
PowerTools v3 utilizes XML and Java as the primary skill sets. While an individual working on
the XML side would not need to have a significant depth of knowledge of Java, the converse is not
true; any Java developer who intends to alter the functionality (as opposed to the ‘look and feel’) of
the interface absolutely MUST have a detailed understanding of XML structure. Even things which might
seem completely unrelated to XML – such as many of the input screens – are completely defined
within the Schema and created automatically at runtime. Don’t play with the code until you
understand the Schema and XML structure.
Efforts have been made herein to make walkthroughs that give a dedicated individual (perhaps a
grad student with some computer knowledge) to make changes to the model itself; DO NOT take
these walkthroughs as lessons in modifying the underlying code. They are not – they are simply
instructions on utilizing the extremely powerful underlying Java engine, as well as a helpful glimpse
into its inner workings.
THE XML DEVELOPMENT SIDE
A user who intends only to modify the XML side of the code could be quite busy in their own
right. One could design an entirely new power model using XML programming alone; output files
and all.
Modifying the Schema and creating new XML files which implement said Schemas requires only
knowledge of the GAMS model which is being targeted, an intermediate knowledge of XML
programming, and of course the syntax which we developers used when creating the interface in the
first place. The ability to program in Java is not required, nor would it even help significantly.
LONG- TERM ELECTRICITY TRAD E MODEL, GRAPHICAL USER IN TERFACE V3
5
THE JAVA DEVELOPMENT SIDE
Sadly, the converse is not true. The Java developer must have at minimum a basic understanding
of how to develop in XML. In particular, any Java developer must understand how a Schema works
with relation to its children XML files.
The potential Java developer should know all about Listeners in all of their glory. Line-by-Line
debugging should be a mastered art. Recursion is used heavily in places – think 1000 lines with 10
possible exit/re-entry points with 20 or more levels. They should know how to use casting,
inheritance, superclasses, subclasses, how static variables work, the string libraries, regular expression
usage in Java, and much, much more. The most important thing to know is that the developer will
simply not know every thing they need to know; they need to know how to find it. The Java Tutorial
site is where the authors acquired most of their own knowledge.
The most difficult part of the code is that which utilizes the Xerces libraries. Xerces is an opensource package which is utilized by the PowerTools code to handle the XML parsing and writing.
Being extremely powerful, it is also very complex. Expect a high learning curve if the code base
which relies on the Xerces class needs to be modified. It shouldn’t need any significant changes. In
the event that it does need changes, help will be found in the Xerces newsgroups most readily. Code
comments may provide helpful hints, but will certainly not be enough to provide an understanding of
the depth of capabilities provided by the Xerces package.
A LITTLE MORE
The amount of change that can be made without actually touching the Java code could keep a
single person busy for months. Everything from minor changes in input-value descriptions, to
completely new output file generation, to major changes in the GAMS code can be handled without
modifying the Java source.
LONG- TERM ELECTRICITY TRAD E MODEL, GRAPHICAL USER IN TERFACE V3
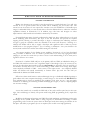
THE HEIRARCHY
PowerTools has five major development components:
1. GAMS. The GAMS model itself.
2. GAMS Schema: The Schema which describes a GAMS model; essentially the
GAMS model translated into XML.
3. PowerTools Schema: The Schema which describes the interface. This can be
thought of as a ‘map’ of the GAMS model into some semblance of order; the
GAMS code and the GAMS Schema model are “flat” whereas the PowerTools
Schema is a ‘tree’ structure, much like a filing system. Every effort was made to
create logical groups and structures
4. Java Interface: This is what you see when you “run” PowerTools v3. The Java code
interprets whatever PowerTools Schema is attached to the opened model file.
5. Output Definition Files: There is an embedded scripting engine in the PowerTools
package which allows for automatic creation of customized output files. Any file
placed within the ‘output’ directory will be parsed after every successful model run.
If proper commands are utilized the new file will be added to a user-defined
position on the output menu within the interfaces itself, and will be opened using
the default internet web browser.
6
LONG- TERM ELECTRICITY TRAD E MODEL, GRAPHICAL USER IN TERFACE V3
7
PREPARING A NEW GAMS MOEL FOR USE IN POWERTOOLS V3
OVERVIEW
The goal of this section is to walk you through the process of making a brand new GAMS model
editable via the PowerTools interface. We will cover:
1. Pre-parsing the GAMS model into a GAMS Schema instance
2. Using the GAMS Schema instance to build our PowerTools Schema.
3. Creating an instance XML file from the new PowerTools Schema for use as a template
4. Creating the first new GUI model file.
At the end of this section you should be able to define your own specialized Schemas for special
tasks within the PowerTools interface. You will also gain a better understanding of how the GUI
interface interacts with the PowerTools Schema file to create the user input screens.
*Add Documentation
Update this section to
include
creating
a
complete new model for
use in the interface.
For this exercise we are making the assumption that only
mathematical functions have changed within the new GAMS model;
what this means is that the input fields will not be changed.
Changing the names of variables would require additional
procedures!
LONG- TERM ELECTRICITY TRAD E MODEL, GRAPHICAL USER IN TERFACE V3
8
GETTING STARTED
*Todo Item
This should be turned
into a plug-in for the GUI
interface
To complete this task you will need access to the Java source
code. Open the java file:
gamstools.parse.modelbuilder
Within this file is a static void method titled ‘testCase_1.’ Code follows with descriptions:
public static void testCase_1() {
File gamsFile = new File("C:/Dev/wapp-IPP-dec29-2003/NewModel.GMS");
File xmlFile = new File("C:/Dev/wapp-IPP-dec29-2003/model.xml");
CreateSchemaFromGAMS test1 = new CreateSchemaFromGAMS(gamsFile, xmlFile);
gamsFile = new File("C:/Dev/wapp-IPP-dec29-2003/testModel.GMS");
CreateGAMsFromSchema gmsSchema = new CreateGAMsFromSchema(xmlFile);
gmsSchema.start();
GamsModel model = null;
try {
while (gmsSchema.isAlive()) {
Thread.currentThread().sleep(100);
}
model = gmsSchema.getModel();
}
catch (InterruptedException ex) {
ex.printStackTrace();
}
}
The first line of interest is the declaration of the File object ‘gamsFile’:
File gamsFile = new File("C:/Dev/wapp-IPP-dec29-2003/NewModel.GMS");
‘gamsFile’ defines the location of the new GAMS model – the actual mathematical model which
will be run to find an optimal solution. There are a few limitations on syntax for the GAMS file itself:
•
DO NOT USE BLOCK COMMENTS! The ability to handle them has not been
implemented.
•
Try to avoid declaring multiple variables on the same command: use
“SET bob;”
”SET sally;”
and NOT
”SETS bob, sally;”
•
Use one kind of inline comment and STICK WITH IT. Consistency is your friend. The
converter will handle any inline comment declared with the $inlinecom { } function, as
well as double quotes (“comment”). This is just a suggestion, but if you ignore it and have
errors this may be part of it.
•
It is worth pointing out that the parser does NOT require you to flatten the GAMS
model into a single file. The $include function will suffice.
LONG- TERM ELECTRICITY TRAD E MODEL, GRAPHICAL USER IN TERFACE V3
9
Aside from the block comments aspect, these are not desperately important; 99% of the GAMS
syntax was handled when the converted was developed, however there may be situations where you
have to adjust the GAMS code to accommodate the parser.
In order to run parse this new GAMS model, point the path of gamsFile to point to wherever
your new model is. It is suggested to place a copy of the new model in a convenient location.
The following line determines where the new XML file will be written to:
File xmlFile = new File("C:/Dev/wapp-IPP-dec29-2003/model.xml");
It would be easiest for you if you just point this file to save itself into the same directory you copied
the GAMS model file into.
Now we create the object which will do all the work:
CreateSchemaFromGAMS test1 = new CreateSchemaFromGAMS(gamsFile, xmlFile);
You can explore how this works if you desire. The net effect is that an XML representation of the
GAMS model file is created. This allows us to use the Xerces tools to read all the data, edit it, and
save it back to the XML file without having to write an insane amount of Java code to handle all of
this.
The next line re-uses the gamsFile object to create a new file. This file is simply a comparison, a test
case. It will be a GAMS model representation of the XML file we created.
gamsFile = new File("C:/Dev/wapp-IPP-dec29-2003/testModel.GMS");
We use this new file object with the now populated XML file to create our verification file:
CreateGAMsFromSchema gmsSchema = new CreateGAMsFromSchema(xmlFile);
gmsSchema.start();
GamsModel model = null;
while (gmsSchema.isAlive()) {
Thread.currentThread().sleep(100);
}
model = gmsSchema.getModel();
If you haven’t guessed at this point, CreateGAMsFromSchema extends java.lang.Thread. Passing
in the xmlFile object to the constructor then calling start() will cause the Thread to begin running;
since we want the GamsModel object to be populated before the function dies, we must keep
looping and checking until we know that the thread has ‘died’ (once a threads ‘run’ method has
exhausted it is considered dead). Once the thread is dead we grab the model object.
An astute observer will at this point notice that nothing is done with the model after creating it.
If you are making only minor changes to the existing GAMS model file this should be fine. For
advanced or for large amounts of changes you should certainly create a file to verify that everything is
working correctly. You will need to add the following lines of code to this function to do so:
FileWriter out = new FileWriter(gamsFile);
out.write(model.toXML(gamsFile));
You will also have to change the catch block to handle the potential IOException.
LONG- TERM ELECTRICITY TRAD E MODEL, GRAPHICAL USER IN TERFACE V3
10
Now make sure that this method is what is being called in the main function of this class, and
run it. When the run is complete you will see your new XML file has been created (hopefully!)
wherever it was that you told the function to write the file to. This is the point at which you will want
to compare the input GMS file to the flattened version which was created by our last step above,
assuming you added the code to create it.
Once you have verified the model, or if you have only made minor changes such as modifying a
mathematical function, you are ready use the new XML file in the PowerTools interface. Point
windows explorer to:
{powertoolsv3}\resources\gamsModels\
You will see that there is already at least one XML file in this directory. Copy your new XML file
into this directory. If you are supremely confident that it is correct, and you want all existing PT3
models to use this new GAMS model, by all means overwrite the existing file. If you would like to
test it first, simply make sure it has a different name than the current file.
IMPORTANT: If you overwrite the existing file in this directory all existing PT3 models will run
using your new mathematical model.
IMPORTANT: You are free to have multiple mathematical models stored in this directory. Each
PT3 model references one of the files in this directory when you select ‘Run’ from the PT3 interface.
The mathematical model which is used may be selected by the user from within the PT3 interface.
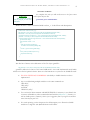
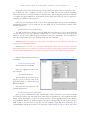
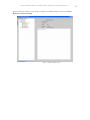
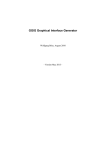
Open the PT3 interface and create a
new model
(File Æ new Æ Empty Model)
Name the model ‘TestModel’
Select the uppermost item in the
tree structure:
“PowerModel: TestModel”
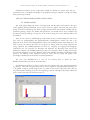
This will bring up the main screen
(Figure 1). Look to the last item on the
right-pane: There is a button titled ‘Set
Reference Model”
Select this button and browse to the
gamsModels directory:
Figure 1
{powertoolsv3}\resources\gamsModels\
Select your new mathematical model and click ‘OK’. Add a few items to your new PT3 model
and then save and run the new model from within PT3. Congratulations, you’ve updated the math
engine for this PT3 model! To force all existing models to use this GAMS model, browse back to
the gamsModels directory in windows explorer, backup the existing XML file and rename your new
XML model to the same name as the old one had (probably “wapp-IPP-dec29-2003.xml”). It is
recommended avoiding this however, as it will create confusion later: how do you know that a user
LONG- TERM ELECTRICITY TRAD E MODEL, GRAPHICAL USER IN TERFACE V3
*Todo
The PT3 interface has some ugly
issues with ‘Set Reference Model.”
For one thing, there is no safety
check: the interface assumes that the
reference model field is always valid,
and does not inform the user if it is
not. Hence, the directions to the right
are not quite right.
Also, it is literally ugly: the
button text is cut off, the description
field is simply a copy of the text Field,
etc. Soooo…..
1. Make the PT3 interface pretty
2. Check for the existence of the
reference file, warn user if not valid
3. Make the file browser pop up in
the
correct
directory
({powertoosv3}/resources/gamsMod
els)
11
has the most up-to-date mathematical model stored in
the gamsModels directory? If you e-mail a new PT3 model
after updating your mathematical model and have simply
overwritten your old XML file the user will be able to run
the model you sent them without trouble; except you and
they will have different outputs! Instead, if it is worth
updating the math, it is worth updating your files. If there
was an error in the old mathematical model then DELETE
the XML file which exists within the gamsModels directory
and place your new XML file in there with a different name.
This will FORCE you to update the ‘reference model’ field
via the ‘Set Reference Model” button on every model, as the
program will crash out when you attempt to run it with the
old reference model, which no longer exists. Then when you
e-mail the file to a user that does not have the new
mathematical model the will not be able to run your PT3
model until they get updated reference models from you.
LONG- TERM ELECTRICITY TRAD E MODEL, GRAPHICAL USER IN TERFACE V3
12
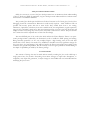
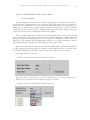
THE JAVA DEVELOPMENT SIDE: OUTPUT MENU
The entire PowerTools V3 interface runs on the XML schema; except for the following menu
items under the Output menu (they are also shown in the figure):
•
Maps
•
Trade Graphs
•
Cost Graphs
•
Cost Summary
•
Capacity Summary
A developer wanting to modify any of the above mentioned menu items will require in-depth
knowledge of java swing; in particular the Graphics package. The intention was to make the entire
Output menu XML schema driven, and it should be an ongoing project for anyone wanting to pick
up the trail. The following part of the document will focus on giving an in-depth explanation of the
java code which generates all of the above mentioned menu items, so that if someone wants to make
it XML schema base, they have an understanding of the underlying structure. Each of the above
mentioned menu items will be discussed in the following sub sections.
LONG- TERM ELECTRICITY TRAD E MODEL, GRAPHICAL USER IN TERFACE V3
13
THE JAVA DEVELOPMENT SIDE: OUTPUT MENU
Æ MAPS
The starting point for maps is the method
void jmnu_Output_Map_actionPerformed(ActionEvent e) found in XMLDevFrame.java in the
PowerTools V3 package. The code for showing maps consists of two different parts:
1. MapPane
The MapPane, shown in the adjoining figure.
The main purpose of the MapPane is to show all
the different technology types grouped by a
common characteristic.
A datatype called MapData is created, which
populates a vector and groups all the different
technology types according to the common
characteristic. If you look at MapData.java, you
will see that objects of the type MapDataType
are hard coded and filled with the required data.
The required data is the common category type,
text to be displayed, the respective GAMS
parameter, unit type, the type of point to be
drawn on the map.
This is the first place that an XML structure can
be introduced in the Maps output menu.
2. MapLabelPanel
The MapLabelPanel is the panel onto which the map.jpg is pasted. A LayeredPanel is used to
paste the MapLabelPanel onto it. A GlassPane is used to draw the graphics and layered on top of the
MapLabelPanel, using the LayeredPanel.
LONG- TERM ELECTRICITY TRAD E MODEL, GRAPHICAL USER IN TERFACE V3
14
GlassPane.java defines all the components needed for drawing the power units and the
transmission lines. An indepth knowledge of the graphics package is required to modify the Maps
menu, please keep in mind.
THE JAVA DEVELOPMENT SIDE: OUTPUT MENU
Æ TRADE GRAPHS
The trade graphs display bar charts of Energy Trade and Revenues and Payments. The open
source graphing package JFreeChart 9.16 is used to create the graphs. Currently, this open source
project is hosted on sourceforge.net. There is ample documentation and examples available with the
installation package. Anyone not familiar with JFreeChart 9.16 should refer to these examples and
documents before proceeding to change any of the code. Focusing only on the BarChart demos will
be sufficient.
There are two vectors in TradeGraph.java which hold the key to understanding the code in this
class. They are jCmbTypeData and jCmbTypeParam. jCmbTypeData contains the data to be
displayed on the screen and jCmbTypeParam contains the GAMS parameter name which has to be
used to extract the relevant data. The two categories for Energy Trade are: energy exported and
energy imported. The GAMS parameters for these two categories are expgenzp and impgenzp
respectively. The two categories for Revenues and Payments are: Revenues from exports and
Payments for imports. The GAMS parameter for these two categories is Profj. It might seem strange
that the same parameter can give two different values. This particular parameter gives different values
based on the ordering of the arguments. Please be aware that any change will require some
knowledge of GAMS, the model and the concerned parameters.
The java class BuildChart.java is sent all the relevant data to build the chart.
BuildChart.createChart() creates the actual bar chart.
GamsParameter.getValue() is used to retrieve the value required. For a two argument parameter
e.g. abc(z,ty) where abc is the parameter and z,ty are the arguments, GamsParameter.getValue() has
to be passed a string in the following format : z.ty, where z denotes the node name and ty denotes
the period number. Studying the code at the beginning of the file will help the developer understand
how to retrieve the period set and the country set.
LONG- TERM ELECTRICITY TRAD E MODEL, GRAPHICAL USER IN TERFACE V3
15
THE JAVA DEVELOPMENT SIDE: OUTPUT MENU
Æ COST GRAPHS
The Cost Graphs have been created to provide a quick glimpse at the differences in costs for a
particular node in a particular period or over the entire horizon. This allows the user of interface to
get an idea of the proportion of costs which looking at the specific figures in the output files. Cost
Graphs also use JFreeChart 9.16 graphics package available at sourceforge.net. Anyone not familiar
with JFreeChart 9.16 should refer to these examples and documents before proceeding to change any
of the code. Focusing only on the BarChart demos will be sufficient.
The Cost Graphs display costs of 8 different types: Fixed O&M, Fuel Costs, Generation Capital
Costs, Transmission Capital Costs, Unserved Energy, Unserved MegaWatts, Variable O&M and
Water Costs. Just like the TradeGraphs, there are two vectors in CostGraphs.java which contain the
display data and parameter data. JCmbTypeData contains all the display information, whereas
JCmbTypeParam contains the parameter data required to extract all the values.
When the Generate Button is pressed on the interface, jBtnGenerate_actionPerformed method
is called. Tracing the code from that point will lead to a better understanding of the how the values
are extracted. BuildChart.java is called to create the chart once the dataset has been created.
CostGraphs works in two modes:
1. When a node is selected and a period number is selected.
This option will not allow the user to select a particular type of cost type. Instead, all the
different cost types will be shown as separate categories on the chart.
2. When a node is selected and Entire Horizon is selected.
LONG- TERM ELECTRICITY TRAD E MODEL, GRAPHICAL USER IN TERFACE V3
16
This option allows the user to select a particular type of cost. When the graph is generated
using this option, the bar’s in the bar chart will denote value for each period separately.
getSum(String,String) method is backbone of the entire class. This method calculates the value
for a particular parameter, either for the entire horizon or that particular period. If the numbers
being displayed on the graph do not look right, this method is the first place to start looking.
As discussed in Trade Graphs section, to extract a value of any parameter, string in the following
format has to be constructed: a.b.c for three arguments, or a.b for two arguments.
GamsParamete.getParam() queries a flattened hashtable, instead of a three level or a two level
nested hashtable.
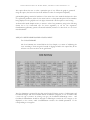
THE JAVA DEVELOPMENT SIDE: OUTPUT MENU
Æ COST SUMMARY
The Cost Summary was created before the Cost Graphs, as a means of tabulating the
costs according to their categories. Instead of digging around in the output files, all the
relevant costs are now shown in the grid format.
The Cost Summary is powered by the data stored in the following vectors : CostDataType and
CostDataTotalType. The class CostData defines the different categories of cost. In order to add
a new cost type or remove an existing cost type, the CostData.CostDataType vector and
CostData.CostDataParam should be changed. CostDataType contains the cost category to be
displayed on the screen, while CostDataParam contains the GAMS parameters of the
corresponding cost categories.
LONG- TERM ELECTRICITY TRAD E MODEL, GRAPHICAL USER IN TERFACE V3
17
Since a grid format was required to show the data, a 2 dimensional array was used to store the
data. CostSummary.summary, which is the 2 dimensional array which holds all the data. After
populating the summary array, CostSummary.populateFromArray() method is called. This
method cycles through all the cells in summary array and pastes the values onto JTextFields and
JLabels, so that the data is shown in a tabular format on the screen. The vertical and horizontal
positioning of the cells is hard coded at the moment. The hard coded values were used to ensure
maximum utilization of the Panel space.
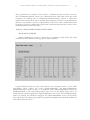
THE JAVA DEVELOPMENT SIDE: OUTPUT MENU
Æ CAPACITY SUMMARY
Capacity Summary was created to emulate the Cost Summary output format, but would
instead show all the different technology types and their capacities.
Capacity Summary follows the same code structure as Cost Summary. There is a class called
CapacityData, which contains two vectors expanasionDataType and expansionDataParam.
expansionDataType contains the data to be displayed, while expansionDataParam contains the
GAMS parameters of the corresponding capacity types. If any of the display names need to be
changed, they should be changed in the expansionDataType vector. If any of the GAMS parameters
need to be changed, they should be changed in the expansionDataParam vector. Care should be
taken that when a new capacity type is added, the parameter and display name should be added at the
same index in both the vectors.
LONG- TERM ELECTRICITY TRAD E MODEL, GRAPHICAL USER IN TERFACE V3
18
CapacitySummary has a 2 dimensional array which contains all the calculated values and the
display names. This array is declared with a variable name summary. The method
CapacitySummary.populateFromArray() is used to create the visual, tabular structure from the
summary array.
LONG- TERM ELECTRICITY TRAD E MODEL, GRAPHICAL USER IN TERFACE V3
19
T U TO R I A L - Q U I C K S TA RT G U I D E
This tutorial will walk you through:
1.)
2.)
3.)
4.)
5.)
Opening PowerTools v3.
Creating a new model utilizing the template utility.
Modifying the template slightly
Running the modified model
Viewing the results in your default web browser
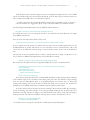
Step 1.) Double Click on the PowerTools v3 Icon on your desktop. It should look like Error!
Reference source not found., below.
Figure 2
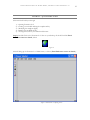
This will bring up the PowerTools v3 Main Screen, as below (Error! Reference source not found.).
Figure 3: PowerTools v3 Opening Screen
LONG- TERM ELECTRICITY TRAD E MODEL, GRAPHICAL USER IN TERFACE V3
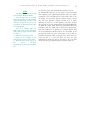
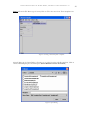
Step 2.) From the File Menu (top of screen) Click on ‘File’ then ‘new’ then ‘From Template’ See
Figure 4: Creating a new model from a Template
This will bring up the ‘Open Dialog’, allowing you to select from the available templates. Click on
‘2node-wIPP.template.pt3’ and then ‘Open’ (Error! Reference source not found.).
Figure 5: Open Dialog
20
LONG- TERM ELECTRICITY TRAD E MODEL, GRAPHICAL USER IN TERFACE V3
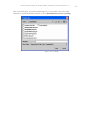
Once the model is open, the interface will prompt you to save it under a new name. Enter
‘quickstart’ in the File Name field and click on ‘Save’ (Error! Reference source not found.).
Figure 6: Save As Dialog
21
LONG- TERM ELECTRICITY TRAD E MODEL, GRAPHICAL USER IN TERFACE V3
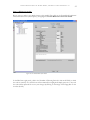
This will bring the model into edit mode, and display the Model Summary screen as in Error!
Reference source not found.:
Figure 7: Model Summary Screen
22
LONG- TERM ELECTRICITY TRAD E MODEL, GRAPHICAL USER IN TERFACE V3
23
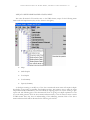
Step 3.) Editing the model.
We are going to make a very simple change to this model. First, click on the ‘PowerModel: quickstart’
folder in the Tree Pane (the left panel), as highlighted in Error! Reference source not found..
Figure 8: The Main Model Edit Panel
In the Edit Pane (right panel), click in the ‘Number of Planning Periods in this model’ field, in which
the value is currently ‘10’. The full text will automatically be highlighted. Simply press the ‘5’ key and
the value will be replaced. Now save your changes by clicking on the image of the floppy disk on the
icon bar (far left).
LONG- TERM ELECTRICITY TRAD E MODEL, GRAPHICAL USER IN TERFACE V3
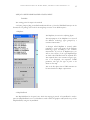
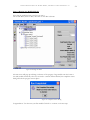
Step 4.) Running the Modified Model.
Now that the model has been saved, we can run it.
On the File Menu, click on ‘Run’, then click on the ‘Run’ sub-item.
Figure 9: Running the Model
The run screen will pop up and keep you abreast of the progress. Large models can take hours to
run. This model should only take a few seconds to a minute. When finished, the completion status
dialog will take the progress screens place:
Figure 10: Completion Status Dialog
Congratulations. You have run your first model. Click ‘Ok’ to continue to the next step.
24
LONG- TERM ELECTRICITY TRAD E MODEL, GRAPHICAL USER IN TERFACE V3
25
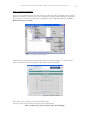
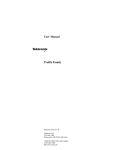
Step 5.) Viewing the Output.
Now to see your results: back on the main screen you will notice that the ‘Output’ item on the File
Menu is now enabled – because now we have output data, whereas before running the model there
was nothing to see. Click on ‘Output’ then ‘Output Files’ then on ‘Model Summary’ (see Error!
Reference source not found.).
Figure 11: Opening the model summary
This will open your default browser (probably Microsoft’s Internet Explorer tm). The screenshot
below is from the Opera internet browser, but will be functionally similar:
Figure 12: The Model summary
Now you just have to figure out what the numbers mean!
Feel free to play with the other output items in the Output menu.
This concludes the quick start guide. Have fun modeling!