1
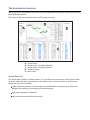
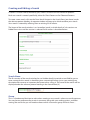
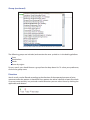
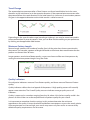
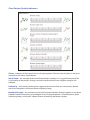
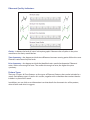
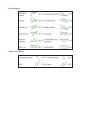
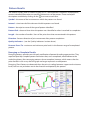
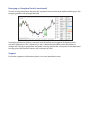
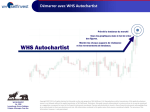
User Manual
Index
____________________________________________________
Introduction
Accessing Autochartist
Page 3
The Autochartist Interface
Search Pane
Page 4
The Autochartist Interface (continued)
Results Pane – Completed Patterns
Results Pane – Emerging Patterns
Pattern Display
Alerts Pane
Page 5
Creating and Editing a Search
Search Name
Group
Page 6
Page 7
Group (continued)
Direction
Trend Change
Minimum Pattern Length
Quality Indicators
Page 8
Chart Pattern Quality Indicators
Page 9
Fibonacci Quality Indicators
Pattern Types
Page 10
Pattern Types (continued)
Chart Patterns
Fibonacci Patterns
Page 11
Pattern Results
Emerging vs Complete Results
Page 12
Page 13
Emerging vs Complete Results (continued)
Support
Introduction
Autochartist is a chart pattern identification tool that scans various markets and instrument types
for known chart pattern formations such as triangles, wedges, head-and-shoulders and channels.
Fibonacci retracements, extensions, ABCD-, Gartley- and butterfly patterns are also identified by
Autochartist throughout the trading day.
Patterns are distributed to you in real time via a web interface. This manual gives an overview of
how to use the web interface.
Accessing Autochartist
To access Autochartist click on the Tools button on the top right of the dealing platform, and select
the Autochartist service from the menu. You will be automatically logged into the Autochartist web
interface, which will open in a separate window.
The Autochartist Interface
When you access Autochartist for the first time, the application will display information that has
been loaded by default.
The layout of the web interface consists of five separate areas:
A – Search Pane
B – Results Pane - Completed Patterns
C – Results Pane - Emerging Patterns
D – Pattern Display
E – Alerts Pane
Search Pane (A)
The search pane contains a default search. This is based on the instruments which you are able
to access when you log in to Autochartist for the first time. A search contains a set of criteria
defined by you, and it specifies:
where to look for patterns, by choosing from a predefined list of groupings (symbols are
grouped, for example, by exchange or instrument type).
what types of patterns to look for.
other criteria that can further filter results.
All searches are listed in the Search Pane.However the information shown in the Results Panes
only pertains to the highlighted search.
An existing search can be edited by clicking on the pencil icon ( ), or deleted by clicking on the
dustbin icon ( ). Please refer to the ’Creating and Editing a Search‘ section below for details on
creating or editing a search.
Results Pane - Completed Patterns (B)
This pane lists all completed patterns identified for the selected search (highlighted in the Search
Pane, A). A Chart Pattern is defined as being completed when the price has broken through the
identified support or resistance level. A Fibonacci Pattern has completed when its final turning
point adheres to the predefined criteria for that pattern.
Results are ordered chronologically by default, but you can also sort results by clicking on any of
the column headers.
Results Pane - Emerging Patterns (C)
This pane lists all emerging patterns identified for the selected search (highlighted in the Search
Pane, A). A pattern is defined as emerging if it has not yet fulfilled the criteria to be regarded as
complete. These patterns provide a useful early indication of potential trading opportunities.
Results are ordered chronologically by default, but you can also sort results by clicking on any of
the column headers.
See ’Emerging vs Complete results‘ below for a fuller explanation of the difference between
completed and emerging patterns.
Pattern Display (D)
The price graph and illustrated pattern displayed in this pane represent the result that was
selected in one of the Results Panes (B or C).
The columns to the right of the price graph contain additional information about the pattern,
such as time found, pattern quality, pattern length and forecast region. For more information see
’Pattern Results’.
Alerts Pane (E)
This pane provides a listing of new patterns as they are identified. It spans all your defined
searches, including those that are not currently in view.
When new patterns are found, the light bulb icon lights up and a list of searches containing the
new pattern results are displayed underneath. When you click on an alert, you are redirected to
the relevant search results. Alerts are cleared from this pane periodically as automatic updates
occur.
The alerts mechanism also provides an audio signal that can be activated to keep you updated
even when the Autochartist application window is not visible. To switch the audio alert on and
off, click on the speaker icon ( ) next to the light bulb.
Creating and Editing a Search
A search is a set of criteria, defined by you, which is used to scan the market for patterns.
Each new search is created specifically, either for Chart Patterns or for Fibonacci Patterns.
To create a new search, click on the ’New Search‘ button in the Search Pane (see above) under
the relevant pattern heading. A separate window will pop up in which to define your search.
Your search is created by selecting from an existing list of criteria.
The layout of the search window is an ’accordion‘ panel, in which details of sub sections are
hidden from view until the section is selected. Each section is described below.
Search Name
The first section of the search window has no hidden details.It provides a text field for you to
enter a name for the search. It should be given a meaningful name, just as you would give a
descriptive file name to an important document when saving it. The name of the search will be
displayed under the relevant pattern heading in the Search Pane (A).
Group
This is a fundamental decision to make when creating a new search is where to scan for patterns.
You may have a preference for certain instruments that guide your trading actions, and after
naming the search the you will need to choose which instrument group will be its focus. .
Group (continued)
The following groups are included, and contain the same symbols as in the dealing platform:
Forex
Stock indices
Metals
Shares by region
For any search, you should choose a group from the drop-down list. To select your preference,
click on the group name.
Direction
Search results can be filtered according to the direction of the expected outcome of price
movement after the pattern is identified. Every pattern has either a bullish or bearish outlook.
If you are interested only in a particular market direction you can select it here by clicking the
applicable radio button.
Trend Change
The expected price movement after a Chart Pattern was found would either be in the same
direction as the initial trend, or in the opposite direction. If the expected price movement after
the pattern follows the same direction as the initial trend it is a known as a continuation pattern.
If it goes in the opposite direction to the initial trend it is called a reversal.
Depending on the type of market stage (trending or sideways) you may be more interested in
either continuation or reversal patterns. Here you can filter these according to your preference
by clicking on the applicable radio button.
Minimum Pattern Length
Pattern length specifies the number of candles (bars) of the price chart that are contained in
the pattern. For example, a pattern of length 30 found on 60 minute data would mean that the
pattern was formed over 30 hours.
Longer patterns tend to be of better quality, so you can choose to filter out short patterns by
setting the minimum pattern length using the slider.
Quality Indicators
Four objective indicators measure Chart Pattern quality, and three measure Fibonacci Pattern
quality.
Quality indicators reflect the visual appeal of the pattern. A high quality pattern will naturally
appear more attractive. The Overall Quality measure indicates average quality across all
indicators.
Quality is expressed as a number ranging from 0 to 10, where 10 is the best quality and 0 is the
poorest. Use the sliders to set the required levels of pattern quality for your search.
It is important to remember that the settings in this section determine the minimum
requirements for quality. A lower threshold would allow more patterns to pass the search criteria.
If the requirements are set too high, your search may return very few results or none at all. By
default all quality requirements are set to zero.
Chart Pattern Quality Indicators:
Clarity – indicates of the level of ’noise‘ in the price graph. If there are lots of spikes in the price
movements the clarity would be low.
Initial Trend – the strength of the trend that precedes a pattern is a very good measure of the
visual quality of the pattern. A long, consistent initial trend will have a higher rating for this
indicator.
Uniformity – if the points touching the support and resistance lines are more evenly spaced
over time, the pattern will have a better uniformity rating.
Breakout Strength – the momentum with which the price breaks through support or resistance
indicates breach of a previous psychological level. Stronger breakout is a reinforcement of the
underlying theory, and signals a better chance of reaching the forecast region.
Fibonacci Quality Indicators:
Clarity – indicates the level of ’noise‘ in the price graph. If there are lots of spikes in the price
movements the clarity would be low.
Time Symmetry – the degree to which time differences between turning points follow the same
Fibonacci ratios found in price levels.
Price Symmetry – the degree to which the identified ratios match the theoretical Fibonacci
ratios, within some margin of error. The smaller the margin of error, the higher the price
symmetry.
Pattern Types
There are 16 types of Chart Patterns or four types of Fibonacci Patterns that can be included in a
search. Each pattern type is listed in this section, together with a checkbox that can be ticked to
include it as part of the search.
In addition, you can click on an information icon that details the characteristics of the pattern,
when it forms and what it suggests.
Chart Patterns:
Fibonacci Patterns:
Pattern Results
The Pattern Display (refer to ’Pattern Display (D)’ in ’The Autochartist Interface‘ section above)
contains detailed information on specific characteristics of the pattern. There are helpful
descriptions available by clicking on the icon next to each item.
Symbol – the name of the instrument on which the pattern was found.
Interval – time interval of the data on which the pattern was found.
Pattern – descriptive name of the type of pattern identified.
Pattern End – date and time when the pattern was identified or when it reached its completion.
Length – the number of candles / bars of the price chart that are contained in the pattern.
Direction - forecast direction of price movement after pattern completion.
Quality Indicators - (see the ‘Quality Indicators’ section above).
Forecast From / To - maximum and minimum price levels in the forecast range of a completed
pattern.
Emerging vs Complete Results
Emerging patterns provide you with early notification of potential trading opportunities. They
represent partially complete pattern formations that, once completed, would adhere to the
underlying theory. Most emerging patterns do not complete, however, which means that the
price moved in such a way that the graph no longer represents a valid pattern.
Emerging Chart Patterns are detected when the price is trading between support and resistance
levels, but has not yet broken out in the direction anticipated by the pattern.
Emerging vs Complete Results (continued)
If a new turning point forms between the support and resistance levels before breaking out, the
emerging pattern will no longer be valid.
In emerging Fibonacci Patterns, the price level of the final turning point of the pattern has
not been reached yet. This is because it is only a theoretical possibility when the pattern is
recognised. If the price graph does not make a turning point at the same price as the theoretical
turning point, the Fibonacci Pattern will no longer be valid.
Support
For further support or information please visit www.autochartist.com