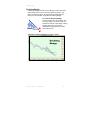
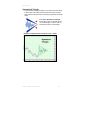
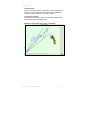
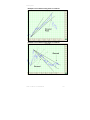
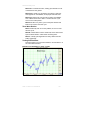
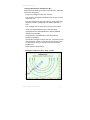
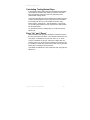
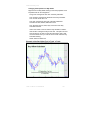
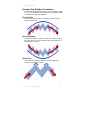
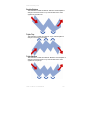
1
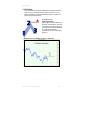
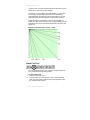
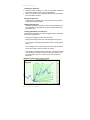
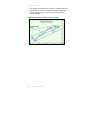
Charting Tools TRACK ‘N TRADE PRO VERSION 4.0 Accumulating Wealth One Tic at a Time! ® ANALYZING CHARTS WITH CHARTING TOOLS Track ‘n Trade Pro 4.0 User Manual 69 Charting Tools Track ‘n Trade Pro 4.0 User Manual 70 Charting Tools ANALYZING CHARTS WITH CHARTING TOOLS Applying Technical Formations Introduction Track ‘n Trade Pro has a complete set of charting tools that enable the futures trader to apply concepts from Technical Analysis to their charting. Take a look at some of the Technical Analysis formations and trends in this chapter and see how to apply these concepts in trading with Track ‘n Trade Pro charting tools. For more information on these formations and tools see Gecko Software Educational CDs available on trackntrade.com. The first tool in the Charting Toolbar is the Crosshair Tool. Although this tool is not used in helping you define and technically analyze data, it is used when lining up your technical indicators and recurring patterns. Crosshair Tool The Crosshair Tool is used to draw a line vertically and horizontally on the chart. The vertical line is drawn through the Indicator Window as well. To help place the Crosshair line on a specific value you will notice the cursor price is displayed on the vertical line of the crosshair. Charting a Crosshair: 1. Select the Crosshair Tool from the Charting Toolbox. 2. Click on the Chart Window to place Crosshair. Moving a Crosshair Drawing: 1. To select the Crosshair, click on the center point or lines of the crosshair and drag to the new location, release mouse button to place. Note: The tool is selected when a box appears at the center point. Deleting a Crosshair Drawing: 1. There are two ways to delete the Crosshair tool. 2. Select the Crosshair drawing by clicking on it and press the Delete Key on your keyboard. Track ‘n Trade Pro 4.0 User Manual 71 Charting Tools 3. Place mouse cursor over the Crosshair and right click. In the popup menu, select Delete. Deleting only the Horizontal/Vertical Line of the Crosshair: 1. Right-click on the center point of the Crosshair to view the properties menu. 2. Select/Deselect Show Horizontal (Vertical) Line. A check will appear in front of the item when it is shown. Changing Properties of a Crosshair: Right-click on the drawing to view the properties menu. Properties that can be changed are: Foreground: Changes the line color of the Crosshair. Line Thickness: Changes the thickness of the Crosshair lines. Choose values from 1-6. Line Style: Changes the line style of the Crosshair lines. Choose from solid, dashed, dotted and more. Font: Changes the font that the cursor price is displayed in. Show Text: If this option is selected, the text will stay on the chart after the Crosshair has been drawn, If not selected the value will only appear when drawing the Crosshair. Vertical Line: Select/Deselect to view or hide the vertical Crosshair line. Note: If both the vertical and horizontal lines are deselected, the crosshair tool will be deleted. Show Horizontal Line: Select/Deselect to view or hide the horizontal Crosshair line. Note: If both the vertical and horizontal lines are deselected, the crosshair tool will be deleted. Setting: To define the date and value of the Crosshair, select settings and type in the values. You can also choose to view or not view the horizontal and vertical lines. Send to Back: Changes the layer of the tool. This option is used when more than one tool is in the same area of the chart. Click on Send to Back when you need to access a tool under the 1-23 drawing. Track ‘n Trade Pro 4.0 User Manual 72 Charting Tools Example of the Crosshair in Track ‘n Trade Track ‘n Trade Pro 4.0 User Manual 73 Charting Tools Technical Analysis The remaining nine charting tools are used to identify Technical Analysis formations and trends. Take a look at the different patterns available then read about how to use each of the charting tools and apply the Technical concepts learned. Support Markets have a tendency to move in troughs and peaks, or more appropriately “Support and Resistance”. These troughs are called Support. The term is self-explanatory and indicates that support is a level or area on the chart “under the market” where buying interest is strong enough to overcome selling pressure. Therefore a decrease in price is reversed and prices rise once again. Typically a support level is identified by a previous set of lows. Resistance Essentially, resistance (or the “peaks”) is the opposite of support. Resistance is defined as a horizontal ceiling where the pressure to sell is greater than the pressure to buy. Therefore, an increase in price is reversed and prices revert downward. Typically, support can be located on a chart by a previous set of highs. Track ‘n Trade Pro 4.0 User Manual 74 Charting Tools Line Tool To draw a support/resistance line (also referred to as a trend) use either the Line or Multi-Line Tools. Drawing a Line: 1. Select the Line Tool. 2. Left click on the chart where you want the Line to begin. 3. Hold down the mouse button and move to the position where the Line ends. 4. Release the mouse button to place. Resizing the Line: 1. Select the Line drawing by clicking on it. You will know the Line is selected when boxes appear at the ends of the Line. 2. Click on a box and drag to the desired length. Release the mouse button to place the end point of the Line. Moving the Line: 1. Select the Line drawing by clicking on it. 2. Click on the Line (not on a box) and drag to new location and release mouse button to place. To Delete the Line: Left click on the Line Tool to select, and then press the Delete key on your keyboard. Or, right-click the line and select Delete on the popup menu. Track ‘n Trade Pro 4.0 User Manual 75 Charting Tools Examples of the Line Tool in Track ‘n Trade Multi-Line Tool Some contracts will have a continuous line/trend of alternating support and resistance. You may illustrate these multi-lines with the Line or Multi-Line Tool. Drawing a Multi-Line: 1. Select the Multi-Line Line Tool. 2. Left click on the chart where you want the Line to start. 3. Move the mouse to the next point on the Multi-Line and left click to place. 4. Repeat step 3 until the last point. When placing the last point on the Multi-Line, right click to place. Resizing the Multi-Line: 1. Select the Multi-Line drawing by clicking on it. You will know the Multi-Line is selected when boxes appear at the ends of the Multi-Line. 2. Click on a box and drag to the desired length. Release the mouse button to place the end point of the Multi-Line. Moving the Multi-Line: 1. Select the Multi-Line drawing by clicking on it. Track ‘n Trade Pro 4.0 User Manual 76 Charting Tools 2. Click on the Multi-Line (not on a box) and drag to new location, release mouse button to place. To Delete the Multi-Line: Left click on the Multi-Line Tool to select, and then press the Delete Key on your keyboard. Or, point mouse cursor over the Multi-Line and right click. Select Delete on the popup menu. Example of Multi-Line Tool in Track ‘n Trade Pro Track ‘n Trade Pro 4.0 User Manual 77 Charting Tools Channels The Technical Formation called a Channel consists of a section of price bars that are between parallel support and resistance lines. There are three types of channels the first is the Narrow Sideways Channel, then the Inclining Channel, and finally the Declining Channel. Narrow Sideways Channel A Narrow Sideways Channel is a formation that features both resistance and support with a sideways movement. Support forms the low price bar, while resistance provides the price ceiling. To trade a Narrow Sideways Channel: Place an order to buy on a break up and out of the channel, or sell on a break down out of channel. Narrow Sideways Channel Tool To illustrate a Narrow Sideways Channel in a chart use the Narrow Sideways Channel Tool. Drawing a Narrow Sideways Channel: Select the Narrow Sideways Channel Tool from the Charting Toolbox. 2. Position the mouse pointer where you would like to place the top left point of the channel and left click, continue to hold down the mouse dragging it to the right bottom point of channel, release mouse button to place. Moving the Narrow Sideways Channel: Select the channel drawing by clicking on it, drag to the new location and release the mouse button to place. 1. Deleting the Narrow Sideways Channel: Select the drawing by clicking on it and press the Delete Key on your keyboard. Or, point mouse cursor over the Channel and right click. Select Delete on the popup menu. 1. Resizing the Narrow Sideways Channel: Select the drawing by clicking on it. Note: The drawing is selected when boxes appear on the corners. Track ‘n Trade Pro 4.0 User Manual 78 Charting Tools 2. Click on one of the boxes on the corners to drag the select point and release the mouse button. Changing Properties of a Narrow Sideways Channel: To view the properties menu right-click your mouse on the channel drawing tool. Properties that can be changed are: Foreground: Changes the top and bottom lines of the channel. Background: Changes the inside colors of the channel. Line Thickness: Changes the thickness of the channel lines. Choose values from 1-6. Line Style: Changes the line style of the channel lines. Choose from solid, dashed, dotted and more. Send to back: Changes the layer of the tool. This option is used when more than one tool is in the same area of the chart. Click on Send to back when you need to access a tool under the Narrow Sideways Channel drawing. Track ‘n Trade Pro 4.0 User Manual 79 Charting Tools Inclining Channel The Inclining Channel is a formation with parallel price barriers along both the price ceiling and floor. Unlike the sideways channel the inclining channel has an increase in both the price ceiling and price floor. The breaking of the bottom trend line on this formation shows a change in trend from bullish to bearish. To trade an Inclining Channel: Place an order to sell on the break down and out of the channel. Example of an Inclining Channel in Track ‘n Trade Track ‘n Trade Pro 4.0 User Manual 80 Charting Tools Declining Channel The Declining Channel is the exact opposite of the Inclining Channel Formation. The Declining Channel has a decrease in both the price ceiling and price floor. The breaking of the top trend line on this formation shows a change in trend from bearish to bullish. To trade a Declining Channel: Place an order to buy on the break up and out of the channel. Example of the Declining Channel in Track ‘n Trade Track ‘n Trade Pro 4.0 User Manual 81 Charting Tools Inclining/Declining Channel Tool You can identify an Inclining/Declining Channel by using the Inclining/Declining Channel Tool. Drawing an Inclining/Declining Channel: Select the Inclining/Declining Channel Tool from the Charting Toolbox. 2. Position the mouse pointer where you would like to place the top left point of the channel and left click, continue to hold down the mouse dragging it to the right bottom point of channel, release mouse button to place. 1. Moving the Inclining/Declining Channel: Select the channel drawing by clicking on it, drag to the new location and release the mouse button to place. Deleting the Inclining/Declining Channel: Select the drawing by clicking on it and press the Delete key on your keyboard. Or, point mouse cursor over the Channel and right click. Select Delete on the popup menu. Resizing the Inclining/Declining Channel: Select the drawing by clicking on it. Note: The drawing is selected when boxes appear on the corners. 2. Click on one of the boxes on the corners to drag the select point and release the mouse button. 1. Changing Properties of an Inclining/Declining Channel: To view the properties menu right-click your mouse on the channel drawing tool. Properties that can be changed are: Foreground: Changes the top and bottom lines of the channel. Background: Changes the inside colors of the channel. Line Thickness: Changes the thickness of the channel lines. Choose values from 1-6. Line Style: Changes the line style of the channel lines. Choose from solid, dashed, dotted and more. Send to Back: Changes the layer of the tool. This option is used when more than one tool is in the same area of the chart. Click on Send to Back when you need to access a tool under the channel drawing. Track ‘n Trade Pro 4.0 User Manual 82 Charting Tools 50% Retracements Markets move in waves called retracements, these waves have up and down trends. Notice in the above diagram, that the market is in an overall “uptrend” (considered a Bull Market), but that within the uptrend, there are small areas where the market falls back, or “retraces”; each time establishing a new higher high. The following chart displays an example with a down trend (when a market is in an overall down trend it is considered a Bear Market). In this chart you will see how the market made lower highs and lower lows while still maintaining the overall down trend. Notice how far back those retracements went, before they continued on in their original direction... it is about 50% of the last move. Track ‘n Trade Pro 4.0 User Manual 83 Charting Tools Markets have a tendency to retrace half or 50% of the last move as well as in overall long-term trends. N% Tool You can measure a retracement with the N% Tool. The default on this charting tool is 50%, but can be changed by simply dragging the middle bar up or down. See Fibonacci Time Zone and Fan Tools in the Advanced Charting Tools for more information on retracements. 1. 2. 1. 2. Drawing an N% Channel: Select the N% Tool from the Charting Toolbox. Position the mouse pointer where you would like to place the top left point of the channel and left click, continue to hold down the mouse dragging it to the right bottom point of channel, release mouse button to place. Note: The default retracement percentage on the N% tool is 50%. Moving the % Line: Select the channel drawing by clicking on it. You will notice that the middle line has a box in the middle of the line. This is the handle that you will use to change the position of the percentage line within the tool drawing. As you change the position of the percentage line, the percentage value to the left will change as well. Track ‘n Trade Pro 4.0 User Manual 84 Charting Tools Moving the N% Tool: Left click on the channel and drag the tool, release mouse button to place drawing. Deleting the N% Channel: Select the drawing by clicking on it and press the Delete Key on your keyboard. Or, right click on the channel tool and select the delete option on the popup menu. Resizing the N% Channel: Select the drawing by clicking on it. Note: The drawing is selected when boxes appear on the corners. 2. Click on one of the boxes on the corners to drag the select point and release the mouse button. 1. Changing Properties of an N% Channel: To view the properties menu, right-click on the drawing. Properties that can be changed are: Foreground: Changes the color for top and bottom lines of the channel. Background: Changes the inside color of the channel. Line Thickness: Changes the thickness of the channel lines. Choose values from 1-6. Line Style: Changes the line style of the channel lines. Choose from solid, dashed, dotted and more. Font: Changes font, size, style, and color of text. Show Text: Select\Deselect to view or hide the text on the channel. Send to Back: Changes the layer of the tool. This option is used when more than one tool is in the same area of the chart. Click on Send to back when you need to access a tool under the N% Channel Drawing. Track ‘n Trade Pro 4.0 User Manual 85 Charting Tools Example of the N% Tool in Track ‘n Trade Track ‘n Trade Pro 4.0 User Manual 86 Charting Tools 1-2-3 Formations The 1-2-3 Formation anticipates a change in trend. It is available in both a Top and Bottom. 1-2-3 Top The 1-2-3 Top Formation anticipates a change in trend, from up to down, on a break below the number two point. This formation is easily identified because the number one point is the annual price high. To trade a 1-2-3 Top: Place a SELL order on a break down past the #2 point. Then, place a stop loss order just above the #1 point (Considered to be an industry standard) or just above the #3 point (A more conservative stop loss placement.) Example of a 1-2-3 Top in Track ‘n Trade Pro Track ‘n Trade Pro 4.0 User Manual 87 Charting Tools 1-2-3 Bottom The 1-2-3 Bottom Formation anticipates a change in trend from down to up on a break above the number two point. A 1-2-3 Bottom Formation is easily identified because the number one point is the annual price low. To Trade a 1-2-3 Bottom Formation: Place a BUY order just above the #2 point, and then place your stop loss order just below the #1 point (Considered an industry standard) or just below the #3 point (Considered a more conservative position.) Example of a 1-2-3 Bottom in Track ‘n Trade Pro Track ‘n Trade Pro 4.0 User Manual 88 Charting Tools 1-2-3 Tool Use the 1-2-3 Tool to chart both a 1-2-3 Top and Bottom Formation. Drawing a 1-2-3 Top/Bottom: Select the 1-2-3 Tool from the Charting Toolbox. Position the mouse pointer where you would like to place the #1 point and left click to place. 3. Move to the #2 point and left click to place. 4. Move to the #3 point and left click to place. 1. 2. Moving a 1-2-3 Drawing: Select the 1-2-3 drawing by clicking on it, drag to the new location and release the mouse button to place. Note: The tool is selected when a line appears connecting the 1, 2, and 3. Deleting a 1-2-3 Drawing: Select the 1-2-3 drawing by clicking on it and press the Delete Key on your keyboard. Or, right-click the drawing and select Delete from the popup menu. Resizing the 1-2-3 Drawing: Select the 1-2-3 drawing by clicking on it. The drawing is selected when boxes appear on the corners. 2. Click on one of the boxes to drag the select point and release the mouse button. 1. Changing Properties of a 1-2-3 Drawing: Right-click on the drawing to view the properties menu. Properties that can be changed are: Foreground: Changes the line and arc color of the 1-2-3. Line Thickness: Changes the thickness of the 1-2-3 line. Choose values from 1-6. Line Style: Changes the line style of the 1-2-3 line, which shows when the line is selected. Choose from solid, dashed, dotted and more. Arc Thickness: Changes the arcs formed at the 1, 2, and 3 points. Choose values from 1-6. Font: Changes the Font, Size, Style, and Color of the 1, 2, and 3. Track ‘n Trade Pro 4.0 User Manual 89 Charting Tools Show Text: Select to view or hide the 1, 2, and 3. Send to Back: Changes the layer of the tool. This option is used when more than one tool is in the same area of the chart. Click on Send to Back when you need to access a tool under the 1-23 drawing. Head & Shoulders Formation This Formation can appear anywhere in the chart and is made up of the Head, Left Shoulder, and Right Shoulder. There are two types: Top and Bottom. Head & Shoulders - Top This formation has three definite peaks: the Head, Left Shoulder and Right Shoulder. The middle peak, the Head (H) is higher than either shoulder (LS, RS). This formation anticipates a drop in price below the Neckline (see below). To trade a Head & Shoulders – Top: Place a sell order on the break of the Neckline. Your stop loss order should then be placed just above the Head. The stop loss order can also be placed above the Right Shoulder as a more conservative point. Example of Head & Shoulders Top in Track ‘n Trade Track ‘n Trade Pro 4.0 User Manual 90 Charting Tools Head & Shoulders - Bottom This formation is simply an inverted version of the Head and Shoulders Top Formation. Therefore, a Head and Shoulders Bottom anticipates a rise in price above the Neckline. To trade a Head & Shoulders – Bottom: Place a buy order on the break up of the Neckline. Then place a stop loss order just below the Head. The stop loss order can also be placed below the Right Shoulder as a more conservative point. Example of Head & Shoulders: Bottom in TNT Track ‘n Trade Pro 4.0 User Manual 91 Charting Tools Head & Shoulders Tool To identify either a Head & Shoulders Top or Bottom formation, use the Head & Shoulder Tool. 1. 2. 3. 4. 5. 6. Charting a Head & Shoulders (H&S) Formation: Select the H&S Tool from the Charting Toolbox. Position the mouse pointer where you would like to place the Left Shoulder (LS) point and left click to place. Move to the valley point between the LS and the Head, left click to place. Move to the Head point and left click to place. Move to the valley point between the Head and Right Shoulder (RS), left click to place. Move to the RS point and left click to place. Moving H&S Drawing: Select the H&S drawing by clicking on it, drag to the new location and release the mouse button to place. Note: The tool is selected when a line appears connecting the LS, H, and RS. Deleting H&S Drawing: Select the H&S drawing by clicking on it and press the Delete Key on your keyboard. Or, right-click on the drawing and choose the Delete option in the popup menu. Resizing the H&S Drawing: Select the H&S drawing by clicking on it. The drawing is selected when boxes appear on the corners. 2. Click on one of the boxes to drag the select point and release the mouse button. 1. Track ‘n Trade Pro 4.0 User Manual 92 Charting Tools Changing Properties of a H&S Drawing: Right-click on the drawing to view the properties menu. Properties that can be changed are: Foreground: Changes the line and arc color of the H&S drawing. Note: The line is only seen when the drawing is selected. Line Thickness: Changes the thickness of the H&S line. Choose values from 1-6. Line Style: Changes the line style of the H&S line, which shows when the line is selected. Choose from solid, dashed, dotted and more. Arc Thickness: Changes the arcs formed at the LS, H, and RS points. Choose values from 1-6. Font: Changes the Font, Size, Style, and Color of the H, LS, and RS. Show Text: Select to view or hide the H, LS, and RS. Send to back: Changes the layer of the tool. This option is used when more than one tool is in the same area of the chart. Click on Send to back when you need to access. Track ‘n Trade Pro 4.0 User Manual 93 Charting Tools Triangle and Wedge Formations The triangle formation comes in many varieties. There are Rising/Inclining Wedges and Symmetrical/Non-Symmetrical Triangles. Inclining Wedge The Inclining Wedge Formation occurs when the slope of price bar highs and lows join at a point forming an inclining wedge formation. The slope of both lines is up with the lower line being steeper than the higher one. To Trade the Inclining Wedge: Place a BUY order on a break up and out of the wedge or a SELL order on a break down and out of the wedge. Inclining Wedges with a prior downtrend are anticipated to break down and out rather than up and out. Example of an Inclining Wedge in Track ‘n Trade Track ‘n Trade Pro 4.0 User Manual 94 Charting Tools Declining Wedge A Declining Wedge Formation occurs when the slope of price bar highs and lows join at a point forming a Declining wedge. The slope of both lines is down, the top line being steeper than the lower one. This formation is opposite the Inclining Wedge. To Trade the Declining Wedge: Place an order to buy on a break up and out of the wedge or an order to sell on a break down and out of the wedge. Falling wedges, with a prior up trend, are anticipated to break up and out, rather than down and out. Example of a Declining Wedge in Track ‘n Trade Track ‘n Trade Pro 4.0 User Manual 95 Charting Tools Symmetrical Triangle A Symmetrical Triangle Formation occurs when there is a pause in the current trend, after which the previous trend is resumed. Also notice that the price bars for a perfectly symmetrical triangle shape. To Trade a Symmetrical Triangle: Place a BUY order on a break up and out of the triangle or a SELL order on break down and out of the triangle. Example of a Symmetrical Triangle in Track ‘n Trade Track ‘n Trade Pro 4.0 User Manual 96 Charting Tools Non-Symmetrical Triangle A Non-Symmetrical Formation occurs in exactly the same situation as a symmetrical triangle, only the pattern lacks symmetry. This formation resumes the previous trend as well when a break out occurs. To Trade a Non-Symmetrical Triangle: Place a BUY order on a break up and out of the triangle or an order to SELL on a break down and out of the triangle. Example of a Non-Symmetrical Triangle in TNT Track ‘n Trade Pro 4.0 User Manual 97 Charting Tools Wedge and Triangle Tool To identify any type of Wedge or Triangle, use the Wedge Tool. Drawing a Wedge/Triangle Formation: Select the Wedge Tool from the Toolbox. Left click your mouse at the top of the triangle. Drag the mouse pointer to the bottom of the triangle and left click to place. 4. Next drag the mouse pointer to form a triangle and left click the mouse to place the final point. 1. 2. 3. Resizing the Wedge/Triangle Formation: Select the drawing by clicking on it. Note: The formation is selected when boxes appear on the corners of the drawing. 2. Click on one of the boxes to drag the select point and release the mouse button. 1. Moving the Wedge/Triangle Formation: Select the drawing by clicking on it, drag to the new location and release the mouse button. Deleting the Wedge/Triangle Formation: Select the drawing by clicking on it and press the delete key on your keyboard. Or, right-click on the formation and choose the Delete Option in the popup menu. Changing the Properties of the Triangle Formation: Right-click on the drawing to view the properties menu. Properties that can be changed are: Foreground: Changes the line color of the Triangle drawing. Background: Changes the inside color of the Triangle drawing. Line Thickness: Changes the thickness of the Triangle line. Choose values from 1-6. Line Style: Changes the line style of the Triangle line. Choose from solid, dashed, dotted and more. Send to Back: Changes the layer of the tool. This option is used when more than one tool is in the same area of the chart. Click on Send to Back when you need to access a tool under the Triangle drawing. Track ‘n Trade Pro 4.0 User Manual 98 Charting Tools Trend Fan Trend fans are an extension of the regular trend line, and accent simple trend line trading concepts by extending the single trend line to a multiple of fan lines that give you a better look at a trend, its retracements and market reversals. Take a look at this diagram. As a trend moves up in scale, a chartist will generally draw a vertical line across price bar lows; or alternatively, when a market is moving down, across the price bar highs. Then, as the market continues to make its retracement, we can then draw another trend line across the next level of support or resistance. The line is support if the market is moving up and resistance if it is moving down. You will notice how the last move of the trend, which was resistance for the first trend line, is now support for the second trend line. Now draw the third trend line. At this point, you can see that the market has made a solid retracement down past this third fan line. When the market crosses the third fan line, it is considered to be confirmation of market retracement; a market that was once considered bullish...is now bearish, or if bearish, would now be considered bullish. Track ‘n Trade Pro 4.0 User Manual 99 Charting Tools Rule of Thumb: When the markets price bars cross above or below the third trend fan line, this is your signal and confirmation that the market has shifted from bullish to bearish, or bearish to bullish. To Trade a Trend Fan: Place an order to enter the market on the break out past the third trend fan line. See the example charts: Example of a Trend Fan using Track ‘n Trade Pro Track ‘n Trade Pro 4.0 User Manual 100 Charting Tools Example 2 of a Trend Fan using Track ‘n Trade Pro Example 3 of a Trend Fan using Track ‘n Trade Pro Track ‘n Trade Pro 4.0 User Manual 101 Charting Tools Trend Fan Tool To identify a Trend Fan within a chart use the Trend Fan Tool. To draw a Trend Fan: Select the Trend Fan Tool. Left click where you want the Fan to start. Move the mouse pointer to where the first line is to end and left click to place. 4. Repeat Step 3 until you get to the last line. 5. To place the last trend, move the mouse pointer to the ending point and right click to place. 1. 2. 3. Resizing the Trend Fan: Select the Trend Fan by clicking on it. Note: The formation is selected when boxes appear on the corners of the drawing. 2. Click on one of the boxes to drag the selected point and release the mouse button to place. 1. Moving the Trend Fan: Select the Trend Fan by clicking on it. Then, drag to the new location and release the mouse button. Deleting the Trend Fan: Select the drawing by clicking on it then, press the delete key on your keyboard to remove the Trend Fan. Or, right-click on the fan and choose the Delete option from the popup menu. Track ‘n Trade Pro 4.0 User Manual 102 Charting Tools TRACK ‘N TRADE PRO VERSION 4.0 Accumulating Wealth One Tic at a Time! ® ADVANCED CHARTING TOOLS Track ‘n Trade Pro 4.0 User Manual 103 Advanced Charting Tools Track ‘n Trade Pro 4.0 User Manual 104 Advanced Charting Tools ADVANCED CHARTING TOOLS Applying Technical Formations and Theories Introduction Track ‘n Trade Pro has incorporated concepts and theories from leading Technical and Fundamental Educators in the Futures Industry allowing you as a trader to apply their studies easily to your trading. In this section you will both learn basics about their theory and learn how to apply it in Track ‘n Trade Pro using the Advanced Charting Tools provided you. For more detailed information on the different theories and concepts see the educational products also offered by Gecko Software, Inc. (www.trackntrade.com) Elliot Wave Theory This theory was developed by Ralph Nelson Elliot and bares his name. Elliott wave theory is an idea that market behavior is based on waves rather than random timing. Elliott believed that market prices rose and fell in a series of waves based on the same Golden ratio or Golden mean that Fibonacci proved. This ratio is present in many aspects of nature and science, and Elliott felt that it had great significance on the financial markets as well. Interpretation The basic idea of this theory is that a market rises in a series of 5 “waves” (as he called them) and that a market declines in a series of 3 declines. Elliott’s theory is that on the first wave a market rises, on wave two it declines, begins again to rise on wave three, has a period of decline again on wave four, and finally completes the rise on wave five. Then thee period of correction is referred to as a three-wave correction, where the market declines for wave A, begins to rise for wave B, and falls again for wave C. Elliot went on further to explain that a complete market cycle consisted of a 144 wave cycle, broken down into an 89 wave bull cycle, and a 55 wave bear cycle. This is based on his observation of Fibonacci’s golden ratio. The series of numbers Fibonacci describes, (1, 2, 3, 5, 8, 13, 21, 34, 55, 89, and 144) shows a relationship of 1:.618. Elliot further showed that a market usually rises or falls based on this wave cycle. Each wave in the cycle has its own characteristics. Five Wave Advance: Wave one: Normally very short and easy to miss. Track ‘n Trade Pro 4.0 User Manual 105 Advanced Charting Tools Wave two: A retracement wave, usually gives back all or most of what the first one gained. Wave three: Usually very prominent, as it follows a period of what appears as consolidation, most people trade this wave. Wave four: Noted to be very intricate yet still a consolidation. One of Elliot’s main rules is that in a 5-wave advance cycle, wave 4 can’t overlap wave 1. Wave five: Often very active, yet at some point declines and leads to the 3 wave corrective cycle. Three Wave Decline: Wave A: Normally seen as a minor pullback, of wave 5 of the advance cycle. Wave B: Follows Wave A of the downtrend, and is often hard to spot but should result in a third wave continuing down. Wave C: Usually quiet significant and many traders see this selling opportunity. Trading an Elliot Wave: See Wave three in the “Five Wave Advance” and the Wave C in the “Three Wave Decline”. Example of an Elliot Wave in Track ‘n Trade Track ‘n Trade Pro 4.0 User Manual 106 Advanced Charting Tools Elliot Wave Tool To identify an Elliot Wave on a chart use the Elliot Wave tool located in the Advanced Charting Tools Section. 1. 2. 3. Charting an Elliot Wave: Select the Elliot Wave Tool from the Toolbox. Left click your mouse on the #1 point to place. Continue throughout the wave by clicking on each point 1-5 and A,B,C to place. When you get to the last point C the drawing is complete. Resizing the Elliot Wave Drawing: Select the drawing by clicking on it. Note: The drawing is selected when boxes appear on the corners. 2. Click on one of the boxes to drag the select point and release the mouse button. 1. Moving the Elliot Wave Drawing: Select the drawing by clicking on it continue holding down the mouse button, drag to the new location and release the mouse button. Deleting the Elliot Wave Drawing: Select the drawing by clicking on it and press the delete key on your keyboard to remove. Or, right-click the drawing and select Options from the popup menu. Changing the Properties of an Elliot Wave Drawing: Right-click on the drawing to view the properties menu. Properties that can be changed are: Foreground: Changes the line color of the Elliot Wave. Line Thickness: Changes the thickness of the Elliot Wave Line. Choose values from 1-6. Line Style: Changes the line style of the Elliot Wave Line. Choose from solid, dashed, dotted and more. Arc Thickness: Changes the arcs formed at the 1-5 and ABC points. Choose values from 1-6. Font: Changes the Font, Size, Style, and Color of the 1-5 and ABC points. Show Text: Select to view or hide the 1-5 and ABC points. Track ‘n Trade Pro 4.0 User Manual 107 Advanced Charting Tools Send to Back: Changes the layer of the tool. This option is used when more than one tool is in the same area of the chart. Click on Send to Back when you need to access a tool under the Elliot Wave Drawing. Dart (Blip) Formations The Dart (Blip) Formation occurs when there is a dramatic price change which is followed by an equally dramatic price change. There are two types of Darts: Up and Down. Dart Up (Blip) Formations This formation is where a sudden dramatic price increase occurs followed by an equally dramatic drop in price. A dart formation can appear anywhere in a chart. To Trade a Dart Up: Place a sell order on the break down of the Right Feather (RF) along with a stop loss order just above the Tip. Trading on a Dart Formation is very risky. Dart Down (Blip) Formation This formation is where a sudden dramatic price decrease occurs followed by an equally dramatic increase in price. This formation can appear anywhere in a chart. To Trade a Dart Down: Place a buy order on the break up of the Right Feather, and then place your stop loss order right below the tip. Trading on a Dart Formation is very risky. Track ‘n Trade Pro 4.0 User Manual 108 Advanced Charting Tools Dart/Blip Tool To chart a Dart (Blip) Up or Down formation use the Dart/Blip Advanced Charting Tool. To Draw a Dart Formation: Select the Dart Tool from the Advanced Charting Tool Menu bar. Left Click your mouse on the Left Feather (LF) Continue to hold down the mouse button while moving to the tip of the dart. 4. Release the mouse button then move the mouse to the Right Feather and release the mouse button. 1. 2. 3. To Lengthen or shorten the Formation: Select the dart by clicking on it. (The formation is selected when boxes appear on the corners of the drawing.) 2. Click on one of the boxes to drag the select point and release the mouse button. 1. To Move the Entire Dart: Select the dart by clicking on it and drag to the new location and release the mouse button. To Delete the Dart: Select the dart by clicking on it and press the delete key on your keyboard. Or, right-click on the drawing and select Delete from the popup menu. Changing the Properties of a Dart/Blip Drawing: Right-click on the drawing to view the properties menu. Properties that can be changed are: Foreground: Changes the line color of the Elliot Wave. Line Thickness: Changes the thickness of the Elliot Wave Line. Choose values from 1-6. Line Style: Changes the line style of the Elliot Wave Line. Choose from solid, dashed, dotted and more. Send to Back: Changes the layer of the tool. This option is used when more than one tool is in the same area of the chart. Click on Send to Back when you need to access a tool under the Elliot Wave Drawing. Track ‘n Trade Pro 4.0 User Manual 109 Advanced Charting Tools Example of a Dart Up and Down in Track ‘n Trade Pro Gann Fan Theory W. D. Gann designed several unique techniques for studying price charts. One of these techniques included the use of geometric angles in conjunction with time and price. Gann believed that specific geometric patterns and angles had unique characteristics that could be used to predict price action. Gann’s techniques require that charts be drawn with equal time and price intervals, so that a rise/run of one price unit for each time unit (called a 1 x 1 trend or angle) will equal a 45 degree angle anywhere on the chart. Gann believed that the ideal balance between time and price exists when prices rise or fall at a 45 degree angle relative to the time axis. Interpretation The Gann Fan is made up of nine angles based on this concept. These trend lines are used to indicator support and resistance levels. When one line is broken (by the entire days price range) prices should move to the next line. The drawing of these lines should start from either a market top or bottom. It is important to note that this theory is based on a squared 45 degree angle on the chart. Obviously, a 45 degree angle drawn on a chart is no longer 45 degrees when the scale is changed without a change to also the opposite scale. To “square” the Gann Fan to the current chart’s scaled settings, hold down the CTRL key on your keyboard while clicking on and rescaling with the mouse pointer. Some Gann experts have reported that to get a truly Track ‘n Trade Pro 4.0 User Manual 110 Advanced Charting Tools “squared” chart, one must set the scaling to 8 price bars per inch (width) and 4 price bars per inch (height). A Gann Fan is used to define a market direction or a new trend. For example, a bull market exists if prices are maintaining strength between the1x2 lower line and 1x2 higher line. A bear market would be the exact opposite of the previous scenario. During an uptrend, the breaking of one line would suggest a further price drop to the next lower line. Correspondingly, if prices break above one line, they would be expected to rally to the next higher one. Example of the Gann Fan in Track ‘n Trade Gann Fan Tool You can apply this theory to your charts by using the Gann Fan Tool on the Advanced Charting Toolbar. 1. 2. To draw a Gann Fan: Select the Gann Fan Tool. Left click where you want the Fan to start, continue holding down the mouse button until reaching the final position of the fan, release button to place. Track ‘n Trade Pro 4.0 User Manual 111 Advanced Charting Tools Resizing the Gann Fan: Select the Fan by clicking on it. Note: The formation is selected when boxes appear on the corners of the drawing. 2. Click on one of the boxes to drag the selected point and release the mouse button to place. 1. Moving the Gann Fan: Select the Fan by clicking on it. Then, drag to the new location and release the mouse button. Deleting the Gann Fan: Select the drawing by clicking on it then, press the delete key on your keyboard. Or, right-click on the fan and select Delete from the popup menu. Changing Properties of a Gann Fan: Right-click on the drawing to view the properties menu. Properties that can be changed are: Foreground: Changes the line color for the fan. Background: Changes the color of the background for the fan. Line Thickness: Changes the thickness fan line. Choose values from 1-6. Font: Changes the Font, Size, Style, and Color of the fan values Show Text: Select to view or hide the fan values. Send to Back: Changes the layer of the tool. This option is used when more than one tool is in the same area of the chart. Click on Send to Back when you need to access a tool under the Gann Fan. Example of a Gann Fan in Track ‘n Trade Track ‘n Trade Pro 4.0 User Manual 112 Advanced Charting Tools Andrews Pitchfork Theory Dr. Alan Andrews developed a channel technique to show areas of support and resistance from a baseline. This use of a median line is the key to using the Andrews Pitchfork. Buying near lows and selling near highs that are identified by the “tines” of the pitchfork. The basic premise is to trade the channel from one level of support or resistance to the next. Interpretation The first element to draw the Andrews Pitchfork is the centerline. The middle tine or median line begins at the most recent contract low or high. To plot the direction of this point we must attain the other two points. The top tine is determined by looking at the highest move made from the origin of the contract low or high. The next point is found by looking at the retracement of that move. For example, a contract begins at point A rallies to point B, and sells off from B to point C. A line is drawn from point B and C, and then the line originating at point A splits those two lines equally. This pitchfork shows continuing points of support and resistance. The general use of this tool is to sell when the market rises to line B, and take profits once prices reach line A the middle tine. Also to buy when prices dip to line C and take profits when they reach line A. This series of movements within the pitchfork affords traders the opportunity to trade a channel system within a trending market. Andrews Pitchfork Tool 1. 2. Charting Andrews Pitchfork: Select the Andrews Pitchfork Tool from the Toolbox. The first three clicks setup the pitchfork. The first point is the handle of the pitchfork and is places at the end of the previous trend.(A) Track ‘n Trade Pro 4.0 User Manual 113 Advanced Charting Tools 3. 4. 5. Next you are forming the base of the fork. The first point is the top of the next trend. (B) The second point completes the base and is placed at the bottom of the trend. (C) Once you have completed the first three steps you can elongate the pitchfork to length desired. Left click to place final point. Resizing the Andrews Pitchfork Drawing: Select the drawing by clicking on it. Note: The drawing is selected when boxes appear on the corners. 2. Click on one of the boxes to drag the select point and release the mouse button. 1. Moving the Andrews Pitchfork Drawing: Select the drawing by clicking on it continue holding down the mouse button, drag to the new location and release the mouse button. Deleting the Andrews Pitchfork Drawing: Select the drawing by clicking on it and press the delete key on your keyboard to remove. Or, right-click on the drawing and select Delete from the popup menu. Changing the Properties of the Andrews Pitchfork Drawing: Right-click on the drawing to view the properties menu. Properties that can be changed are: Foreground: Changes the line color of the Andrews Pitchfork. Line Thickness: Changes the thickness of the Andrews Pitchfork. Choose values from 1-6. Line Style: Changes the line style of the Andrews Pitchfork Line. Choose from solid, dashed, dotted and more. Track ‘n Trade Pro 4.0 User Manual 114 Advanced Charting Tools Send to Back: Changes the layer of the tool. This option is used when more than one tool is in the same area of the chart. Click on Send to Back when you need to access a tool under the Andrews Pitchfork. Example of Andrews Pitchfork in Track ‘n Trade Track ‘n Trade Pro 4.0 User Manual 115 Advanced Charting Tools Fibonacci Retracements Fibonacci Retracement levels correspond with percentage retracements that occur in the ebb and flow of a market trend. According to the Elliot Wave Theory, market trends tend to occur in five distinct waves. See the Elliot Wave for more information. Elliot asserted that these counter-trend waves will usually retrace against the trending waves by 38.2, 50 and 61.8 percent. These Retracement Percentages correspond to natural ratios discovered by the Greeks called the Golden Ratio and rediscovered by Fibonacci; a medieval, Italian Mathematician. Interpretation Commodity prices will frequently consist of an initial wave, a second wave (often retracing 61.8% of the initial move), the third wave (usually the largest), then another retracement, and finally the 5th wave (the last gap), which would exhaust the movement. In Track 'n Trade Pro, you have three tools that you can use to apply these concepts: the Fibonacci Retracement, Fibonacci Time Zone and the Fibonacci Arc. Track ‘n Trade Pro 4.0 User Manual 116 Advanced Charting Tools Fibonacci Retracement Tool The Fibonacci Retracement Tool is used to measure the different retracement levels within a market. 1. 2. 3. Drawing a Fibonacci Retracement: Select the Fibonacci Retracement Tool from the Toolbox. Left click on the chart where you would like the ruler to begin. Move the mouse pointer to the lower right position of the ruler and left click to place. Resizing the Fibonacci Retracement: Select the ruler by clicking on it. You can tell the ruler is selected when boxes appear on the corners of the drawing. 2. Click on one of the boxes to drag the select point and release the mouse button. 1. Moving the Fibonacci Retracement: Select the ruler by clicking on it, then drag to the new location and release the mouse button. Deleting the Fibonacci Retracement: Select the ruler by clicking on it and press the delete key on your keyboard. Or, right click on the ruler and select Delete in the popup menu. Right-click Menu Track ‘n Trade Pro 4.0 User Manual 117 Advanced Charting Tools Changing Properties for the Fibonacci Retracement: Right-click on the ruler to view the properties menu. Properties that can be changed are: Foreground: Changes the line color of the ruler. Background: Changes the background color of the ruler. Line Thickness: Changes the thickness of the ruler lines. Choose values from 1-6. Font: Changes the Font, Size, Style, and Color of the values. Show Text: Deselect/Select to view or hide the values. Show Retracements: Select/Deselect to view the additional retracement percentages. Show Prediction: Select/Deselect to view the additional prediction percentages. Show Time Zones: Select\Deselect to overlay the Time Zones on the ruler. Send to Back: Changes the layer of the tool. This option is used when more than one tool is in the same area of the chart. Click on Send to Back when you need to access a tool under the Fibonacci Retracement. Delete: Select to delete the tool. Example of a Fibonacci Retracement in Track ‘n Trade: Track ‘n Trade Pro 4.0 User Manual 118 Advanced Charting Tools Fibonacci Arc Tool The Fibonacci Arc Tool is used to measure the different retracement levels within a market. Drawing a Fibonacci Arc: Select the Fibonacci Arc Tool from the Toolbox. Move the mouse pointer to the point on the chart that you would like to start the stem of the arc tool, left click start. 3. Move the mouse pointer to the ending point for the arc tool and left click to place. (While moving to the end point, the arc will extend for you to get an idea of placement on the ticks.) 1. 2. Resizing the Fibonacci Arc: Select the arc by clicking on it. You can tell the arc is selected when boxes appear on the corners of the drawing. 2. Click on one of the boxes to drag the select point and release the mouse button to place. 1. Moving the Fibonacci Arc: Select the arc by clicking on it, then drag to the new location and release the mouse button. Deleting the Fibonacci Arc: Select the arc by clicking on it and press the delete key on your keyboard. Or, right-click the arc and select Delete on the popup menu. Track ‘n Trade Pro 4.0 User Manual 119 Advanced Charting Tools Changing Properties for the Fibonacci Arc: Right-click on the drawing to view the properties menu. Properties that can be changed are: Foreground: Changes the line color of the arc. Line Thickness: Changes the thickness of the arc lines. Choose values from 1-6. Line Style: Changes the line style of the arc, which shows when the line is selected. Choose from solid, dashed, dotted and more. Font: Changes the Font, Size, Style, and Color of the values. Show Text: Deselect\Select to view or hide the values. Show Retracements: Select/Deselect to view the additional retracement percentages. Show Prediction: Select/Deselect to view the additional prediction percentages. Send to Back: Changes the layer of the tool. This option is used when more than one tool is in the same area of the chart. Click on Send to Back when you need to access a tool under the Fibonacci Arc. Delete: Select to delete the tool. Example of a Fibonacci Arc in Track ‘n Trade: Track ‘n Trade Pro 4.0 User Manual 120 Advanced Charting Tools Fibonacci Time Zones The Fibonacci Time Zone uses Fibonacci numbers rather than the percentages used in the Ruler and Arc tools. Charting a Fibonacci Time Zone: Select the Fibonacci Time Zone Tool from the Toolbox. This tool is drawn like a rectangle. Left click for the upper left point. 3. Move the mouse to the bottom right position and left click to finish the drawing. 1. 2. Resizing the Fibonacci Time Zone: Select the drawing by clicking on it. Note: The drawing is selected when boxes appear on the corners. 2. Click on one of the boxes to drag the select point and release the mouse button. 1. Moving the Fibonacci Time Zone: Select the drawing by clicking on it continue holding down the mouse button, drag to the new location and release the mouse button. Deleting the Fibonacci Time Zone: Select the drawing by clicking on it and press the delete key on your keyboard to remove. Or, right-click on the tool and select Delete from the popup menu. Track ‘n Trade Pro 4.0 User Manual 121 Advanced Charting Tools Changing the Properties of a Fibonacci Time Zone: Right-click on the drawing to view the properties menu. Properties that can be changed are: Foreground: Changes the line color of the Fibonacci Time Zone. Line Thickness: Changes the thickness of the Fibonacci Time Zone Line. Choose values from 1-6. Line Style: Changes the line style of the Fibonacci Time Zone Line. Choose from solid, dashed, dotted and more. Font: Changes the Font, Size, Style, and Color of the Fibonacci Time Zone numbers. Show Text: Select to view or hide the numbers. Send to Back: Changes the layer of the tool. This option is used when more than one tool is in the same area of the chart. Click on Send to Back when you need to access a tool under the Fibonacci Time Zone drawing. Delete: Select to delete tool. Example of a Fibonacci Time Zone in Track ‘n Trade: Track ‘n Trade Pro 4.0 User Manual 122 Advanced Charting Tools Calculating Trading/Actual Days In the futures industry trading days are scheduled around holiday and weekends, therefore when looking at a futures chart often times it is difficult to determine how many actual days have passed while working a trade. The number of trading days is also significant for traders using the number of trading days as a rule in conjunction with a formation. For example with the 1-2-3 Top or Bottom Formation, many traders use the 10-20-50 rule. This rule defines a 1-2-3 if there are 10 trading days between the #1 and #2 and 10 days between the #2 and #3 points. To calculate the Actual or Trading days on a chart use the Day Offset Tool. Days “Up” and “Down” Another statistic used along side formations and other theories is the day up and down calculation. This calculation determines how many days, in a defined set of price bars, were “up” or “down”. A day is considered an “Up Day” if the close is higher than any previous close in the set of price bars selected. Conversely a day is considered a “Down Day” if the close is lower than any previous trading day in the defined set of price bars. This statistic is available in Track n Trade Pro when using the Day Offset Tool. Track ‘n Trade Pro 4.0 User Manual 123 Advanced Charting Tools Day Offset Tool The Day Offset Tool enables you to measure the number of trading days vs. actual days that expired between two points on the chart. Also calculated on this tool is the number of days that the market closed up or down in comparison with the previous day. 1. 2. 3. Charting a Day Offset: Select the Day Offset Tool from the Toolbox. This tool is drawn like a line. Left click for the left point. Move the mouse to the right position and left click to finish. Resizing the Day Offset: Select by clicking on it. Note: The drawing is selected when boxes appear on the corners. 2. Click on one of the boxes to drag the select point and release the mouse button. 1. Moving the Day Offset: Select the drawing by clicking on it continue holding down the mouse button, drag to the new location and release the mouse button. Deleting the Day Offset: Select the drawing by clicking on it and press the delete key on your keyboard to remove. Or, right-click on the tool and select Delete from the popup menu. Track ‘n Trade Pro 4.0 User Manual 124 Advanced Charting Tools Changing the Properties of a Day Offset: Right-click on the Day Offset drawing to view the properties menu. Properties that can be changed are: Foreground: Changes the line color of the Day Calculator. Line Thickness: Changes the thickness of the Day Calculator Line. Choose values from 1-6. Line Style: Changes the line style of the Day Offset lines. Choose from solid, dashed, dotted and more. Font: Changes the Font, Size, Style, and Color of the Day Calculator numbers. Show Text: Select to view or hide the Day Calculator numbers. Send to Back: Changes the layer of the tool. This option is used when more than one tool is in the same area of the chart. Click on Send to Back when you need to access a tool under the Day Calculator drawing. Delete: Select to delete tool. Example of the Day Offset Tool in Track ‘n Trade Track ‘n Trade Pro 4.0 User Manual 125 Advanced Charting Tools Rounded Top & Bottom Formations The Rounded Top & Bottom Formation is a very gradual change in trend. This formation includes: Rounded Top & Bottom, Double Top & Bottom, & Triple Top & Bottom. Rounded Top The Rounded Top Formation consists of a gradual change in trend from up to down. Rounded Bottom The Rounded Bottom Formation consists of a gradual change in trend from down to up. This formation is the exact opposite of a Rounded Top Formation. Double Top This formation includes two distinct “tops” and anticipates a change in trend from up to down. Track ‘n Trade Pro 4.0 User Manual 126 Advanced Charting Tools Double Bottom This formation includes two distinct “bottoms” and anticipates a change in trend from down to up. This formation is the exact opposite of a Double Top. Triple Top This formation includes three distinct “Tops” and anticipates a change in trend from up to down. Triple Bottom This formation includes three distinct “Bottoms” and anticipates a change in trend from down to up. This formation is the exact opposite of a Triple Top. Track ‘n Trade Pro 4.0 User Manual 127 Advanced Charting Tools Arc Tool To illustrate a Rounded Top/Bottom Formation on your futures chart, use the Arc Tool in the Advanced Charting Toolbar. 1. 2. Drawing a Rounded Top Formation: Select the Arc Tool from the Toolbox. Left click your mouse on the left side of the arc and drag the mouse to the right side, release mouse to place tool. Resizing the Arc Drawing: Select the arc by clicking on it. Note: The tool is selected when boxes appear on the corners of the drawing. 2. Click on one of the boxes to drag the select point and release the mouse button. Moving the Arc Drawing: Select the arc by clicking on it and drag to the new location and release the mouse button. 1. Deleting the Arc Drawing: Select the arc by clicking on it and press the Delete key on your keyboard. Or, right-click on the drawing and select the Delete option on the popup menu. Track ‘n Trade Pro 4.0 User Manual 128 Advanced Charting Tools Changing the Properties of an Arc Drawing: Right-click on the tool to view the properties menu. Properties that can be changed are: Foreground: Changes the line color of the arc. Line Thickness: Changes the thickness of the arc line. Choose values from 1-6. Line Style: Changes the line style of the arc line. Choose from solid, dashed, dotted and more. Send to Back: Changes the layer of the tool. This option is used when more than one tool is in the same area of the chart. Click on Send to Back when you need to access a tool under the Arc Tool Drawing. Delete: Select to delete the tool. Example of the Arc Tool in Track ‘n Trade: Track ‘n Trade Pro 4.0 User Manual 129 Advanced Charting Tools Track ‘n Trade Pro 4.0 User Manual 130