1
Web Based Version
User Guide
Version 1.1
Web Based Version
Trading Platform User Guide
Copyright © 1998- 2007 Finotec Group Inc. SEC-OTCBB # FTGI
ALL RIGHTS RESERVED.
Confidentiality, Copyright Notice & Disclaimer
Finotec Disclaimer and Risk Warning
Risk Warning
Note that spot foreign exchange (also known as forex or FX) and derivatives such as options, as well as commodity futures and CFDs
are leveraged and volatile instruments. You should therefore be aware that although this type of trading may allow for substantial profit,
in certain adverse market circumstances, it may also allow for equally substantial loss.
Leverage works both ways: for or against you. Leverage trading may therefore lead you to lose your total initial margin deposit and
maintaining your positioning such cases may require that you deposit additional funds. In the event that you should fail to meet a margin
requirement, the system may automatically liquidate your position and you will be responsible for any ensuing losses. To manage
exposure and reduce risk, you can use risk-reducing strategies such as limit or stop loss orders.
Trading forex, options and futures and CFD’s is not always suitable for every investor and you should consult your financial adviser
before you start trading. Before deciding to trade currencies and other products and derivatives offered on our platform, you should
carefully consider and set your risk capital, investment goals, level of knowledge and experience. You should not trade money that you
cannot afford to lose. You should be aware of all the risks associated with forex, options, CFD, and futures trading. These include, but
are not limited to – market volatility, leverage, limited regularly protection, creditworthiness which may have deep impact on the price or
liquidity of currencies or the aforementioned financial products.
Internet Trading Risks
You should also be aware of the risks involved in utilizing an Internet-based operation trading system including – but not limited to –
failure of software, hardware, and Internet connection. Since Finotec Trading Inc. does has no control over signal power, its supply or
routing through Internet, your equipment or its connection reliability, Finotec is not responsible for communication delays, failures or
distortions when trading through the Internet. Finotec uses back-up contingency plans and systems to reduce and minimize possible
system failure occurrences.
Note that you may always trade via phone.
Accuracy of Information
The Finotec website content is subject to change at any time without notice. It sole purpose is to help traders make informed and
individual trading decisions. Finotec has implemented reasonable measures to ensure the accuracy of the information displayed on its
website. Finotec, however, does not guarantee the accuracy of this information, and is not liable for any damage or loss which may
result directly or indirectly from the site’s content or your failure to access the website, for any failure or delay in the transmission or
reception of any notifications or instructions sent via the website.
Legal Restrictions
Foreign exchange trading is available only to and from jurisdictions where sale and solicitation are lawful, and in compliance with
applicable laws and regulations in those jurisdictions. The investments and services mentioned and offered in this document and on the
Finotec website are not available to individuals residing in any country where the provision of such investments or services would be
contrary to local legislation or regulation. It is the sole responsibility of visitors to the Finotec website to make certain that the terms
comply with any local law or regulation to which they are subject.
Market Opinions
Any information contained in this documents and on the Finotec website including, but not limited to news, opinions, analyses,
forecasts, reports, research, analyses, prices, are offered as general market commentary, and do not constitute investment advice or
recommendation. Finotec is not liable for any damage or loss, including without limitation, any loss of profit, which may result directly or
indirectly from reliance on or use of such information.
Finotec is not responsible for the accuracy of other sites' information content provided by third parties who have links to or from our
website.
Finotec does not subscribe to any dispute resolution bodies.
Finotec Trading Inc. is a fully owned subsidiary of Finotec Group Inc, whose Common Stock trades on the OTC Pink Sheets
(OTC:PINK), under the trading symbol "FTGI" and is fully reporting under the Securities Exchange Act of 1934.
Finotec Group Inc., 350 Fifth Avenue, Suite 2712, New York, NY 10118
Page 2 of 78
Web Based Version
Trading Platform User Guide
TABLE OF CONTENTS
Table of Contents ...........................................................................................................................................3
1
Finotec Corporate Information ...............................................................................................................5
1.1
1.2
2
Setting Up A New Account......................................................................................................................6
2.1
2.2
3
Registering for an Account .............................................................................................................................. 6
2.1.1
Registering for a Demo Account...................................................................................................... 7
2.1.2
Registering for a Live Account......................................................................................................... 8
Login ............................................................................................................................................................... 9
Description of The Trading Platform....................................................................................................10
3.1
3.2
3.3
3.4
3.5
3.6
3.7
4
About Finotec .................................................................................................................................................. 5
The Advantages of Finotec’s Trading Platform................................................................................................ 5
The Trading Platform..................................................................................................................................... 10
Easy Trade Pane........................................................................................................................................... 12
3.2.1
Market Orders ............................................................................................................................... 12
3.2.2
Limit Orders/Stop Loss/Take Profit................................................................................................ 13
3.2.3
Alerts ............................................................................................................................................. 13
Trading in Options ......................................................................................................................................... 14
3.3.1
Buying/Selling Options: ................................................................................................................. 15
3.3.2
Option Types ................................................................................................................................. 16
Rates Pane/Table Trade ............................................................................................................................... 19
3.4.1
Market Orders Using Table Trade ................................................................................................. 19
3.4.2
Limit Orders Using Table Trade .................................................................................................... 20
3.4.3
Trading in Options using Table Trade ........................................................................................... 22
3.4.4
Alerts using Table Trade ............................................................................................................... 23
3.4.5
Adding Products to Table Trade.................................................................................................... 24
Profile Pane................................................................................................................................................... 24
Portfolio Pane................................................................................................................................................ 25
3.6.1
Transactions Tab........................................................................................................................... 25
3.6.2
Orders Tab .................................................................................................................................... 28
3.6.3
Options Tab................................................................................................................................... 29
3.6.4
SMS Tab ....................................................................................................................................... 30
Rates Pane/Chart.......................................................................................................................................... 30
Charts and Indicators in the Finotec Trading Platform......................................................................31
4.1
4.2
Working with Charts ...................................................................................................................................... 31
4.1.1
Changing the Trading Instrument .................................................................................................. 32
4.1.2
Changing the Chart Type .............................................................................................................. 32
4.1.3
Time Scale .................................................................................................................................... 34
4.1.4
Displaying Multiple Charts Simultaneously.................................................................................... 36
4.1.5
Navigation Icons Toolbar............................................................................................................... 37
4.1.6
Saving and Loading Chart Templates ........................................................................................... 40
4.1.7
Adjusting the Chart Colors............................................................................................................. 41
4.1.8
Cursor Type................................................................................................................................... 42
Chart Types................................................................................................................................................... 44
4.2.1
Candlestick Chart .......................................................................................................................... 44
4.2.2
Bar Chart ....................................................................................................................................... 45
Finotec Group Inc., 350 Fifth Avenue, Suite 2712, New York, NY 10118
Page 3 of 78
Web Based Version
Trading Platform User Guide
4.3
4.4
4.5
4.6
4.7
5
4.2.3
Line Chart...................................................................................................................................... 46
4.2.4
Points Chart................................................................................................................................... 47
4.2.5
Histogram Chart ............................................................................................................................ 47
4.2.6
Mountain Chart.............................................................................................................................. 48
Adding Indicators........................................................................................................................................... 48
4.3.1
Adding Technical Analysis Indicators to the Chart: ....................................................................... 48
4.3.2
Adjusting the Chart Layout ............................................................................................................ 51
4.3.3
Changing the Settings of Indicators:.............................................................................................. 52
Setting Alerts on the Charts .......................................................................................................................... 52
Commonly Used Indicators ........................................................................................................................... 55
4.5.1
Moving Averages........................................................................................................................... 55
4.5.2
Relative Strength Index (RSI)........................................................................................................ 56
4.5.3
Stochastic...................................................................................................................................... 57
4.5.4
Moving Average Convergence/Divergence (MACD) ..................................................................... 58
4.5.5
Bollinger Bands ............................................................................................................................. 59
Using Lines and Segments ........................................................................................................................... 61
4.6.1
Trend Lines, Support and Resistance ........................................................................................... 61
4.6.2
Drawing Trend Lines ..................................................................................................................... 62
4.6.3
Arrow Trend Lines ......................................................................................................................... 63
4.6.4
Trend Lines by Angle..................................................................................................................... 64
4.6.5
Long-term Trend Lines .................................................................................................................. 65
4.6.6
Adding Buy and Sell Signals to Your Chart ................................................................................... 65
4.6.7
Fibonacci Retracements................................................................................................................ 67
4.6.8
Line by Percentage ....................................................................................................................... 67
Patterns ......................................................................................................................................................... 68
4.7.1
Head and Shoulders (Reversal Pattern)........................................................................................ 69
4.7.2
Double Tops (Reversal Pattern) .................................................................................................... 70
4.7.3
Double Bottoms (Reversal Pattern) ............................................................................................... 71
4.7.4
Triangles (Continuation Patterns).................................................................................................. 71
Additional Menu Items...........................................................................................................................74
5.1
5.2
5.3
5.4
5.5
Configuration ................................................................................................................................................. 74
Report ........................................................................................................................................................... 74
Banking ......................................................................................................................................................... 78
News ............................................................................................................................................................. 78
Live Help ....................................................................................................................................................... 78
Finotec Group Inc., 350 Fifth Avenue, Suite 2712, New York, NY 10118
Page 4 of 78
Web Based Version
Trading Platform User Guide
1 Finotec Corporate Information
Established in 1998, Finotec has become a leader in the world of real-time Internet currency and
commodities trading. Finotec is fully owned by Finotec Group Inc. (registered on the NASDAQ) which
provides retail customers access to the largest financial markets.
1.1 About Finotec
Finotec offers a real-time online trading platform operating 24 hours a day and powered by the group’s
centralized financial market dealing room.
Finotec is the market-making arm of the corporation, and distributes live and instantaneously executable
trading prices in global currencies, indices, commodities and interest rate products through the group’s
online trading system. This includes quotations on various options and exotic options products.
Our mission is to offer our clients the best trading platform and an exemplary service at low costs, as well as
low margin requirements with total safety of funds. We offer real-time prices in Currencies, Commodities,
Options, CFD’s and Stocks on all major indices, all on the same platform with the most competitive spreads
in the market.
Finotec's professional staff is available from Sunday through Friday 14:00 GMT in order to answer questions
and provide assistance to its customers and partners. Finotec’s clients and partners can benefit from a wide
range of resources including market analysis and research, real time charts and news alerts by SMS. We
also offer full support for VIP clients.
1.2 The Advantages of Finotec’s Trading Platform
Instant order execution. Orders placed on the Finotec software are executed immediately online.
Traders can also place stops or limits on open positions or have them pre-set on market orders.
Optimum Compatibility and performance. The Finotec Trading Platform takes only a few minutes to
download and install and will perform flawlessly on any Windows operating system.
Ensured SSL protocol for your security protection.
Customizable Trading Window. Add only the products you wish to trade and view live prices for.
Select from a list of leading currency pairs, equities and commodities.
Real-time account and margin information. Your account balance, usable margin, and value of open
positions are displayed in the trading software in real-time.
Real-time Charts, News and Quotes. Finotec’s Trading Platform software has charts, news, and
quotes that are easily accessible from the menus.
Multiple order types supported. Traders can initiate a position with a Market order, a Limit order, or a
Stop order. Positions can be closed with a Stop, Limit, At-the-market, or Trailing stop order.
Service and Support. Finotec clients have access to 24 hour technical support, as well as 24 hour
trading by telephone or chat.
Finotec Group Inc., 350 Fifth Avenue, Suite 2712, New York, NY 10118
Page 5 of 78
Web Based Version
Trading Platform User Guide
2 Setting Up A New Account
This chapter will explain the procedures for setting up a new account and logging into the Trading Platform.
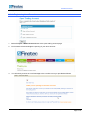
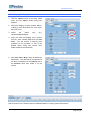
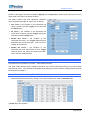
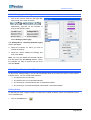
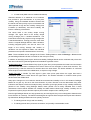
2.1 Registering for an Account
Enter your details as shown below on the Finotec.com home page in order to register for a new account and
click Join.
Enter your
details here
Your browser will open up the Open Trading Account page of the Finotec web-site.
Finotec Group Inc., 350 Fifth Avenue, Suite 2712, New York, NY 10118
Page 6 of 78
Web Based Version
Trading Platform User Guide
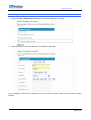
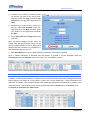
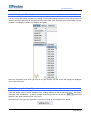
2.1.1 Registering for a Demo Account
1. Select the Open a Demo Account button at the open trading account page.
2. Your browser will acknowledge the opening of your demo account.
3.
You will shortly receive an e-mail message to the e-mail account you provided as follows:
Finotec Group Inc., 350 Fifth Avenue, Suite 2712, New York, NY 10118
Page 7 of 78
Web Based Version
Trading Platform User Guide
2.1.2 Registering for a Live Account
1. Select the Open a Standard Account button at the open trading account page.
2. Follow the on-line instructions and enter your details as requested.
Upon completion of the account registration process you will be ready to trade using the Finotec Trading
Platform.
Finotec Group Inc., 350 Fifth Avenue, Suite 2712, New York, NY 10118
Page 8 of 78
Web Based Version
Trading Platform User Guide
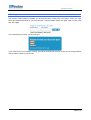
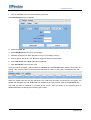
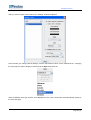
2.2 Login
The Finotec Trading Platform software can be launched from Finotec.com home page. Enter your User
Name and Password exactly as you have received it (noting whether letters are upper case or lower case)
and click Login.
You will be asked to choose your account type.
If you have input your information correctly, you will be connected to the main screen of the Trading Platform
and are ready to trade in your account.
Finotec Group Inc., 350 Fifth Avenue, Suite 2712, New York, NY 10118
Page 9 of 78
Web Based Version
Trading Platform User Guide
3 Description of The Trading Platform
This chapter will provide a basic description of the Trading Platform as well as explain how to trade using the
Beginner’s View of the Trading Platform.
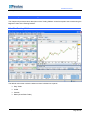
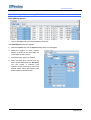
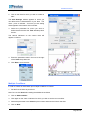
3.1 The Trading Platform
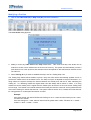
The default main screen under the advanced view is divided into 4 panes:
Easy Trade
Profile
Portfolio
Rates (Chart/Table Trade)
Finotec Group Inc., 350 Fifth Avenue, Suite 2712, New York, NY 10118
Page 10 of 78
Web Based Version
Trading Platform User Guide
The Finotec Trading Platform is a Windows-based
tool, with a standard set of menus. The various
menus will be described below in the user manual.
Each of the panes on the screen can be expanded
by clicking on the Maximize arrow in the upper righthand corner of the pane, as shown. Alternatively,
you can expand the pane by double clicking on the
title bar of the pane.
The expanded pane can be restored to normal size by double clicking once again or by clicking the Restore
arrow in the upper right-hand corner of the pane.
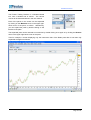
Thus for example, a screen displaying only the instrument chart of the Rates pane after it has been fully
expanded will appear as follows:
Finotec Group Inc., 350 Fifth Avenue, Suite 2712, New York, NY 10118
Page 11 of 78
Web Based Version
Trading Platform User Guide
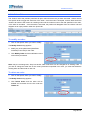
3.2 Easy Trade Pane
Trades are placed from either the Easy Trade pane
or the Table Trade tab under the Rates pane.
The Easy Trade pane can display up to six trading
instruments when fully expanded vertically.
To change the instrument on display:
1. Click on the
instrument.
currently
displayed
trading
2. Select a new instrument from the relevant menu
that appears as shown:
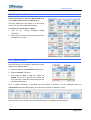
3.2.1 Market Orders
From this window, you can Buy or Sell at the current
market price ("Market Order").
1. Select an amount at the Amount drop-down list.
2. Select the Enable check box.
3. Click either the Buy or Sell box. When the
Enable check box is selected, the system will
then execute the transaction automatically at the
prevailing market price.
Once a market transaction is executed and the position is opened, it will be displayed under the
Transactions tab of the Portfolio pane, from where it can then be modified or closed.
See the section on the Portfolio pane for additional details on modifying Spot transactions.
Finotec Group Inc., 350 Fifth Avenue, Suite 2712, New York, NY 10118
Page 12 of 78
Web Based Version
Trading Platform User Guide
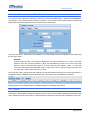
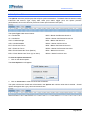
3.2.2 Limit Orders/Stop Loss/Take Profit
You can also open orders from the Easy Trade tab by clicking the Order button. (Make sure that Enable is
not selected.). This method is used to place limit orders. It can also be used to place orders in amounts not
listed under the amount drop-down list on the main Easy Trade screen.
Any Stop Loss and/or Take Profit levels entered in the Order dialog box will immediately be associated with
the new open order.
Example:
A trader wishes to have a buy position in EUR/USD. The current market price is 1.3750. The trader
wishes to have this position opened at 1.3800, and automatically closed at a loss if the sell price
reaches 1.3700 or automatically closed for a profit if the sell price reaches 1.3900. To have this
occur the trader selects Buy EUR/USD, enters 1.3800 in the “At” box, places a Stop Loss at the rate
of 1.3700 and a Take Profit at the rate of 1.3900.
As long as the order is still open but the trade has not yet been placed turning it into an open spot position, it
will appear under the Orders tab of the portfolio pane, from where it can be modified or cancelled
See the section on the Portfolio pane for additional details on modifying open orders.
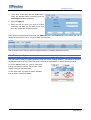
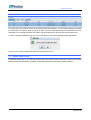
3.2.3 Alerts
The Finotec Trading platform offers the opportunity for the user to receive SMS messages sent directly to the
user’s cellular phone when the rate on a selected trading instrument reaches a point pre-defined by the user.
Finotec Group Inc., 350 Fifth Avenue, Suite 2712, New York, NY 10118
Page 13 of 78
Web Based Version
Trading Platform User Guide
1. At the Easy Trade pane click the Order button
under the desired trading instrument and the
Order/Option window will appear.
2. Select the SMS tab.
3. Enter the rate at which you wish to receive
notification via SMS and an SMS will be sent
once the market rate reaches that point.
Open SMS Alert requests are listed under the SMS Alert Tab in the Portfolio pane, from where they can be
deleted should the user wish to cancel the SMS Alert Request.
See the section on the Portfolio pane for additional details on deleting SMS Alert requests.
3.3 Trading in Options
You can trade a variety of Options products using the Finotec Trading Platform. The platform contains a
sophisticated options pricing system that offers real time price quotations on various options products.
An active Option button on currency pairs and
trading instruments indicates that Finotec offers
options trading for that instrument.
On the other hand, a grayed out button indicates
that no options trading is available.
Finotec Group Inc., 350 Fifth Avenue, Suite 2712, New York, NY 10118
Page 14 of 78
Web Based Version
Trading Platform User Guide
3.3.1 Buying/Selling Options:
1. Click the Option button in the Easy Trade
pane, and the Option trading dialog box
appears.
2. Select the category of option (Vanilla, Barrier,
or Binary) at the drop-down box in the upper
left-hand corner.
3. Select
the
option
call/put/straddle/strangle).
type
(e.g.
4. Enter the strike price/trigger price, amount
and any other variable fields and click Get
Price. You will receive a real-time price
quotation for the purchase or sale of the
desired option, along with various other
details related to the transaction.
5. Click either Sell or Buy in order to finalize the
transaction. The deal will be processed and
will then be displayed in the Options tab of
the Portfolio pane, from where it can be
closed.
See the section on the Portfolio pane for additional details on closing options transactions.
Finotec Group Inc., 350 Fifth Avenue, Suite 2712, New York, NY 10118
Page 15 of 78
Web Based Version
Trading Platform User Guide
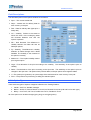
Field Descriptions
The field descriptions of the Options window are as follows:
Spot – The current market rate
Depo – Interest rate for delivery date for
each currency in the pair.
Fwd – Rate for delivery date (Spot price +
Swap rate)
Vol – Volatility. Refers to the extent to
which the return of the underlying asset
will fluctuate between now and the
option's expiration.
RR – Risk Reversal. The difference in
volatility between 25 Delta call and 25
Delta put options,
Fly – Butterfly. The difference in volatility
between 25 Delta Strangle and 0 Delta
Straddle. The butterfly is the measure of
the option's convexity.
Market Vol – The implied volatility used to
price a given option.
Vega – First derivative of the price according to the volatility. The sensitivity of the option’s price to
volatility.
Delta – First derivative of the price according to the Spot rate. The sensitivity of the option’s price to
changes in the Spot rate. Call options have positive deltas, while put options have negative deltas.
% –The option price (premium) as a percentage of the deal amount for each currency in the pair.
Price – The premium for purchasing or selling the selected option.
3.3.2 Option Types
There are three types of Options categories offered on the Trading Platform:
1. Vanilla – Call, Put, Straddle, Strangle
2. Barrier – Knock In, Reverse Knock In, Knock Out, Reverse Knock Out (Call and Put for each type)
3. Binary – One Touch, No Touch, Double One Touch, Double No Touch
All of the options can be either bought (going long) or sold (going short).
Finotec Group Inc., 350 Fifth Avenue, Suite 2712, New York, NY 10118
Page 16 of 78
Web Based Version
Trading Platform User Guide
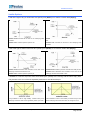
Vanilla Options
A Call is the right to buy an instrument at a specific price (Strike) on or before a certain date (Expiry).
Potential Profit: Unlimited as the level of the underlying index
Potential Profit: Limited to premium received from call's initial
increases.
sale.
Potential Loss: Limited to premium paid for call.
Potential Loss: Unlimited as the level of the underlying index
increases
A Put is the right to sell an instrument at a specific price (Strike) on or before a certain date (Expiry).
Potential Profit: Substantial and increases as the level of the
Potential Profit: Limited to premium received from initial put sale.
underlying instrument decreases to zero.
Potential Loss: Substantial and increases as the level of the
Potential Loss: Limited to premium paid for put
underlying instrument decreases to zero
A Straddle is a call and a put set at the same strike price (usually at the money) and the same expiry date.
The premium is the sum of the two separate premiums for the call and the put.
A long straddle is a bet on high volatility. It makes money if the
A short straddle is a bet on low volatility. It makes money as long
underlying instrument value moves significantly either up or down.
as the underlying instrument value does not change too much.
Finotec Group Inc., 350 Fifth Avenue, Suite 2712, New York, NY 10118
Page 17 of 78
Web Based Version
Trading Platform User Guide
A Strangle is a Call and a Put at 2 different
strike prices set with the same expiry date.
The premium is the sum of the two separate
premiums for the call and the put. A
strangle is similar to a straddle, but both
options are struck out of the money. For this
reason, a long strangle is cheaper than a
long straddle, but it requires a larger move
in the underlying instrument value to be
profitable.
Barrier Options
A barrier option functions much as a Vanilla Call or Put, but the validity of the option is conditioned by a
trigger (the Barrier rate). Setting such a barrier will reduce the option premium from that of a similar vanilla
option.
Knock In / Reverse Knock In = the option will become valid only after the rate reaches the Barrier value. If
the barrier is never reached, the option will automatically expire worthless. If the barrier is reached, the
option knocks in and its final value will depend on where the spot rate settles in relation to the strike price
much as a vanilla option would. The option premium price will be reduced as the barrier rate is set further
away from the spot rate.
Knock Out / Reverse Knock Out = the options is valid unless the rate reach the Barrier value. If the barrier
is reached, the option will automatically expire worthless. The option premium price will be reduced as the
barrier rate is set closer to the spot rate.
The difference between "Reverse Knock
In/Out" and "Knock In/Out" is where the barrier
rate is set:
For a call option - when the Barrier rate
is set above the market rate, it is a
Reverse Knock In/Out.
For a put option - when the Barrier rate
is set below the market rate it is a
Reverse Knock In/Out.
On the Trading Platform if you set the Barrier
rate on a regular barrier option as if it were for a
“reverse” barrier option, the system will notify
you that it is a reverse barrier and change the
setting accordingly.
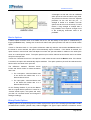
Binary Exotic Options
A Binary option is an option that gives an investor a payout if the price of the underlying asset fulfills a certain
pre-determined condition (=barrier rate), called a Trigger. This type of option allows the investor to set the
Finotec Group Inc., 350 Fifth Avenue, Suite 2712, New York, NY 10118
Page 18 of 78
Web Based Version
Trading Platform User Guide
position of the trigger, the time to expiration (Expiry) and the Pay Out the option buyer will receive from the
option seller if the option conditions are filled.
The Binary options and their respective conditions
which will qualify the trader to cash in, are as follows:
One Touch = the condition is "the instrument will
reach a specific rate (the Trigger) at any point until
the Expiry date".
No Touch = the condition is "the instrument will
never reach a specific rate (the Trigger) during the
time period until the Expiry date".
Double One Touch = the condition is "the
instrument will reach 1 of 2 Trigger rates set above
and below the current Spot rate". This is a bet on
volatility in the markets.
Double No Touch = the condition is "the
instrument will never reach either of the 2 Trigger
rates set above and below the current Spot rate".
This is a bet on stable markets.
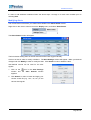
3.4 Rates Pane/Table Trade
The Rates Pane is divided into two tabs – Table Trade and Chart.
The Table Trade tab lists various trading instruments, the current market Bid and Ask price and the daily
high and low prices. The Chart tab is the graphs and charting tool for the Finotec Trading Platform and will
be discussed in Chapter 4.
3.4.1 Market Orders Using Table Trade
1. Select the desired instrument by clicking on its current market price under the Bid/Ask fields.
A Trade dialog box appears.
Finotec Group Inc., 350 Fifth Avenue, Suite 2712, New York, NY 10118
Page 19 of 78
Web Based Version
Trading Platform User Guide
2. In order to buy a currency or security, select
the amount you wish to buy from the lefthand drop-down list (Buy) and select Not
Selected for the right-hand drop-down list
(Sell).
3. Alternatively, in order to sell a currency or
security, select Not Selected for the lefthand drop-down list (Buy) and then select
your amount for the right-hand drop-down
list (Sell).
4. Enter Take Profit and/or Stop Loss levels
(optional).
Note: The system displays the pips value, the
margin used, the free remaining margin for the
account and the Maximum Unit for trading that
remains after the transaction is processed (i.e.
after taking leverage into account.
5. Click Send Deal when you are certain about the transaction, and it will be executed.
Once a market transaction is executed and the position is opened, it will be displayed under the
Transactions tab of the Portfolio pane, from where it can be modified or closed.
See the section on the Portfolio pane for additional details on modifying Spot transactions.
3.4.2 Limit Orders Using Table Trade
In addition to allowing the placement of orders at the current market rate, the Finotec Trading Platform also
allows orders to be placed at a price above or below the current market rate. These transactions are
referred to as “Orders”, and are only executed if the market rate reaches the rate specified by the user in the
order instructions. Upon execution such orders will be listed under the Orders tab of the Portfolio pane.
To execute an order from the Table Trade:
Finotec Group Inc., 350 Fifth Avenue, Suite 2712, New York, NY 10118
Page 20 of 78
Web Based Version
Trading Platform User Guide
1. Click on the Open cell of the desired trading instrument.
The Order/Option dialog box appears.
2. Select the Order tab.
3. Select Buy/Sell depending upon your strategy.
4. Stipulate the amount for either the base currency or secondary currency.
5. Enter a specific rate level in the At field to trigger the execution of the trade.
6. Enter Take Profit and/or Stop Loss levels (optional).
7. Click Send Order to execute the order.
Once the order is accepted, it will be listed in the Orders tab of the Portfolio pane where it will remain as a
waiting order until the market moves to the rate specified in the order, or the order is cancelled by the user.
When the market rate hits the rate specified in the order and the trade is executed by the system, the
position will disappear from the Orders tab and reappear as an open position under the Transactions tab.
The order can also be modified or cancelled at this screen. See the section on the Portfolio pane for
additional details on modifying and canceling open orders.
Finotec Group Inc., 350 Fifth Avenue, Suite 2712, New York, NY 10118
Page 21 of 78
Web Based Version
Trading Platform User Guide
3.4.3 Trading in Options using Table Trade
Buying/Selling Options:
1. Click on the Open cell of the desired trading instrument.
The Order/Option dialog box appears.
2. Select the Option tab, and the Option trading dialog box will appear.
3. Select the category of option (Vanilla,
Barrier, or Binary) at the drop-down box
in the upper left-hand corner.
4. Select the option type (e.g. call/put),
5. Enter the strike price, amount and any
other variable fields and click Get Price.
You will receive a real-time price
quotation for the purchase or sale of the
desired option, along with various other
details related to the transaction:
Finotec Group Inc., 350 Fifth Avenue, Suite 2712, New York, NY 10118
Page 22 of 78
Web Based Version
Trading Platform User Guide
6. Click either Sell or Buy in order to
finalize the transaction. The deal will be
processed and will then be displayed
Options tab of the Portfolio pane, from
where it can be closed.
See the section on the Portfolio pane for additional details on closing options transactions.
3.4.4 Alerts using Table Trade
The Finotec Trading platform offers the opportunity for the user to receive SMS messages sent directly to the
user’s cellular phone when the rate on a selected trading instrument reaches a point pre-defined by the user.
Setting up SMS Alert requests via Table Trade:
1. Click the Open cell of the desired trading instrument under the Table Trade tab.
The Order/Option dialog box appears.
2. Select the SMS tab, and the SMS dialog box appears.
Finotec Group Inc., 350 Fifth Avenue, Suite 2712, New York, NY 10118
Page 23 of 78
Web Based Version
Trading Platform User Guide
3. Enter the rate at which you wish to receive notification via SMS, and an SMS will be sent once the
market rate reaches that point.
Open SMS Alert requests are listed under the SMS Alert tab in the Portfolio pane, from where they can be
deleted should the user wish to cancel the SMS Alert Request.
See the section on the Portfolio pane for additional details on deleting SMS Alert requests.
3.4.5 Adding Products to Table Trade
You can add trading instruments to the list under Table Trade (as well as remove them) via the main menu
of the Trading Platform. This includes Commodities, Equities and Forex pairs.
Select an instrument to add to the list under the Table Trade tab. You can then place orders and trades in
this instrument.
Clear the check box of a previously selected instrument in order to remove it from the list under Table Trade.
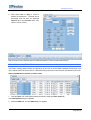
3.5 Profile Pane
The Profile pane displays basic account information:
Finotec Group Inc., 350 Fifth Avenue, Suite 2712, New York, NY 10118
Page 24 of 78
Web Based Version
Trading Platform User Guide
The information displayed includes the Account Currency, the amount in the Trust Account (the remaining
deposit amount less the margin used), the Margin used for open positions and orders, the potential profit or
loss on open positions and orders (Opened P&L), the exercised profit and loss (Closed P&L), and the equity
in the account which is the value should all positions be closed (Trust Account + Margin Used + Opened P&L
+ Closed P&L).
Clicking “Available Exposure” displays the
maximum exposure the system will allow the
trading
account
for
various
trading
instruments in the following window:
3.6 Portfolio Pane
The Portfolio pane displays the information on spot/forward positions, options transactions, open limit orders
and open SMS alerts.
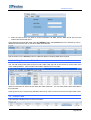
3.6.1 Transactions Tab
The Transactions Tab displays information concerning open positions, including the transaction type (Spot
or Forward), status (open/closed), the transaction value date, the trading instrument, order type (Buy or Sell),
the currency amounts, the profit and loss potential for the position at current market rates, the rate at which
the transaction was opened, the current market rate (closing rate) and any Take Profit and/or Stop Loss
points.
Rollover a position:
1. At the Transactions tab of the Portfolio pane, click on the Value Date cell of the position you wish to
rollover.
Finotec Group Inc., 350 Fifth Avenue, Suite 2712, New York, NY 10118
Page 25 of 78
Web Based Version
Trading Platform User Guide
The Rollover dialog is displayed.
2. Select the time period for which you wish to
create a forward transaction in the Forward for
drop-down box.
3. Click Rollover.
The system will update the transaction details in the
Rollover dialog window.
4. Click Confirm to finalize the transaction.
The position will then be changed to a forward
position under the Transactions tab in the Portfolio
pane.
Closing a Position
Click on the Closing Rate cell of the position ticket you wish to close in order to close an open position.
The Close Position dialog box will appear.
There are two options for closing a position – 1) Close at Market or 2) Close at the currently quoted rate.
Selecting Close at Market will result in the
position being closed at the prevailing
market rates at the time of the transaction.
Selecting Close at {rate} will result in an
instruction to close at the specific market
rate. Should the market rate change in the
interim between clicking the button and the
order being processed, then the instruction
will be cancelled.
Closed positions will remain being listed under the Transactions tab as “closed” until the value date is
reached when they will be sent to the history report.
Finotec Group Inc., 350 Fifth Avenue, Suite 2712, New York, NY 10118
Page 26 of 78
Web Based Version
Trading Platform User Guide
Modifying a Position
1. Click on the Take Profit (TP) or Stop Loss (SL) cell of the transaction.
The Close Order dialog appears.
2. Modify or enter any Take Profit and/or Stop Loss levels. Take Profit and Stop Loss levels can be
entered as a rate or as a fixed amount in the account currency. The system will automatically convert a
fixed amount into a rate quote for that instrument that corresponds to the fixed amount selected for the
TP and/or SL.
3. Select Trailing SL if you want to establish the Stop Loss as a Trailing Stop Loss.
The Trailing Stop feature allows traders to place a stop loss order which automatically updates to lock in
profit as the market moves in the trader’s favor. The Stop Loss price is adjusted as the price fluctuates. In a
rising market, the system will keep the interval between the market price and the SL after submitting the
Trailing SL. In a declining market the original Stop Loss rate always will be remain in effect. In a rising
market the current market price is higher than the market price at the time of the most recent Trailing Stop
Loss change. This results in an interval between the market price and the current SL that is greater than the
most recent Trailing SL interval that was set. The system will then set the SL to "market minus last interval"
for a long position or "market plus last interval" for short.
Example:
If the client bought 100,000 EUR/USD with Trailing SL set to 1.3350 and the market price at 1.3400.
The interval is 0.0050
If the rate changes to 1.3402, then the interval will be greater than 0.0050. Therefore SL = market –
0.0050 = 1.3402 – 0.0050 = 1.3352.
Finotec Group Inc., 350 Fifth Avenue, Suite 2712, New York, NY 10118
Page 27 of 78
Web Based Version
Trading Platform User Guide
3.6.2 Orders Tab
The “Orders” tab of the portfolio pane lists all open orders that have not yet been executed. Orders are set
at a specific level to trigger the execution of the trade. Once the order is accepted, it will be listed under the
“Orders” tab where it will remain as a waiting order until the market moves to the rate specified in the order,
or the order is cancelled. Once the trade is executed, the position will disappear from the “Orders” tab and
reappear as an open position under the “Spots” tab.
To modify an order:
1. Click on the specific order you wish to modify.
The Modify Order dialog appears.
2. Modify any of the parameters (Rate/Take
Profit/Stop Loss rate) for the order.
3. Click Modify Order and the modification to the
order will be processed.
Note: Only the exchange rate, Stop Loss and/or Take Profit levels can be changed for an existing order. If
you wish to change the order size or the currency/instrument specified in an order, you must first delete the
existing order and then enter a new one.
To delete an order:
1. Click on the specific order you wish to modify.
The Modify Order dialog appears.
2. Click Delete Order and the order will be
deleted and removed from the list under the
Orders tab.
Finotec Group Inc., 350 Fifth Avenue, Suite 2712, New York, NY 10118
Page 28 of 78
Web Based Version
Trading Platform User Guide
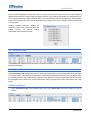
3.6.3 Options Tab
The Options tab of the portfolio pane lists all open options transactions The details listed include the trading
instrument and amount, Type, Expiry date, strike price and/or trigger price, the options premium
paid/collected, the current close out price and current open Profit and Loss (P&L).
The Option Type codes are as follows:
VC = Vanilla Call
BCRI = Barrier Call Reverse Knock In
VP = Vanilla Put
BCRO = Barrier Call Reverse Knock Out
VSG = Vanilla Strangle
BCKI = Barrier Call Knock In
VSD = Vanilla Straddle
BCKO = Barrier Call Knock Out
EOT = Exotic One Touch
BPRI = Barrier Put Reverse Knock In
ENT = Exotic No Touch
BPRO = Barrier Put Reverse Knock Out
EBR = Exotic Double No Touch (Barrier)
BPKI = Barrier Put Knock In
EUD = Exotic Double One Touch (Up or down)
BPKO = Barrier Put Knock Out
To close an options transaction:
1. Click on the desired option.
The Close Option box will appear
2. Click on Close Now in order to execute the transaction.
The option will then be closed and will be listed in the Options tab until the value date is reached. Closed
options will appear with a grey color bar instead of blue.
Finotec Group Inc., 350 Fifth Avenue, Suite 2712, New York, NY 10118
Page 29 of 78
Web Based Version
Trading Platform User Guide
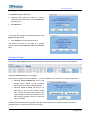
3.6.4 SMS Tab
The SMS Tab of the Portfolio pane lists all pending SMS Alert requests. The information displayed includes
the instrument, the market quote for which an alert has been requested should the instrument reach the
requested price, the date requested, the status, and the cellular phone to which the request will be sent.
In order to delete an SMS Alert request, click on the request. The following dialog window will appear.
Click on “Yes” in order to delete the SMS Alert request from the list.
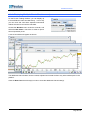
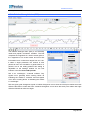
3.7 Rates Pane/Chart
For detailed information on the Chart tab of the Rates Pane and the charts functionality of the Finotec trading
platform please see the following chapter, “Charts and Indicators in the Finotec Trading Platform”.
Finotec Group Inc., 350 Fifth Avenue, Suite 2712, New York, NY 10118
Page 30 of 78
Web Based Version
Trading Platform User Guide
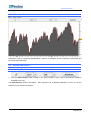
4 Charts and Indicators in the Finotec Trading Platform
Technical analysis is a method which utilizes present and historical price data in an attempt to predict future
price movements of a trading instrument. As part of its real-time Trading Platform, Finotec has included a
real-time charting package, which is available as an integrated feature on the Finotec Trading Platform.
Traders can launch real-time charts directly off the platform. The charts employ data directly from the
Finotec dealing desk, and updates dynamically in real-time. This charting tool gives you the ability to save
chart layouts for easy access, and contains over 50 technical indicators used in technical analysis. The
professional graphs and charts, with all the flexible research tools that are part of the Finotec Trading
Platform, gives the trader wishing to use technical analysis as part of the decision-making process, a
powerful toolbox. Using this toolbox, the trader can discern the structure of prices in the marketplace and
attempt to predict similar price movements in the future based upon probability and statistical analysis.
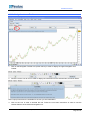
4.1 Working with Charts
The various charts and indicator tools are found in the Instrument pane of the Trading Platform. This pane
can be expanded or contracted as described previously in the user guide.
The Finotec Trading Platform offers various tools and features that can be used in order to change and
customize the charts on the platform in order to enhance your trading experience.
Finotec Group Inc., 350 Fifth Avenue, Suite 2712, New York, NY 10118
Page 31 of 78
Web Based Version
Trading Platform User Guide
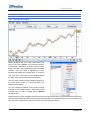
4.1.1 Changing the Trading Instrument
You can change the trading instrument by clicking on the current trading instrument, which opens a menu of
various instrument types that can be selected for the main chart. You can select from a wide variety of Forex
Crosses, Forex Majors, Equities, Commodities and CFD’s.
Select the instrument upon which you wish to do your analysis and the screen will change the displayed
chart to this instrument.
4.1.2 Changing the Chart Type
There are several types of charts available on the Trading Platform for the benefit of the user. The default
symbol that
chart type is the “Candlestick”. In order to change the chart type click on the “wrench”
appears in the upper left-hand corner of the chart.
Alternatively you can right-click anywhere on the chart to bring up the “Settings Price” button.
Finotec Group Inc., 350 Fifth Avenue, Suite 2712, New York, NY 10118
Page 32 of 78
Web Based Version
Trading Platform User Guide
After you click on either of the buttons, the “Settings” window will appear.
At this window you change various settings, such as chart element colors, for the selected chart. Changing
the chart type you wish to display is achieved via the Style drop-down list.
Select a different chart type, and the chart displayed for the current instrument will automatically change to
the new chart type.
Finotec Group Inc., 350 Fifth Avenue, Suite 2712, New York, NY 10118
Page 33 of 78
Web Based Version
Trading Platform User Guide
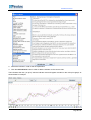
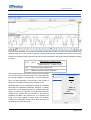
4.1.3 Time Scale
The user can change the displayed time scale of a selected chart. You can define two different parameters:
The amount of historical data to load ("Duration")
The time scale ("View") for the graph within the chart you are viewing.
The left-hand drop-down box changes the duration of the horizontal axis at the bottom of the chart.
You can also resize the horizontal scale by holding down the left mouse button on the horizontal time-scale,
and moving the mouse to the left or to the right.
Duration defines the quantity of data you wish to load. For instance, if you wish to have 2 years of quotations
loaded into your chart should select "2 Years" in the left-hand drop-down box.
Changing the trading instrument will not affect the selection in terms of the duration.
Your duration selection directly impacts the time it takes for the program to load the necessary data: 1 day of
quotations will obviously take less time to load than 5 years of quotations.
Note: You can also select the quantity of quotes to load in terms of "units". One unit corresponds to one
trading day. 50 units therefore correspond to 50 trading days or 10 weeks of quotations.
Finotec Group Inc., 350 Fifth Avenue, Suite 2712, New York, NY 10118
Page 34 of 78
Web Based Version
Trading Platform User Guide
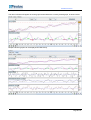
The right-hand drop-down box is used to change the time-scale frequency of the quotes on the graph within
the chart. e.g. Tick by Tick, seconds, minute, X minutes, X hours, daily or weekly.
Timescale is the representation of each candlestick or bar on the chart. Changing the timescale resolution
will directly affect the meaning of each candlestick (or bar, or any other dot as per the relevant chart type that
was chosen). The timescale resolution defines the number of time units which one candlestick contains. For
instance, each candlestick will represent 5 minutes of trading orders if you select "5 minutes" in the righthand drop-down box.
Calculation method: in a weekly view for instance, the open, high, low, close prices are respectively the
Monday opening, the highest, the lowest and the Friday close of each week. The volume in this mode is the
sum of the volumes of the 5 trading days of each week.
Changing timescale resolution affects all graphs, indicators and trend lines.
Note: The timescale resolution that can be displayed in the chart is dependent upon the duration selected for
the horizontal axis. If the selected timescale for the graph is too small for the duration previously selected for
the horizontal axis, then the duration on the horizontal axis will automatically be shortened to accommodate
the newly selected shorter timescale.
You can resize the scale of the vertical axis by holding down the left mouse button on the vertical time-scale
and moving the mouse upwards or downwards.
Finotec Group Inc., 350 Fifth Avenue, Suite 2712, New York, NY 10118
Page 35 of 78
Web Based Version
Trading Platform User Guide
4.1.4 Displaying Multiple Charts Simultaneously
On the Finotec Trading Platform, you can display up
to three different charts simultaneously. In this way
you can track and view three separate instruments
without the need to re-load the chart data.
Choose the Windows menu under the chart tab, and
select the New Chart 1 check box In order to open a
second (and third) chart.
A new chart window will appear as shown:
The additional chart windows can be re-sized, adjusted and moved similar to any other window pane in the
platform.
Clear the New Chart check box(es) in order to close the additional chart window(s).
Finotec Group Inc., 350 Fifth Avenue, Suite 2712, New York, NY 10118
Page 36 of 78
Web Based Version
Trading Platform User Guide
4.1.5 Navigation Icons Toolbar
1. Click on the Navigation Toolbar icon (shown above) in order to display the upper Navigation Icon
Toolbar.
2. Place the cursor over an icon in order to display the instructions for the selected tool, as shown below.
Note: Popup instructions are available for the tool you are interested in.
3. Click on the icon in order to activate the tool. Follow the on-screen instructions in order to use the
relevant features of the selected navigation tool.
Finotec Group Inc., 350 Fifth Avenue, Suite 2712, New York, NY 10118
Page 37 of 78
Web Based Version
Trading Platform User Guide
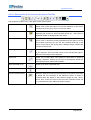
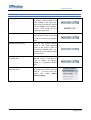
4.1.5.1 Description of the Icons on the Upper Tool Bar
The navigation toolbar icons on the upper toolbar are as follows:
Cursor Mode (Default)
This icon corresponds to the Standard Mode, which is selected by
default. Click on the left button of the mouse wherever on the charts,
hold down and move your cursor to move the charts.
Alerts
Allows you to create an alert. Click on the icon and then in the chart
displaying the security for which the alert will be set. See below for
additional details on setting alerts in the charts.
Zoom Mode
Click on the chart to set the first date of the time-period on which you
wish to zoom in. Move the mouse rightwards and click again to set the
second date. Note that you can use the horizontal scroll bar at the
bottom of the chart to see quotes from a different range of dates with
the same zoomed view.
Draw Segments
Allows you to draw segments. Click on the chart to define the first point
of your segment. Then move the mouse cursor and left-click again to
define the second point of the segment.
Draw Lines
Allows you to draw lines. The method to draw lines is similar to
drawing a segment. Clicking on the chart to successively define two
points through which the line will be drawn.
Draw Horizontal Lines
Allows you to draw a horizontal line.
Draw Vertical Lines
Allows you to draw a vertical line.
Fibonacci Retracements
Select the Fibonacci levels icon and left-click on two points in the chart
to define the two extremes of the Fibonacci levels. A series of
horizontal lines are drawn at the Fibonacci levels of 0.0%, 23.6%,
38.2%, 50%, 61.8% and 100% of the trend line. Fibonacci levels can
be customized using the" Editing an Object" feature.
Finotec Group Inc., 350 Fifth Avenue, Suite 2712, New York, NY 10118
Page 38 of 78
Web Based Version
Trading Platform User Guide
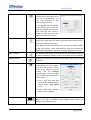
Text Mode
Clicking on the icon allows you
to add text on the charts. Once
the icon is pressed down, you
can click anywhere on the
charts to type your text.
A text window will automatically
open, allowing you to enter the
text and to select the text's font,
size, style and color. Click on
Close to place the text in the
desired location on the chart.
Copy an Object
Allows you to make a copy of a line or text element on your chart.
Simply click on the object you wish to copy and click anywhere else on
the chart to paste the new object
Note: When you have selected this icon, as well as the Move, Delete
or Edit icons and the cursor approaches an object on the chart, this
object will be highlighted in light blue, indicating readiness to select it.
Move an Object
The button is very similar to the previous one, but instead of copying
an object, the same procedure will move any object you have selected.
Delete an Object
Select this icon and then click on any chart object (text or line) in order
to delete it.
Editing an Object
Allows you to change the
characteristics of a chart object,
such as a text element or a line.
Click on the object you wish to
modify, and the Settings
window opens. This will enable
you to modify the characteristics
of the object:
Text - style, font, size and
color (screen example shown
above under Text Mode
icon);
Lines - width, color, style and
limits (shown opposite).
Color Selection
Click on this icon to change the object color prior to placing a new
object in the chart. This feature is very useful to draw support and
resistance with different colors.
Finotec Group Inc., 350 Fifth Avenue, Suite 2712, New York, NY 10118
Page 39 of 78
Web Based Version
Trading Platform User Guide
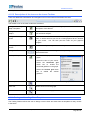
4.1.5.2 Description of the Icons on the Lower Toolbar
There are additional customization and navigation icons on the lower tool bar below the chart:
The toolbar icons on the lower toolbar are as follows:
Saving and Loading
Graph Templates
See the section on saving and loading template charts below for a full
description of this feature.
Adding Elements to
Graphs
Click on this icon, in order to access a library tools that can be used in
your technical analysis.
Saving and Printing
Charts
Click on this icon and set the width and height of the image of the
chart. It will be saved to your PC as a .PNG graphics file at a location
of your choice. You can then print the chart via your graphics
program.
Save your present
studies
This functionality is non-operational at the present moment.
Change the Time Period
Drag the bar in order to change the time period you wish to view on
the horizontal axis.
Set Graph Properties
Click to set the properties of the
graph.
Select the color of your choice.
Select the Horizontal grid
check box to enable the
horizontal gridlines on the graph.
Select the Vertical grid check
box to enable the vertical
gridlines.
Default Optimized Scale
Click on to return to the optimized view of the graph.
Zoom Out
Click to zoom out on the graph.
Zoom In
Click to zoom in on the graph.
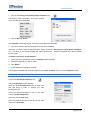
4.1.6 Saving and Loading Chart Templates
The Trading Platform allows the user to design custom charts and save them as templates for easy access
in the future.
Finotec Group Inc., 350 Fifth Avenue, Suite 2712, New York, NY 10118
Page 40 of 78
Web Based Version
Trading Platform User Guide
1. Click on the Saving and Loading Graph Templates icon.
The following menu will appear. This menu contains
any previously saved templates.
2. Click on Save or delete.
The Template window will appear. Previously saved templates are listed.
3. Type in the name of the new template in the box and click Save.
Whenever you want to load the template again, simply click on the Saving and Loading Graph Templates
icon. The name of your saved template will appear in the menu. Select the template and it will be loaded
into the graph.
To delete a previously saved template:
1. Follow the above procedures until the Template window appears.
2. Select the template you wish to delete.
3. Click Delete.
4. Press OK at the confirmation request.
The template is deleted and no longer appears on the Save or delete menu nor in the Template window.
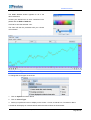
4.1.7 Adjusting the Chart Colors
Click on the Set Graph Properties icon.
The Chart Settings window appears.
Select the desired Background color for both even
and odd days in order to change the chart
background color.
Select the desired background color of the chart
indices in Scale Background.
Select the desired Text color.
Select the desired text color for the text on the chart
scale text in Scale text.
Finotec Group Inc., 350 Fifth Avenue, Suite 2712, New York, NY 10118
Page 41 of 78
Web Based Version
Trading Platform User Guide
The Color Choice window appears for all of the
above selections.
Choose your desired color or set a customized color
palette with the HSB or RGB tabs.
Click OK to save the selected color.
The chart will then be presented with your chosen
color scheme:
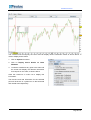
4.1.8 Cursor Type
To change the cursor type on the chart:
1. Click on Options as shown above
2. Click on Cursor Type.
3. Select your preferred cursor to display on the charts – Circles, a vertical Line, Crosshair or None.
A Crosshair will display as crossed vertical and horizontal red lines as shown below:
Finotec Group Inc., 350 Fifth Avenue, Suite 2712, New York, NY 10118
Page 42 of 78
Web Based Version
Trading Platform User Guide
The crosshair lines accompany the cursor and can display various instrument values as shown above. In
order to display these values:
1. Click on Options as shown.
2. Click on Display Cursor Details on Chart
Windows.
3. Locate the crosshair at any point in the chart and
the screen will display the relevant information
for that point on the chart, as shown above.
Clear this check-box in order not to display this
information.
The time-line and rate information for the selected
point will be shown in a yellow box on the horizontal
and vertical axes respectively.
Finotec Group Inc., 350 Fifth Avenue, Suite 2712, New York, NY 10118
Page 43 of 78
Web Based Version
Trading Platform User Guide
4.2 Chart Types
There are several types of charts available on the Trading Platform.
“Candlestick”.
The default chart type is the
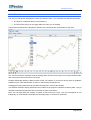
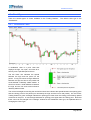
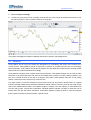
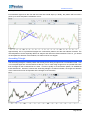
4.2.1 Candlestick Chart
A candlestick chart is a price chart that
displays the high, low, open, and close for a
security over a specified period of time.
The thin black line indicates the spread
between the high and low prices for the
period. A long line shows a large difference
between the high and low for the period and
would indicate a relatively volatile market. A
short line shows a small difference between
the high and the low and would indicate a
relatively stable market.
The colored rectangle surrounding the vertical thin black line indicates the spread between the opening price
and the closing price for the period (not necessarily the high and the low for that period). On the Finotec
Trading Platform a green rectangle indicates an opening price lower than the closing price showing upward
movement in the price. A red rectangle indicates an opening price higher than the closing price. Note that
these colors can be changed in the “Settings” window for the Candlestick chart type, as explained above in
Changing the Chart Type.
Finotec Group Inc., 350 Fifth Avenue, Suite 2712, New York, NY 10118
Page 44 of 78
Web Based Version
Trading Platform User Guide
A longer rectangle indicates a large difference between the opening and the closing prices, while a short
rectangle indicates a smaller change in price for the time period.
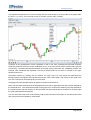
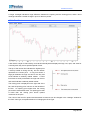
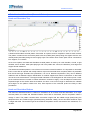
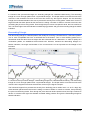
4.2.2 Bar Chart
A bar chart is a style of chart used by some technical analysts that displays the high, low, open, and close for
a security each day over a specified period of time.
The top of the vertical line indicates the highest price
a security traded at during the day, and the bottom
represents the lowest price. A long line shows a
large par between the high and low for the day and
would indicate a relatively volatile market. A short
line shows a small par between the high and the low
and would indicate a relatively stable market.
The closing price is displayed on the right side of the
bar, and the opening price is shown on the left side of
the bar. An opening price higher than the closing
price shows a downward trend. An opening price that
is lower than the closing price shows upward
movement in the price.
The colors of the bars for upward and downward movements can be changed in the “Settings” window for
the “Bar” chart type, as explained above in Changing the Chart Type.
Finotec Group Inc., 350 Fifth Avenue, Suite 2712, New York, NY 10118
Page 45 of 78
Web Based Version
Trading Platform User Guide
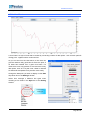
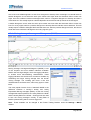
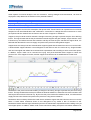
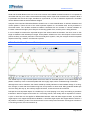
4.2.3 Line Chart
A Line Chart is a style of chart that is created by connecting a series of data points - such as each period’s
closing price - together with a continuous line.
As you can see from the chart above, a line chart can
give the reader a fairly good idea of where the price of
an asset has traveled over a given time frame. For
charts that cover long periods of time and have many
data points, such as a 10-year chart, clutter is reduced
so that trends and patterns may be seen more easily.
Change the data point you wish to display via the Data
drop-down box in the Settings window.
Select from amongst 4 different line types when
choosing a Line Chart in the Style box of the Setting
window.
Choose Line
Chart type
Finotec Group Inc., 350 Fifth Avenue, Suite 2712, New York, NY 10118
Page 46 of 78
Web Based Version
Trading Platform User Guide
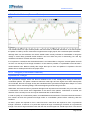
4.2.4 Points Chart
Represents price points as a series of dots on the chart.
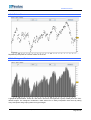
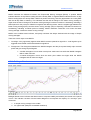
4.2.5 Histogram Chart
A graphical representation, similar to a bar chart in structure, that organizes a group of data points into userdefined ranges. The histogram condenses a data series into an easily interpreted visual chart by taking
many data points and grouping them into logical ranges.
Finotec Group Inc., 350 Fifth Avenue, Suite 2712, New York, NY 10118
Page 47 of 78
Web Based Version
Trading Platform User Guide
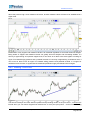
4.2.6 Mountain Chart
A Mountain Chart is a graphical representation, similar to a histogram, which condenses a data series into
an easily interpreted visual.
4.3 Adding Indicators
4.3.1 Adding Technical Analysis Indicators to the Chart:
1. Click the Add Indicator button located on the upper toolbar to open a list of the technical indicators
available to the user.
The Add Indicator window will appear.
indicator as part of technical analysis.
Each indicator has a detailed explanation on how to use the
Finotec Group Inc., 350 Fifth Avenue, Suite 2712, New York, NY 10118
Page 48 of 78
Web Based Version
Trading Platform User Guide
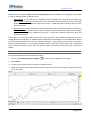
2. Select the indicator in order to see the explanation.
3. Click the Add indicator button in order to add the indicator to the current chart.
The indicators that note “(on price)” after the indicator name will appear overlaid on the main price graph, as
shown below for example.
Finotec Group Inc., 350 Fifth Avenue, Suite 2712, New York, NY 10118
Page 49 of 78
Web Based Version
Trading Platform User Guide
The other indicators will appear as a new graph located below the currently viewed graph, as shown below.
Multiple indicator graphs can be displayed simultaneously.
Finotec Group Inc., 350 Fifth Avenue, Suite 2712, New York, NY 10118
Page 50 of 78
Web Based Version
Trading Platform User Guide
4.3.2 Adjusting the Chart Layout
Switching the chart layout order
The layout order of the graphs can
be changed. Select the title of the
graph located in the upper lefthand corner and drag the mouse
until the Swap notice appears.
Let go of the mouse and the
graphs will switch order.
Maximize the graph pane
Click on the window symbol in the
upper left-hand corner of the chart
in order to maximize an indicator
pane.
Minimize the graph pane
Click on the double window
symbol in the upper left-hand
corner of the chart in order to
minimize the indicator pane. You
will then be able to view the other
open indicators.
Deleting an indicator graph from
the charts pane
Click on the X symbol in the upper
left-hand corner of the chart in
order to delete an indicator
located in a separate indicator
pane.
Deleting an indicator from the
main Price chart
Right-click on the indicator located
on the main Price chart in order to
delete it. A pop-up menu will
appear
and
select
Delete
{Indicator Name}.
Finotec Group Inc., 350 Fifth Avenue, Suite 2712, New York, NY 10118
Page 51 of 78
Web Based Version
Trading Platform User Guide
4.3.3 Changing the Settings of Indicators:
1. Click on the “wrench” symbol in the upper lefthand corner of the chart as follows:
or
Alternatively, right-click on the indicator to
bring up the following menu:
or
Select Settings {Chart Type}.
The Settings-Price or Settings-{Indicator Type}
window will appear.
2. Select the indicator for which you wish to
change the settings.
3. Adjust the various settings accordingly and
then press Close.
Note: You can also delete the selected indicator
from the graph using the Settings window. Select
the indicator you wish to remove from the chart
and click Delete.
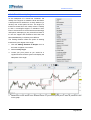
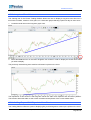
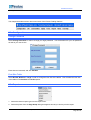
4.4 Setting Alerts on the Charts
On the Finotec Trading Platform you can set user-defined alerts on the main price chart or on the various
indicator charts. You can create alerts based on:
The specific price of a security.
The specific price of a customized indicator.
The crossing of a customized line with a customized indicator.
The crossing of a customized indicator with another customized indicator.
Setting Alerts
An alert may be either a single condition or based upon multiple conditions (which were listed above) that
occur simultaneously.
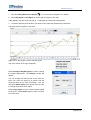
1. Click on the Alerts icon.
Finotec Group Inc., 350 Fifth Avenue, Suite 2712, New York, NY 10118
Page 52 of 78
Web Based Version
Trading Platform User Guide
2. Click on the chart for which you wish to create an
alert.
The Alert Settings window appears in which you
can define all the characteristics of your alert. The
chart – price or indicator - for which you are setting
alerts appears at the bottom of this window.
3. Select the parameter for which you wish to
define the alert level at the Time unit drop-down
list box.
The various indicators on the current chart will
appear on this list:
4. Enter the parameter value in the box to the right
of the Value drop-down box.
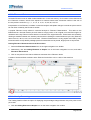
5. Click New to save the alert.
Multiple Conditions
In order to create an alert based upon multiple conditions or criteria:
1. Set the first condition as per above.
Note: Do not click New before setting the additional conditions
2. Click on Add condition.
3. Click again on the chart or indicator for which you wish to set the next condition.
4. Select the parameter in the Value drop-box shown and enter the limit for the alert.
5. Click on New.
Finotec Group Inc., 350 Fifth Avenue, Suite 2712, New York, NY 10118
Page 53 of 78
Web Based Version
Trading Platform User Guide
In order to add additional conditions follow the above steps 1 through 4 for each new condition prior to
selecting New.
Modifying Alerts
The current status of the alerts you created are available in the Alerts Status window.
Right-click on the chart in order to launch the Display menu, and select Alerts Status.
The Alerts Status window will appear.
The list includes waiting alerts as well as those that have been triggered already.
Click on an alert in order to modify or delete it. The Alert Settings window will appear. Make your desired
changes and click Modify in order to modify the alert. Click Delete in order to delete the alert.
User-defined sounds can be used for the alert
signals.
1. Click on the
window and
appears:
icon in the Alert Settings
the Alert Sounds window
2. Click Search in order to locate and apply your
chosen sound file (e.g. .wav, .au, etc.) to the
various alert signals.
Finotec Group Inc., 350 Fifth Avenue, Suite 2712, New York, NY 10118
Page 54 of 78
Web Based Version
Trading Platform User Guide
4.5 Commonly Used Indicators
4.5.1 Moving Averages
Moving averages are one of the most popular and
easy to use tools available to the technical analyst.
They smooth a data series and make it easier to spot
trends, something that is especially helpful in volatile
markets. They are useful in highlighting a trend
because they display the average price of a security
at a given time. They also form the building blocks
for many other technical indicators and overlays.
You can place multiple moving average indicators on
the price chart, based on various different time
periods or parameters.
You can change the settings of the moving average
indicator at the Settings window. Select the moving
average type you wish to display via the Method
drop-down box.
When the short moving average rises above the long moving average there is an upward trend and when the
short moving average falls below the long moving average there is a downward trend. You could equally use
only one moving average and compare it with the price for trading purposes.
Finotec Group Inc., 350 Fifth Avenue, Suite 2712, New York, NY 10118
Page 55 of 78
Web Based Version
Trading Platform User Guide
4.5.2 Relative Strength Index (RSI)
The Relative Strength Index (RSI) is an extremely
useful and popular momentum oscillator. The RSI
compares the magnitude of a stock's recent gains to
the magnitude of its recent losses and turns that
information into a number that ranges from 0 to 100.
It takes a single parameter, the number of time
periods to use in the calculation. In general this is 14
periods, but on the trading platform this setting is
adjustable at the Settings window for the RSI
indicator in the filed labeled Nbr periods.
RSI is an overbought / oversold indicator. Buy
signals occur generally when crossing below 30
indicating the market is “oversold” and sell signals
occur when crossing above 70 indicating the market
is “overbought”.
RSI also gives good divergence signals. A bullish divergence occurs when the stock price makes new lows
while the RSI fails to make new lows. A bearish divergence occurs when the stock price makes new highs
while the RSI fails to make new highs.
Finotec Group Inc., 350 Fifth Avenue, Suite 2712, New York, NY 10118
Page 56 of 78
Web Based Version
Trading Platform User Guide
4.5.3 Stochastic
The Stochastic Oscillator is a momentum indicator that shows the location of the current close relative to the
high/low range over a set number of periods. Closing levels that are consistently near the top of the range
indicate accumulation (buying pressure) and those near the bottom of the range indicate distribution (selling
pressure).
Recent Close – Lowest Low (n)
%K =
100 x (
)
Highest High (n) – Lowest Low (n)
%D =
3-period moving average of %K
(n) =
Number of periods used in calculation
The first parameter is the number of days used to calculate
%K, the second is the number of days to be considered for
the moving average of %K (generally 1 for Fast Stochastic
and 3 for Slow Stochastic), and the third is the number of
days to be considered for the moving average of %D.
Readings below 20 are considered oversold and readings
above 80 are considered overbought. However, a reading
above 80 is not necessarily bearish nor a reading below 20
bullish. A security can continue to rise after the Stochastic
Oscillator has reached 80 and continue to fall after the
Stochastic Oscillator has reached 20. It is believed that
some of the best signals occurred when the oscillator
moved from overbought territory back below 80 and from
oversold territory back above 20.
Finotec Group Inc., 350 Fifth Avenue, Suite 2712, New York, NY 10118
Page 57 of 78
Web Based Version
Trading Platform User Guide
One of the most reliable signals is to wait for a divergence to develop from overbought or oversold levels. A
bearish divergence occurs when the stock price makes new highs while the Stochastic fails to make new
highs. Once the oscillator reaches overbought levels, wait for a negative divergence to develop and then a
cross below 80. This usually requires a double dip below 80 and the second dip results in the sell signal.
A bullish divergence occurs when the stock price makes new lows while the Stochastic fails to make new
lows. For a buy signal, wait for a positive divergence to develop after the indicator moves below 20. This will
usually require a trader to disregard the first break above 20. After the positive divergence forms, the second
break above 20 confirms the divergence and a buy signal is given.
4.5.4 Moving Average Convergence/Divergence (MACD)
Moving Average Convergence/Divergence (MACD) is one
of the simplest and most reliable indicators available.
MACD uses moving averages, which are lagging indicators,
to include some trend-following characteristics. These
lagging indicators are turned into a momentum oscillator by
subtracting the longer moving average from the shorter
moving average. The resulting plot forms a line that
oscillates above and below zero, without any upper or lower
limits.
The most popular formula for the "standard" MACD is the
difference between a security's 26-day and 12-day
Exponential Moving Averages (EMAs). Of the two moving
averages that make up MACD, the 12-day EMA is the faster
and the 26-day EMA is the slower. Closing prices are used
to form the moving averages. Usually, a 9-day EMA of
MACD is plotted along side to act as a trigger line.
Note: These variables can be changed in the Finotec Trading Platform under the Settings – MACD
window.
Finotec Group Inc., 350 Fifth Avenue, Suite 2712, New York, NY 10118
Page 58 of 78
Web Based Version
Trading Platform User Guide
MACD measures the difference between two Exponential Moving Averages (EMAs). A positive MACD
indicates that the 12-day EMA is trading above the 26-day EMA. A negative MACD indicates that the 12-day
EMA is trading below the 26-day EMA. If MACD is positive and rising, then the gap between the 12-day EMA
and the 26-day EMA is widening. This indicates that the rate-of-change of the faster moving average is
higher than the rate-of-change for the slower moving average. Positive momentum is increasing, indicating a
bullish period for the price plot. If MACD is negative and declining further, then the negative gap between the
faster moving average (blue) and the slower moving average (red) is expanding. Downward momentum is
accelerating, indicating a bearish period of trading. MACD centerline crossovers occur when the faster
moving average crosses the slower moving average.
MACD is an excellent trend indicator, and partly minimizes the delays obtained with the usage of simple
moving averages.
There are 2 basic ways to use MACD:
1. Crossings: A buy opportunity appears when MACD crosses upwards its signal line. A sell signal may be
triggered when MACD crosses downwards its signal line.
2. Divergences: The divergences between the MACD histogram and the price quote identify major reversal
points and give strong buy/sell signals.
A bullish divergence occurs when stock prices make new lows while the MACD histogram
fails to make new lows.
A bearish divergence occurs when the stock price makes new highs while the MACD
histogram fails to make new highs.
4.5.5 Bollinger Bands
Bollinger Bands are an indicator that allows users to compare volatility and relative price levels over a period
of time. The indicator consists of three bands designed to encompass the majority of a security's price
movement.
1. A simple moving average in the middle
2. An upper band (SMA plus 2 standard deviations)
Finotec Group Inc., 350 Fifth Avenue, Suite 2712, New York, NY 10118
Page 59 of 78
Web Based Version
Trading Platform User Guide
3. A lower band (SMA minus 2 standard deviations)
Standard deviation is a statistical unit of measure
that provides a good assessment of a price plot's
volatility. Using the standard deviation ensures that
the bands will react quickly to price movements and
reflect periods of high and low volatility. Sharp price
increases (or decreases), and hence volatility, will
lead to a widening of the bands.
The center band is the 20-day simple moving
average. The upper band is the 20-day simple
moving average plus 2 standard deviations. The
lower band is the 20-day simple moving average less
2 standard deviations. Closing prices are most often
used to compute Bollinger Bands. Other variations,
including weighted prices, can also be used. The
length of the moving average and number of
deviations can be adjusted to better suit individual
preferences and specific characteristics of a security.
Note: These variables can be changed in the Finotec Trading Platform under the Settings – Price window
(as the Bollinger Bands indicator is overlaid on the main price chart).
In addition to identifying relative price levels and volatility, Bollinger Bands can be combined with price action
and other indicators to generate signals and foreshadow significant moves.
Double bottom Buy: A Double Bottom Buy signal is given when prices penetrate the lower band and remain
above the lower band after a subsequent low forms. Either low can be higher or lower than the other. The
important thing is that the second low remains above the lower band. The bullish indication is confirmed
when the price moves above the middle band, or simple moving average.
Double Top Sell: A Double Top Sell signal is given when prices peak above the upper band and a
subsequent peak fails to break above the upper band. The bearish indication is confirmed when prices
decline below the middle band.
Sharp price changes can occur after the bands have narrowed and volatility is low. In this instance, Bollinger
Bands do not give any hint as to the future direction of prices. Direction must be determined using other
indicators and aspects of technical analysis. Many securities go through periods of high volatility followed by
periods of low volatility. Using Bollinger Bands, these periods can be easily identified with a visual
assessment. Narrow bands indicate low volatility and wide bands indicate high volatility. Volatility can be
important for options players because options prices will be cheaper when volatility is low.
Even though Bollinger Bands can help generate buy and sell signals, they are not designed to determine the
future direction of a security. The bands were designed to augment other analysis techniques and indicators.
By themselves, Bollinger Bands serve two primary functions:
To identify periods of high and low volatility
To identify periods when prices are at extreme, and possibly unsustainable, levels.
Finotec Group Inc., 350 Fifth Avenue, Suite 2712, New York, NY 10118
Page 60 of 78
Web Based Version
Trading Platform User Guide
Other aspects of technical analysis, such as momentum, moving averages and retracements, can then be
employed to help determine the direction of the potential breakout.
4.6 Using Lines and Segments
4.6.1 Trend Lines, Support and Resistance
Technical analysis is built on the assumption that prices trend. Trend Lines are an important tool in technical
analysis for both trend identification and confirmation. A trend line is a straight line that connects two or more
price points and then extends into the future to act as a line of support or resistance.
Support is the price level at which demand is thought to be strong enough to prevent the price from declining
further. The logic dictates that as the price declines towards support and gets cheaper, buyers become more
inclined to buy and sellers become less inclined to sell. By the time the price reaches the support level, it is
believed that demand will overcome supply and prevent the price from falling below support.
Support does not always hold and a break below support signals that the bears have won out over the bulls.
A decline below support indicates a new willingness to sell and/or a lack of incentive to buy. Support breaks
and new lows signal that sellers have reduced their expectations and are willing to sell at even lower prices.
In addition, buyers could not be coerced into buying until prices declined below support or below the
previous low. Once support is broken, another support level will have to be established at a lower level.
Resistance is the price level at which selling is thought to be strong enough to prevent the price from rising
further. The logic dictates that as the price advances towards resistance, sellers become more inclined to sell
and buyers become less inclined to buy. By the time the price reaches the resistance level, it is believed that
supply will overcome demand and prevent the price from rising above resistance.
Resistance does not always hold and a break above resistance signals that the bulls have won out over the
bears. A break above resistance shows a new willingness to buy and/or a lack of incentive to sell.
Resistance breaks and new highs indicate buyers have increased their expectations and are willing to buy at
even higher prices. In addition, sellers could not be coerced into selling until prices rose above resistance or
Finotec Group Inc., 350 Fifth Avenue, Suite 2712, New York, NY 10118
Page 61 of 78
Web Based Version
Trading Platform User Guide
above the previous high. Once resistance is broken, another resistance level will have to be established at a
higher level.
Identification of key support and resistance levels is an essential ingredient to successful technical analysis.
Being aware of support and resistance levels can greatly enhance analysis and forecasting abilities. If a
security is approaching an important support level, it can serve as an alert to be extra vigilant in looking for
signs of increased buying pressure and a potential reversal. If a security is approaching a resistance level, it
can act as an alert to look for signs of increased selling pressure and potential reversal. If a support or
resistance level is broken, it signals that the relationship between supply and demand has changed.
4.6.2 Drawing Trend Lines
The technical analyst can locate behavior patterns and protruding trends on the price chart. A trend line is
formed when you can draw a diagonal line between two or more price pivot points. On the Finotec Trading
Finotec Group Inc., 350 Fifth Avenue, Suite 2712, New York, NY 10118
Page 62 of 78
Web Based Version
Trading Platform User Guide
Platform you can utilize the Draw Lines and Draw Segments icons located on the navigation icons toolbar
in order to draw trend lines on the price chart.
Up trend line: An up trend line is a straight line drawn upwards to the right along successive rate
lows. A support trend line is formed when a price decreases and then rebounds at a pivot point that
aligns with at least two previous support pivot points. Usually the technical analyst will buy at the
support trend line.
Down trend line: A down trend line is drawn downwards to the right along successive rate peaks. A
resistance trend line is formed when a price increases and then rebounds at a pivot point that aligns
with at least two previous resistance pivot points. Usually the technical analyst will sell at the
resistance trend line.
It takes two or more points to draw a trend line. The more points used to draw the trend line, the more
validity attached to the support or resistance level represented by the trend line. It can sometimes be difficult
to find more than 2 points from which to construct a trend line. Even though trend lines are an important
aspect of technical analysis, it is not always possible to draw trend lines on every price chart. The general
rule in technical analysis is that it takes two points to draw a trend line and the third point confirms the
validity.
4.6.3 Arrow Trend Lines
You can place trend lines with an arrow on the chart.
1. Click on the Adding Elements to Graphs
icon on the lower navigation icon toolbar.
2. Select Arrow.
3. Locate your pivot points as you would for a regular trend line.
4. Release the mouse button at the desired location of your second pivot point in order to position the arrow
line on the graph.
Finotec Group Inc., 350 Fifth Avenue, Suite 2712, New York, NY 10118
Page 63 of 78
Web Based Version
Trading Platform User Guide
4.6.4 Trend Lines by Angle
As the steepness of a trend line increases, the
validity of the support or resistance level decreases.
A steep trend line results from a sharp advance (or
decline) over a brief period of time. The angle of a
trend line created from such sharp moves is unlikely
to offer a meaningful support or resistance level.
Even if the trend line is formed with three seemingly
valid points, attempting to play a trend line break or
to use the support and resistance level that have
been established by it will often prove difficult.
The Trading Platform offers the option of drawing
trend lines by the degree of the angle.
1. Click the Adding Elements to Graphs icon on
the lower navigation icon toolbar.
2. Select Line by Angle.
3. Locate your pivot points as you would for a
regular trend line and the system will display the
steepness of the angle.
4. Release the mouse button at the desired location of your second pivot point in order to position the line
on the graph.
Finotec Group Inc., 350 Fifth Avenue, Suite 2712, New York, NY 10118
Page 64 of 78
Web Based Version
Trading Platform User Guide
4.6.5 Long-term Trend Lines
The charting tool of the Finotec Trading Platform allows the user to display a long-term trend line from a
time-frame of weeks, months or even years, on a short-term graph reflecting a period of days or even hours.
1. Locate the trend lines on the long-term graph view:
2. Select the Zoom In icon on the lower navigation icon toolbar in order to display the shorter time frame
you wish to display.
The previously selected long term trend line will remain in place on the chart.
The importance of this function is that long-term trends are often more important than short-term patterns.
This function allows the trader to see a fuller multi-dimensional picture of the current market trend.
4.6.6 Adding Buy and Sell Signals to Your Chart
The Trading Platform offers the option of displaying Buy and Sell signals at various price points on the chart.
Finotec Group Inc., 350 Fifth Avenue, Suite 2712, New York, NY 10118
Page 65 of 78
Web Based Version
Trading Platform User Guide
1. Click the Adding Elements to Graphs
icon on the lower navigation icon toolbar.
2. Select Buy Signal or Sell Signal in order to place a signal on the chart.
A Buy Signal is a green arrow pointing up. A sell signal is a red arrow pointing down.
3. Locate the signal(s) at the location you desire on the chart and release the mouse button.
The signal will then appear on the chart.
Right-click on the signal in order to edit the signal.
The menu shown on the right will appear:
Select Configure Buy/Sell signal in order to change
the signal’s parameters. The Settings window will
appear:
You can change the date as well as the value for
which you want the signal to be shown and the
signal will shift on the chart accordingly. You can
also select Move Signal at the above menu in order
to change the location of the signal.
Select Copy Signal in order to place another signal
on the chart. Select Delete signal in order to remove
it from the chart.
Finotec Group Inc., 350 Fifth Avenue, Suite 2712, New York, NY 10118
Page 66 of 78
Web Based Version
Trading Platform User Guide
4.6.7 Fibonacci Retracements
Leonardo Fibonacci was an Italian mathematician born in the 12th century. He is known to have discovered
the "Fibonacci numbers," which are a sequence of numbers where each successive number is the sum of
the two previous numbers. e.g. 1, 1, 2, 3, 5, 8, 13, 21, 34, 55, 89, 144, etc.
Interpretation of the Fibonacci numbers in technical analysis anticipates changes in trends as prices tend to
be near lines created by the Fibonacci studies.
A popular Fibonacci study utilized in technical analysis is Fibonacci Retracements. This refers to the
likelihood that a financial asset's price will retrace a large portion of an original move and find support or
resistance at the key Fibonacci levels before it continues in the original direction. These levels are created by
drawing a trendline between two extreme points and then dividing the vertical distance by the key Fibonacci
ratios of 23.6%, 38.2%, 50%, 61.8% and 100%. Fibonacci Retracement is a very popular tool used by many
technical traders to help identify strategic places for transactions to be placed, target prices or stop losses.
Placing Fibonacci Retracements on the Price Chart:
1. Select the Fibonacci Retracements icon on the upper navigation icon toolbar.
2. Alternatively, click the Adding Elements to Graphs icon on the lower navigation icon tool, and select
Fibonacci Retracement.
3. Click on two points in the chart to define two extremes of the Fibonacci levels.
A series of horizontal lines are drawn at the Fibonacci levels from 0.0% to 100% of the trend line.
4.6.8 Line by Percentage
The Trading Platform offers the option of displaying the percentage change between two price points on the
price chart.
4. Click the Adding Elements to Graphs icon on the lower navigation icon toolbar.
Finotec Group Inc., 350 Fifth Avenue, Suite 2712, New York, NY 10118
Page 67 of 78
Web Based Version
Trading Platform User Guide
5. Select Line by Percentage.
6. Locate your pivot points as you normally would and let go of the mouse at the desired location of your
second pivot point in order to position the lines on the graph.
The system will display the difference between the two price points in percentage terms.
4.7 Patterns
Chart patterns put all buying and selling into perspective by consolidating the forces of the market into a
concise picture. Chart patterns provide a framework to analyze a complete pictorial record of all trading.
More importantly, chart patterns and technical analysis can help determine market trends, allowing traders
and investors to position themselves accordingly.
Chart patterns are simply more complex versions of trend lines. Chart pattern analysis can be used to make
short-term or long-term forecasts. The data can be intraday, daily, weekly or monthly, while the patterns can
form over a period as short as one day or as long as many years. Some patterns may form in one trading
session, while others may require many months to form.
Two basic tenets of technical analysis are that prices trend and that history repeats itself. An uptrend
indicates a bullish market and a downtrend indicates a bearish market. However, prices do not trend forever
and as the market balance shifts a chart pattern begins to emerge. The vast majority of chart patterns fall
into two main groups: reversal and continuation. Reversal patterns indicate a change of trend and can be
broken down into top and bottom formations. Continuation patterns indicate a pause in trend and indicate
that the previous direction will resume after a period of time.
Finotec Group Inc., 350 Fifth Avenue, Suite 2712, New York, NY 10118
Page 68 of 78
Web Based Version
Trading Platform User Guide
4.7.1 Head and Shoulders (Reversal Pattern)
Head and Shoulders Top
A Head and Shoulders reversal pattern forms after an uptrend, and its completion marks a trend reversal.
The pattern contains three successive peaks with the middle peak (head) being the highest and the two
outside peaks (shoulders) being low and roughly equal. The reaction lows of each peak can be connected to
form support, or a neckline.
As its name implies, the Head and Shoulders reversal pattern is made up of a left shoulder, a head, a right
shoulder, and a neckline. Other parts playing a role in the pattern are volume, the breakout, price target and
support turned resistance.
The head and shoulders pattern is one of the most common reversal formations. It is important to remember
that it occurs after an uptrend and usually marks a major trend reversal when complete. While it is preferable
that the left and right shoulders be symmetrical, it is not an absolute requirement. They can be different
widths as well as different heights. Identification of neckline support and volume confirmation on the break
can be the most critical factors. The support break indicates a new willingness to sell at lower prices. Lower
prices combined with an increase in volume indicate an increase in supply. It can be helpful to measure the
expected length of the decline after the breakout, but don't count on this length to determine the ultimate
price target. As the pattern unfolds over time, other aspects of the technical picture are likely to take
precedence.
Head and Shoulders Bottom
The Head and Shoulders bottom is referred to sometimes as an Inverse Head and Shoulders. As a major
reversal pattern, the Head and Shoulders Bottom forms after a downtrend, and its completion marks a
change in trend. The pattern contains three successive troughs with the middle trough (head) being the
deepest and the two outside troughs (shoulders) being shallower. Ideally, the two shoulders would be equal
in height and width. The reaction highs in the middle of the pattern can be connected to form resistance, or a
neckline.
Finotec Group Inc., 350 Fifth Avenue, Suite 2712, New York, NY 10118
Page 69 of 78
Web Based Version
Trading Platform User Guide
Head and Shoulder Bottoms are one of the most common and reliable reversal formations. It is important to
remember that they occur after a downtrend and usually mark a major trend reversal when complete. While it
is preferable that the left and right shoulders be symmetrical, it is not an absolute requirement. Shoulders
can be different widths as well as different heights.
Analysis of the Head and Shoulders Bottom should focus on correct identification of neckline resistance and
volume patterns. These are two of the most important aspects to a successful read, and by extension a
successful trade. The neckline resistance breakout combined with an increase in volume indicates an
increase in demand at higher prices. Buyers are exerting greater force, and the price is being affected.
It can be helpful to measure the expected length of the advance after the breakout, but don't count on this
length to determine the ultimate price target. As the pattern unfolds over time, other aspects of the technical
picture are likely to become prominent. Technical analysis is dynamic, and your analysis should incorporate
aspects of the long-, medium- and short-term picture.
4.7.2 Double Tops (Reversal Pattern)
The double top is a major reversal pattern that forms after an extended uptrend. As its name implies, the
pattern is made up of two consecutive peaks that are roughly equal, with a moderate trough in-between.
Although there can be variations, the classic double top usually indicates an intermediate change, if not longterm change, in trend with the market turning from an up-trend to a down-trend. Many potential double tops
can form along the way up, but until key support is broken, a reversal cannot be confirmed.
Perhaps the most important aspect of a double top is to avoid jumping in too early and making a premature
transaction. Wait for support to be broken in a convincing manner, and usually with an expansion of volume.
A price or time filter can be applied to differentiate between valid and false support breaks. A price filter
might require a 3% support break before validation. A time filter might require the support break to hold for 3
days before considering it valid. The current trend is in force until proven otherwise. Until support is broken in
a convincing manner, the trend remains up.
Finotec Group Inc., 350 Fifth Avenue, Suite 2712, New York, NY 10118
Page 70 of 78
Web Based Version
Trading Platform User Guide
4.7.3 Double Bottoms (Reversal Pattern)
The double bottom is a major reversal pattern that forms after an extended downtrend. As its name implies,
the pattern is made up of two consecutive troughs that are roughly equal, with a moderate peak in-between.
Although there can be variations, the classic double bottom usually indicates an intermediate or long-term
change in trend. Many potential double bottoms can form while the price is descending, but until key
resistance is broken a reversal cannot be confirmed.
It is important to remember that the double bottom is an intermediate to long-term reversal pattern that will
not form in a few days. Even though formation in a few weeks is possible, it is preferable to have at least 4
weeks between lows. Bottoms usually take longer than tops to form and patience is important. Give the
pattern time to develop and look for the proper clues.
4.7.4 Triangles (Continuation Patterns)
Symmetrical Triangle
The symmetrical triangle, which can also be referred to as a coil, usually forms during a trend as a
continuation pattern. The pattern contains at least two lower highs and two higher lows. When these points
are connected, the lines converge as they are extended and the symmetrical triangle takes shape. You could
also think of it as a contracting wedge, wide at the beginning and narrowing over time.
While there are instances when symmetrical triangles mark important trend reversals, they more often mark
a continuation of the current trend. Regardless of the nature of the pattern, continuation or reversal, the
direction of the next major move can only be determined after a valid breakout.
In order to qualify as a continuation pattern, an established trend should exist. The trend should be at least a
few months old and the symmetrical triangle marks a consolidation period before continuing after the
breakout.
At least 2 points are required to form a trend line and 2 trend lines are required to form a symmetrical
triangle. Therefore, a minimum of 4 points are required to begin considering a formation as a symmetrical
triangle. The second high should be lower than the first and the upper line should slope down. The second
Finotec Group Inc., 350 Fifth Avenue, Suite 2712, New York, NY 10118
Page 71 of 78
Web Based Version
Trading Platform User Guide
low should be higher than the first and the lower line should slope up. Ideally, the pattern will form with 6
points (3 on each side) before a breakout occurs.
Approximately 75% of symmetrical triangles are continuation patterns and the rest indicate reversals. The
reversal patterns can be especially difficult to analyze and often have false breakouts. Even so, you should
not anticipate the direction of the breakout, but rather wait for it to happen.
Ascending Triangle
The ascending triangle is a bullish pattern that usually forms during an uptrend as a continuation trend. Two
or more equal highs form a horizontal line at the top. Two or more rising troughs form an upwards trend line
that converges on the horizontal line as it rises. In order to qualify as a continuation pattern, an established
trend should exist. However, because the ascending triangle is a bullish indication, the length and duration
of the current trend is not as important as the strength of the formation.
Finotec Group Inc., 350 Fifth Avenue, Suite 2712, New York, NY 10118
Page 72 of 78
Web Based Version
Trading Platform User Guide
In contrast to the symmetrical triangle, an ascending triangle has a definite bullish leaning. The ascending
triangle is a much stronger pattern than a symmetrical triangle. The shape itself is more technical since the
main line is the resistance line and not the trend line; that’s why the signal is sharper. On the ascending
triangle, the horizontal resistance line acts to prevent the security from moving past a certain level. It is as if a
large sell order has been placed at this level and it is taking a number of weeks or months to execute, thus
preventing the price from rising further. Even though the price cannot rise past this level, the lows continue to
rise. It is these higher lows that indicate increased buying pressure and give the ascending triangle its bullish
indication.
Descending Triangle
The descending triangle is a bearish pattern that usually forms during a downtrend as a continuation pattern.
Two or more comparable lows form a horizontal line at the bottom. Two or more declining peaks form a
downwards trend line above that converges with the horizontal line as it descends. In order to qualify as a
continuation pattern, an established trend should exist. However, because the descending triangle is a
bearish indication, the length and duration of the current trend is not as important as the strength of the
formation.
In contrast to the symmetrical triangle, a descending triangle has a definite bearish leaning. The descending
triangle is a much stronger pattern than a symmetrical triangle. The shape itself is more technical since the
main line is the support line and not the trend line; that’s why the signal is sharper.
The horizontal support line prevents the security from declining past a certain level. It is as if a large buy
order has been placed at this level and it is taking a number of weeks or months to execute, thus preventing
the price from declining further. Even though the price does not decline past this level, the highs continue to
decline. It is these lower highs that indicate increased selling pressure and give the descending triangle its
bearish indication
Finotec Group Inc., 350 Fifth Avenue, Suite 2712, New York, NY 10118
Page 73 of 78
Web Based Version
Trading Platform User Guide
5 Additional Menu Items
This chapter describes various other menu items of the Finotec Trading Platform.
5.1 Configuration
Change Password
Select Change Password in order to change your login password. You will be asked for your old password
as well as your new choice.
Enter them as instructed, and click Validate.
Font Size Table
Select Normal, Medium or Large in order to change the font size of the tables. This will affect the font size
of the tables in the Portfolio and Profile panes.
5.2 Report
1. Select the relevant report type from the report menu.
2. Select the printer from the Page Setup dialog that appears should you wish to print the report.
Finotec Group Inc., 350 Fifth Avenue, Suite 2712, New York, NY 10118
Page 74 of 78
Web Based Version
Trading Platform User Guide
Current Position
This report displays the Spot transactions.
Historical Transactions
1. Select this menu item in order to prepare a report of Spot transactions for a user selected time period.
2. Select the day, month and year at the from and to drop-down list box in order to set the report range.
3. Click Display in order to produce the report
Finotec Group Inc., 350 Fifth Avenue, Suite 2712, New York, NY 10118
Page 75 of 78
Web Based Version
Trading Platform User Guide
Historical Options
In order to produce a report for Options transactions based on a user-selected time period, repeat the same
process as for Historical Transactions above.
Orders
Select this item in order to produce a report listing Orders that were filled automatically and became Spot
transactions.
Finotec Group Inc., 350 Fifth Avenue, Suite 2712, New York, NY 10118
Page 76 of 78
Web Based Version
Trading Platform User Guide
Banking
Select from this menu to produce a report detailing transactions to the trust account, such as debits or
credits for Swap Points, Option premiums and other cash deposits or withdrawals.
Select Current for the current month’s banking report.
Select Historical in order to select a time period and produce a user-defined banking report. Repeat the
same process as for Historical Transactions above.
Position
At this menu item you can produce a report for a specific transaction. e.g. an older transaction that no longer
appears on the main windows but for which you require transaction details and for which you have the
transaction number.
Finotec Group Inc., 350 Fifth Avenue, Suite 2712, New York, NY 10118
Page 77 of 78
Web Based Version
Trading Platform User Guide
Enter the transaction number without the letter(s) preceding the number, click OK, and you will receive the
transaction report for your request.
Swaps
Select this report in order to receive a list of the current Swap Points. A “-“ shown before the amount
indicates that the user will receive Swap Rate interest on a long buy of the base currency.
5.3 Banking
This menu allows the user to deposit or withdraw funds from a Live Account.
5.4 News
In order to view the latest market analysis from Finotec, select an item from this menu:
Upon selection your browser will open to the relevant page of the Finotec web-site containing the analysis
you requested.
5.5 Live Help
Select Chat and your browser will open to the Finotec live chat help.
Finotec Group Inc., 350 Fifth Avenue, Suite 2712, New York, NY 10118
Page 78 of 78