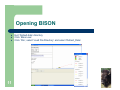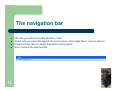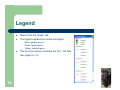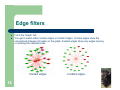
1
BISON: Bio-Interface for the Semiglobal analysis Of Network Patterns
User Manual
Christopher Besemann, Anne Denton, Nathan J. Carr, Birgit M. Prüß
North Dakota State University
BISON 1.0
2
z
BISON is a software for the analysis of transcriptional networks of regulation. It combines
a pattern mining engine with modern navigation and network visualization techniques.
z
The current default directory of data files contains data from Escherichia coli K-12.
z
BISON enables the user to load their own microarray data into the default directory to be
analyzed in the context of the network.
z
Data for other species can be loaded into BISON, constructing a new file directory.
Contacts
3
Christopher Besemann and Anne Denton
Nathan J. Carr and Birgit M. Prüß
Department of Computer Sciences
IACC 258
1301 12th Ave N
North Dakota State University
Fargo ND 58105
Phone (701) 231-6748
E-mail: [email protected]
Department of Veterinary and Microbiological Sciences
Van Es Hall 108
1523 Centennial Blvd.
North Dakota State University
Fargo ND 58105
Phone (701) 231-7848
E-mail: [email protected]
BISON 1.0
Software description
System Requirements
z
Minimum system requirements:
–
–
z
5
System: 2 GHz, 1 GB of RAM
Operating system: Windows XP
BISON might work with slower processors and other operating systems
Loading BISON
z
z
Installation is not necessary for BISON
Install Java 5.0 (or higher) on your computer
http://www.java.com
Hit ‘Download’ now and then ‘Begin Download’
z
Download the bison1.zip file from:
Source Code for Biology and Medicine
http://denton.cs.ndsu.nodak.edu/bison/
z
Extract the files into an uncompressed directory so that the original folders are preserved
Select bison1.zip and open
Right mouse click bison1 and select ‘extract’
Choose ‘All files’, hit ‘extract’
A new folder will appear on your desktop, named bison1
6
Configuration files
z
Within bison1, the single data directory (default_data) contains two configuration files:
z
Edge Color file (edgeColors.txt)
LABEL
+
+z
7
RED_VALUE
1f
0f
1f
GREEN_VALUE
0f
0f
1f
BLUE_VALUE
0f
1f
0f
ALPHA
1f
1f
1f
DOTTED/SOLID
SOLID
DOTTED
SOLID
Configuration file (bison.config)
# "E.coli" from RegulonDB and Dr. Pruess data with annotations from Pfam and Wisconsin GENE ID
ENTITYFILE
ecoli_entity.txt
ALIASFILE
ecoli_alias.txt
SYNONYMFILE ecoli_syn.txt
PATTERNFILE patterns.out
NETWORKFILE flhD_microarray.net
edgeColors.txt
NETWORKFILE regulon.net
edgeColors.txt
NETWORKFILE pruess.net
edgeColors.txt
NETWORKFILE 2component.net
edgeColors.txt
LINK http:\\www.kegg.com/dbget-bin/www_bget?eco:
ID
Data input files
z
The single data directory (default_data) contains five data input files:
–
–
–
–
–
Entity file (ecoli_entity.txt) lists nodes of the network and the set of properties for each node
Alias file (ecoli_alias.txt) specifies the default gene names for the nodes
Synonym file (ecoli_syn.txt) lists additional names for the nodes
Pattern file (patterns.out) stores the patterns of entities and properties discovered in the network
Network files (*.net): list the edges (interactions) in the network.
Please, note that the patterns.out file is generated by BISON
8
Data, regulation
Interaction data were integrated into the network files from the following sources:
Source
Interactions
Regulators
Regulated genes
RegulonDB
2,537
142
Two-comp.
1,028
Compilation
FlhD/FlhC
Total
9
Reference
File name
1,059
Salgado et al., 2006
regulon.net
40
372
Oshima et al., 2002
2component.net
1,969
26
856
Prüß et al., 2006
pruess.net
896
2
444
Prüß et al., 2003
flhD_microarray.net
6,227
186
1,934
Data, properties (annotation)
Property data were integrated into the entity file from the following sources:
Source
Annotations
Proteins
62
106
Pfam
1,032
HMMER
Total
E. coli Genome Project
10
Reference
Designation
http://www.genome.wisc.edu/
GO
2,271
http://www.sanger.ac.uk/Software/Pfam/
PF
1,747
3,124
http://hmmer.wustl.edu/
HMM
2,841
3,495
Opening BISON
z
z
z
11
Exit ‘Default.data’ directory
Click ‘Bison.exe’
Click ‘File’, select ‘Load File Directory’ and select ‘Default_Data’
The BISON interface
z
z
z
z
12
Top left page: object information page
Top right page: network visualization page
Bottom page: navigation page
Legend: click upper left X to close, go to
‘Graph’ to re-open
The navigation bar
z
z
z
z
13
File: lets you select your data directory or exit
Graph: lets you select the legend, choose a layout, select edge filters, zoom in and out
Pattern mining: lets you select the pattern mining option
Help: contains the help function
Legend
z
z
Opens from the ‘Graph’ tab
The legend explains the nodes and edges:
–
–
–
z
14
Red: regulator genes
Green: target genes
Yellow: selected gene
The four link sources resemble the four *.net files
(see pages 8 + 9)
Layout options
z
z
From the ‘Graph’ tab
You get to select either the Fruchterman-Reingold (FR) layout or the circle layout
FR layout
15
Circle layout
Edge filters
z
z
From the ‘Graph’ tab
You get to select either context edges or incident edges. Context edges show the
connections between all nodes on the graph. Incident edges show only edges leaving
or entering the selected node.
Context edges
16
Incident edges
Zoom
z
Select ‘Zoom’ from the ‘Graph’ tab
z
On the bottom panel of the Satellite
Viewer, you can choose between ‘zoom in’
and ‘zoom out’
z
The white window lets you navigate within
‘Satellite Viewer’ to select your view area
z
This function is particularly useful for
networks that contain many nodes. Please
note, that it will be slower then
17
Pattern mining
z
Copy the patterns.out file to a backup file (see page 8)
z
Select ‘Pattern mining’ from the ‘Graph’ menu
–
–
–
–
Choose minimum pattern occurrence (this is your cutoff for meaningfulness of patterns)
Choose sub-graph file (1-edge indicates two proteins, 2-edge indicates three proteins)
Selecting ‘Compute Significance’ will run a Chi-squared test on the patterns (this takes
about an hour)
Hit ‘Compute’
z
BISON will now run the pattern library and calculate a new patterns.out file
z
You will have to reload the data
18
Resizing the pages
z
19
Left click and drag the border lines of the network visualization page
Gene-centered analysis
z
z
Select the ‘Genes’ tab in the navigation page
Use the ‘Find’ option to find your gene of
interest. Click ‘Select in graph’
z
Top left screen: the object information page
will be the gene information page
Top right screen: network visualization page
Bottom screen: navigation page
z
z
20
Navigation page
z
21
The two tabs are for gene-centered and pattern-centered analysis
Network visualization page
z
z
z
z
z
22
Yellow node in center: selected gene
Red nodes: genes that serve as regulators
Green nodes: genes that serve as regulated genes
Red solid arrows: positive regulation
Blue dotted arrows: negative regulation
Please note: for regulators that affect the
expression of a large number of genes, you will need to
use the gene lists in the gene information page for your
analysis (see next page). Also, use the ‘Zoom’ function.
Gene information page
z
z
z
23
Indicates properties that are associated with the
proteins that are encoded by the selected gene
Click the link for more information about this gene.
You will connect to an external data source
Lists all the target genes and the regulator genes
of the selected gene. Selecting the link for any one
of these genes will re-form the network
visualization page around this gene
Pattern-centered analysis
z
z
Select the ‘Patterns’ tab
Use ‘Filter Patterns’ option to type in your
property of interest. This can be a gene name,
an HMM or other property (PF, GO). Click
‘Filter Patterns’
z
Top left screen: the object information page
will be the gene information page
Top right screen: network visualization page
Bottom screen: navigation page
z
z
24
Navigation page (I)
z
The ‘Descriptor’ column lists properties that are found in your gene, as well as in
the genes that your gene product regulates:
–
–
z
The ‘Links’ column indicates the regulation:
–
–
z
25
(0) indicates properties found in the regulator
(1) indicates properties found in the regulated genes
(+) positive regulation
(-) negative regulation
The p-values are from the Chi-squared test
Navigation page (II)
z
26
Select a line from the ‘Descriptor’ column
Navigation page (III)
z
The right portion of the navigation page now
contains two gene lists:
–
–
27
Gene 0: your gene of interest, encodes regulator
Gene 1: all the genes that are regulated by your
regulator and whose encoded proteins contain the
property that is listed in the selected line of the
‘Descriptor’ column and indicated with (1). This
combination of properties is blue on the last slide.
Pattern information page
z
Select a line from the ‘Descriptor’ column
z
The object information page will be the pattern
information page. It indicates the patterns
involved in this regulation (we suggest you resize
the pages to get the best view at the pattern
information page):
–
–
–
–
28
Gene 0: selected gene, encodes regulator
Descriptors 0: properties found in the regulator
Gene 1: target genes of the regulator
Descriptors 1: properties found in the proteins that
are encoded by the regulated genes
You can select the Table and use ‘CTRL C’ to copy the table into a
Microsoft Office document.
Network visualization page
z
Select a line in the ‘Gene’ column of the
navigation page
z
The network visualization page will re-arrange
around this new gene
z
The object information page will switch to the
gene information page and provide you with
the information for your newly selected gene
29
Your own data
Your own data
z
In addition to the network that is provided with BISON, you can add your own data
z
Download detailed instructions from:
–
31
http://denton.cs.ndsu.nodak.edu/bison/
Adding a microarray experiment
z
If you just want to add your own microarray experiment with E. coli K-12 and analyze it
in the context of the network, add another network file (*.net) to the default_data
directory in the following format (the first column is the regulator gene, the second the
regulated gene). You can collect the data in Excel, save it as a tab delimited txt file
and change .txt to .net manually:
b1892
b1892
b1892
b1892
b1892
b1892
b1892
b1892
b1892
b1892
b1892
b1892
32
b0019
b0020
b0030
b0032
b0033
b0036
b0037
b0059
b0064
b0066
b0069
b0070
+
+
+
+
+
+
+
+
+
+
z
Add the name of your *.net file to the bison.config file
z
Then load the default_data directory into BISON
Adding a new network to BISON
z
If you want to add a whole other organism:
z
Create a new directory (New_data)
z
The new data directory will need five data files (see page 8)
–
–
–
–
–
z
The new data directory will also need two configuration files (see page 7)
–
–
33
Entity file: lists each object (node) in the network
Alias file: lists the names each object should be known by
Synonym file: lists additional names objects may be known by
Pattern file: contains information gathered by pattern mining routines
Network file: lists the edges in the network
Edgecolor file:colors edges in the network
Configuration file: lists all the files the network builds upon
Entity file
z
Lists each node that may be in the network
b0001 GO:0009308=amine_metabolism
GO:0044249=cellular_biosynthesis
GO:0006519=amino_acid_and_derivative_metabolism
GO:0044271=nitrogen_compound_biosynthesis
GO:0006082=organic_acid_metabolism
b0002 GO:0016301=kinase_activity
GO:0019538=protein_metabolism
GO:0016774=phosphotransferase_activity,_carboxyl_group_as_acceptor
hmm.homoserine_dh
GO:0000287=magnesium_ion_binding hmm.nad_binding_3
GO:0003959=NADPH_dehydrogenase_activity
GO:0044271=nitrogen_compound_biosynthesis
GO:0006790=sulfur_metabolism
GO:0030554=adenyl_nucleotide_binding
GO:0009308=amine_metabolism
GO:0006519=amino_acid_and_derivative_metabolism
GO:0044249=cellular_biosynthesis
hmm.aa_kinase
GO:0016616=oxidoreductase_activity,_acting_on_the_CHOH_group_of_donors,_NAD_or_NADP_as_acceptor PF00696:Amino_acid_kinase_family
GO:0006082=organic_acid_metabolism
34
Alias file
z
Lists each node from the entify file with the name that should be associated with it
b0001
b0002
b0003
b0004
b0005
b0006
b0007
b0008
b0009
b0010
35
thrL
thrA
thrB
thrC
yaaX
yaaA
yaaJ
talB
mog
yaaH
Synonym file
z
Lists nodes from the entity and alias file that have names associated with them
in addition to the alias
b0116
b0161
b0178
b0591
b0755
b1009
b1136
36
lpdA
htrA
skp
ybdA
pgmA
ycdJ
icdA
Pattern file
z
In order to create this file, you will have to run the pattern mining engine of BISON (see
page 18)
z
Lists patterns found with the pattern mining library
{(0).(hmm.hatpase_c),(0).(hmm.hiska),(1).(PF00384:Molybdopterin_oxidoreductase),(1).(hmm.molyb
dopterin),(1).(hmm.molydop_binding)}
5
0.821119550753283 4.6117
1016
0
PASS
{(0,1)}
{1.+}
b3404
b0894
b3404
b1224
b3404
b1468
b3911
b1468
b3911
b1224
37
Network file
z
38
Lists node pairs from the entity file that form edges in the network
b0020
b0020
b0034
b0034
b0034
b0034
b0034
b0034
b0034
b0034
b0034
b0034
b0064
b0064
b0064
b0064
b0064
b0064
b0019
b1482
b0035
b0036
b0037
b0038
b0039
b0040
b0041
b0042
b0043
b0044
b0061
b0061
b0062
b0062
b0063
b0063
+
+
+
+
+
+
+
+
+
+
+
+
+
+
+
-
Configuration file
z
Determines how to color edges on the networks
LABEL
+
+-
39
RED_VALUE
1f
0f
1f
GREEN_VALUE
0f
0f
1f
BLUE_VALUE
0f
1f
0f
ALPHA
1f
1f
1f
DOTTED/SOLID
SOLID
DOTTED
SOLID
Bison.config details
z
Your new data directory must contain a BISON configuration file (note that
these files will be replaced by your files):
# "E.coli" from RegulonDB and Dr. Pruess data with annotations from Pfam and
Wisconsin GENE ID
ENTITYFILE
ecoli_entity.txt
ALIASFILE
ecoli_alias.txt
SYNONYMFILE ecoli_syn.txt
PATTERNFILE patterns.out
NETWORKFILE flhD_microarray.net
edgeColors.txt
NETWORKFILE regulon.net edgeColors.txt
NETWORKFILE pruess.net edgeColors.txt
NETWORKFILE 2component.net
edgeColors.txt
LINK http:\\www.kegg.com/dbget-bin/www_bget?eco:
ID
40
Opening new data
z
z
41
Click ‘Bison.exe’
Click ‘File’, select ‘Load File Directory’ and select ‘New_Data’
Reference
Besemann, C., Denton, A., Carr,
N.J., and Prüß, B.M. BISON: A BioInterface for the Semi-global
analysis Of Network patterns. 2006.
Source Code for Biology and
Medicine, Volume 1.
Please, reference this paper when
using BISON
42