1
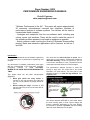
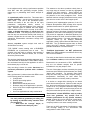
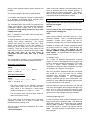
When the individual UBEs in the 10-job run had more
extraneous code (i.e. before the fixes) – the table I/O
across the jobs were less likely to collide with each
other (Figure 11):
When a software performance problem is attributed to
a version upgrade or other change to the system, a
comparison of the “before” and “after” profiles is
essential.
An “after” profile by itself does not always shout out:
“Here’s the performance problem!” It often looks as
bland and featureless as a star field. It’s simply not
possible to discern which of the dots moved against
the fixed stars, so to speak.
Figure 11. Concurrent batch jobs – no DB I/O contention problem
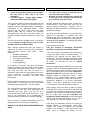
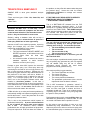
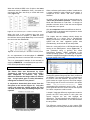
When the code in the individual jobs was more
streamlined and more compact (i.e. after the fixes),
the collisions were actually more likely to occur across
the concurrent jobs (Figure 12):
Figure 12. Concurrent batch jobs – with DB I/O contention problem
So - an improvement in the throughput of a SINGLE
job actually introduced a new issue with concurrency.
Only the comparison makes the differences obvious
The data must be analyzed and interpreted to locate
the delta in the code profiles.
This implies that the software should always be
upgraded first in a robust Test or Development
staging environment, so that both the “old” production
system and the “new” upgraded system exist
simultaneously, and both can be run and profiled.
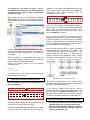
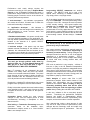
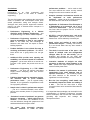
Below is a code profile from a JD Edwards batch job
running on the IBM System I server (Figure 14). It
was generated using a profiling tool called
Performance Explorer (“PEX”) embedded in the
OS/400 operating system. The batch job in question
exhibited a degraded throughput following an upgrade
to a new version of the code.
This is a quintessential example of the necessity of
applying CONCEPTS – not assembly-line style rules –
in the area of performance analysis!
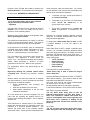
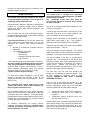
Discovering Pluto
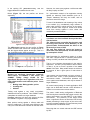
The Planet Pluto was discovered by Clyde
Tombaugh in 1930 using a clever device called a
blink comparator to discover very subtle
differences between two images taken on different
days. A single photo gave no useful information;
nothing that screamed “I’m a planet!!”
A comparison determined what moved from the
first photo to the second (Figure 13). Only then
could it the planet be spotted against the fixed
star field, and even then, painstaking analysis was
required.
Figure 14. Code profile – after performance fixes
Finding the problem using only this “after” profile was
not possible. The context provided by a comparison to
the “before“ case was essential. By itself, the “after”
profile looked as cryptic as one of the Pluto images.
There simply was not an API or function in this profile
called
“JDE_PerformanceProblem()”
which
encapsulated the problematic area of code. A code
profile generated from the earlier version was required
so a direct comparison could be made:
A simple C language difference engine was created to
process the PEX code profiles in their plain text
format, compare the two, and highlight the
differences. The user interface was created in C++ to
allow easy visual identification of the delta between
the two profiles.
The difference engine feature on this custom PEX
rendering tool more clearly showed that the time spent
Figure 13. Pluto discovery photographs
Credit: Lowell Observatory Archives