1
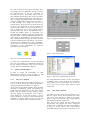
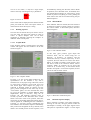
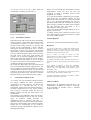
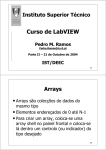
User Interface Development for an Autosampler, Based in LabVIEW Programming
Language
Fabrice Gonçalves(1), Luís Santos(1), Rui Santos(2), Pedro Faia(1)
(1)
ICEMS Coimbra – DEEC-FCT, Universidade de Coimbra, Pólo 2, 3030-290, Portugal
(2)
DEEC-FCT, Universidade de Coimbra, Pólo 2, 3030-290, Portugal
Autosamplers are devices with the capability to
collect and deploy samples for further analysis in
pipes uniformly distributed within predefined
trays, with remarkable speed and accuracy. Such
devices are widely available in the market and
whilst their prices are high, it’s programming
and tasks are apparently simple. Taking this
economic problematic and adding the portability
concept, thus came the idea for the present work:
an Autosampler operating over 3 axis, X, Y and
Z, capable of executing the same operating tasks
of the Autosamplers already available in the
market, configured and controlled by means of a
user friendly application. In this paper we will
focus the development of a user friendly
application that runs on a Personal Computer,
PC, developed using LabVIEW programming
language that incorporates several functionalities
that simplify the use of our Autosampler. The
specific Autosampler for which this application
was developed, is fully described in another
paper.
Keywords: LabVIEW, Motorised System,
Autosampler
1.
Introduction
We can actually find in the market a large number of
multi-axis positioning systems, also referred as XY
or XYZ tables, depending on the number of modules
used. There exist a large number of possible
applications for this kind of devices, such as
microscopy equipments, CNC devices, or
Autosamplers, where the speed, accuracy and high
load capacity are very important.
Referring to an Autosampler, we can say that it is an
automatic 3-axis positioning system that can be not
only used for sample preparation, but also with
analytical technologies, volatile organic impurities
measurements or alcohol rate in blood detection,
even in toxicity analysis, or with chromatography
and atomic adsorption systems.
Autosamplers are designed to optimize robustness
and to avoid mechanical erosion, since those are the
major generators of system faults, due to laboratorial
environment and repetitiveness of systematic sample
processing. To command an Autosampler, an
“onboard” console can be incorporated, or it can be
controlled using a Personal Computer (PC) interface.
2.
Autosampler description
Autosamplers use in general, assay pipes where
samples can be deployed, treated, mixed or even
collected for further analysis. To support those
pipes, it is usual to make use of rectangular trays,
with variable sizes and configurations, where pipes
are placed. Instead, graphite recipients, that support
high temperatures as the ones needed for atomic
adsorption systems, can also be used.
We can describe an Autosampler sequence, starting
by defining the kind of tray that is going to be used
as support (first step). This one can be saved in a file
of trays for further use (second step). The next step
will be to define the sequence of pipes that the
Autosampler will have to cover, as well as the
retraction time and depth that Autosampler must use
for the movements along the Z direction (third step).
At this moment, the mechanical system can actually
start its displacement to the first position, firstly by
moving along X axis, then along Y axis, and finally
along Z axis to drop or extract the substance existing
in the pipe. Once retraction time as terminated, the Z
axis will be moved once again, retracting to its initial
position.
The latest described procedure will be repeated for
all pipes previously defined in the third step. Once
all the programmed movements have been executed,
and the sequence is completed, the mechanism
returns to, what we call, reference position, moving
again firstly along X axis and then along Y.
In this paper, we will describe the development of a
user friendly software interface for a PC, used to
control our Autosampler: it has a modular design
which will allow future upgrades of the interface,
and, simultaneously, maximizes the usage that can
be given to this kind of mechanisms, even by a non
specialist human operator.
In order to implement this interface, LabVIEW
development tool was used. It is a tool that permits
in first place graphical programming, supplying
many graphic devices like push buttons,
thermometers, manometers, etc…, supporting at the
same time the physical protocol RS232, and,
secondly, it allows the utilization of files and much
more.
The software interface developed comprises the
following features that will further discussed:
- defining a tray of pipes by is lengths in millimetres
and by how many tubes it is compose in X and Y
direction;
- saving this tray in a file for further use;
- opening a tray that is already defined in a file;
- selecting the sequence/path of our sampling
system, graphic or manually;
- selecting different retraction times for each pipe;
- selecting different depths in Z direction for each
pipe;
- showing the covered path by the system over the
tubes to test, in real time;
- making a pause in a sequence already in curse, and
give user the possibility to insert a new position to
sample, with depth and retraction time functionality;
The actuation of linear modules is made by the use of
three step motors, controlled by microstepping
technique, based on signal modulation, using Pulse
Width Modulation. Motors control is achieved by a
microcontroller from MICROCHIP family, which has
servo function and is totally autonomous. This one,
receives positioning commands in the form of step
numbers for each motor, sent by the upper level
interface located in the PC, and executes them. The
conversion of millimetres to steps is performed in the
interface, in order to avoid microcontroller of such
computation, due to time processing limitations.
3.
Graphical User Interface
3.1
What’s LabVIEW?
LabVIEW
(Laboratory
Virtual
Instrument
Engineering Workbench) is a software development
tool, based in graphic’s programming, “G language”,
similar to other programming languages like C, C++
or BASIC. The most important difference is that
LabVIEW uses graphic’s programming, by means of
block diagrams, in opposition to text programming
style, supported by the referred programming
languages.
LabVIEW, like C or BASIC, is a programming
language of general use, with a wide range of
function libraries, for several programming task.
LabVIEW includes libraries for data acquisition,
data analysis and data presentation, for data storage
and for instrumentation control. It’s fully tailored for
diverse hardware communication, whether RS-232
or RS-485 are used, either other type of data
acquisition boards are employed.
Program modules or full programs in LabVIEW are
known as “virtual instruments” (VIs), due to their
appearance and working operation principles.
However, VIs functionalities are similar to
conventional text programming language functions.
A VI consists of an interactive interface with the
user and of a flux data diagram, that works like a
source code with icons and connections, permitting
that a VI is used by upper level VIs. Specifically,
VIs reunite the following functionalities:
- User interactive interface: known as Frontal
Panel, due to its resemblance with a physical
instrument front panel. Normally, it’s constituted by
buttons, graphics and other controllers, and
indicators. This allows data entrance (with mouse
ore keyboard) and screen output;
- VI receive instructions: they receive data from a
block diagram, “G language” based. Block diagrams
simplify errors and program problems detection,
turning them easily identifiable. Block diagrams are
the source code of the VIs;
- VIs are hierarchical and modular: they can be used
as main programs, or simply like sub functions. One
VI inside another is called a sub-VI. The icon VI
and connections works like a parameters graphic list,
so other VIs can pass data to sub-VIs.
In this way, we can say that LabVIEW programming
mechanism is a modular mode one, allowing an
application to be divided in many simpler tasks. This
modularity also allows the use of previously
developed sub tasks, as functions, for other
programs too: let’s say it can work as a library for
other software packages.
So the first step will be the implementation of newer
VIs for each sub task, witch, afterwards, will be used
in newer block diagrams that execute more complex
tasks. In the last step, the final application level, will
be the one that contains all sub-VIs grouped in such
a way that all desired features of the user interface
are implemented. As VIs can run separately, beside
error detection, changes can be made easily: the
creation of new VIs, or simply the modification of a
one already existing, is very easy to achieve. As
stated, all VIs can and will be saved in a library,
allowing their utilization by other applications.
Figure 1- Message formats that compose the
implemented communication interface: standard data
message format, “READY” message format and
“OK” message format.
3.2
Communication Protocol
Before starting the description of the developed
toolboxes for our interface, we had to create a sort of
communication protocol, using RS232, so that our
interface can send to the microcontroller the number
of steps to execute movements along X, Y, Z.
The communication protocol is based in a
Master/Slave architecture that uses a Fieldbus type
topology. It is supported by the physical protocol
RS232, and composed by a group of messages
whose format can be seen in figure 1.
In the implemented protocol, the messages are
traded between the PC interface and the
microcontroller, as follows: 1) the resident interface
running in the PC (from know on only referred as
PC), must be initiated first, as it must wait for an
“OK” message from the microprocessor. As soon as
the “OK” message is received, the messages trade
can actually start; 2) a “READY” message is sent by
the microprocessor to the PC indicating its
availability to receive positioning data; 3) the PC
then computes the necessary data, using a procedure
which is described in another paper, and sends it in
form of strings sequentially to the microcontroller,
using the standard data message format of figure 1.
In this message, four strings are sent to the
microprocessor: the first three correspond each one
of them to the desired X, Y and Z positions (in
steps), and the fourth one concerns the time the Z
axis is supposed to be in lower position, before
retracting (this time can be user defined, being 1
second the default value); 4) meanwhile, the
microcontroller is waiting to read this message from
the serial buffer: it must be emphasized that each one
of the strings is terminated by a \n\r sequence. Only
after receiving the full message, the microcontroller
will process data and act on the motors; 5) as soon as
the motors have completed their task, a “READY”
string will be sent to the PC; 6) subsequent position
movements of the Autosampler are achieved
repeating steps 2) through 5).
Figure 3- graphical interface for an Autosampler
Figure 4- The “New” panel
Figure 2- Control VIs for RS-232
To achieve the communication, we have developed
three VIs, one for RS-232 configuration, another for
RS-232 reading and finally a last one for RS-232
writing. Those are represented in Figure 2.
3.3
Software functionalities
In order to control our Autosampler, we have
developed the interface shown in Figure 3. The
functionalities there present are described below.
3.3.1
The “New” function
On the top left corner of our interface in Figure 3, we
can see a “New” button. By clicking this button, a
newer dialog panel will be shown, see Figure 4.
At this point we can define measures along X and Y
directions in millimetres (which correspond to the
length and wide dimensions of the pipes support
board) and the number of pipes existent in each
direction. Finally, by clicking the “save” button, a
newer dialog box, as the one in figure 5, will be
shown, and, their, we can give, to the just defined tray
parameters, a name in order to save it in a file (this
will allow to use these same tray definitions later).
Figure 5- The “Save” panel and its VI “Grava”
For saving definitions in files, we have developed a
VI named “Grava”, where all inputs are converted to
string format, for easy processing in file. As we can
see in Grava VIs, we don’t have input or output
connections.
3.3.2
The “Open” function
Just under the “New” button of the interface, we can
find the “Open” button. When clicked, this button
will open a newer dialog box, similar to the one in
figure 5, where we can chose a tray already defined,
that the human operator wants to use.
Once the user has chosen the file containing the
desired data, the program will read a string that
contains tray’s parameters, and will convert them in
an array of 32 bits values: only in this format
LabVIEW functions will be able to use them. As we
can see in VI “Abrir”, it only has a single output,
which is the array containing the tray’s parameters.
be modified by clicking the “Previous” button. When
all positions, for a maximum of 25, are defined, users
can confirm them, looking to X, Y and Z array, on the
bottom of panel. If everything is correct, pushing the
“Run” button will start the movement along the just
defined sequence.
Figure 6- The VI “Abrir”
3.3.3.2 Manual Mode
Those values will be displayed in the interface frontal
panel, just beside the “New” and “Open” button, to
inform the user about the tray he is using.
3.3.3
Defining sequence
If the “Manual” button is clicked, then users will have
to define the sequence of pipes position, by acting in
the control buttons of the frontal panel, shown in
detail in Figure 8.
Once the user has chosen the tray he wants to use, he
can now select the pipes from which he wants to
collect or depose samples. This can be done
graphically or manually, choosing the “Graphic” or
“Manual” mode in front panel.
3.3.3.1 Graphic Mode
If the “Graphic” button is clicked, then a new dialog
window will appear. This new window is as the one
shown in Figure 7.
Figure 8- The “Manual” Mode
At this time, pipes position, pipes depth and
retraction times, will be chosen using the “X
Position”, “Y Position”, “Z Position” and the
“Retraction Time (s)” controls, respectively. To save
a position, the users will have to click in the “Next”
button. To modify an already saved position, users
will have to click in the “Previous” button. Like in
“Graphic” Mode, 25 positions can be saved, and
viewed in X, Y and Z array, on the bottom off the
interface front panel’s. To start the sequence, the user
just has to click the “Run” button.
Figure 7- The “Graphic” Mode
In figure 7, we can see the dialog window for tray
representation: for the moment a tray with a
maximum size of 20 pipes along X direction, and of
15 pipes along Y direction, can be used. Users can
now choose pipes where samples are going to be
collected or deposed, simply by clicking over the
pipes position (imagined in the same way for the
“naval battle” game). For each selected tube, users
are given the possibility to define different depth
displacement along Z direction, using the “Z
Position” bar, and different retraction times in
seconds, by means of the “Retraction time” control
button. Once users click in one position, after have
chosen the corresponding depth and retraction time, it
will be lighted on, confirming that the command is
accepted, i.e., that that position configuration has
been added to the movement sequence: immediately
after position will be lighted off. If, by mistake, users
define a non wanted position for the sequence, it can
Figure 9- Real time visualization panel
3.3.4
Real-time sequence display
Once a sequence is running, a new panel will appear,
showing in real time, the pipe position where the
Autosampler is actually, on the pipes support board.
This panel is represented in Figure 9. In this figure
we can see a tray of 12 by 9 pipes, where the
Autosampler is actually in position [6, 5].
Figure 10- Insert panel
3.3.5
Future work will include the development of newer
functionalities, which will give the users the
possibility to obtain a maximum profit of their
equipment. For instance:
a) To give the possibility to define the type of sample.
This means that for different samples we have
different retraction times due to viscosity of the liquid
and so one. With this functionality, the user can
previously define what kind of material the system is
going to inspect, and this way define for the complete
tray, the retraction time and depth, or do it
individually for each pipe position;
b) Save in a file the kind of sample defined, by tray or
pipe, for posterior use;
c) During system pause, permit the insertion of an
entire newer sequence, and give the chance to repeat
it a certain number of times.
Intermediary Position
Acknowledgments
When discussing with several end users Autosampler
interface features, some of them referred the necessity
of interrupting a sequence, in order to insert a new
position in the running sequence. To respond their
request, we have implemented a “Pause” function,
which gives them that opportunity: that is, it allows
the operator to insert a new position, with different
depth along Z direction and different retraction time.
This way, when clicking the “Pause” button in the top
the right corner of the front panel interface, the
sequence will be stopped, highlighting the “Pause”
button. Then, simply by clicking the “Insert” button, a
new window panel will appear, as the one in figure
10, where a new position can be defined similarly as
in “Manual” Mode previously described.
By clicking the “Run” button, the system will execute
this newer intermediate position stopping after it. The
user can define for the stopped sequence the number
of intermediate positions he wants. To go back and
continue to execute the previous stopped sequence of
positioning movements, users will have to deselect
the pause mode just by clicking the “Pause” button.
4.
Conclusions and future work
As we have seen, the developed software interface
has entirely fulfilled all initial specifications,
originated by our main objective: the design and
development of a portable and easy to use
Autosampler system. In fact, the software interface is
extremely straight forward to use, with a learning
time of about 10 minutes: within this time any
Human operator will learn the basic aspect of its
functionalities.
This interface can be adapted to other than the here
presented Autosampler control. In this case, a wider
range of functions should, desirable, be
implemented, such as, substance data base or a
substance analysis tool (this last one would produce
data reports). Such human control interface upgrade
should also be accompanied by the necessary
mechanical system transformations, adequate to the
intended system usage.
Paralab S.A., for the technical and financial support.
References
[1] S. Kock, W. Schumacher, “A parallel X-Y manipulator with
actuation redundancy for high speed and active stiffness
applications”, IEEE International Conference on Robotics and
Automation, pp. 2295-2300, Louvain, 1988.
[2] K. A. Jensen, C.P. Luska, L.L. Howell, “An XYZ
micromanipulator with three translational degrees of freedom”,
Robotica, vol. 24(3), pp. 305-314, 2006.
[3] Foundation fieldbus provides automation infrastructure for
operational excellence, ARC White Paper, ARC Advisory Group,
2007.
[4] P. Emerald, R. Peppiette, A. Seliverstov, “Monolithic,
Programmable, Full-Bridge Motor Driver Integrated PWM
Current Control And Mixed-Mode Microstepping”, Allegro
Microsystems, 1997.
[5] Michael Predko, “Programming and customizing PICmicro
microcontrollers”, McGraw-Hill, 2 Edition, 2002.
[6] National Instruments, “LabVIEW User Manual”, National
Instruments Corporation, January 1998.
Author(s) address
Departamento de Engenharia Electrotécnica e de
Computadores, Faculdade de Ciências e Tecnologia
da Universidade de Coimbra, Pólo 2, 3030-290
Coimbra, Portugal