1
Nuclear Instruments and Methods in Physics Research A289 (1990) 35-102
North-Holland
35
THE CONSTRUCTION OF THE L3 EXPERIMENT
B. ADEVA 14 ), M. AGUILAR-BENITEZ 20), H. AKBARI 5), J . ALCARAZ 20 ), A. ALOISIO 22 ), J. ALVAREZ-TAVIEL 20 ),
G. ALVERSON 8), M.G. ALVIGGI 22), H. ANDERHUB 33), A.L. ANDERSON 11 ), A.M . ANGELOV 11 .3°), T.H. ANGELOV ",30),
G.H . ANTCHEV 30), L. ANTONOV 3°), D. ANTREASYAN 1s), A. AREFIEV 21), I.H . ATANASOV 30), B. AUROY "),
R. AYAD 4), O.L. AYRANOV 30 ), T. AZEMOON 3), T. AZIZ 7), U. BACHMANN 31), P. BÄHLER 18), J.A. BAKKEN 25),
L. BAKSAY 2s), H. BALDINGER 31), R.C . BALL 3), J. BALLANSAT 4), S. BANERJEE 7,14.15), J . BAO 5), G. BARBIER 16 ),
L. BARONE 26), G. BASTI 26 ), A. BAY 16), F. BEAUVAIS 33 ), U. BECKER 11 .14), R. BEISSEL 1), S. BENDIG 31), P. BÉNÉ 16),
J. BERDUGO 14- 20), P. BERGES "), M. BERTHET 4), Y. BERTSCH 4), B.L. BETEV 30 ), A. BILAND 33 ), A. BISCHOFF 32),
M. BISCHOPS 1), R. BIZZARRI 26 ), J.J. BLAISING 4), M. BLANC 11,a), P. BLÖMEKE'), B. BLUMENFELD 5), G.J . BOBBINK 2),
M. BOCCIOLINI 12), K.D . BOFFIN 1), W. BOHLEN 31 ), A. BÖHM 1 ), T. BÖHRINGER 18), H. BONNEFON 4), C. BOPP 25),
B. BORGIA 26), K. BOSSELER 1), J.F . BOTTOLIER 4), M. BOURQUIN 16), D. BOUTIGNY 4), P. BOWDITCH "' b) ,
J.G. BRANSON 27 ), D. BRAUN 1), I.C. BROCK 24), F. BRUYANT 14), M. BUCHHOLZ 1), B. BÜCKEN 1), W. BULGERONI 31 ),
R. BUREL 11 ), J.D . BURGER"), C. BURGOS 20), J.P . BURQ 19 ), L. CAIAZZO 22), M. CAILLAT 4), B. CAMBERLIN 4),
D. CAMPANA 22), C. CAMPS 1 ), V. CANALE 26), M. CAPELL 3), F. CARBONARA 22 ), F. CARMINATI 12 ), A.M . CARTACCI 12 ),
M. CERRADA 20), F. CESARONI 26), Y.H . CHANG "), J.W . CHAPMAN 3), M. CHEMARIN 19), A. CHEN 34 ), C. CHEN 6),
H.F. CHEN 17), H.S. CHEN 6), M. CHEN "), M.L . CHEN 14), S.R. CHENDVANKAR 7), G. CHEVENIER 33), S. CHIDZIK ' '),
G. CHIEFARI 22), C.Y . CHIEN 5), F. CHOLLET 4), M. CHUMAKOV 21 ), C. CIVININI 12), 1. CLARE 11 ), R. CLARE 11),
G. COIGNET 4), N. COLINO 20), V. COMMICHAU 1), G. CONFORTO 12 ), P. CRISTOFORI 26), F. CRUNS 2), X.Y . CUI 6,15),
T .S. DAI 11 ), R. D'ALESSANDRO 12), M. DANIEL 20 ), X. DE BOUARD 4)t, B. DEBYE 1 ), G. DECREUSE 11 ), A. DEGRÉ 4),
K. DEITERS 32), E. DÉNES 9), P. DENES 25), F. DeNOTARISTEFANI 26 ), M. DEUTSCHMANN '), M. DHINA 33),
B. DIDIERJEAN 4), M. DIEMOZ 26), M. DIETRICH"), H.A . DIMITROV 30), C. DIONISI 26 ), F. DITTUS 23 ), M. DOHMEN 1 ),
R. DOLIN 11 ), J.F . DONAHUE 11 ), A. DONAT 32), E. DR AGO 22 ), K.H . DREGER 1), T. DRIEVER 2), G. DROMBY 4),
P. DUINKER 2), 1. DURAN 11 .14.20), M. ELKACIMI 19), H. ELMAMOUNI 19), A. ENGLER 24), F.J. EPPLING 11 ), F.C . ERNÉ 2).
1. ERNE 31 ), H. ESSER'), P. EXTERMANN 16), R. FABBRETTI 33), G. FABER 2,11), S. FALCIANO 26 ), T. FALK 25 ), S.J . FAN 29)
M. FAVRE 33 ), J. FAY 19), S. FEHÉR 28 ), J. FEHLMANN 33), M. FELDMANN 14), H. FENKER s), T. FERGUSON 24 ),
M. FERNANDEZ 20 ), F. FERRONI 26 ), H. FESEFELDT '), J. FIELD 16), J.M . FIGAROLA 20), C.F . FIGUEROA 20)
G.A. FILIPOV 30 ), B. FOLIGNÉ 11 ), G. FORCONI 16), T. FOREMAN 2), V. FRANZKE 1 ), W. FREI 31 ), K. FREUDENREICH 11),
W. FRIEBEL 32 ), M. FUKUSHIMA 11 ), G. GAILLARD 4), M. GAILLOUD 18 ), Yu . GALAKTIONOV 21 ), E. GALLO 12)
S.N . GANGULI 7), D. GARELICK 8) , S.S. GAU 34 ), G. GAVRILOV 13 ), E. GENNARI 26 ), S. GENTILE 26). M. GETTNER 8),
C. GIRARD 4), M. GLAUBMAN 8) , S. GOLDFARB 3 ), Z.F . GONG 17), E. GONZALEZ 20 ), A. GORDEEV 21 )
Yu . GORODKOV 21 ), P. GÖTTLICHER 1), C. GOY 4), M . GOYOT 19), G. GRATTA 26), A. GRIMES R) , C. GRINNELL ""),
M. GRUENEWALD 21 ), M. GUANZIROLI 15), S. GUERRA 26), C. GUILLON 4)t, A. GURTU 7) , D. GÜSEWELL 14 ),
H.R . GUSTAFSON 3), M. HAENSLI 33 ), M . HAAN 1), C. HALLER"), T. HAMACHER '), H. HAMMERS 1 ),
K. HANGARTER 1), S. HANCKE 1 ), M. HARRIS 14), D. HARTING 2), F.G. HARTJES 2), C.F . HE 29 ), A. HEAVEY 25),
T. HEBBEKER 14 ), M. HEBERT 27), R. HELLER 32 ), Ch . HELMRATH 1), J. HERRMANN 33), G. HERTEN "), U. HERTEN 1),
A. HERVÉ 14 ), H. HESSER'), G. HILGERS 1), K. HILGERS 1 ), H. HOFER "), H. HOFER 33), M. HOFER 33), T. HOFER 33),
F. HOFFMANN 1), U. HORISBERGER 33 ), I. HORVATH 33 ), L.S . HSU 34 ), G.Q. HU 29 ), B. ILLE 19), M.M . ILYAS 15 ),
G. IMPROTA 22 ), V. INNOCENTE 22 ), E. ISIKSAL 33), E. JAGEL 15 ), B.N . JIN 6), L.W . JONES 3), M. JONGMANNS 33)
H. JUNG 33), P. KAARET 25 ), O. KAELIN 33 ), W. KAESTLI 33 ), Yu. KAMYSNKOV 21 ), D. KAPLAN 8), W. KARPINSKI 1),
Y. KARYOTAKIS 4), W. KERTZEh 1), V. KHOZE 13 ), G. KIRCHHOFF 1) , W. KITTEL 2), A. KLIMENTOV 21 ), P.F. KLOK 2) .
24),
M. KOLLEK 1), M. KOLLER 31 ), A.C . K®NIG 2), O. KORNART '), V. KOUTSENKO 21), R .W . KRAEMER
4),
31),
21),
s),
V.R . KRASTEV 30 ), A. KRATEL 23), W. KRENZ 1), A. KUHN
A. KUNIN
S. KWAN
J. LACOTTE M. LaMARRA I6 ),
G. LANDI 12), W. LANGE 32 ), K. LANIUS 32 ), D. LANSKE 1 ), S. LANZANO 14
.22), J.M . LE GOFF 8.14), J.C . LE MAREC 4),
D. LEA 25 ), M. LEBEAU 4), P. LEBRUN 19 ), P. LECOMTE 33) , J. LECOQ 4), P. LECOQ 14 ), P. LE COULTRE 33 ), 1. LEEDOM 8),
A .L 1Lni~ta
!"1
V La, 16) F i F1-1~esNN 1) i_ i F1çTAM 14 ); R= LFISTE 32). E. LEJEL'NE 18 ), B. LEONI 31 ), J. LETTRY 33 ), X. LEYTENS 2),
241, D. LINNH®FER 1° ),
C. LI 17 ), H.T . LI 6), L. LI 33 ), P.J . LI 29 ), X.G . LI 6), J.Y . LIAO 29). Z.Y . LIN "), F.L. LINDE
28),
6),
.M . LUBBERS 2), K. LI.JBELSMEYER 1),
E. LOFTINJ
11 ), W. LOHMANN 32 ), S. LÖK®S
E. LONGO 26), Y .S . L.L'
26), F. LORKEN ", H. MA 23), W .G . MA 17),
C. LUCI 26), D. LUCKEY 11 .15.d), X. LUE 33 ), L. LUMINARI 26), G. LUNADEI
M. MacDERMOTT 33), N. MADJAR 19 ), R. MAGAHIZ 28), M. MAIRE 4), P.K . MALHOTRA "), A. MALININ 21), C. MANA 14"2o)
"), A. MARCHIONNI 12),,
F. MANNA 22 ), G. MANTO 22 ), Y.F. MAO 6), M. MAOLINBAY 33 ), P. MARCHESINI
MARTYN
1), F. MARZANO 26)
M. MARKWALDER 33), P. MARSDEN "'), J.P . MARTIN 14,19), L. MARTINEZ 20 ), H.U .
V. MARZULLO 22 ), F. MASCIOCCHI 16), G.G.G. MASSARO 2), L. MASSONNET 4), T. MATSUDA "-'), G. MAURELLI 19 ),
K. MAZUMDAR 7), P. McBRIDE 10 ), G. MEDICI 26), H. MEIER 33). Th . MEINHOLZ 1 ), M. MERK 2), R. MERMOD 16)
3), J. MNICH '),
L. MEROLA 22 ), M. MESCHINI 12 ), W.J. METZGER 2), M. MILKE 1), U. MILKE '), G.B. MILLS
0168-9002/90/$03 .50 û Elsevier Science Publishers B.V .
(North-Holland)
36
B. Adeva et al. / The construction of the L3 experiment
M. MOELLER'), A. MOLINERO 2°), L. MONTANFT '4), B. MONTELEONI '2), R. MONTINO '), G. MORAND '6),
2'), R. MOUNT 23), M. MOYNOT 4), P. MUGNIER 4), W. NÄGELI 3'),
R. MORAND 4), S. MORGANTI 26 ), V. MORGUNOV
22),
9,'4),
E. NAGY
M. NAPOLITANO
S. NEBOUX 4 ), H. NEWMAN 23), Ch. NEVER'), K. NGUYEN'), L. NIESSEN'),
2'),
32),
M. OKLE 33), P. OLMOS 2(), J. ONVLEE 2 ), D. OSBORNE"), J. OSSMANN '6),
A. NIKITIN
W.D. NOWAK
D. PANDOULAS'), H. PAPROTNY'), A. PARMENTOLA 22), G. PASSEGGIO 22), G. PATERNOSTER 22), S. PATRICELLI 22),
Y.J. PEI'), Y. PENG 2), Y. PENG 32 ), D. PERRET-GALLIX 4), J. PERRIER' 6), E. PERRIN'6), G. PERROT 4), P. PETITPAS 4),
P. PETSCHNER'), A. PEVSNER 5 ), J. PIER-AMORY "), M. PIERI' 2), V. PIERI' 2), G. PIERSCHEL'), P.A . PIROUÉ 25),
V. PLYASKIN 2'), M. POHL 33 ), V. POJIDAEV 2'), C.L .A. POLS 2), T. PONOMAREFF'), J. POTYKA'), N. PRODUIT'6),
P. PROKOFIEV' 3), F. PRUJA4), G. PÜTZ'), J.M . QIAN 11 ), R. RAGHAVAN 7), P. RAZIS 33 ), K. READ 25), P. REDDICK "),
4), M. REYNAUD "», X. RICADONNA 4),
K. REISSMANN'), D. REN 33), S. REUCROFT 8), D. REY
J-P. RICHEUX' 6),
C. RIPPICH 24), U. RINSCHE '), R. ROCCO 22), S. RODRIGUEZ 2° ), B.P. ROE 3), M. RÖHNER'), S. RÖHNER'),
Th. ROMBACH'), L. ROMERO 2°), J. ROSE'), U. RÖSER 32), S. ROSIER-LEES 4,'4), J.A . RUBIO'4.2°), W. RUCKSTUHL' 6),
H. RYKACZEWSKI ",'5), P. SAHUC' 9), J. SALICIO 2° ), S. SARAN '), G. SAUVAGE 4), A. SAVIN 2'), T. SCHAAD'6),
B. SCHAFHEITLE 33), V. SCHEGELSKY'3), A. SCHETKOVSKY' 3), F. SCHILD 3'), R. SCHILLSOTT "), P. SCHMITT 10),
D. SCHMITZ '), P. SCHMITZ '), M. SCHNEEGANS 4), M. SCHNEIDER 3'), E. SCHNEEVOGT '), M. SCHÖNTAG '),
D.J. SCHOTANUS 2 ), H. SCHUIJLENBURG 33) , R. SCHULTE '), A. SCHULTZ VON DRATZIG '), K. SCHULTZE),
J. SCHWENKE'), G. SCHWERING'), C. SCIACCA 22), P.G . SEILER 33), J.C. SENS 2 ), I. SHEER 27), V. SHEVCHENKO 2'),
S. SHEVCHENKO 2'), X.R . SHI 24), K. SHMAKOV 2'), V. SHOUTKO 2'), E. SHUMILOV 2'), R. SIEDLING '),
N. SMIRNOV '3), V. SOUVOROV i3), C. SOUYRI 4), I . SPANGLER 5 ), T. SPICKERMANN '), B. SPIESS 3'),
P. SPILLANTINI '2), R. STAROSTA'), M. STEUER ".15.d), D.P . STICKLAND 25), B. STÖHR 33), H. STONE '6),
K. STRAUCH '(», K. SUDHAKAR 7). R.L. SUMNER 25 ), H. SUTER 33), R.B. SUTTON 24), H. SZCZESNY'), J. TANG ",'5),
X.W . TANG 6), E. TARKOVSKY 2'), A. TAVENRATH'), V. TCHUDAKOV 2'), J.M . THENARD 4), E. THOMAS 15 ).
T. THON 32), H. THUERIG 33), M. THULEN 8 ), C. TIMMERMANS 2), Samuel C.C. TING "), S.M . TING "), F. TONISCH 32),
Y.P. TONG 34), M. TONUTTI '), S.C . TONWAR 7 ), J. TÔTH 9), W. TOTH ".b), G. TROWITZSCH 32 ), K.L . TUNG 6)
J. ULBRICHT 3'), L. URBÀN 9), E. VALENTE 26 ), R.T. VAN DE WALLE 2), H. VAN DER GRAAF 2), V. VANZANELLA 22),,
M. VERGAIN "), 1. VETLITSKY 2'), H. VEY 4), G. VIERTEL 33), M. VIVARGENT 4 ), H. VOGEL 24), S. VOLKOV '3),
M. VOLLMAR'), H.P. VON GUNTEN 33), I. VOROBIEV 2'), A. VOROBYOV'3), L. VUILLEUMIER' g), S. WALDMEIER 33),
W. WALK '4), W. WALLRAFF 1), C.Y. WANG ' 7), G.H . WANG 24), J.H . WANG 6). Q.F . WANG '°), X.L. WANG ' 7),
Y.F. WANG '2), Z.M . WANG' ), Z.M . WANG 17), D. WASSENBERG'), D. WEGMANN 33), R. WEILL' 8), T.J . WENAUS "),
P. WENGER 3'), J. WENNINGER '6), M . WHITE "), R. WILHELM 2 ), C. WILLMOTT 2° ), H .P . WIRTH '),
F. WITTGENSTEIN '4), R.J. WU 6), S.X . WU ".'5), Y.G. WU 6), B. WYSLOUCH ".'4), F.Y . XI 6 . "), Z.Z . XU 17), Z.L. XUE 29),
D.S . YAN 29), K.D. YANEV 3 °), B.Z . YANG "), C.G . YANG 6 ), K.S. YANG), Q.Y . YANG 6 ), Z.Q . YANG 29), C.H . YE " .s),
S.C . YEH 34 ) . Z.W . YIN 29), C. ZABOUNIDIS 8) , L. ZEHNDER 33), Y. ZENG '), D.H . ZHANG 2), S.Y. ZHANG 6 ),
Z.P. ZHANG "."), B. ZHOU "), J.F. ZHOU'), Z.P . ZHOU "), R.Y . ZHU 23 ), A. ZICHICHI'4A5), M. ZOFKA' 6) and J. ZOLL 14)
))
1. Physikalisches Institut, RWTH, Aachen, FRG *;
3 . Phvsikalisches Institut, RWTH, Aachen, FRG
2) National Institute for High Energy Physics, NIKHEF, Amsterdam, The Netherlands
NIKHEF-H and University of Nijmegen, Nijmegen, The Netherlands
.t) University of
Michigan, Ann Arbor, USA
4,
Laboratoire de Physique des Particules, LAPP, Anneçy, France
s)
Johns Hopkins University, Boltimore, USA
h)
Institute of High Energy Physics, IHEP, Beijing, P.R. China
7)
Tata Institute of Fundamental Research, Bombay, India
N)
Northeastern University, Boston, USA
9)
Central Research Institute for Physics of the Hungarian Academy of Sciences, Budapest, Hungary
to)
Harvard University, Cambridge, USA
))) Massachusetts Institute of Technology, Cambridge, USA
)`) INFN Sezione di Firenze and University of Firenze, Italy
) ;) Leningrad Nuclear Physics Institute, Gatchina, USSR
14) European Laboratory for Particle Physics, CERN, Geneva, Switzerland
) s) World Laboratory, FBLJA Project, Geneva, Switzerland
)6) University of Geneva, Geneva, Switzerland
) N) Chinese University of Science and Technology, USTC Hefei, P. R . China
)N`
University of Lausanne, Lausanne, Switzerland
)V'
Institut de Physique Nucléaire de Lyon, IN2P3-CNRS/Université Claude Bernard, Villeurbanne, France
2° ` Center of Energy and Environmental Research, CIEMAT Madrid, Spain
)) Institute of Theoretical and Experimental Physics, ITEP, Moscow, USSR
2 " ) INFN Sezione di Napoli and University of Naples, Italy
231
California Institute of Technology, Pasadena, USA
' 4) Carnegie Mellon University, Pittsburgh, USA
'5) Princeton
University, Princeton, LISA
B. Adeva et al. / The construction of the L3 experiment
37
INFN Sezione di Roma and University of Roma, "La Sapienza" Italy
University of California, San Diego, USA
2s)
Union College, Schenectady, USA
29)
Shanghai Institute of Ceramics, SIC, Shanghai, P.R . China
30)
Central Laboratory of Automation and Instrumentation, CLANP, Sofia, Bulgaria
31)
Paul Scherrer Institut, PSI, Wilrenlingen, Switzerland
32)
High Energy Physics Institute, Zeuthen-Berlin, Germany
33)
Eidgenössische Technische Hochschule, ETH Zürich, Switzerland
34)
National Science Council, Taiwan
26)
27)
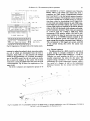
Received 8 November 1989
The L3 experiment is one of the six large detectors designed for the new generation of electron-positron accelerators. It is the
only detector that concentrates its efforts on limited goals of measuring electrons, muons and photons. By not attempting to identify
hadrons, L3 has been able to provide an order of magnitude better resolution for electrons, muons and photons. Vertices and hadron
jets are also studied. The construction of L3 has involved much state of the art technology in new principles of vertex detection and
in new crystals for large scale electromagnetic shower detection and ultraprecise muon detection. This paper presents a summary of
the construction of L3.
l. Introduction
The L3 experiment is designed to study e+e- collisions in the 100-GeV range with emphasis on high
resolution energy measurements of electrons, photons
and muons. It is an effort involving a worldwide collaboration of 460 physicists belonging to 34 institutions
from 13 countries. The preparation of the experiment
took eight years from its conception to the beginning of
data taking in summer 1989. The total cost was 200
MSf and 1100 technical man years. The detectors are
installed within a 7800-t magnet providing a 0.5-T field.
We choose a relatively low field in a large volume to
optimize muon momentum resolution, which improves
linearly with the field but quadratically with the track
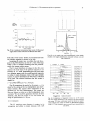
length . From the interaction point outwards, the following detectors are installed (fig. 1) :
- A central detector, tracking charged particles with a
50-[.m average single wire accuracy in the bending
plane and with 450-Rm double track resolution. In
the nonbonding plane, the Z coordinates are meaa)
h)
d)
e)
n
s)
t
Metareg.
Formerly C.S . Draper Laboratory.
Also LAA.
Also Bologna .
Also F Bitter National Magnet Laboratory.
Also KEK.
Also Nanjing.
Deceased .
Supported by the German Bundesministerium für Forschung and Technologie.
Partly supported by the grant CCA-8411/129 from the
"US-Spain joint committee, Science and Technology program".
sured by four layers of additional wire chambers
providing 300-p.m single track resolution and 7-mm
double track resolution .
- An electromagnetic calorimeter using a new type of
crystals (BGO), to measure energies of photons and
electrons with an accuracy of 5%O at 100 MeV and
better than 1 % above 2 GeV.
- A hadron calorimeter, measuring hadron energies
with (55/ ~T + 5)% resolution and ®e = 2.5 °, 3O =
3.5' for jets, which also provides a clean muon
sample by absorbing hadrons close to the e + e - interaction point, thus minimizing in-flight pion decays,
and by tracking muons through the uranium absorber . The forward-backward part of the hadron
calorimeter is specially designed for quick assembly
and removal to provide access to the rest of the
detectors.
- A muon detector, comprised of large drift chambers
able to measure the sagitta of muon tracks to provide
®plp < 1.5% at p = 50 GeV.
The detectors are complemented by a luminosity
B. Adeva et al. / The construction of the L3 experiment
38
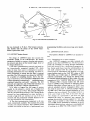
2. General description of the L3 experiment
2.1 . Detector
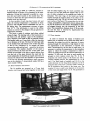
CONTROL ROOMS
ACCESS SHAFT
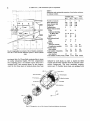
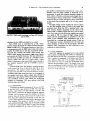
Fig. 1 . Perspective view of the L3 experiment .
monitor, triggering and data taking electronics, a cluster
of online computers and a mainframe computer for
offline analysis . Ethernet and packet-switching networks are used for local and long-distance communications .
The L3 experiment [1] is installed at interaction
point 2 of the LEP e + e - storage ring. A 7800-t octagonally shaped solenoid houses all the detectors . The poles
of the magnet are split into doors to give access to the
field volume . The maximum field is 0.5 T and the
effective field volume is 11 .4 m across the flats of the
octagonal aluminum coil and 11 .9 m long. A watercooled screen separates the coil from the detector
volume . The magnet rests on a concrete cradle integrated into the hall foundation (fig. 2).
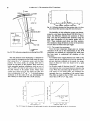
The detectors are supported by a 32-m long and
4.45-m diameter steel tube which rests at both extremities on adjustable jacks placed on concrete pillars (fig.
3). The tube is concentric with the LEP beam line and
symmetric with respect to the interaction point ; it is
mechanically coupled to the elements of the low-ß
insertion, allowing alignment of all L3 detectors relative
to the LEP beam.
The muon spectrometer forms three concentric
chamber layers around the beam . It consists of two
ferris wheels., each weighting 86 t. Each of the ferris
wheels has eight octants and each octant has five chambers. The muon spectrometer covers 76% of the solid
angle.
The central section of the support tube houses the
inner detectors, arranged as "barrel" elements around
15930 mm
Fig. 2 . Transverse view of L3 .
B. Adeva et al. / The construction of the L3 experiment
8235
39
14 180 mm
i Ç.pennmem s o,, a slope of 1 .39'f.
Fig. 3. Longitudinal view of L3 .
the beam pipe and as "end cap" elements in the forward and backward directions. The barrel elements
consist of Muon Filter, Hadron Calorimeter Barrel,
Barrel Scintillators, BGO Electromagnetic Calorimeter,
Vertex Chamber and the beam pipe. The Luminosity
Monitors are situated immediately ;n front of the low-f3
magnets.
2.2 . Experimental area
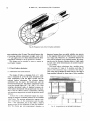
The 21 .4-m diameter, 26 .5-m long experimental hall
is oriented longitudinally with respect to the LEP beam
line, which enters the hall with a slope of 1.39`x. The
hall is equipped with a 40-t overhead crane, an 11-t
Table 1
L3 Detector gas systems
monorail fixed to the ceiling and a 10-t jib arm mounted
on the back cavern wall . There is also a 14-t gantry
crane inside the support tube .
The 23-m diameter and 52-m deep access shaft connected to one end of the experimental hall serves as
access for experimental equipment and personnel, for
hall services (water, cables . gas, ventilation) and provides in its upper half space for four counting rooms
with a total area of 325 m2 directly above the LEP beam
line and protected from radiation by a 1.7-m thick
shielding of concrete beams . A "blockhouse" at the
bottom of the access shaft provides shielded space for
electronics near the detectors (fig. 1) .
The detector electronics is powered via a dedicated
Detector Operating, Fresh gas Recircula- Number
flow
tion flow of
volume pressure
3
parallel
[bar gauge] [m3/hl
[m3/hl
[m ]
circuits
__
1
0.75
1
discontin- 0.2
C02 + 20% i-butane
Time expansion chamber
uous
0
2x 2
0.005
0.02
0.05
Central Z chambers
AR + 20% CO,
0
16 x 10
0.005
0.24
AR + 20% C0 2
3
Muon filter
2x 2
0
< 0.01
0.005
< 0.02
AR + 200 C0 2
LM forward chambers
4x 7
.01-0.05
0.06
0
+
C02
1
0
Hadron calorimeter end caps AR 200
0
16x 9x6
0.01-0.05
0.8
16
Hadron calorimeter barrel
AR + 20% C02
16x 5
2.5
50
0.001
AR +38.5% ethane 250
Muon p chambers
10
16x 3
0.5
methane
50
0.001
AR +8 .5%
Muon Z chambers
Detector
Mixture
Special
requirements
[Relative
stability]
02 < 1 ppm
A drift v. < ±0 .1
A density
< t0 .05%
A mix. < ±0 .1%
B. Adeoa et al. / The construction of the L3 experiment
2-MV A transformer and cooled by water/air heat exchangers mounted inside the racks. In addition, each
counting room is equipped with two 25-kW air conditioners . The ventilation system of the experimental area
has a normal capacity of 40000 m3/h, stabilizing the
temperature to t 1 °C with a dew point at 12° C. In an
emergency, the capacity of the ventilation system can be
doubled.
A 1780-m2 surface hall equipped with a 65-t overhead crane and a 16-m wide, 8-m high door covers the
vertical access shaft. It is used as a test and assembly
hall for all equipment to be lowered into the experimental area. It also houses the magnet power supply, the
electricity and water distribution and the ventilation for
the experimental installations . To permit on-site assembly of large and heavy parts of the experiment, a
1420-m2 assembly hall was built near the vertical access
shaft . It is equipped with a 65-t traveling gantry crane .
2.3. Gas systems
Special gas systems have been built for the different
wire detectors used in L3 (table 1). Recirculation is used
where possible to keep gas cost low, for better control
of impurities and for leak detection by balancing overall
input and output. A very good long-term stability of the
mixture ratio is achieved by 'King infra-red analyzers
with regular recalibration against a reference mixture.
2.4. General safety and gas safety
The design, construction and installation of L3 followed the E;meral CERN saf°.ty rules. In addition, special restrictions are applicable to underground experimental halls with limited access (in particular minimization of flammable material and of halogenated plastics) .
At an early design stage, the L3 collaboration made
various studies to limit the use of flammable hydrocarbons in its detectors. A considerable reduction of fire
risk was obtained by replacing, for the uranium
calorimeter, the initially planned mixtures with high
concentrations of n-pentane by the inert argon/C02
mixture . However, to achieve the required performance
in the precision muon chambers, the ethane concentration could not be reduced below 38.5%, resulting in the
use of slightly more than 100 kg of hydrocarbons in L3.
This choice was accepted by CERN Safety in view of a
whole package of complementary safety features, such
as all-metal detector walls, double gaskets, fusing of
electric power, sensitive leak detection, recirculating gas
systems with sensitive oxygen alarms and a dedicated
ventilation system for the detector volumes . The latter is
combined with a system of smoke detection and a
facility for injecting sufficient quantities of inert gas to
stop any fire inside the detector.
3. The magnet
3.1 . General description of the magnet
All the L3 detectors are mounted inside the huge
solenoid coil which is surrounded by an iron yoke and
closed at its ends by two poles equipped with hinged
doors. The main parameters of the magnet are listed in
table 2.
3.2. The coil
The coil is made of industrial plates welded together
on the CERN site. The selected material, "Anticorodal
041", with heat treatment "71", has 6% less conductivity than pure aluminum but better mechanical and
welding properties. Cooling is provided by two independent circuits made of "Extrudal 050", an aluminum
alloy with high resistance to corrosion, welded onto the
inner and outer edges of the coil (fig. 4). The interturn
insulation is made of 10-mm fiber glass plates covered
with 0.2-mm of Mylar. The 30-kA current is a compromise between the production capabilities of the
aluminum supplier (dimensions, plates thickness,
flatness tolerances), the investment in handling tools
and manpower to manufacture the coil as well as the
difficulties inherent to the transport of high currents.
The 168 turns coil is divided in 28 packages which are
bolted together. The mechanical rigidity of each package
is insured by axial bolts. All bolts are triple insulated .
The gaps between turns are closed with rubber joints to
minimize heat transfer to the detector. The packages
rest on insulated bronze skates which follow the thermal
expansion by moving on two rails embedded in the
lower part of the magnet yoke. The coil is fastened to
one pole, whereas at the other pole, electrically insulated air springs permit coil motion arising from
thermal expansion . An active thermal shield placed on
the inside of the coil protects the detectors.
Table 2
Main parameters of the magnet
Inside radius of the coil
Width of the conductor
VYf.JDW 14t2D4J
Total length of the coil
Electrical power at the taps
Cent:al field
Stored magnetic energy
Rated current
Current density in the conductor
Cooling water
Coil weight (aluminum)
Shielding weight (soft iron)
VD
CaDDr ~VDiV.
5930 mm
890 mm
9w aiuia
11900 mm
4.2 MW
0.5 T
150 mi
30 kA
55.5 A/cm`
150 m3/h
1100 t
6700 t
B. Adeua et aL / The construction of the L3 experiment
41
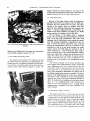
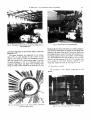
Fig. 4. Edge-cooled plate for the magnet coil.
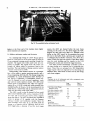
Fig. 6 . First coil workshop, assembling plates into half-turns.
The manufacturing procedure of the coil has been
determined by the dimensions of the detector . The
sectors were welded using electron beam technology. A
set of special tools centered on a welding gun of 45 kW
at 50 kV (fig. 5) was developed to support the quasi-industrial production . In a first step, four sectors were
welded together, forming half-turns of 3 .2 t (figs . 6 and
7). After completion of this work, the equipment was
moved from the CERN SPS site to the experimental site
where, by welding 12 half-turns together, the unit weight
was brought to 38 t (figs. 8-10) . Each 6-turn package
has four cooling circuits ; this design is a compromise
between the ideal case of having two circuits per turn
but an enormous amount of piping or two circuits per
package but water pressure problems . The cooling circuits include more than 6000 welded joints. Numerous
checks concerning dimensions, thermal, mechanical,
electrical, pressure and corrosion behavior have been
conducted during the manufacturing period.
Fig . 5 . The 45-kW electron beam welding gun .
42
B. Adeva et al. / The construction of the L3 experiment
Fig. 7. Stacks of half-turns.
Fig. 8. Second coil workshop, assembling half-turns into 6-turn
packages.
3 .3 . The magnet;ç structure
The magnetic structure is made of soft iron with
0.50 carbon content. The poles are made of 1100 t of
self-supporting steel structure (fig. 11) giving the required rigidity and serving as a support and reference
frame to mount the 5600 t of filling material, which
provides the mass needed for the magnetic flux return
both in the poles and in the barrel . The filling material
supplied by the USSR is made of 50-mm and 40-mm
Fig. 9. Lifting the first 6-turn package.
thick soft iron plates cut to shape and tack-welded to
form individual masses of about 40 t for the barrel (fig .
12) and 15 t for the poles.
A pole consists of two parts, the crown and the
double doors (fig. 13). All the parts are made of open
frames bolted together and positioned with expansion
keys. The crown forms a complete ring and each door a
half-ring. The frame elements of the doors are welded
together in situ . Two rails on each side of the open
frames are used to guide the stacks of filling material .
B. Adeva et aL / The construction of the L3 experiment
43
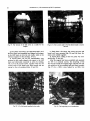
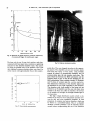
Fig. 10. Stacks of finished 6-turn packages,
Fig. 11 . A steel skeleton for a door.
Each filled half door weights 340 t, rests on grease
skates positioned under the center of gravity and rotates
around large hinges (fig. 14). The hinges can be mechanically disconnected from the doors to prevent overstressing due to the magnetic pressure on the poles.
82-m long water-cooled bus bars made of 30 t of
aluminum tubes. To reduce the fringe field and the
radiated electrical noise, both polarities of the bus bars
are interleaved . The power supply is a thyristor converter delivering a maximum current of 31 .5 kA at 150
V. It consists of two transformers followed by six banks
of water-cooled thyristors equipped with passive filters
and f-- -wheel diodes . During the magnet tests, the
current was stabilized within ±0 .5% of the rated value.
Precision and reproducibility will be improved by the
3.4. The bus bars and power supply
The power supply is installed in the surface hall and
connected to the magnet through the shaft with a set of
Fig. 12 . Filling material .
B . Adeva et al. / The construction of the L3 experiment
magnet monitor' ng system placed on the plug of the
vertical shaft feeds general information concerning the
magnet behavior into the L3 slow control system .
3.6 . Field measurement
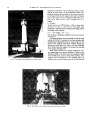
Fig. 13 . One of the magnet poles (door and crown) during trial
assembly .
addition of an NMR probe . The magnet coil is grounded
in the middle through a resistance of 1 St .
3 .5 . The magnet monitoring system
The magnet system includes 159 cooling circuits and
29 interior electrical connections, all monitored by embedded detectors . In addition, potential and field monitoring devices, water flow meters and control valves are
checked (about 2000 detector signals in total) . The
Because of the large volume, which is furthermore
partially obstructed by the support tube, the field measurement has been divided into two parts : The inner
volume of the support tube was mapped with Hall
plates [2] . The remaining volume has been mapped with
about a thousand magnetoresistors, permanently installed on the muon chambers . In addition, five NMR
probes monitor the absolute value of the field .
For the interior of the support tube, a mapping
device was used which had been developed to map the
field of all four LEP experiments . Two rods, each
equipped with 60 Hall plates, rotate around the central
axis . The rotating mechanism is supported by the two
rails on which the hadron calorimeter rests, removed
during the measurements . Both the i :~ovement in the
azimuthal as well as in the axial direction are under
remote control. The Hall plates are oriented in the Z
(main component), r and (P directions. Each component is measured twice . The relative alignment within a
pair and to other pairs is known with an accuracy of 0 .2
mrad . This allows one to determine the minor components of the field with the "sum of differences" algorithm even in the presence of a misalignment of the
gear [2] .
The volume occupied by the muon chambers has
been mapped with magnetoresistors (main component
only) . Magnetoresistors were chosen because they are
economical, stable in time and (since they are sensitive
to B'- ) need only to be calibrated for one polarity of the
field . Their temperature dependence was taken care of
by adding compensating resistors in parallel . The distribution of the magnetoresistors on the muon chambers
was done in such a manner as to have a measurement
whenever the value of the main component changes by
40 G . To facilitate their installation on the muon chambers, up tO ECn magnetoresistors were mounted in a
chain in alur- ;-aum housings up to 1 m long . These
magnetoresistor ensembles were then calibrated in a
small solenoid .
3. 7. The detector support structure
Fig . 14 . View of a magnet door hinge .
The support tube (ST) is a 32-m long, 50-mm thick,
4 .45-m outer diameter heterogeneous tube (fig . 15) with
a flange support at each end to transmit the load to the
ground . The part of the ST which is inside the magnet
(14 .1 m) is of nonmagnetic stainless steel with a 4.6-m
long octagonal double walled central section (fig . 16) .
The remaining portion is of carbon steel . Each flange
rests on two servo-controlled mechanical jacks to allow
B. Adeva et al. / Re construction of the L3 experiment
Fig. 15 . The support tube, with the two captive torque tubes, in
the assembly hall .
continuous alignment of the ST with respect to the LEP
beam (fig. 17) .
The muon chambers are supported by two torque
tubes (TT) on rails attached to the exterior of the
support tube . Each TT, made of nonmagnetic stainless
steel, has a mass of 29 .5 t and supports eight 7-t octants
of muon chambers . A TT is a cylindrical shell with
octagonal ring flanges and eight webs extending from
flange to flange on the outside of the shell (fig. 18) . The
Fig . 17 . One of the servo-controlled jacks .
flanges hold the octant end frames in a stable configuration while the shell resists the torsion of one flange with
respect to the other . The two TT have been fitted over
the cylindrical part of the ST, before the welding of the
last flange support and are now captive on the ST (fig .
15) . The finished ST/717 unit has thus a mass of 340 t .
Stresses and deformation of the ST/TT assembly have
been studied by the finite elements method . It was
found that under full load the tube sags by 7 mm .
3.8 . The magnet assernblv
The assembly of
phases :
Fig . 16 . Installation tests of the barrel hadron calorimeter
inside the support tubes .
45
the magnet progressed
in
Fig. 18 . View of a torque tube before machining .
four
B. Adeva et at. / The construction of the L3 experiment
Fig. 19 . The bottom of the hall serves as a cradle for the
magnet .
Fig. 21 . 5/8 of a crown and 3/8 ôf the barrel ready to receive
the coil.
a) First phase: the lower 3/8 of the barrel and 5/8 of
the first crown were assembled and aligned with respect
to the LEP beam to form the coil cradle, which is the
reference support for the coil (figs. 19-21) ;
b) Second phase: the 28 coil subassemblies were
mounted in this cradle, aligned with respect to the LEP
beam and electrically connected in series by welding.
The 5/8 of the second crown, together with the two
vertical walls of the barrel were then erected and the
piping for the coil completed (figs. 22 and 23);
c) Third phase: the doors, the crown top arcs and
barrel roof were mounted (fig . 24) and the door elements were welded together ;
d) Fourth phase: filling of the two poles was completed (figs. 25 and 26).
After the magnet had been assembled and operated
for 100 h at nominal current, the mounting of the
ST/TT unit inside the magnet began . The ST/TT unit
was pulled out of the assembly hall and lifted vertically
(fig . 27) by a 1000-t crane helped by an 800-t foot
Fig. 20 . 3/ 8 of the barrel installed in the cradle.
Fig. 22 . The beginning of coil installations.
B. Adeva et al. / The construction of the L3 experiment
47
Fig. 23 . The coil installation progresses.
Fig. 25 . The filled magnet doors.
crane ; it was then brought over the opening in the roof
of the building covering the vertical shaft, lowered
through the shaft down to the experimental rreà (fig.
28) and inserted into the magnet (fig . 29) . The same
crane was used two days later to lower the fully assembled 261-t hadron barrel calorimeter .
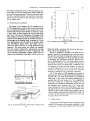
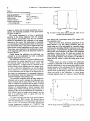
beam axis (fig. 30) . The measured field of the magnet
(fig . 31) agrees with the design value.
3.9. Properties of the magnet
The coil axis has been aligned to within 2 mm of the
Fig. 24. Some of the L3 collaborators in front of the partially
assembled second pole . The top of the coil is still visible .
4. Muon detector
4.1 . Design considerations
The L3 muon detector has been designed (1] to
measure high energy muons to an accuracy of ®p/p =
2% at 50 GeV, thus providing a 1 .4% dimuon mass
Fig. 26. The completed magnet . Notice the heat shield .
48
B. Adeva et al. / The construction of the L3 experiment
resolution at 100 GeV. This is achieved using a configuration of three layers of drift chambers which very
precisely measure the curvature of the muon trajectory
in the region between the support tube and the magnet
coil. In this region, the 0.5-T magnetic field makes a 50
GeV muon track deviate from a straight line by a
sagitta :
s = 3 .4 mm.
To get Am/m = (1 /
plp) =1 .4%, we must measure As/s to 2%, i.e. As= 70 jm. Very good mass
resolution is required for the missing mass Higgs search
according to the reaction :
e+ e- - Z° + Higgs, Z° - j,+~-.
F)(A
Fig. 27 . The support tube being lifted by a giant crane.
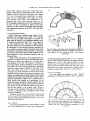
Fig . 32 shows a computer simulation of such an event in
our detector.
The muon detector must be modular to fill the large
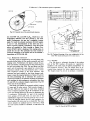
volume of 1000 m3. It consists of two ferris wheels, each
having eight independent units or octants (fig. 33). Air
pads on the support tube allow rotation during the
installation phase. Rails are used to roll the assembled
ferris wheel inside the magnet. The octants are attached
to the torque tube (fig. 34) .
Each octant consists of a special mechanical structure supporting five precision chambers. There are two
chambers (MO) in the outer layer, two chambers (MM)
in the middle layer, and one inner (MI) chamber . They
measure track coordinates in the bending plane . In
addition, the top and bottom covers of the MI and MO
Fig. 28 . The support tube arriving at the bottom of the acce :a shaft.
B . Adeva et al. / The construction of the L3 experiment
49
Fig. 29 . The support tube entering the magnet.
chambers are also drift chambers and measure the Z
coordinate along the beam . There are a total of six Z
chambers per octant . Prime consideration was given to
the accuracy of the sagitta determination. Our detector
has been designed to minimize the contributions from
the mayor causes of errors in the sagitta measurements
which are:
a) intrinsic resolution of the drift chambers ;
b) multiple scattering ;
c) accuracy of alignment of chambers belonging to
different layers .
An intrinsic accuracy of 250 lim per wire is sufficient
to reach the design resolution . Careful chamber optimization studies have led to smaller values [3]. We average
over several wires to obtain the final tracking accuracy .
Multiple sampling improves the resolution by a factor
n over the single wire resolution . MI, MM, and MG
sample the muon track n = 16, 24 and 16 times, respectively . The resulting measurement error is :
,Is
=(E1 /2+E?)
with E, and E, defined in fig. 35 .
We use thin aluminum honeycomb with an average
of 0.9% of a radiation length per two layers io enclose
the middle chambers . Using this design, a multiple
scattering induced sagitta error of < 30 ;, m at 50 GeV
was reached.
Regarding point c) above, with these small sagitta
values, muons more energetic than 3 GeV will be conX-0, Y-0, 1-30333A
5.5 [kGaueel
-2
0
5
10
15
20
Coil Package number
Fig. 30 . Coil alignment.
25
30
3.5 ~
1
2
3
4
®latance along Z axle [m]
Fig. 31 . Measured field .
5
6
B. Adeaa et al. / The construction of the L3 cxperiment
50
Z CHAMBERS
I'd
/J1
P CHAMBER _.
AMPLIFIERS
P CHAMBER
a)
Fig. 34 . An octant module is attached to the supporting torque
tube . Precision chambers, Z chambers, octant support stand,
amplifiers and cables, gas system, and the UV laser calibration
system are also shown .
2 .9 m
44
cl
Fig. 32 . End view (a) and side view (b) of the L3 detector.
Tracks in the muon chambers are those of a computer simulated event+
of the type e +e- - Z° + Higgs with Z°
and Higgs -- bb fragmentation.
fined to one octant . Therefore, alignment is only critical
between chambers of the same octant (fig. 36). To
achieve the design resolution, systematic errors in the
internal octant alignment must be kept below 30 Rm.
As described later, this requires complex optical and
=
250f,l, m
/_
N1
e2
E3 -E1
Fig. 35 . Measurement errors on the sagitta of a muon trajectory curved in a magnetic field.
0-'ER
CHAMBEP (M0',
16 wires
IIIIIilI1111111146lIIII)III~IIIElvüpl!
MIDDLE (MM)
24 ..,es
29 m
1111111111111111111111111111 111111111111111111
INNER (MI)
i Lens
I
I
0 LED
16 +~res~lIlIlIIIIII,IIII,IIIIIjI~IIIIIIIIIIIII
r
Fig. 33 . Schematic view of the assembled muon detector .
Fig. 36 . End view of the three chamber layers in one octant,
with a schematic view of the alignment system and a detail of
the middle chamber.
B. Adeva et a!. / The construction of the L3 experiment
51
4.2. Precision chambers
------------ENDFRAME
Fig. 37 . Exploded view of an outer (MO) precision chamber
and detail of Z chamber.
mechanical measurements as well as UV laser and
cosmic ray verification . Sagitta errors less than 30 Rm
have been achieved in all octants.
The momentum measuring, or "P" chambers, are
constructed of two cast and machined aluminum end
frames, and two extruded aluminum side panels . The
inner and outer chambers are closed on the top and
bottom by Z chambers . The middle chambers are closed
by honeycomb panels to avoid degradation of the resolution due to multiple scattering. An exploded view of
the mechanical structure of one MO (MI) chamber is
shown in fig. 37, and fig. 38 shows a photograph of an
assembled chamber just prior to Z chamber mounting.
There one can see the 5.6-m long wire planes positioned
by "end bridges" inside the gas-tight box of end frames
and side panels . The insert in fig. 37 depicts the double
plane configuration of the Z layers .
Each P chamber contains about 320 signal wires and
a total of 3000 wires. The signal and field shaping wires
are positioned to about 10 ILm in the magnetic bending
direction and to better than 40 tLm in the nonbending
direction by precision Pyrex glass and carbon fiber
bridges (fig. 39a). These bridges have very small thermal
expansion coefficients (1 .5 ppm/°C) so that temperature effects on the wire positions are negligible. The
1200
x
w
ENTRIES
a
0
w
m
800
z
400
0 i
-0 1
RMS
-0 OS
0
01
005
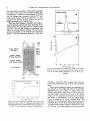
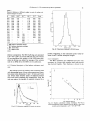
Error center of pyrex plate
Fig. 38. An assembled chamber is shown before it is closed by
a Z layer.
4623
5.2 lim
(mm)
Fig. 39 . (a) Three bridges support the %. ices . Three straightness
monitors and actuators are schematically indicated. Added is a
schematic showing the details of the straightness monitor. (b)
The accuracy of the bridges caa be seen from this distribution
of errors in the equidistant locations of the Pyrex glass pieces .
B. Adeva et al. / The construction of the L3 experiment
52
Pyrex glass pieces were glued to carbon fiber supporting
bars using a very precise Invar template. Bridges thus
produced have a surface-to-surface spacing of 101 .500
mm . All bridges were measured using an HP laser
interferometer system with an accuracy of 2 [Lm. The
measured rms absolute position accuracy for all 255
bridges produced was 5.2 Rm (fig . 39b) .
There are three bridges per chamber. One bridge at
each end precisely positions the wires; the bridge in the
middle reduces the sag of the wires by a factor of four
(fig. 39a). The two end bridges are positioned with
respect to external reference surfaces. The wire planes
are put into position in the chamber and adjusted in
length so that the vibrational frequency of the first
-.2 0 .2 m m
300
DRIFT
TIME
fis
z
0
200
0
Argon : Ethane
62*386
W
100
SIGNAL WIRES
W 30ILm dia,130g
FIELD WIRES
Cu Be 75 f£m dia, 385g
0
9mm Spacing
1
1
0
10
1
1
20
30
DRIFT DISTANCE
1
40
(mm)
_IJ
50
Fig. 41 . (a) Distribution of residuals for cosmic muon tracks
fitted to 14 of 16 wire measurements . (b) Resolution as func
tion of the drift distance measured in 0.5 T with a test
chamber.
a)
70
60 -
PARALLEL DRIFT VELOCITY
[N.m/nsec]
50
40
30
20
10
E
0
250
500
750
1000
1250
,
ELECTRIC FIELD [V,. cmf
Fig. 40 . (a) Electric field lines in a drift cell of an inner or outer
chamber are shown with a 0.5-T magnetic field parallel to the
wires. Drift times refer to a track 44-mm from the signal wires .
(b) Drift velocity computed as a function of the drift field.
harmonic is 27 .85 ± 0.2 Hz for signal wires. This ensures equal gravitational sags of 95 tLm for all signal
wires.
Three internal alignment systems are integrated into
the structure of the bridges (fig. 39a) . This threefold
alignment system (41 consists of LED, lenses and
rr,nt ~
~nfiarii1 _rion Y ;-h. irV
7 LTI
csA
quadrant
~LlJ4VLJ
~J1aV
. LJ. L1~Ali 11d11 a.
. 1.1.1 mount
ült
r
Vll
one end bridge is focused by the lens in the middle
bridge onto the quadrant photodiode at the opposite
end bridge . A displacement 8 of the middle bridge
moves the image by 28 on the quadrant diode. The
imbalance of the photodiode output measures this displacement. Each set has been individually calibrated on
an optical bench and the systems are linear over a range
of ± 250 w m. The middle bridge is moved by actuators
B. Adeva et al. / The construction ofthe L3 experiment
in x and y (perpendicular to the beam direction) in
response to computer readout of the system. The bridges
are aligned when all four quadrants of the photodiode
receive equal amounts of light . These systems allow us
to position the bridges and thereby the wires to an
accuracy of 10 [tm . Deviations from zero occurring as
functions of time or temperature are continuously recorded.
Wires are put into position along the Pyrex surfaces
of the three bridges uEing a template. They are then
attached to the Pyrex surfaces with an insulating wax.
Since the Pyrex edges are optically flat, the average of
the 16 (or 24) signal wires has little systematic error and
one can determine the local track slope to 1-2 mrad.
Fig. 40a depicts a chamber cell with 16 signal wires
showing the computed drift paths in a 0 .5-T magnetic
field.
The chamber cell has been designed to have a very
uniform electric field throughout the active region . Sense
wires are spaced 9 mm apart and are interspersed with
field wires. Eight additional wires beyond the last sense
wire equalize the drift time behavior of all the sense
wires within 0.2 ns (10 Rm) . A plane of cathode wires,
spaced 2.25 mm apart, is at 50.75 mm from the sense
wire plane. Four different high voltages are applied to
the sense, field, cathode and guard wires, allowing us to
control the drift field, the gas amplification and the zero
potential position. At nominal voltage settings, in a
0.5-T magnetic field and at 740-mm Hg pressure, the
gas gain is 5 x 10⁴. With an electric field of 1140 V/cm
in the drift region, the drift angle due to the Lorentz
force is 18.8 °.
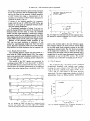
Fig. 40b shows the computed drift velocity for constant pressure, temperature and magnetic field. More
precisely, the time-to-distance conversion function x(t)
= v(O, B, P) x t in the drift cell has been mapped in
test beam runs and its dependence on the track slope 0,
magnetic field B and barometric pressure P was measured. Corrections are at most a few hundred [,m near
the sense and cathode planes . Without magnetic field,
the measured cosmic ray residuals of a chamber with a
threshold equivalent to the 10-12th drifting electron
reaching the wire and two hits dropped is 136 wm (fig.
41a'..
The chamber resolution in a magnetic field depends
on the distance from the wire plane and on the slope of
the track . Resolution across the cell varies from 110 Rm
to n maximum of 2.5(1 urn close to the sense wire. Fig .
41b shows the rms resolution as a function of the
distance from the sense wire. The region of degraded
resolution near the cathode plane is due to sloped tracks
which are largely in the adjacent cell and to inhomogeneity in the electric field. From the data, we calculate
that the overall rms chamber resolution is 168 ~Lrn. This
is an average over all positions and slopes we expect for
high momentum tracks.
53
4.3. Z Chambers
Z chambers [5] consist of two layers of drift cells
offset by one half cell with respect to each other to
resolve left-right ambiguities . Each cell has two parallel
aluminum I beams (fig. 37) connected to - 2.4 kV and
one gold-plated molybdenum anode wire with 50 Rm
diameter at + 2.15 kV in the center. The cell is closed
by two aluminum sheets at ground potential and isolated from the I beam profiles by fiber glass strips.
The Z chamber gas mixture (91 .5% argon and 8.59
methane) was chosen because it is not explosive. The
drift velocity averaged over the cell is about 30 ttm/ns.
The measured resolution, both in a test beam with a
prototype and with cosmic rays in production chambers, is typically 500 l, m. Since these chambers are the
covering elements of inner and outer precision chambers, tight dimensional tolerances were needed to ensure
mechanical fitting and thus precise machining was required on the Z chamber frames. Relative wire spacing
also depends on these frames. Aside from that, the
design and technical specifications allowed for a rather
simple construction. All of the 96 Z chambers (dimensions about 6 m x 2 m) were built in two years with a
production rate reaching six chambers per month at the
end of the second year.
4.4. Octant stands
Octant stands are precision structures supporting the
chambers and maintaining long term chamber alignment to <_ 30 ~Lm . The structures have been designed [6]
to avoid tensor force transmission, thus octant behavior
is fully predictable under all conditions of stress, load
and temperature [7] .
The main elements of the octant support structure
are the A frames (fig. 42). They support each P chamber at four points, two in each A frame. The MI
chamber is mounted directly onto the A frame, while
the other chambers are mounted on special support
bars. A combination of support points with zero, one or
two degrees of freedom ensures that chambers can move
following temperature variations without introducing
unwanted mechanical stresses. A longeron connecting
the two A frames provides mechanical stiffness in the Z
direction .
In addition to the large structural components, there
are approximately 300 small precision parts per octant.
Materials were selected for strength, thermal characteristics and long term stability . Special materials, such as
titanium and copper-beryllium have been used for
chamber support feet, chamber tie-plates, torque tube
joints and other highly stressed areas.
Daring the assembly phase, each octant undergoes
detailed dimension and referencing checks ; some of the
design tolerances are listed in fig. 42b. The four support
B. Adeva et aL / The construction of the L3 experiment
54
feet on the floor which simulate torque tube attachment
holes have been positioned in a plane to 50 [,m. Critical
distances between reference surfaces are measured to 5
~Lm by means of special tools calibrated with a laser
interferometer. Angles are measured with electronic
bubble levels [5] which have an intrinsic resolution of
better than 1 Wrad. A completed octant is shown in fig.
43 .
After chamber loading, preliminary alignment and
functionality tests, each octant is subject to a detailed
alignment verification (see section 4.10) . Then it is
rotated to the angle corresponding to its final position
in the ferris wheel and alignment is performed to the
specifications of fig. 42b. The elastic nature of the
structure is verified by the absence of hysteresis in
octant rotation . This is important in view of the installation scheme on the torque tube. For these reasons, each
octant is rotated through 360 °, then its alignment is
rechecked. All octants have been processed in this way
and have shown full reproducibility, hence elastic behavior.
Fig. 43 . End view of an octant .
4.5. Opto-mechanical alignment: vertical alignment system
ot1 "NT
FNO~N4M
581 ~,
L "CN
OCL
Fig. 42 . (a) The octant stand structure. (b) Some of the
alignment tolerances are shown for assembled octants. The
alignment tolerance on the chamber center lines is only 25 lim
The accuracy of the bridges inside the P chambers
and of the internal alignment systems built into them
assures that wires within a chamber are precisely positioned with respect to each other. The next step is to
relate the wires in one chamber to those in the rest of
the octant .
Straightness monitors similar to that of the precision
bridges are part of the octant alignment system [4j (fig.
44). A precision piece containing two LED is attached
to each end frame of an inner chamber. An insulated
brass pin referenced to the LED touches one wire of a
signal plane. The end bridge can be moved so that the
wire just makes or breaks its electrical contact with the
pin. In this way, the end bridge positions are set to
within a few ~tm. The middle and outer chambers have
a similar system of pins touching wires. These pin
assemblies and thus the wire planes of opposing chambers are kept at the precise cell separations of 101 .500
mm by gauge blocks. The assembly between middle
chambers contains a lens and that between the outer
chambers contains two quadrant diodes. Each end thus
has two straightness monitors which were calibrated on
an optical bench.
Based on the readout of these systems, the middle
chamber can be moved on its titanium flexture feet to
bring the chamber centers into a straight line with an
error smaller than 10 lt m. Readout of this system over a
4-clay period is shown in fig. 44c .
B. Adeva et al. / The construction of the L3 experiment
Photodiode
Lens
a)
mm
LED
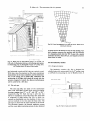
Each of the 16 octants contains a two-stage nitrogen
ultraviolet laser [10,11], which is operated under computer control. The laser beam is directed up and across
the top of the outer chamber layer by an addressable
movable beam directional element (fig . 46). Mirrors
direct the beam down through a quartz window into
selected drift cells of all layers of the octant which are
connected by tubes pointing roughly to the interaction
point. Photodiodes at the bottom of the MI chamber
measure the intensity and position of the beam centroid .
Each octant has eight laser beam trajectories, which
simulate infinite momentum particles coming from the
interaction point. The sagitta of laser events should be
zero [10,11], and thus is used to verify the alignment.
Two of the laser beams have movable mirrors and can
produce parallel trajectories of exactly known separation, allowing us to measure and constantly monitor
the electron drift velocity.
4.8. Electronics
X (microns)
0
20
accurate rotating pentaprismatic mirror assembly sweeps
out a plane to an accuracy of better than 30 tLm . The
deviation of the octant center lines from this reference
plane is measured by six position sensors (multichannel
photodiode arrays) attached directly to the three elements of each vertical straightness monitor. The laser
beacon (fig. 45) can measure the angle between the two
octant lines to better than 25 brad, corresponding to an
error in the sagitta of less than 10 [,m. The MO and
MM chambers are adjusted so that this measured angle
is zero .
4.7. UV laser
mi
20
55
Time (days)
10
15
0 I
5
Fig. 44 . (a) Principle of referencing the octant center line
directly to the wires of the three chambers . (b) A vertical
alignment piece assembly with a lens (for the middle cham
bers). (c) Relative position of the middle chamber in an octant
monitored over a two weeks period .
4.6 . Laser beacon
The vertical alignment systems guarantee that the
chambers line up at each end of the octant, but the two
octant center lines must also be parallel to each other.
We use a lager beacon [91 to measure the degree to
which the two ends of the octant are parallel . A He-Ne
laser beam which is reflected by 90' by a highly
The signals from 27 648 P chamber wires are connected via 82-9 decoupling resistors to 13 824 amplifiers
[12] in corresponding pairs of wires from both detector
wheels . Amplifiers are located in the median plane of
the detector. The amplifiers convert incoming currents
to voltages with a conversion factor of 25 mV/[,A . The
differential output (typically 200 mV for a muon) is sent
via 30 m of twisted pair cable to discriminators [13] set
to a 20-rnV threshold. The logical " time over threshold"
signal is conducted through about 14 m of twisted pair
cable to 500 MHz FASTEUS time digitizers LeCroy
LRS 1879 which continuously record until the common
sto? from the beam crossing arrives. The TIC cover a
range of 1100 ns with 2.2 ns least bit accuracy .
The system has proved stable to 0.2 ns (corresponding to 10 l,m) when checked by our standard To calibration systen, [4} which electronically induces pulses onto
the wires. All wires of the Z chambers are similarly
processed by 7680 time recording channels . Parallel
outputs without time processing are used to form fast
road triggers .
B. Adeva et al. / The construction of the L3 experiment
56
a)
Rotating
mirror
Fig. 45 . (a) The laser beacon references six points in the center plane. (b) Two laser beacon sensors with precision templates for light
transmission .
4.9. Control and monitoring
In addition to readout of the alignment systems, the
laser beacon system and the UV laser system, there are
other critical parameters which must be monitored and
controlled :
- the chamber high voltage system,
- the signal pulse height,
- the time zero (To ) calibration,
- the octant temperature map,
- discriminator thresholds,
- preamplifier power supplies,
- actuator motor position monitors,
- magnetic field measuring probes .
All of these tasks are performed by the monitoring
system, which consists of a network of VME crates
using an OS-9/68000 operating system . They have multitask, multiuser and stand alone capabilities, and also
communicate with the main online computer.
4 .10. Results of alignment verification
Each of the octants is adjusted as closely as possible
to an ideal geometry using the double set of straightness
sensors and the laser beacon . UV laser runs of 100
events are then taken using the eight different laser
beam paths in each octant . Reconstruction of the laser
trajectories (fig. 47a) should show straight lines . The
deviation from zero called sagitta, which is a measure of
our alignment accuracy, is defined as :
S = - ( xmi + xmo ) /2 + xrnm,
where xmi, x m , and x mo are the coordinates measured
in the inner, middle and outer chambers, respectively .
Fig. 47b shows measurements from 42 laser runs, for
one octant. Errors on the points are obtained from the
residuals of 100 event runs . The resulting average of all
runs
-25 ±10[.m
Fig . 46 . UV laser alignment schematics : ThP beam from the
nitrogen laser is directed by a beam directional element into
eight trajectories . Position sensitive photodiodes which mea
sure the location of the beam at the bottom of the inner
chamber are schematically indicated .
is within the design limit of 30 [Lm . The error is derived
from the scatter of results from the different runs, thus
taking systematic errors of the laser into account .
An independent way of checking octant alignment in
the absence of a magnetic field uses cosmic muons .
Scintillation counter hodoscopes are positioned above
and below the octant, and moved to either end as
desired . The resulting coincidence trigger, is used as a
TDC stop . Runs of about 10000 events are taken at
B. Adeva et al. / The construction of the L3 experiment
57
a)
LASER
RUN 5059
EVENT 6
b)
150
,---.--------
100
50
fumJ 0
.-~~ -;~-r--r1
-26±l0 N.m
r
K
z
w
-50
w
100 ~F
-150L- -950
975 1000 1025 1050
Run number
Fig. 47 (a) A computer reconstructed laser event. (b) Measured
sagitta from a series of 42 runs of 100 laser shots each .
both ends of the octant . Tracks are reconstructed from
the chamber segments as shown in fig. 48a.
Accepting all cosmic rays, we obtain the wide histogram in fig. 48b which has an rms of 1 .3 mm . This large
width is due to multiple scattering from the predominantly low energy cosmic muons.
The L3 muon chambers are unique in that they also
measure the local slope of the particle trajectory to an
accuracy of = 1 mrad . Demanding that the local slope
in a chamber agrees with the overall particle trajectory
to within 2 mrad eliminates events with large multiple
scatters . A narrow distribution of 760 events is obtained
in fig. 48b. The centroid confirms that this octant is
aligned to :
s=(2± 40W7_60 ) ~t m=2± 14 .5
[t
-4
-2
0
SAGITTA
2
(b)
Fig. 48 . (a) A cosmic ray track reconstructed in the middle
chamber. (b) Sagitta distributions measured without cuts and
with 2-mrad cut.
OCTANT
OCTANT
OCTANT
OCTANT
OCTANT
OCTANT
OCTANT
OCTANT
OCTANT
OCTANT
OCTANT
OCTANT
OCTANT
m.
Fig. 49 summarizes the results for 16 octants. s = 0 is
given by the setting of the two independent opto-mechanical systems. The squares show verification of the
geometry by UV laser measurements . The cosmic ray
data are shown in circles as a third independent measurement. We see excellent agreement between all three
methods, and find all octants to be well within the
range of specification of ±30 lim.
4.11. Conclusion
The L3 precision muon detector is unique in its
conception and ability to detect dimuons with 1 .4%
4 nlm
OCTANT
OCTANT
OC'T:1\T
Sagitta
(microns)
16
1-_~
1-1
13
12
11
10
8
7
6
5
4
3
1
Fig. 49 . Compilation of alignment results for all 16 octants.
The zero sagitta prediction is the setting of the opto-mechanical system . UV laser verification results are shown as square :
circles indicate the center of cosmic ray distribution measure
ments. A 7-hm systematic error on each laser measurement is
not shown .
58
B. Adeva et al. / The construction of the L3 experiment
Fig. 50 . Perspective view of the L3 hadron calorimeter .
mass resolution at the Zo mass . The critical feature, that
of detecting (infinite momentum) straight tracks with
< 3n l.Lm sagitta error, has been demonstrated by three
independent methods for all 16 production modules.
This design can be extended to mea, are muons at
much higher energies .
5. L3 barrel hadron calorimeter
5.1 . Motivation and overall structure
The energy of hadrt, ..s emerging from e+ e- collisions is measured in L3 by the total absorption technique (calorimetry) with the BGO crystals and the
uranium hadron calorimeter. The uranium hadron
calorimeter has two parts: the barrel part and the
forward-backward part . The hadron calorimeter barrel
covers the central region (35 ° < D < 145 ° ); it is a fine
sampling calorimeter made of depleted uranium absorber plates interspersed with proportional wire chambers ; it acts as a filter as well as a calorimeter, allowing
only nonshowering particles to reach the precision muon
detector,
Uraniurr has a short absorption length, thus maximizing the amount of absorber material in the available
radial space. The uranium radioactivity imposes stringent requirements on the construction and the operation f the calorimeter, but it also offers a built-in
gamma source for the calibration of the wire chambers
[14] . We choose gas wire proportional chambers as
detectors because they are stable, reliable, can operate
in the magnetic field and are relatively easy to produce
on a large scale. Moreover, in a multiwire detector the
wires can be grouped in any readout pattern. By orienting the wires in alternate chamber planes at right angles
to each other, better determination of particle trajectories is possible .
The barrel hadron calorimeter has a modular structure consisting of 9 rings of 16 modules each (figs. 50
and 51). The innermost ring is centered at the interaction vertex and is flanked on either side by one ring of
long modules followed by three rings of short modules.
Fig. 51 . Longitudinal cut of the hadron calorimeter .
B. Adeva et al. / The construction of the L3 experiment
The hadron calorimeter barrel is 4725 mm long, has an
outer radius of 1795 mm and an inner radius of 885 mm
for the three inner rings and 979 mm for the outer rings.
The 261-t assembled barrel was lowered to the experimental area in one piece by the same giant crane used
for the support tube.
5.2. Proportional wire chambers
NI
GAS CONNECTOR
PLASTIC ENO - PIECE
I
GAS MANIFOLD
PL ~S TIC PLUG
MYLAR FOIL
SHIELDING PLATE
SEE FIG
ab
-(ONNECTOR .
TUBE
28
Ln
WIRE
SE(hi;N
C A
Q=0.04
24
L1J
20
0
p
z
The design of the chambers [15] is presented in fig.
52. The chamber gap is made as thin as possible without
loss of mechanical stability for the anode wires at the
working high voltage . Each chamber is made of a plane
of brass tubes of equal length with 0.3-mm thick walls
and 5 mm x 10 mm inner dimensions. The length of the
tubes ranges from 347 mm to 605 mm depending on the
position of the chamber inside the modules . The structural strength of the chamber body is assured by 0.7-mm
brass plates glued onto both sides of the chamber plane
with self-adhesive Mylar sheets. The Mylar also insulates the tubes which are at a high potential during
operation. The brass plates also shield the chamber
from the uranium radioactivity, reducing the counting
rate due to the uranium by an order of magnitude . The
50-Vm diameter gold-plated tungsten anode wires are
crimped into gold-plated brass jacks, which in turn are
59
a
ô
ILA
16
12
01 .
0 .4
.
~
0.6
_/
0.8
.
1.
1
1 .2
1 .4
1 .6
RELATIVE GAIN
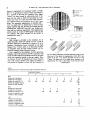
Fig. 53. Relative gain distribution for the wires of the chambers.
fitted into plastic end pieces. The tension in the wire is
250 g with an rms spread of 17 g.
The gas is supplied in parallel to all tubes via two
channels which are incorporated into the end pieces .
The gas inlet and outlet are diagonally opposite to each
other to ensure adequate flow of gas through all tubes .
In designing the calorimeter particular attention was
paid to minimizing the size of the dead regions such as
the chamber end pieces, various support structures and
space for the services . To achieve this, 53 different sizes
of chambers are used, with the number of tubes per
clamber ranging from 33 to 58. For the same reason the
chambers are operated with the anode wires at ground
potential, avoiding the use of numerous capacitors.
All 371764 wires of 7968 chambers were tested in
the production line [15] and showed good uniformity of
response (fig. 53). This measurement was performed
using both Y rays from the natural radioactivity of
uranium (fig. 54) and cosmic rays. Two independent
tests were carried out to check the longevity of the
chambers in a radioactive environment . In the first test
the chambers were irradiated with a 104 times more
intense radioactive source over several days at the working high voltage . In the second test the chambers were
operated in the normal uranium plate/chamber stack at
10 times higher proportional gas amplification (fig. 55).
In both cases the chambers proved to be very stable and
no aging effects were observed .
5.3. Module design
Fig. 52. Proportional chamber of the hadron calorimeter barrel .
Both long and short modules have basically the same
design . The inner part of the module resembles a tower
mounted on a 15-mm thick stainless steel base (fig. 56) .
60
B. Adeva et al. / The construction of the L3 experiment
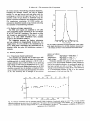
8
10
10
106
N 10 5
cd
Cu
w
0
103
102
10
Amplitude (arbitrary units)
Fig. 54 . Spectrum of signals caused by uranium radioactivity :
(1) normal self trigger ; (2) random gate Nigger .
The base and the top 15-mm thick stainless steel platc,
connected with four spacer bars, constitute a supporting
structure for the absorber/chamber stack . The spacers
lie along the parallel faces of the modules . The 5-mm
thick depleted uranium absorber plates are plated for
safety reasons with approximately 20-lirn thick copper-
w
m
w
_
0
0.8
0.4
0.2
0.0
DAYS OF OPERATION
Fig. 55 . Gain stability measurement.
Fig . 56 . Hadron calorimeter module.
nickel alloy . They are clamped into place in the supporting spacers . The chambers are put onto uranium plates
and fixed with epoxy at four points . Long modules
contain 60 planes of proportional chambers and 58
uranium plates plus the top stainless steel plate . This
plate which lies between the BGO calorimeter and the
uranium plates is part of the 54-mm shielding for the
BGO photodiodes. Short modules contain 53 chambers
and 51 plates of uranium. plus the
less steel p'a*c .
The dimension. a l tolerances of the absorber plates and
the chambers are very tight, especially for the thickness .
The chambers with wires parallel to the beam axis are
referred to as 4) chambers and the ones with their wires
normal to the beam are called Z chambers . All services
of the module are brought out through feedthroughs in
the base plate.
The high voltage distribution system which is embedded in the base has four independent channels serving the odd and even numbered chambers in each
projection . It contains one fuse per chamber, which can
be blown in a controlled fashion . Thus if a chamber
develops a serious problem it can be remotely disconnected without compromising the rest of the chambers
B. Adeva et al. / The construction of the L3 experiment
in the group . The gas (80% Ar + 20% C02 mixture) is
supplied serially to groups of five chambers in the same
projection . Groups are connected in parallel to a common inlet and outlet located on the module base. The
services are fitted into the space between the absorber/
chamber stack and the hood.
In four modules of each ring (top, bottom, left and
right) the internal temperature is monitored at three
positions with PT1000 sensors embedded into one of
the spacer bars. The measurement accuracy is better
than 0.5* C. The information is used in the offline
analysis to correct for the change in the gas gain due to
temperature variations.
The hood is made of stainless steel plates welded
along all edges. The slanting walls of the hood point to
the beam axis and produce a gap in the acceptance.
They, therefore, were made as thin as practical (4 mm).
The parallel walls are 15 mm thick, while the top plate
has a thickness of 22 mm. The hood is bolted gas tight
to the module base and locked to the 15-mm top plate
so that in any orientation of 'be module the space
between the stack and the hood served for the services
is preserved . The smallest chamber of the stack is
situated between the hood and the 15-mm plate. Gas
fittings are provided in the base to permit the gas flow
into and out of the space between the stack and the
hood independent of chamber gas supply and return. In
practice the exhaust from the chambers in each module
is fed into the housing, maintaining a small over-pressure in the chambers . A long module weighs 1860 kg, a
short module 1720 kg.
5 .4. Barrel mechanics and services
The 16 modules are mounted on a 17-mm thick
stainless steel ring and are bolted together at their outer
61
radii for added rigidity (fig. 57). Each assembled ring
can move on two rails inside the support tube on two
sets of rollers attached to the modules just below its
mid-plane . The nine rings of the barrel are bolted
together through the support plates of the rollers. In the
assembled barrel (fig. 58) the 144 base plates form the
outer surface of the barrel. The connections for the high
voltage, preamplifiers, temperature sensors and gas piping are all situated on this surface . Preamplifier boards
are plugged directly into the connectors in the base
plate. The preamplifiers dissipate about 10 W per module and this heat is removed by liquid-cooled fins
mounted on the base plate.
5.5. Tower structure
In order to measure the energy of hadrons and
hadron jets, to separate two jets from each other and to
determine the energy loss and the trajectory of muons
passing through the calorimeter, a high degree of readout segmentation in the calorimeter is required . This
need is accentuated by the fact that in some cases it is
necessary to confine the measurement to the immediate
region in which the energy is deposited in order to
reduce the background from the natural radioactivity of
uranium . To this end, the wires in each module are
grouped to form readout towers (fig. 59). In the 0
projection the towers point to the beam axis with a
constant angular interval . The segmentation is 9 in 0
and Z for both kinds of modules and 10 (8) in the
radial direction for the long (short) modules . In the Z
projection the towers have a constant width, whereas in
the 0 projection they point to the beam axis. The
number of wires in each tower depends on the position
of the tower and ranges form 3 to 28. The granularity is
Fig . 57. An assembled hadron calorimeter ring.
62
B. Adeua et al. / The construction of the L3 experiment
Fig. 58. The assembled hadron calorimeter barrel .
highest at the front end of the module where higher
shower densities are expected .
5.6. Hadron calorimeter readout and electronics
At a working high voltage of 1 .6 kV the gas gain is
about 10 4. This gives rise to an anode signal of about 50
fC per minimum ionizing particle passing through the
chamber. The signal wires within each tower are connected in parallel . The signals from the towers are
brought via ribbon cables to conn :ctors fixed to the
base plate. The total number of charge sensitive readout
channels in the barrel is 23040.
Electronically, each channel consists of a preamplifier, a 40-m cable, a passive receiving network, and a
charge integrating ADC (fig . 60). The charge integrating
preamplifier is a joint development effort between L3
and LeCroy Corporation. A preamplifier board contains 24 channels as well as power regulators, shark
gaps and test pulse injection circuits . The differ-.ntial
output signal is transmitted to the ADC over approxintately 40 rn of 110-2 twisted pair cables grouped into
shielded bun_files of 24 pairs. At the receiving end of the
cable there is a transformer and an attenuation network
which sets the energy scale in the ADC.
The ADC chosen are the 96 channel LeCroy model
1882 12 bit FASTBUS ADC, with. a sensitivity of 50 fC
per count. The ct.m ,~rsion plus readout time is slightly
more than 500 l.Ls . The ADC are placed into FASTBUS
crates in groups of 18 together with the Segment
Nlanagcr module and Calibration module . Since the
beam crossings occur every 22 fis, the ADC hold the
charge on a capacitor before Digitizing, until the first
level trigger gives a decision If no first level trigger
occurs, the ADC are cleared before the next beam
crossing. In the event of a first level trigger the ADC
digitize the data and store them in a multiple event
buffer on the ADC board. In the meantime any event
left over in the buffer from a previous gate is piped out
to Multiple Record Buffer memories over 70-m ECL
cables . Finally the data are moved to Dual Slave Memories for event building and for transfer to the VAX
pending the second and third level trigger decisions.
The ADC provide immediately a fraction (1/8) of
the input charge on a separate line for triggering purposes. These lines are grouped into 288 independent
trigger signals which are digitized by Fast Encoding and
Readout ADC. These data are then used by the energy
and cluster triggers .
Table 3
Thickness in cm of calorimeter and other components measured normal to the beam line
inner ring+inner flange
(Stainless steel)
First plate (stainless steel)
7 .
9v
Base plate
plate (stainless
ste"A)
Shield plates (bra~s)
l'Vä C tubes (brass)
Uranium
CHO : Mylar
BGO
Scintillator
Muon filter (brass)
Suppo:t tube (stainless steel)
Long
modules
Short
modules
4.0
1 .5
4.0
1.5
8.4
5.3
27 .94
2.0
7.4
4.7
24 .57
1 .8
1 .5
1 .5
24 .0
1 .0
16 .5
10 .0
B. Adeva et at. / The construction of the L3 experiment
. : : : :- : : .! : :1.-
63
: :_ :--_-_
_r
r
j 61
1
62
1
63
I
1
-~
64
'
65
T
41 I
42
I
1
66
43
rowWpor~lwwi -31
32 1
33 i
34 ;
36
35
21
22
1
23
24
_5 ,
26
38
28
_
Fig. 59. The wire grouping for the long module (a) 0 projection ; (b) Z projection .
5.7. Physical properties
The relevant properties of the barrel in terms of the
thickness of various materials of which it is constructed
are given in table 3. In tables 4a-4c the thickness of the
barrel components and the integral from the beam axis
(perpendicular to the axis) are given in interaction
lengths and minimum ionization energy loss . Values in
table 4 are calculated from the data published by the
Particle Data Group except for pion interaction data,
which are taken from ref. [16] . Table 5 shows how the
calorimeter thickness varies with the polar angle O.
The properties of the hadron calorimeter utilizing
Ar/C®2 gas proportional chambers with uraniudn absorber piates have been studied extensively, both as
prototypes and for completed detector modules. One
phase of the study was the characterization of the
Amplifier
Twisted Pair
Cable
( -4O141)
Trarlsf(>rmcr
1 ttenu.ito )r
Fig. 60 . Readout system for the hadron calorimeter .
response to cosmic ray muons; a typical response of a
wire group to muons is given in fig. 61 . The response is
in good agreement with the expectcL' distribution .
The response of prototypes ana )f the finished modull.s to beams of hadrons and electrons was studied at
th,. CERN and ITEP accelerators between 1 and 50
GeV . A typical pulse height distribution for 20-GeV
pions is given in fig. 62 . The response as a function of
energy is linear . The resolution, defined as the standard
deviation of a Gaussian fit to the pulse height distributioa, versus energy is shown in fig. 63, where data from
prototypes and completed modules of tained both with
and without BGO in front are used . Extensive studies
have also been made with other gas mixtures including
isobutane in various mixtures [17] .
.£ lm ...
l7. 9 Ue
6. .~
S®68866 Vr66
nrn®iors'cs~®l.nc
6ss6va eeea~eem
~B'4P~~8'6~- D~Hi" eüRl
~®H
6VStem
6.1 . Introduction
T'ie endcaps of the hadron calorimeter (1-1CEC) cover
the polar angle regions 5 .5' < 19< 35' and 145' :!~, 19
_< 174.5 ° over the full azimuthal range 0 ° < 0 < 360 ° .
Tile solid angle covered by the endcaps (18% of 41r)
extends the coverage of the hadronic calorimetry to
B. Adeva et al. / The construction of the L3 experiment
64
99 .5% of 4,Tr . Fig. 64 shows a longitudinal (R-z) cut of
the central detector, while fig. 65 shows a perspective
view of the HCEC . The HCEC consist of three separate
rings: an outer ring (HC1) and two inner rings (HC2
and HC3) . Each ring is split vertically into
resulting in a total of 12 separate modules.
ularity of the HCEC detectors permits
withdrawal to provide access to the other
Table 4a
Hadron barrel thickness in units of nuclear interaction lengths for pions
Material
BGO
Scintillator
HC barrel
Fe : (stainless steel)
Cu : (brass)
U : (absorber)
CHO : Mylar
Calorimeter subtotal
Integral interaction length
Differential interaction length
long
0.93
0.01
short
0.37
0.62
2.13
0.03
3.15
0.37
0.70
2.42
0.03
3.52
1 .03
0.52
Muon filter (Cu)
Support tube (stainless steel)
Table 4b
Hadron barrel thickness in units of radiation lengths
Material
BGO
Scintillator
HC barrel
Fe : (stainless steel)
Cu : (brass)
U : (absorber)
CHO : Mylar
Calorimeter subtotal
long
Muon filter (brass)
Support tube (stainless steel)
short
3 .22
7.61
76 .78
0.06
87 .71
3.22
8 .61
87 .31
0.07
99 .25
11 .54
5.78
Table 4c
Hadron barrel energy loss for mind ionizing particles in MeV
Material
BGO
Scintillator
CFI
04/'"
H
barrel
arrel1
Fe : (stainless steel)
Cu : (brass)
U : (absorber)
CHO : Mylar
Calorimeter subtotal
Muon filter (Cu)
Support tube (stainless steel)
Differential energy loss
0.94
short
4.46
4.09
5.49
6.01
5.12
5.64
long
21 .43
21 .45
long
snort
83
159
578
5
825
83
140
509
5
737
short
120.70
109.16
132.24
138.02
120 .70
126.48
Integral energy loss
221
2
213
118
long
Integral radiation length
Differential radiation length
21 .43
0.02
half-rings,
The modtheir fast
L3 central
221
223
long
short
1048
960
1261
1379
1173
1251
B. Adeva et aL / The construction of the L3 experiment
Table 5
Detector thickness at different angles in units of nuclear absorption lengths for pions
0
BGO
HB
90 .0
82 .0
72 .5
66 .5
58.5
54.0
50 .5
48 .5
42 .5
39 .0
35 .0
32.0
27 .0
22.0
17.0
12 .0
0.94
0.94
0.94
0.94
0.94
0.94
0.94
0.94
-
3.52
3.56
3.70
3.84
4.28
4.56
4.54
4.35
4.92
5.22
5.12
3.74
1.97
-
a1
HC
-
b1
1.05
1.68
3.13
6.36
6.01
5.91
MF `1
ST
099
100
1.34
1.08
1.16
0.49
0.52
0.25
-
0.52
0.52
0.54
0.54
0.60
0.64
0.67
0 .69
0.75
0.41
0.45
0.48
0.47
-
a1
70
U
Total
5 .97
6.02
6.22
6.42
6.98
6.63
6.67
6.23
5.68
5.63
6.62
5.90
5.67
6.36
6.01
5.91
65
60
In
50
Z
w
w
, 40
w
In
Z 30
20
10
HB : hadron calorimeter barrel .
b) HC : hadron calorimeter endcaps.
`) MF : muon filter .
d) ST : support tube .
a)
4.0
11 .0
18 .0
250
320
390
1
ENERGY(GEV)
Fig. 62. Calorimeter response to 20 GeV pions.
RXXXX
detector components. The HC1 half-rings are separated
at 0 = 90') (270') by 10-mm (40-mm) slits. The 10-mm
slit accommodates the support of the LEP beam pipe,
while the 40-mm one allows for passage of the vacuum
tube of an RFQ device for BGO crys!al calibration .
6.2 . Technical description of the hadron calorimeter endcaps
The endcaps consist of stainless steel containers filled
with alternating layers of brass tube proportional chambers (inner tube dimensions 5 mm x 10 mm) and 5-mm
and 10-mm thick absorber plates of depleted uranium
(fine and coarse sampling part respectively). Over the
end cap region, the amount of material traversed by a
particle originating at the interaction point varies between 6 and 7 nuclear absorption lengths.
6.2.1 . Containers
The HC1 containers are subdivided into four compartments by 16-mm thick stainless steel walls providing structural rigidity . Their thickness is chosen to ap-
60
50
40
U
___ Cosmics
_an
20
c
A
!O
_t-
.a
L
Q
0
0
80
Amplitude
100
120
Fig. 61 . Calorimeter response to cosmic ray muons.
t
t
1
I
I
1
t
1
2
4
10
20
50
Pion momentum (GeV/c)
Fig. 63 . Hadron calorimeter energy resolution . The line is
drawn through the points obtained %0th the BGO in front (full
+5 )% .
circles) and corresponds to Q/E = (55/ E_
66
B. Adeva et al. / The construction of the L3 experiment
Table 6
Dimensions and mechanical properties of the hadron calorimeter endcap modules
Container type
HCl
Fig. 64 . Longitudinal cut of part of the L3 hadron calorimeter.
One side of the forward-backward system is shown (dotted
area).
proximate that of a 10-mm thick uranium plate in terms
of nuclear absorption lengths. The first compartment
(fine sampling part) is 26 chamber layers deep and is
equipped with 5-mm uranium plates. In this compartment the first three layers of uranium plates have been
4
Number of modules
0.95
Inner diameter [m]
Outer diameter [m]
1.60
Length [m]
1 .37
4
Compartments
Flange thickness [mm]
Front
25
Additional shielding
for BGO/TEC
10+15
Inside (each)
16
Back
25
Wall thickness [mm]
Inner
15
Outer
4
Weight [t]
Total (per module)
8.5
Uranium (per module)
5.22
Chamber layers
(per module)
77
Total number of chambers
1384
Number of tubes
(per chamber)
25
Total number of tubes (wires) 34 600
Total
HC2
HC3 system
19
19
4
0.32
0.94
0 .55
2
4
0.42
0.94
0.48
2
12
10+15 16
16
25
25
15
5
15
5
1 .4
1.05
1.1
0.82
44
28 .4
27
488
23
412
127
2284
24
19
11712 7828 54140
replaced by steel plates in order to shield the BGO
crystals and the TEC chamber from the uranium radioactivity background . The three remaining compartments, eacn 17 chamber layers deep, are equipped with
Fig. 65 . Perspective view of the forward-backward hadron calorimeter.
67
B. Adeva et al. / The construction of the L3 experiment
10-mm thick uranium plates (two 5-mm plates put
together). There are thus 77 chamber layers in the HC1
container. The HC2 and HC3 containers, with a depth
of 27 and 23 chamber layers respectively, are subdivided into two compartments each, again via 16-mm
thick stainless steel walls. All compartments are
equipped with 10-mm thick absorber plates. As for
HCl, shielding considerations led to the replacement of
the first 15 mm of uranium in HC2 by the same
thickness of steel. Table 6 summarizes the dimensions
and mechanical properties of the HCl, HC2 and HC3
containers.
6.2.2. Proportional chambers
Within a half-ring, a chamber layer consists of four
chambers, each covering an inter va10O = 45 ° (U-layer) .
The wires are stretched azimuthally to measure the
polar angle 0 directly . Even numbered chamber layers
(V-Layers) are rotated by 045 = 22.5 ° with respect to
the odd numbered ones. This stereo angle between
successive layers allows measurement of the coordinate
0 orthogonal to O and the gaps between chambers do
not coincide in successive layers. Chambers whose wires
would have crossed the boundary between two half-rings
are split into two halves. Every second chamber layer is
thus comprised of three full-sized chambers and two
half-sized ones.
Details of the construction of the proportional tube
chambers are illustrated in fig. 66. The individual brass
tubes have an inner cross section of 5 x 10 mm2 and a
wall thickness of 0.3 mm. The chamber is shielded on
both sides against uranium irradiation by 0.7-mm thick
brass plates. To save the space required by decoupling
capacitors, high voltage is applied to the body of the
tubes rather than to the wires . A 0.2-mm thick polycarbonate foil, glued between the tubes and the outer
shielding plates, provides the necessary insulation. End
regions are additionally protected against high voltage
breakdowns by Kapton foil. Each tube contains a 50-Wm
diameter gold-plated tungsten wire, stretched with a
200-g tension and crimped on a gold-plated Cu-Be
piece fixed inside the plastic chamber endpiece. On one
side of the chamber, printed circuit boards, soldered to
pins on the Cu-Be wire fixation pieces, serve to transmit the wire signals ro the outside world . Within a
chamber, serial circulation of the gas from one tube to
the next is achieved via gas throughputs milled inside
the plastic endpieces .
Chambers for the HCl, HC2 and HC3 rings consist
of 25, 24 and 19 tubes respectively . Overall, the HCEC
detector contains 2284 individual chambers with a total
of 54140 wires (table 6).
6.2.3. Absorber
The azimuthal segmentation of the absorber is twice
that of the chambers. fig . 67 shows the arrangement of
a)
b)
HC-1
brass-plate
polycarbonatetoiO
brass-tube
gas-channel
brassdube
polycarbonatetoil
brass-plate
Fig. 66. Hadron calorimeter forward-backward system. (a)
Shows schematically the chamber arrangement with the 22.5"
stereo angle of the wires. (b) Shows details of the chamber
construction.
the depleted uranium plates within a U or V absorber
layer of a HCl and HC2 half-ring . (An absorber layer is
defined to be of the V type, when it follows a V type
chamber layer). The gaps between plates do not coincide in successive layers and they do not point to the
beam axis; nor do they coincide with the gaps between
chambers (compare figs . 66 and 67; see also fig. 65).
6.2.4. IVire grouping
The wire signals are grouped to form "towers"
pointing to the interaction region . In the R-z plane the
Fig. 67 . Hadron calorimeter forward-backward system. The
figure shows the uranium absorber plate arrangement for the
HCl and HC2 modules . Displayed is the arrangement for the
U-layers. For the V-layers the plate arrangement is mirror
symmetric .
B. Adeua et al. / The construction of the L3 experiment
68
detector is segmented in 31 pointing "roads" of width
DO =1 ° by grouping two wires (or their equivalent) at
the z position of the first HC1 chamber layer. Signal
" towers" are then formed by subdividing each of the
three end cap rings in depth and grouping the wires
within each road . To retain the stereo angle information, separate towers are formed for the U- and V-type
layers . The azimuthal segmentation is therefore A45 =
22.5'. In depth, HC1 is divided into a total of seven
logical segments (fig. 68), the first two forming the fine
sampling part, while HC2 and HC3 are divided into
three and two segments respectively. This segmentation
scheme results in a total of 3960 signal towers for the
two endcaps . The tower structure of the HCEC is
summarized in table 7.
6.2.5. Services
High voltage is provided to the chambers by 72
supply channels, which are fanned out into a total of
180 lines . Each line is connected to a group of 11 to 14
chambers . Distribution boxes, mounted on the back
flanges of the d,rector, allow us to disconnect individual chambers from the high voltage system, e.g. if a
particular chamber draws excessive current.
Gas is supplied to the chambers via four input lines
feeding a total of 20 circuits for the HC1 containers and
4 each for HC2 and HC3. Chambers served by the same
circuit are connected serially to the gas supply. There
are between 38 and 128 chambers per circuit because,
due to the various chamber sizes within the HCEC, it
was possible to equalize to within 30% the resistance of
Fig. 68 . Hadron calorimeter forward-backward system. In the
lower part of the figure the segmentation of the HO containers in 0 and z are shown separately for the U- and
V-layers . The upper part of the figure shows enlarged the 0
segmentation into roads at the border of the fine and coarse
sampling parts.
Tabla, 7
Segmentation (tower structure) of the hadron calorimeter end caps
All
Longitudinal segment
HCl
Number of U-chr layers
Number of V-chr layers
Number of towers (U +V)
Number of amplifier boards
Number of ADC modules
HC2
Number of U-chr layers
Number of V-chr layers
Number of towers (U +V)
Number of amplifier boards
Number of ADC modules
HO
Number of U-chr layers
Number of V-chr layers
Number of towers (U + V)
Number of amplifier boards
Number of ADC modules
1
2
3
4
5
6
7
7
6
520
6
7
468
5
4
396
4
5
344
5
4
324
6
6
288
6
6
252
-
-
4
5
344
5
4
324
5
4
288
-
-
6
5
232
6
6
180
39
38
2592
108
28
14
13
956
40
10
12
11
412
20
5
B. Adeva et al. / The construction of the L3 experiment
the various circuits . The half-ring containers themselves,
excluding the chamber volume, can also be flushed
serially (i .e. one gas line per end cap) either with the
counting gas or with an inert gas (e .g. C02, N2 ). At the
chamber outlet, the gas density is stabilized using the
signals of pressure transducers and temperature probes.
For temperature monitoring, 84 Pt100 probes are
mounted on chambers located at top, bottom and along
the centerline of each half-ring container.
6.2.6. Readout and trigger segmentation
The 3960 tower signals are amplified by 108 LRS
2724 preamplifier boards mounted on the roar flanges
of the HC1 and HO containers . The signals are then
fed through an approximately 55-m long 1.uß .;d pair
cable to 43 LRS 1885F FASTBUS ADC modules
located in the blockhouse (table 7) .
For triggering purposes the hadron calorimeter
end cap modules are longitudinally divided into two
trigger planes : A (1 .5 X) and B for tho remainder (up to
6.5 X) . Each plane is azimuthaly (45) subdivided into 16
elements while the polar (4) subdivision contains 4
elements.
6.3. Detector performance
6.3.1 . Proportional chamber performance
The chambers are operated with an 80% argon-20
C0 2 gas mixture. The single layer signal for a minimum
ionizing particle at normal incidence is 100 fC with a
charge collection time of 240 ns (95%). At an operating
high voltage of 1650 V the gas amplification is 1.5 x 10 4 .
In fig. 69 the mean pulse height distribution for all 2284
chambers mounted into the endcaps is displayed showing an excellent manufacturing homogeneity of S/mean
of 3% . The sensitivity due to changes of the environ-
69
200 1-
160
u
80
0
160
-,-.J1
j,
LrL. 180 200 220 240 260
mean pulse height
280
_i
300
Fig. 69 . 1-ladron calorimeter forward-backward system. Mean
pulse height distribution for all 2284 chambers mounted into
the endcaps (8/mean = 0.03) measured with cosmic muons.
ment is as follows:
Pressure :
AQI(QAp) = 0.6% mbar -t ;
-1 ;
Temperature:
AQI(QAT) =1 .8% ° C
High voltage:
OQ/(QAU) =1 .2% V-1 ;
Particular attention was given to the long term behavior cf the proportional chambers under radioactive
load of the uranium absorber . An accelerated aging test
129Ru
source. No
has been carried out with a strong
change in the performance within 3% ha been found up
to a corresponding lifetime of 800 yr in the uranium
environmen, of the end caps (fig . 70).
coulomb/cm
1,20
1,10
91
i
0
100
200
I
400
500
300
years in uranium calorimeter
A
600
700
800
12QRu
. Normal chamber
Fig. 70. Hadron calorimeter end cap chamber behavior under irradiation . Accelerated aging test with
55
is the signal at the
chamber.
part
of
the
Qtest
operation conditions (see text). Qre f is the signal from Fe taken in the non-irradiated
corresponds
to 800 years of
irradiation
days
of
129Ru
accumulated
in
30
center of irradiation. The linear charge density of 1 C/em
operation in the L3 experiment .
B. Adeva et al. / The construction of the L3 experiment
70
6.3.2. Calibration and monitoring
An absolute calibration of the calorimeter with
cosmic muons has been performed using scintillation
trigger counters above and below the end cap modules .
Additional concrete shielding resulted in a lower muon
cutoff energy of 2 GeV. A face to face cut was applied
to the raw data, demanding a coincidence of three
consecutive vertically arranged towers to ensure that tltc
center tower was traversed by the muon vertically in full
length. Preliminary results for one half-ring arrangement (one HCl, HC2 and HO module) are shown in
fig . 71 . The mean pulse height of the center towers
corresponds to 45 ADC channels with a variance of 8% .
The monitoring and relative calibration of the hadron
calorimeter end caps will be achieved by using the
radioactive background radiation of the uranium absorber . The total ionization yield -Lie to electrons and
photons (ot's are absorbed in the chamber covers) can
be measured accurately with our gaseous detector, although we cannot detect a single photon line from the
chain of radioactive decays of the uranium absorber
nuclei. In our chamber/absorber arrangement this ionization rate amounts to 40 Hz/cm2 yielding 10 4 counts/s
for a typical tower. At this high rate we can randomly
capture uranium signals with high efficiency while opening the ADC for 500 ns with 2-kHz repetition rate. This
mode of operation is highly practical in our 4000 channels system as we avoid additional circuitry for the
calibration gate formation . The approximately exponential spectrum of the ionization yield observed in this
fashion is shown in fig . 72; At higher chamber gain, the
slope of the spectrum decreases while its end point is
108
106
N
C
" 104
102
pulse charge(pCl
Fig. 72 . Pulse height distribution of tJ-noise signals. About
10 -3 of the gate openings capture a uranium signal. Electromagnetic pickup noise is small as demonstrated by the dashed
distribution, observed while lowering the high voltage by 300 V
from the standard operation point .
pushed further out. This fact is used to correct for any
changes of the detector gain due to environmental
changes (gas temperature, pressure, HV, etc .) .
Spectra
are taken at regular intervals (during run
startup or end) and compared to a reference spectrum
r . The actual gain g is determined from the minimum
of the X 2 function,
f
X 2 (gsk)
_ F, (f(gxi)
_
2
gr(x,)~
182,
00
F
c111
k =- - = f
f (x) dx/f r(x) dx,
12
âX mm
10
8
ä6
0
u 4
which is a measure of the similarity between the test
spectrum f and the reference spectrum r . By compariss
son to directly measured spectra from
Fe we have
established that this calibration method works reliably
for gain changes within a factor of five (fig . 73) .
The varianc - of the gain g determined from the X2
minimization is inversely proportional to the number of
uranium signals observed (fig. 74) . The gain test spectrum information is recorded at full readout speed. A
3% precision run corresponding to 3000 entries takes
approximately 150 s . The limited knowledge of me
reference spectrum determines the ultimate precision of
this gain test method . With one day of running, reference spectra for 0 .3% accurate gain tests can be obtained .
Each wire contributes proportionally to its length to
the integral F of the uranium sPectrum (fig . 75) of a
detector cell ("tower") and the detector performance
can be monitored at the wire level .
9
'f
0
0
20
40
60
ADC-channels
80
100
most probate pulse height cosmic myons
Fig. 71 . Hadron calorimeter forward-backward system. Mean
pulse height distribution obtained with cosmic muons for a
fully assembled arrangement of a HC1, HC2 and HO container after applying a face to face cut to the raw data.
x mm
1
I.
. 1
B. Adeva et al. / The construction of the L3 experiment
E
0
6.3 .3 . Detector response to pions and electrons
The response of the hadron calorimeter endcaps to
pions up to 25 GeV and electrons up to 10 GeV has
been studied in a prc ~totype setup which had a ,iirdlar
internal structure but illowed for larger shower containment [18]. The results are compared with Monte Carlo
simulation calculations [19] giving good agreement with
the data.
6
0
E 5
c0
71
4
2
1
4
2
3
5
relative gain : Fe 55
6
Fig. 73 . Gain determination by observing uranium noise signals compared to gain determination by observing the maximum of the pulse height distribution from 55 Fe 5.9 keV gamma
rays in the same chamber. The gain was varied by changing the
high voltage.
Fig. 74 . Precision of the gain determination as a function of the
inverse number of entries in the randomly sampled U spec
trum . With high statistics in the reference spectrum relative
gain determinations to better than 1% can be achieved
8000
N
S
ä 6000
E
0
4000
2000
1000
2000
3000
4000
wire longth[rnml
5000
Fig. 75 . U rate for two different HC2 towers as a function of
the operative length of the sense wire (change in length by
connecting the appropriate chambers to high voltage selec
tively) . The very low end of the U spectrum (Q u <_ Qmi,) has
been cut out resulting in a slope of 26 Hz/cm.
7. The muon filter
The muon filter is mounted on the inside wall of the
support tube and adds 1.03 absorption length to the
hadron calorimeter . It consists of eight identical octants, each made of six 1-cm thick brass (65% Cu + 35%
Zn) absorber plates, interleaved with five layers of
proportional chambers and followed by five 1 .5-cm
thick absorber plates matching the circular shape of the
supporting tube (fig. 76). Each octant is 4-m long, 1.4-m
wide and 0.2-m thick in the radial direction. The first
four layers of an octant each contain 16 chambers
whereas the outermost layer contains 14 chambers . The
muon filter proportional chambers are made of a 4-m
long comb-!ike brass profile covered with a brass lid,
thus forming eight tubes, and are enclosed in a plastic
box to ensure gas tightness. Each tube is 8_4 mm wide
and 5 mrn high and is equipped with a resistive (470
SZ/m) wire 50 [Lm in diameter. The tubes are separated
by 1 .6-mm thick walls. They are extruded industrially ;
wires are strung manually and supported every 20 cm
by plastic holders. The chambers are terminated by a
board equipped with eight 700 pF decoupling capacitors and eight 10 M2 resistors through which the High
Voltage is applied to the wires. Chambers are tested f .gas leakage (less than 100 ml/h at 10 mbar overpressure), wire strength (190-310 g) and dark current (less
than 100 nA at 3600 V).
The chambers use the same gas mixture as the hadron
calorimeter barrel at about 1800 V to obtain 400 fC for
minimum ionizing particles. The 8064 channels readout
system is the same as that of the barrel hadron calorimeter. For three central layers of each octant we also
digitize take, charge pulse from the other end of the
chamber so that the coordinate along the wire can be
obtained by charge partition. By coribining the measurements on the thre . layers, the precision on this
coorrjinnte ranges frorn O_ROF,, (3_1 cm) to 1 .2% (4.7 cm)
for a gate going from 250 ns to 400 ns [20] .
The muon filter chambers were tested both in
laboratory, with cosmic rays, and with the X3 beam at
the CERN SPS [21,22]. In the laboratory tests, several
some
Ar-C02 mixtures were used . Figs . 7/7 and 78 show
results that demonstrate the very satisfactory chamber
behavior . The overall chamber efficiency, measured during the tests on the SPS test beam, was 91% . giving 97%
B. Adeva et at / The construction of the L3 experiment
72
----- - - ---- -
f"
- --
210mm
1390 mm
Fig. 76. Section of one muon filter octant .
when unfolded for geometrical effects (wall thickness,
plastic supports) .
8. Scintillation counters
The good time resolution (< 1 ns) of the scintillation
counters will be used to distinguish di-muon events
from cosmic muons. A single , .osmic muon which passes
near the interaction point resembles a muon pair event
product:d in e'e interaction, but the time-of-flight
difference between opposite scintillation counters is 5.8
ns for cosmic muons and zero for muon pairs.
8.1. Counter dimensions
The scintillation counters are located between the
electromagnetic and hadronic calorimeters (fig. 79). In
this position nearly complete coverage of the solid angle
can be achieved and the scintillator can be used in the
trigger on hadronic events. The barrel scintillation
counters are bent to follow the shape of the hadron
calorimeter barrel: they are 875 mm away from the
beam at the position of the hadron calorimeter rings
R0, R1 and at 969 mm at the position of rings R2, R3,
R4. We use a 1-cm thick Bicron BC-412 plastic scintillator. The counter is 167 mm wide in the middle and 182
mm at the ends in order to cover the same solid angle
for the inner and outer rings of the hadron calorimeter.
The projected length of the scintillator is 2900 mm. We
use adiabatic light guides made of UV transparent
Plexiglas GS218 (Roehm, FRG). A barrel counter has a
320-mm long light guide on either end . The counters are
grouped in 16 pairs. Each pair covers one hadron
calorimeter 0 sector. Both 0 sectors near the rails for
the BGO calorimeter are covered only by two wider
counters. Thus in total there are 30 barrel counters . The
light guides are asymmetric so that the phototubes of
two adjacent counters are close to each other. In this
way there is enough space for cables between pairs of
phototubes.
The end cap counters are located in front of the end
cap hadron calorimeter (fig. 80). The light guides have a
90' bend and extend to the end of the hadron calorimeter end caps. There are 16 counters on either side of
the detector each one viewed by a single tube. The
scintillator is 2.70 mm long, 10 mm thick, 275 mm wide
on one side and 180 mm on the other . It is perpendicu10 11
1
o 80% A+20% C0 2
4, 50% A+50% C02
E
0
0
2700
A
CO z
0 10% A+90°. .
1012
7
w
V
10%
90%
Q
u
1013
10' 1"
0
?00
400 600 1, 00
A~,C Channel
C02
A 100% C02
1000
Fig. 77. Typical charge distribution obtained with different
Ar + CO2 mixtures.
1500
2100
2700
HIGH VOLTAGE M
3300
F,g. 78. Collected charge f(- ^linimurrs ionizing particles as a
function of the applied high voltage for different Ar+C0 2
mixtures.
B. Adeva et al. / The construction of the L3 experiment
transit time jitter of 0.9 ns for one photoelectron and
0.6 ns for --0 photoelectrons .
Interaction pont
Endcap
scintillators
--
Barrel
scrntdlators
.r
.
73
-.
so
------------
..
indicating the location of the scintillation counter. The barrel
counter is shown) .
lar to the beam line, 1030 mm from the interaction
point. Each counter covers one of the 16 0 sectors of
the hadron calorimeter endcaps.
The barrel counters angular coverage is Icos 191
0.83 (34" < O < 146"), where O is the polar angle with
respect to the beam line. They cover therefore the
acceptance of the middle muon chamber (MM). The
end cap counters extend the coverage down to Icos
O I < 0.90 (25 ° < O < 155 ° ). In the azimuthal angle 45,
93% of the solid angle is covered by scintillators.
8.2. Photomultiplier
The Hamamatsu 82490-01 16 stages mesh dynode
photomultiplier operates in the 0.5-T field region with
high quantum efficiency (14% at 430 nm, the maximum
in the emission spectrum of the BC-412 scintillator),
high gain (4 x 10 5 at 0.5 T magnetic field compared to
1 .5 x 10 6 without magnetic field) and good time resolution . The rise time of the anode pulse is 2.7 ns with a
Fig. 80 . The end cap scintillators are mounted on the end cap
hadron calorimeter HC1 .
8.3. Readout
The 92 signals are digitized in LeCroy FASTBUS
TDC 1875, with a resolution of 50 ps and a dynamic
range of 15 bits . The time resolution of the counters can
be improved by a factor of two because we also digitize
the charge of the pulse, so that time stewing corrections
can be applied. A paddle card has been built to convert
the photomultiplier pulse to the differential signals
needed for the LeCroy 1885 ADC.
8.4. Test results
Acceptance tests have been performed with cosmic
rays on all counters, with the following results:
The mean attenuation length is 1 .7 ± 0.2 m. A cosmic
ray which penetrates the middle of the counter yields on
average 41 photoelectrons . A time resolution of 0.35 ns
has been measured for the mean time of both phototubes. We have also tested a counter with phototubes in
a magnetic field of 0.5 T. The number of photoelectrons
is not affected by the magnetic field, but the gain is
reduced by a factor of 2.2 compared to zero field.
Similar results have been obtained for the end cap
counters . Here we have measured 80 photoelectrons for
a minimum ionizing particle penetrating the scintillator .
9. The electromagnetic detector
The electromagnetic detector has excellent energy
and spatial resolution for photons and electrons over a
wide energy range (from 100 MeV to 100 GeV) . It uses
bismuth germanate (BGO) as both thr showering and
detecting mediiirn . B0rO is a particularly attractive
material for an electromagnetic calorimeter because it
has hig;i stopping power (short radiation length) for
photons and electrons, and large nuclear interaction
length . Furthermore, it has low afterglow and is not
hygroscopic .
The electromagnetic calorimeter [23] consists of
about 11000 BGO crystals pointing to the interaction
region . Each crystal is 24 em long and is a truncated
pyramid about 2 x 2 cm2 at the inner end and 3 x 3 cm2
at the outer end. Two siucon petotoaaiodes and' associated 'irlear electronics detect the light. The energy resolution is = 5% L: t 10`3 MeV and below 1 % for enc rgies
above = 2 GeV; the measured spatial resolution above
2 GeV is better than 2 mm and the hadron/electron
rejection ratio about 1000 : 1. The detector (fig . 81)
surrounds the vertex chamber and consists of :
B. Adeaa et al. / The construction of the L3 experiment
74
Table 9
BGO and Nal(TI) properties
4
5
6-
2
(1 ;
Fig. 81 . Longitudinal cut through the BGO detector.
i) two half-barrels (EB) made of BGO crystals;
ii) two end caps (EC) made of BGO crystals, with track
chambers (FTC) in front (to be installed in Phase
II).
9.1 . The barrel
The 7680 crystals of the barrel (table 8) are arranged
in two symmetrical half-barrels, giving a polar angle
coverage 42* < 0 < 138* .
9.1 .1 . BGO crystals
The BGO crystals (table 9) are produced by the
Shanghai Institute of Ceramics in China, using a modified Bridgeman method . Very pure B'203 and Ge02
powders (impurities < 10 -6 ) are mixed in the correct
stoichiometric proportions . The resulting polycrystalline
powder of Bi 4Ge3012, contained in a platinum foil
crucible, is introduced into an oven. Then a temperature
gradient is slowly displaced relative to the melt, starting
from a BGO monocrystal seed . The crucible has the
shape of the final crystal but is somewhat larger to
allow for later machining.
Table 8
Main parameters of the BGO barrel
Inside radius of barrel
Inside length of cylinder
Material in front of crystals
Angular ~nvPraoa
Number of crystals
Number of crystal types in ®
Number of crystal, per type in 0
Crystal dimensions
length
front face
back face
volume
52 cm
100 cm
0.05-0.1 Xo
42 .30 _137
2 x 3840
24
160
.70
24 .0 cm
2 x 2 cm2
2.6 x 2.6 to 2.9 x 2.9 cm'`
130-150 cm3
Density [g/cm3]
Radiation length [cm]
Moliere radius [cm]
dE/dx [MeV/cm]
Interaction length [cm]
Refractive index
Wavewngth of maximum
emission [nm]
Relative light output
Temperature coefficient
of light yield
[%/ ° C at 25 ° C]
Lumin. lifetime at room
temperature [lis]
Afterglow at 3 ms
Hygroscopic
BGO
Nal(TI)
7.13
1 .12
2.3
9
22
2.15
3.67
2.59
4.4
4.8
41
1.85
480
8-15
410
100
-1 .55
0.22
0.3
0.005%
no
0 .23
0.5-5%
yes
The produced ingots are then cut to size and polished .
The tolerances in dimensions are dictated by the need
to have a safe mounting in the support structure together with a minimum dead space between crystals :
- from - 300 Rm to 0 pm in transverse dimensions,
- from -400 tLm to 0 W m in length,
- less than 50 t,m in planarity of all faces.
All crystals are truncated pyramids (fig. 82 and table
10) pointing to the interaction region, with a small
angular offset (10 mrad in 45) to suppress photon
leakage. Their cross section is approximately square and
they have a constant front face area . This geometry
involves 24 types of crystals, with shape changing slowly
along O due to the variable distance to the interaction
point (fig. 81). An accurate (= 50 Rm), fast, cheap and
safe method for cutting and polishing the crystals was
developed [24], consisting in sawing directly the crystals
to the required dimensions with a diamond disk . The
surface finish obtained allows us to proceed directly to
mechanical polishing of nine crystals simultaneously on
a spinning table.
Systematic tests [25] were performed on all crystals
arriving at CERN in monthly batches of 130 to 400
crystals during three years. Each crystal was first inti- AS
e
III
'.
u
5
TYPE 2
6P t
_ .1
5
2
TYPE 24
i
r-~
I- A "{
Vier
ASP
--- AP
)
V- 1
4
3
240 mm
Fig. 82 . 'typical crystal shapes for the barrel . See also table 10.
B. Adeva et al. / The construction of the L3 experiment
75
Table 10
Dimensions of a few representative crystals in the barrel . NCR is the crystal row number, ® (deg) its polar angle with respect to the
beam axis and d® its angular aperture. The meaning of the other quantities (in mm) is shown in fig. 82.
NCR
A
AS
B
AP
ASP
BP
®
d®
2
12
24
20 .12
20.12
20.12
20.17
20.46
20.70
20.54
20 .39
20 .27
29 .52
28 .57
26 .48
29.59
29.05
27.24
30.14
28.95
2 .68
87.7040
65 .6825
43 .9097
2 .2898
2 .0434
1 .5283
spected by eye and any defect was recorded. Then, the
optical quality of the crystals was checked by a measurement of the transparency spectrum on their full
length [26) . Typical transmission curves are shown in
fig. 83 . The three reference points at 400, 480 and 630
nm are minimum transparency values required in the
specifications .
A departure from the transmission profiles shown in
fig. 83, especially in the near UV range, may indicate a
weaker resistance to radiation . This effect was observed
on a few prototype crystals. During the quality control
of the barrel crystals, several batches of a few crystals
each were checked for radiation hardness . They were
60
exposed to a dose of 10 3 rad from a medical Co Y ray
source . This is more than 100 times the daily dose
expected for the barrel at LEP in the worst case scenario
(beam loss, etc.) . Immediately after irradiation, the
transparency in the blue region had decreased by about
409 . Then it was observed to recover spontaneously a
room temperature. Full recovery of the original transmission profile was reached after one month . It should
also be stressed that the scintillation efficiency was not
affected by the irradiation . This was demonstrated by
comparing the light output of small and large crystals .
The cr :, stal dimensions, planarities and angles were
checked on a measuring bench [27], simultaneously re-
cording all dimensions of a crystal by comparison with
an accurate steel standard, with the help of 39 inductive
position sensors. The accuracy of each measured point
was better than 10 Wm. After the initial batches, the
crystal rejection rate for bad aspect (dents, scratches,
etc.), low transparency or incorrect dimensions was
0.2% .
The light collected at the large end face of a tapered
crystal with its six faces polished increa_ es strongly with
the distance from the light source to the large end face .
This is shown in fig . 84 for a crystal viewed by a
137CS
photomultiplier and illuminated by a
source. Good
linearity and energy resolution require a nearly uniform
light collection efficiency, as indicated by test measurements and '_%Zonte Carlo simulation . By coating the
polished crystals with a 40- to 50-~tm thick layer of high
reflectivity NE560 paint, one obtains a nearly flat light
collection efficiency curve (fig. 84), with a light output
comparable to that reached with the best wrappings
tested (160-270 Rm thick).
800
F~
700 ~
- 600
d
a
E
ä
ro
û
500
400
a.
ô 300
L
01
O
C
O
N
H
200
N
C
10
L
H
100
24
4davelenyth (nm)
Fig. 83 . Optical transmission of a few crystals through their
lull length as a function of the wavelength . The crosses represent the minimum transmission values accepted .
16
8
Distance to PM (cm)
0
Fig. 84. Light collection curves measured with a collimated
137
Cs source running along the crystal main dimension . All
crystal faces are polished . The parameter R is the relative light
output difference for the source at 21 and 3 cm from the
photomultiplier. The dots correspond to aluminized mylar
wrapping and the circles to white paint coating (see text).
76
B. Adeva et al. / The construction of the L3 experiment
20 . ---
E
u
m
O
15
10
5
0
Distance to photodiodes (cm)
Fig. 85. Typical light collection curves obtained with the cosmic
ray bench for a sample of 96 crystals. The light yields are
measured by the number of photoelectrons per cm of ionized
track.
To guarantee the performance of the crystals for
energy measurement, it was necessary to check their
light output and the uniformity of light collection . The
light output is an important parameter for the resolution at low energy (100 MeV to about 2 GeV), which is
dominated by the signal-to-noise ratio. We used the
ionization by cosmic muons for these measurements
[281 .
A test bench capable of simultaneous measurement
of the response of 40 crystals per day and reconstruction of track length and position along the crystals was
set up . The painted crystals were equipped with capsules holding two photodiodes (Hamamatsu S-2662, 1.5
crn2 active area), followed by preamplifier, shaping
amplifier and ADC. The data obtained (fig . 85) can be
considered as a precalibration of the crystals and were
very useful for understanding the final beam calibrations of the two half-barrels. Fig. 86 shows the light
yield versus the uniformity parameter R defined as the
relative variation of the collection efficiency of the light
produced at the crystal extremities . These measurements were made with cosmic rays, for all crystals of
the first half-barrel. Limits were set on these parameters
to avoid low light output tails or light collection curves
too far away from the optimum value. Crystals out of
limits were corrected by paint additions.
91 .?. Mechanical structure
The rjcchanical structure of the barrel (figs. 87 and
88) bears the weight of the 7680 crystals, the preamplifier boards and the corresponding cables, monitoring
devices and cooling circuitry. To achieve the best solid
angle coverage and to minimize dead spaces between
crystals, the structural material is confined to thin walls
-30
-20
R (%)
-10
0
10
Fig. 86 . Light output versus uniformity parameter R for all the
crystals of the first half-barrel. The average light output is
(14.4±3 .8) x 10 3 e/cm and the average value of R is ( - 6.9 f
3.8)% . The best energy resolution is obtained for R values
between 0 and -10% .
around the cells and to a cylindrical inner tube attached
on each side to a conical funnel (" trumpet") which
carries the weight and transmits it to the four bearing
pads. The whole structure was studied on a computer
aided design system [291 .
For the calibration of the calorimeter, it is necessary
to aim an electron beam of known momentum at each
crystal individually, with the beam passing through the
geometrical center of thc, ûarrel . Therefore, the barrel is
split into two halves along a plane normal to its axis . As
a consequence, each half-barrel has to be reinforced at
the cut with a 0.5-mm austenitic steel membrane, which
is mostly needed during the coupling operation of the
two half-barrels and remains in place afterwards .
The cell walls, as well as the inner tube, are made of
epoxy resin carbon fiber composite [301 . This material
Iii
w
Fig. 87 . Isometric view of the mechanical structure for the
BGO barrel . (1) Trumpet. (2) Middle flange. (3) Middle membrane. (4) Barrette. (5) Slice. (6) Row of 24 crystals (7) Roller
bearing. (8) TEC supporting rail .
B. Adeva et al. / The construction of the L3 experinîe:it
o 10 2ocm
Fig. 88. Longitudinal section through the BGO barrel . (1)
Crystals . (2) Cell walls. (3) Trumpet body out of carbon fiber
composite. (4) Reinforcement pads for titanium bolts. (5) Mid
dle flange with stainless steel membrane. (6) Thermal shield.
(7) Preamplifier board. (8) TEC supporting rail .
offers excellent mechanical properties and is of relatively low density. The minimum value of the Young's
modulus is E=45000 N/mm2 and the yield stress is
a,,= 350 N/mm2. The tube thickness corresponds to
0.04 radiation length at normal incidence. Moreover,
this composite material has good molding properties
and is very suitable for building a complex structure
with the required precision. Metallic parts are introduced in some places for very specific purposes :
- Titanium alloy screws to connect the two half-barrel
structures (low density, high resistance alloy ASTM
3.7164) .
- High resistance aluminum alloy (Anticorodal 100)
pads to connect the supporting structure to the four
roller bearings behind the crystals .
BGO crystals are extremely sensitive to permanent
loading, with risks of subcritical crack propagation [31] .
Each crystal is thus held in a separate cell with clearances
such that normal structural deformation does not affect
any crystal and that the weight of any crystal is not
transferred to its neighbors. A total of 160 modular
molded "slices" with 24 cells each are glued side by side
on the supporting structure in order to produce a complete half barrel . A step-shaped part, called a "barrette",
closes the slice bottom and provides accurate longitudinal crystal position .
Each crystal is pressed from its back onto the front
of its cell by a spring-loaded device which pulls on the
walls with a force of about 20 N (crystal weight = 1 kg)
ensuring that a positive force is exerted on the bottom
of the cell in any position and that the crystal cannot
slide sideways nor press on the cell wall .
77
The thickness of the cellular structure has been mhiimized to the limit of technical feasibility: each crystal is
separated from its neighbors by a composite wall, made
of two layers of 100 R.m pre-impregnated carbon cloth.
The final thickness varies between 200 Rm and 250 Rm .
A nominal clearance of 100 lim is kept between tl:e
crystal faces and the walls in the 0 and © directions . It
allows for the paint coating and the expected elastic
deformation of the structure due to thr changes in
position of the detector, from assembly to calibration
and to experiment, without stressing the crystals . Cellular walls and clearances represent about 1.75% of the
solid angle covered by the barrel .
The supporting structure is made of two symmetrical
shells connected by titanium bolts in the middle plane.
Each shell is a composite trumpet, 1-m long object with
a 10-mm thick cylindrical part in front of the crystals
and a 5-mm thick conical part along the side of the last
barrel crystals at O = 47 ° . A 25-mm thick solid ring
with fixtures for the bearings reinforces the cone edge .
The cylinder inside diameter is 1015 nua; the solid ring
outside diameter is 1600 mm . Individual crystal weights
and pulling resultants are gathered on the trumpet
cylindrical shell and transmitted to the bearings through
the conical shell and the solid ring . The maximum
trumpet deformation, calculated [32] and measured during a preassembly loading, is less than 1 mm including
bending and section deformation. This deformation is
uniformly shared on to the cellular structure. The composite structure weighs 140 kg for a total load of 10 t.
9.1 .3. Electronics
Since the BGO calorimeter is operating in a 0.5-T
magnetic field and space is at a premium, conventional
photomultipliers cannot be used . Instead, we use 1 .5
cn~'- 1-lamamatsu 52662 photodiodes to detect the BGO
scintillation light; they are insensitive to the magnetic
field and have a quantum efficiency of about 70%. Each
crystal has two photodiodes glued to its rear face. The
total diode capacitance is 230 p1 for 15 V reverse bias.
Since they have unity gain (each photon detected produces one electron-hole pair), a preamplifier must be
added. The signal from the photodiode is about 0.2 fC
(1200 electrons) for each MeV deposited in the BGO
[33] .
The charge sensitive preamplifier [34] is mounted
directly behind the crystal and uses a low noise, high
transconductance Toshiba 2SK147 FET in a cascode
configuration. The output pulse rise time is 300 ns
(corresponding to the BGO light decay time) and the
exponential decay time is 800 lis. The rms random noise
level of the photodiode and preamplifier combination is
less than 1000 elect_ ons. This is much higher than the
value that can be obtained with photomultipliers, but
significantly affects the resoluticn only for very small
signals (showers less than a few hundred MeV). The
B. Adeaa et al. / The construction of the L3 experiment
78
amplifier gain is extremely stable however and we do
not expect any of the gain variations that are normally
experienced when using photomultipliers . A test pulse
input to the preamplifier is provided.
The analog to digital converter (ADC) units, one for
each crystal (fig. 89) are mounted 3 m away, just outside
the hadron calorimeter. The ADC has been designed to
satisfy two basic requirements: to measure signals accurately over a wide dynamic range, from 100 MeV to 100
GeV, and to have a short memory time so that the tails
from large signals do not mimic small signals in later
beam crossings. The signal from the preamplifier is
differentiated with a pole zero circuit which replaces the
800 ors exponential decay with a 1.1 Ws decay time, and
split three ways, into a programmable attenuator channel for the trigger (see section 12), and into two separate
ADC channels, one for small signals and one for large
signals . Each channel has its own independent resettable integrator and a sample-hold circuit .
The low range has an additional gain of 32 before
the integrator . After each beam crossing, the signal is
integrated and stored by the sample-hold circuit . Then
the integrator is reset, in preparation for the next beam
crossing. This provides the short integrator memory
time for large signals. The sample-hold (with the stored
signal) is not released until just before the next beam
crossing, allowing maximum time for the first level
trigger to operate. The sample-hold circuits are followed by two amplifiers, each providing a gain of four
to yield the desired wide dynamic range. A single chip
microcomputer with its program in masked ROM
(Hitachi 6305) chooses one of the six signals available
TO TRIGGER
8 BIT DATA BUS
a
to digitize using a 12-bit digital to analog converter
(DAC) and six comparators . A simple successive approximation algorithm is used on the chosen signal. The
least count on the most sensitive range (the low energy
channel and a gain of 16 after the sample-hold) is 5 [X,
corresponding to less than 100 eV. Full scale (on the
least sensitive range, no gain after the preamplifier) is
10 V, about 200 GeV . The digitizing range of the ADC
is equivalent to a 21-bit ADC, with resolution of at least
10 bits (1 :1000) for signals greater than 100 MeV. The
linearity is better than 1% over the full range. The
actual dynamic range achieved for BGO signals is
200 000 : 1, from full scale to the noise level.
The microcomputers (level 1 readout) complete the
digitizing and store the data within 250 ps after the
trigger . The microcomputers, one for each BGO crystal,
are organized in token ring networks of 60 crystals and
are controlled by another computer (level 2 readout),
which is a single board Motorola 68010 in a VME crate.
These are located more than 100 m away in the counting room. Communication is via differential '1TL drivers
and receivers. Only the actual analog to digital conversion is done at the trigger time; readout by the higher
level computers is done as a background task. The
microcomputers can buffer up to 41 events internally.
This system allows a peak instantaneous event rate of
4000 triggers per second and an average rate of 500
triggers per second (the transfer rate to the master) . The
microcomputers also allow several system features to be
added at the lowest level. Each crystal has an individual
sparse scanning threshold, trigger attenuator constant
(for the analog output to the trigger system), trim
HANDSHAKE
IOKENS
RESET
BIDIRECTIONAL
.omouma+
INTERRUPT
u*an+a,a*au.
MICROCOMPUTER
MULTIPLEXER
PREAMPLIFIER
PHOTODIODE
P
POLE-ZERO
XI
AMPLIFIERS INTEGRATORS
-A1
NIP
SAMPLE-HOLDS
X
SLOW
AMPLIFIERS
n
COMPARATORS
TEMPERATURE
INPUT
Fig. 89 . Diagram of the level 1 ADC system .
B. Adeva et al. / The construction of the L3 experiment
VME BUS
Rang noua
16 LEVEL 2 CPUs
1
EACH CONTROLS 60 ADCJ
TO OTHER T
EACH LEVEL
CONTROLS
16
3 CPU
LEVEL2 CPUs
N RINGS
60 LEVEL I MICROCOMPUTERS
IN A TOKEN RING NETWORK
I ADC FOR EACH
BGO CRYSTAL
Fig. 90 . Organization of the upper levels of the readout system .
constant (to adjust the pedestal value), test pulse enable,
etc . ; all of which are downloaded from the level 2
computer . Each ADC ca - :i also measure the leakage
current of the photodiodes ai d, if desired, the temperature of the BGO crystal . Sevsral test modes are available to ensure the integrity of the system. All the data
words have a parity bit added before they leave the level
1 microcomputer . Fig. 90 shows the organization of the
upper levels .
The level 2 computers are organized in groups of 16
79
and controlled by a level 3 computer (also Motorola
68010), which is the VME crate master (the level 2
computers are VME slaves). Communication between
level 2 and level 3 is via dual ported memory located in
each level 2 computer . The programs in these computers
are stored in RAM and are loaded during an initialization phase, either by downloading from a higher level,
or from local non-volatile memory in each VME crate.
Each VME crate provides readout and control for 960
crystals. Eight crates are required for the barrel, thirteen
crates for the full calorimeter (with endcaps and including the luminosity monitor) . These crates are connected
to a level 4 crate via a VME to VME link, which
incorporates FIFO memory buffers . The level 4 computer combines the data for each event into one block
and sends it to a FASTBUS memory module in the
main data acquisition system. The system has a maximum average data transfer rate greater than 6 Mbyte/s.
This corresponds to 500 triggers per second, with 20%
of the crystals having data above the sparse scan
threshold .
9.1 .4. Thermal regulation
The light produced in a BGO crystal by a particle of
a given energy is strongly correlated to the crystal
temperature. The light output variation is -1 .55/°C .
Therefore we must maintain the BGO at the lowest
possible temperature but above the dew point . The
required energy resolution ( < 1 % at 50 GeV) implies
maintaining the crystal temperature constant within a
few tenths of a degree, as well as the temperature
difference between the two crystal end faces below
0.5°C .
pipe . (3) Cables to
Fig. 91 . Exploded view of a preamplifier board for the BGO barrel. (1) Thermal stabilization cover. (2) Cooling
the level 1 cord. (4) Preamplifiers. (`) Thermal sensors .
80
B. Adeva et al. / The construction of the L3 experiment
Fig. 92 . Schematic view of a level 1 readout box. (1) Thermal screen. (2,, Cooling pipe . (3) Level 1 readout board. (4) Connectors for
the readout cables from the preamplifier boards . (5) Support frame for the readout box and for the cables .
The preamplifiers located at the rear face of the
crystals dissipate about 0.2 W each . This heat must be
removed to maintain the preamplifier temperature below 35°C and to minimize the gradients along the
crystals . To evacuate this heat, each of the 320 24-channel boards is covered with a brass screen to which
copper pipes have been soldered . The pipes are connected to cooling fluid circuits [35] . These screens are
positioned about 1 mm away from the electronics components to achieve adequate heat transfer . A schematic
layout of the preamplifier board and its thermal screen
is shown in fig. 91 . To prevent heat transfer to the
electromagnetic calorimeter from outside, the calorimeter is surrounded by very thin active thermal shields,
connected to the fluid circuits.
The level 1 readout boxes, each containing up to 32
readout electronics cards with 12 channels per card, are
installed on the end faces of the hadronic calorimeter
barrel . Each channel dissipates 2 W, resulting in a total
dissipation of 23 kW . This heat has to be evacuated to
maintain the electronics below 40°C . A level 1 readout
box is equipped with 17 built-in rnn'sina cr" r F-inc canj_
wiched with readout cards. Special screens were developed using the roll-bond technique [36] . Four boxes are
connected to a cooling fluid circuit, resulting in a total
of two sets of four circuits . A scitematic view of a
cooling box is given in fig. 92.
A c )oii lg fluid circuit [35] is basically composed of a
vacuum pump, a circulation pump, a water-cooled heat
exchanger and a thermal valve to regulate the fluid
temperature (fig. 93). To avoid accidental fluid leaks,
the circuit is operated at 800 mbar below atmospheric
pressure . The cooling fluid must have low density, low
viscosity, low vapor pressure and high specific heat ; it
must be an insulator to avoid mixing up the electrical
V"
a ua
YD
TANK and
LEVEL GAUGE
COliîRGLLER
T!£RMAL SCREEN
CIRÇLILATIGN
PUMP
HEAT EXCHANGER
Fig. 93 . Schematic view of a cooling circuit.
B. Adeva et al. / The construction of the L3 experiment
F
O
Î
PFB
6
SF
EIGO
CRYSTAL
SFB
MIXER
XENON
FLASHER
REFERENCE P D
REFERENCE PM
Fig. 94 . Schematic of the BGO xenon monitoring system. PFB:
primary fiber bundle . SFB : secondary fiber bundle. SF : spec
tral filter . F: attenuation filter (optional) . (1) Fiber from the
other lamp system. (2) Fibers from other mixers.
grounds of the system. We use about 1 t of a silicon-base
liquid, Dow Corning DC 200/50 with a density of 1
g/cm3 , a viscosity of 5 cst at 25 ° C, a vapor pressure of
40 mbar and a specific heat of 1400 J/kg.
The
. temperature at the front and back of the BGO
crystals is monitored by 1280 AD590 sensors, so that
there is one front and back temperature measurement
for every 12th crystal . These sensors are read out through
the BGO level 1 readout system. Another set of 960
AD590 sensors monitors the temperature of the preamplifier boards, of the level 1 readout boards and of
the cooling fluids . They are read out by an independent
system to p-,rsafe operation of the electronics even
in case of failure of the central Br0 computer . The
reading accuracy is about 0.1°C for each sensor.
9.1 .5. Xenon light monitor
The light collection efficiency of each crystal .~gether with the gain. of the couesponding readout chi in
are monitored by means of xenon light pulses distributed by optical fibers (fig . 94) . The light flashes are
generated by a set of 16 xE ton flash lamps. From each
lamp, the light is transported by four bundles of optical
fibers ("primary be adles") to four light mixers and then
to the crystals by four "secondary bundles" of 240
fibers each . From each mixer, additional fibers carry
light to reference photomultipliers and photodiodes .
Each crystal is illuminated by two fibers from two
independent systems, one for high energy pulses (typically 35 GeV equivalent), the other for low energy
1-bout 11 .55 (0reV equivalent)- These two pulses are used
to compare the behavior of the low and high gain
channels of the BGO readout electronics . Furthermore,
the sectors of the barrel covered by neighboring low and
high energy fiber bundles are slightly offset . This enables the investigation of systematic effects .
The driving circuits of the Hamamatsu L2453 xenon
lamps have been tuned to produce the same pulse
length as the BGO scintillation . The primary bundles
81
are made of 14 quartz fibers (type PCS600, core diameter 600 gm, produced by Fibres Optiques Industrie)
which at each end are glued together in a connector .
The length of a bundle is 35 m . The light mixer consists
of a polished lucite rod, 200 mm long, with a 5 x 5 mm2
section. Upstream and downstream of this rod, slightly
depolished lucite plates improve the mixing. In order to
match the spectrum of the BGO scintillation light, the
ultraviolet and infrared components are suppressed by
appropriate filters . The secondary bundles, typically 2
m long, are composed of 200/230 tLm quartz/hard
plastic fibers type HCP200 produced by Ensign Bickford Optics Company . At one end, the fibers are glued
together in a connector and at the other end each fiber
is terminated by a brass ferrule which snaps into the
crystal capsule . The mechanical couplings of the primary
and secondary bundles to the casing of the mixer are
made to be strong and very precise .
Two different types of references are used to monitor the intensity of the light pulses coming out of each
mixer, namely photomultipliers equipped with Harshaw
Nal-Am pulsers and Hamamatsu 52662 photodiodes .
Because of the temperature dependence of the Nal(TI)
scintillation efficiency, the photomultipliers are housed
in temperature contr,~Iied cabinets located outside the
L3 magnet, about 30 m away from the BGO barrel,
whereas the photodiodes are mounted on the BGO
barrel structure itself and need not be decoupled from
th°; mixers during transportation between the calibrati . )n site and the L3 experimental hall. For each photo"'Am
diode, the 59 .5-keV y ray line of an
source allows
amplifying
chain
.
us to monitor the gain of the
of
the
optical
fiber
aystem
is
estimated
The stability
as follows : 'n each sector of 240 crystals connected to
the same mixer, the xenon light amplitude measured in
a given channel is normalized to the sum of the amplitudes in the sector . Over a period of 45 days, the mean
variation of these relative amplitudes for one complete
half-barrel is 0.20 rms . This demonstrates the quality of
the optical fiber system and of the electronics .
9.1 .6. Energy calibration
The calorimeter was calibrated at CERN in the SPS
X3 beam, where an accuracy better than 1 % was obtained. In turn, each of the two fully equipped half-barrels was installed on a rotating table. Sufficient statistical accuracy was achieved by recording about 1500
electrons for each crystal at 2, 10 and 50 GeV/c
momenta. Owing to the high resolution of the calorimeter, this measurement requires a well tested procedure
and control of systematic deviations from the nominal
energy deposition .
The firs . requirement is a beam spectrometer of
adequate resolution, stability and momentum reproducibility comparable to the energy resolution of the
BGO . We measured the magnetic field of the bending
82
,B. Adeva et al. / The construction of the L3 experiment
Table 11
Parameters. of the X3 beam spectrometer
Field reproducibility
Field peak to peak ripple
Field slow drift
Chamber resolution
Absolute momentum error
from bending angle
200
< 0.15%
<10 - $ at 10 GeV/c
< 5 x 10 -4 at 2 GeV/c
±400 t.m
° 100
á~
-0
4x10 - 3
magnets to insure that the design parameters were respected . The measured parameters of the spectrometer
are given in table 11 .
The second requirement is to have a geometrical
precision in the crystal alignment with the nominal
beam direction and position such that no correction
should be introduced in the evaluation of the energy
deposited in the crystal . This requirement is translated
in a positioning of the geometrical center of the crystal
front face better than 1 mm and an angle between the
beam and the crystal longitudinal axis less than 5 mrad.
These limits were achieved by the mechanical precision
of the supporting table and by the electronic controls of
the servo motors.
Finally during the calibration the half-barrel was
enclosed in an air-conditioned tent with a stabilized
nominal temperature of 18 f 0 .5°C .
The calibration constant of a crystal is defined as the
ratio between the energy deposited in the crystal and
the electronic signal read by the readout system . The
energy deposited L . a single crystal is a fraction of the
electron energy which depends upon the impact point .
In order to reduce this dependence, we sum the signals
from a matrix of 3 x 3 crystals. In this sum we normalize each amplitude with the value of the signal given by
the cosmic ray measurement. In subsequent iterations,
the normalization values are replaced by the calibration
constants obtained in the previous step .
Two quantities computed from the pulse height distributions can be used to evaluate the calibration constants : the peak and the mean values. We use the mean
value to compute the constants and the peak to control
systematic errors possibly due to data selection or to the
influence of malfunctioning or absent channels. Both
methods agree withiii 0.2% (fig . 95) . Each crystal contributing to the tail of the distribution is reevaluated . A
third method, based on single crystal signals, was also
used as an additional check . It agrees well with the
other methods (< 0.4%) .
The main correction was due to the actual temperature profile in the BGO crystals. The thermal sensors
allow the determination of a temperature map which is
used to corre?7Y the measured pulse height applying the
average temperature coefficient of -1 .55%/°C . The
reproducibility and the stability of calibration constants
r
t
50
' _Ls . . .
1 .02
Ratio
Fig . 95 . Ratio of the mean value to the peak value for all
crystals in the first half-barrel .
were tested with a prototype matrix [371, within 0 .3%
rms systematic error.
Since one of the most important parameters of the
BGO detector is its low energy resolution, this was
tested using one of the half-barrels at a specially designed beam line providing 180-MeV electrons at the LEP
injector linac. A representative sample of approximately
200 crystals were exposed to the beam . The measured
resolution is shown in fig . 96, which also include the
high energy measurements as well as results from an
early prototype detector. The resolution at 180 MeV is
better than 4%, which is within the design goals of the
detector.
Cosmic muons are used to monitor the calibration
constants as measured at the test beam, and to perform
periodic calibrations in situ to ensure the stability of the
energy response of the calorimeter [38,391 . They allow a
measurement of the possible variation o ¬ the light response of the crystal along its major axis. The expected
muon rate useful to the calibration, i .e . those muons
crossing opposite faces of a crystal, is about 500/day
6
5
d
4
w
°
3
11
1
02 04
1
2
4
10
20 40
E (GeV)
Fig . 96 . Energy resolution . Diamonds : prototype 1985 ; squares :
barrel 1`388 .
B. Adeoa et al. / Tire construction of the L3 c-periment
83
HB
B_ 11 .60
Fig. 98 . Crystal arrangement in an end cap sector . There are 16
sectors per end cap .
to those used in the barrel. In front of each endcap, four
drift chambers measure the position and the direction
of a charged particle after the TEC f1wnge with a spatial
resolution of better than 200 Rm, and angular precision
better than 10 mrad .
c
,0
20cm
Fig. 97 . BGQ end cap longitudinal section . (1) Crystals. (2)
Cell walls. (3) Mechanical structure. (4) Stiffening radial spokes .
(5) Supporting ring. (6) Preamplifier board . (7) Cooling ducts .
(8) Thermal shield. (9) Optical fiber bundle.
per horizontal crystal and 200,/day per vertical crystal .
With these rates, the precision on the muon momentum
measurement in the muon chambers and the determination of the energy loss in BGO [40], calibration and
monitoring of the light yield along the crystal with the
accuracy required to match the detector performances
can be achieved in a few days .
9.2. The end caps
10 . The luminosity monitor
10.1. Design description
The luminosity monitor (fig. 99) is designed for
reliable luminosity measurements in the Z ° energy range
at LEP [411, by measuring the rate of Bhabha events . It
Hadron Calorimeter Endcap
Planar
Ch-[er,
BGQ
The end caps (EC) are made of two symmetrical
parts, with 1536 BGO crystals each, giving an angular
coverage ranging from 12' to 42" and 1,38' to 168',
."
n~ra ~ntiassty lfw
471~- Fach end cap
is split
at+Jarvvóseva~
~ . .b.
into two
r
a
halves for installation around the beam tube . Each half
is composed of eight sectors (fig . 98), in which the
crystals are distributed into five modules of three rows
and one module of two rows near the beam tube . The
end caps are built with the same materials as the barrel .
The electronic readout, the thermal regulation system
and the xenon light monitoring system are also identical
Fig. 99. The L3 luminosity monitor .
84
B. Adeua et al. / The construction of the L3 experiment
Fig. 100. An end view of the BGO crystal array.
is located in an angular region forward enough to
become independent of the Z° exchange and yet not too
far forward so as 'to allow easy Bhabba event selection
unaffected by systematic errors . It consists of a charged
particle tracking device with good position resolution,
followed by a highly segmented BGO array of good
radiation hardness to measure the energy of the showering electrons and photons.
With this system, ore can study in detAI the Bhabha
process including the radiative tail . The" trigger [421 will
permit the measurement and removal of ba-kground
events like beam-gas interactions . Offline analysis will
remove the Bhabha events that develop only a fraction
of their energy in the BGO detector but otherwise pass
the trigger condition. By comparing the tracking information with the energy profile deposited in the crystal
array, one can define a very precise geometrical acceptance region . An asymmetric software cut will reduce
the systematic effects of variations in the LEP beam
parameters .
The BGO array is cylhndr ca'jly symmetric. The
crystals are arranged in eight rings (fig. 100), each
covering 15 mm radially, parallel to the beam pipe .
Azimuthally, they are arranged in 16 sectors of 22 .5 °
each . Each sector consists of 19 crystals which are 26
cm long and which range in cross section from 1.5 x 1 .5
cm2 to 1.5 x 3.0 cm2. The crystals are wrapped first in
teflon tape and then in 25 gm copper foil . Each crystal
is viewed by an Hamamatsu photodiode, and a yellow
light emitting diode is mounted opposite the photodiode
to r oäcitor any radiation dainàge and recovery . 10
ensure optimum shower containment, a software cut is
defined that limits the acceptance to the inner six of the
eight rings . This also matches the full efficiency range of
the monitor chambers . The BGO array is split into two
halves that are separated (fig. 101) during each filling of
the LEP ring by an hydraulic device wita a positioning
accuracy of 10 Rm . A lead sh;°ld between BGO and
beam pipe provides further radiation protectior . 'T ., ., :
Fig. 101. The support structure for the BGO array.
main characteristics of the system are summarized in
table 12 .
Apart from an energy trigger demanding a large
amount of energy deposited in the two BGO arrays (e.g.
for tags in two-photon physics), a geometrical trigger
will require a coincidence having a minimum energy in
each of the two BGO arrays . The azimuthal width of
the overlap region for the coincidence is defined as two
BGO sectors, i.e. 45' . This trigger scheme allows the
Table 12
Main characteristics of the L3 luminosity monitor
Distance from the interaction point [cm]
Beam pipe radius [cm]
Radial extent of physical BGO array
R min - R ma
., [cm]
Radial extent of acceptance area
Rmin - R ma,, [cm]
Effective polar angle coverage
Omin - Omax [mrad]
Effective Bhabha cross section Q [nb]
Length of BGO crystal [cm]
Length of BGO crystal [X0]
Tracking chamber resolutions
(entire track)
A R " I I.Lm]
d0 [mrad]
A(P') [deg]
Calorimetry
/E J"
,1O [nirs~~d]
®O ') [deg]
Has been measured in a r0 Cc". . lectro
265
6.0
6.8-19.0
8 .8-17.5
31-62
100
26 .0
24
< 250
< 0.10
0.6
0.5-1 .0
900
< 0 . _,
< 0 .6
B. Adeva et al. / The construction of the L3 experiment
observation of radiative and nonradiative Bhabha events
as well as of background interactions. Software studies
will then control the amount of background to be
admitted into the luminosity event sample.
The forward tracking system in front of the BGO
array consists of a stack of four planar multiwire proportional chambers with cathode strip readout . The
chamber dimensions are 400 mm x 200 mm x 10 mm
and each stack of four chambers has the cathode strips
arranged in both R-45 (two chambers) and x-y (two
chambers) configurations . Data on efficiency and spatial resolution were obtained by exposing a stack of four
prototype chambers to 50 GeV electrons in the X3
beam at the CERN SPS. The efficiency per wire plane
was better than 98% . Requiring a track to have at least
3 out of 4 hits gives a tracking efficiency of 99.8% . The
spatial resolution was < 350 lim per chamber . Again,
requiring at least 3 out of 4 hits gives a spatial resolution per track of better than 250 Rm. The measured
pulse height matching between opposed cathode planes
within an individual chamber has an rms spread of
17% ; this will aid in resolving ambiguities for multihit
events.
Because of the steep dependence of the Bhabha cross
section on the angle from the beams axis a crucial factor
is zhe turn-on of the efficiency near the inner radius of
the chambers . The system was found to be fully efficient for radii greater than 88 mm which is adequate for
the fiducial voierne used in the energy trigger .
10.2. Precision goals for the L3 luminosity monitor
The luminosity monitor will accept an angular region of 30-62 mrad with full efficiency, corresponding
to an effective Bhabha cross section a = 100 nb. At an
average luminosity of 1031 cm-2 s -1, a trigger rate of
about 1 Hz will result, to be compared with the 0.3 Hz
expected rate from Z events. Thus, a statistical error of
about 1% in the luminosity will be achieved in a 3-h
run. We ahn at a precision, including systematic effects,
of better than 2% in the integrated luminosity on a run
to run basis. The main limitation will then come from
systematic errors which can be separated into four
major sections, as discussed in the following subsections .
10.2 .1. Theoretical uncertainties
These include uncertainties in the Bnabha cross section, such as weak interaction efleCtS, vaCüüaii pviari . -ation, or multiple photon emission beyond older a. ; .
They contribute to the system.atic errors for an estimated 1%.
10.2.2. Detector performance
The limitations of the luminosity I-tectn- contribute
below the 1 % level to the systematics. The total energy
trigger and the requirement of good lateral shower
85
containment will produce no significant loss of Bhablza
events. Longitudinal shower containment is almost
complete in 24 nidiation lengths and can be ignored
against the more incomplete lateral containment . The
tracking chamber resolution of better than 250 dam,
taken at the critical inner radius R = 8.8 cm, produces a
luminosity error of less than 0.6% per event and this will
be made negligible by the statistics of a 3-h run . Chamber production tolerances, as well as final alignment
and survey, should be below 100 tim and thus contribute 0.2% to the systematics. The chambers will be
mounted in a fixed position on the beam pipe and they
will be surveyed with respect to the LEP quadrupoles .
Chamber efficiencies have the most critical effect in the
systematics. They must be known to better than 1% per
wire, and must also be stable at that level. Requiring
hits on 3 out of 4 chambers reduces the systematic error
to 0.3% . Thus, by monitoring any inefficiencies, especially near the onset of full efficiency at R = 8.8 cm, the
systematic error should be well below the 1% level.
10.2.3. LEP beam backgrounds
Minor contributions to the systematics come from
background interactions mixed into the event sample.
Synchrotron radiation induced events are easily removed by a suitable energy threshold in the trigger .
Off-momentum electrons resulting from beam-gas or
beam-wall interactions will be studied as part of the
event sample . They are identifiable as highly acoplanar
events wb_ ; h violate the geometric trigger but are
accepted by the energy trigger . A study of these events
will permit a reliable backgrouna subtraction accurate
to better than the 1% level.
10.2.4. LEP beam parameters
One of the rno~t serious obstacles to keeping the
luminosity systematics below the 1% level is the dependence of the observed Bhabha rates on variations of the
beam parameters at the interaction point. The parameters are predictions derived from single separated beam
measurements . Hence, a major effort was undertaken to
adequately eliminate the dependence of the Bhabha
calibration on the precise values of the beam parameters. After consultation with the Lf:P instrumentation
group, the following parameters were picked as the
most essential to control [43]: IP position ((x), (y),
(z)); IP width
(ay), (a-),' ; beam dispersion
and angular beam offset ((x`), (y",).
A Monte Carlo study of the effects of beam par eter values, in combination with the trigger design end
event selection, was undertaken [421 . We have tnrese :n
the use of a:3 asymmetric softwan . trigger [441: one :)f
the detector arms requires the nominal geomet zal
trigger between 30 and 62 mrad, whereas the other arm
has to satisfy the geometrical trigger within a loosened
angular range from 30 - d to 62 + d milliradians, where
B. Adeua F
86
ai / The construction of the L3 experiment
the ccontral detect ir), it can clearly t)e corrected for and
its effects on systematics removed. A study is under way
to investigate the feasibility of measuring beam parameters with the luminosity monitor itself. Hence, the stated
results are worst case only. Table 13 shows typical
values for the parameters as they have been estimated
by the LEP instrumentation group [43]. The column
labelled "absolute change" shows the corresponding
change in the luminosity calibration. Using a value of
d = 0.6 mrad, the systematic error on the absolute
luminosity due to ignorance of beam parameter settings
can be kept below the 1% level for values several times
larger than the column labelled "typical value" in table
13.
<x> (mm)
a) d= 0, ox, a , aZ as for (c):
b) d= 0 .6 mraj, ox= oy= a== 0
c) d= 0.6 mrad,cx = 0.3 mm, oy= 0.012 mm, a== 33 mm
11. The central track detector
Fig. 102. Effect of asymmetric trigger.
d is a parameter to be suitably chosen. As an example,
the event rates drop almost linearly with (x) when
d = 0. With increasing d, the dependence becomes
parabolic until, for a particular value of d, there is no
dependence for a wide range of (x) values With still
larger d values, one obtains even á rise in rate with (x)
for small values of (x). The variation of the event rate
for particular values of d as a function of (x) is shown
in fig. 102 .
In our sirulation, a chaniber resolution of 400
was used. The energy showers were not simulated, but
lateral non-fluctuating shower spreading was allowed.
The trigger was simulated with an energy trigger
threshold of 781- of beam energy per arm . The events
Lhemselves were produced by a standard generator [451
including first order radiative events.
It is important to realize that the results from the
study on the systematic errors apply only in case that a
particular beam parameter setting cannot be measured
(or predicted). If a parameter can be measured (e.g. by
tLm
Table 13
Systematic uncertainties in relative luminosity measurement
Parameter
at IP
Typical
value
Known
to
Absolute
change in %o
( .x)
100 ~t m
15 ~L m
0.1
a
.n.nw la m
1v ~. m
r. 5
100 ~L m
12 ~t m
5 ~t m
0.1
0.06
(y)
( )
o.
(x')
a,1
(v , )
a,,-
1 ~L m
1 mm
33 mm
0.7 mm
175 lirad
5 ~L rad
0
0.5 mm
2 ~L rad
0
175
10 grad
5 ~t rad
~L rad
for typical value
0.1
1 .5
0
0.05
0
0.05
1L1. Introduction
The L3 central track detector is designed with the
following goals:
- detection of charged particles and precise measurement of the location and direction of their tracks ;
- determination of the transverse momentum and the
, .
sign of tháh. charge for pa il-C es up to 501. .~cV /C ;
- reconstruction of the impact point and direction for
charged particles at the entrance of the electromagnetic calorimeter ;
- determination of the track multiplicity originating
from the interaction region at the trigger level;
- reconstruction of the interaction point and of secondary vertices for particles with lifetimes greater
than 10-13 s.
These goals and the limited space available for this
detector within the electromagnetic calorimeter have
determined its design . The total lever arm available for
coordinate measurements in the chamber is 37 cm radially. The charge identification of SO GeV/c particles
with 95%. confidence requires 50 coordinate measurements with 50 p.m resolution. This is accomplished by
two concentric cylindrical drip chambers on common
end plates operated in " time expansion" mode, the
TEC, surrounded by two cylindrical proportional chambers with cathode strip readout, the Z-detector (fig.
103).
a a .2. .
ne
s ree
fivenn
ssesse.
ex
ans".e aon
~.rsjr .ers
" vss
ChraM
- i,-nv
a seueseeier
Following the TEC principle, the high field amplification region at the sense wire plane is separated from
the low field drift region by an additional grid wire
plane . This configuration allows to optimize the electron arrival time distribution as well as the track length
seen by the individual anode wires independently of the
drift velocity chosen in the drift region. The TEC oper-
B. Adeva et al. / The construction of the L3 experiment
WARE
CHARGE
87
DIAMETER Nm
DIVISION ANODE
MATERIAL TENSION
C~3
20
W
ANODE
20
W
" FOCUS
100
CuBe
200
250
CUBS
1200
100
CuBo
300
GROUP OF 5 GRID WIRES USED FOR PICK UP - MEASUREMENT
O-----i 0 " POTENTIAL WIRE S
100
Gu8®
300
"
0 " OUTER B INNER FOCUS . CATHODE
~~--
.0
70
Fig. 103. General view of the central track detectors.
ates with 80% C02 and 20% iC4Hto , which has a low
longitudinal diffusion and thus permits a low drift
speed. Furthermore, this gas has a negligible Lorentz
angle. To reach the ultimate resolution for drift lengths
of up to 5 cm, determination of the drift time by a
center of gravity method is mandatory. Thus the anode
pulses are sampled by Flash Analog to Digital Converters (FADC) after a shaping of the analog pulses to
cancel the ion tail . This principle has been tested by
prototype chambers in test beams and in the MARK J
experiment at PETRA [46-481.
11.2 .1 . Mechanical construction
The TEC wires are supported by two end plates with
precisely drilled holes for the anode, potential and field
shaping wires. Furthermore, the plates contain the gas
inlets and outlets, and the grooves for the positioning of
the grid wire planes (fig. 104) . The end plates are held
apart, and the enclosure is gas sealed, by a 4-mm thick
aluminum cylinder at the outer diameter and a 1 .5-mm
thick beryllium cylinder at the inner diameter . The
structure has been studied by the finite element technique to meet the required precision of about 10 Wm for
the wire positioning and to minimize the amount of
material traversed by the particles entering the chamber
and reaching the electromagnetic calorimeter (less than
1 % and 10% of a radiation length, respectively). Fig. 105
shows one of the end plates .
The anode wire planes are arranged radially forming
12 inner and 24 outer sectors. Their sensitive length is
982 mm . There are two types of sense wires: standard
wires to measure precisely the R-0 coordinates oé the
tracks and charge division (CD) wires to determine the
Z coordinates . Additionally, or part of the standard
wires, groups of five grid wires on each side of the
amplification region are read out (pick-up wires) . Comparing the induced signals, the left-right ambiguity for
these anodes (LR wires) can be resolved [491 . The inner
sectors include six standard and tw,) CD wires, while
the outer sectors include 31 standard, 14 LR and 9 CD
wires.
[3195
=SPACING BETWEEN WIRES
ALL DIMENSIONS IN mm
Fig. 104 . Technical drawing of the wire configuration in one
inner TEC sector and in part of two outer sectors.
11 .2.2 . Readout
Fig. 106 shows a schematic drawing of the analog
part of the TEC readout. All anodes arc capacitively
coupled to the same type of hybrid preamplifiers via
HV protection circuitry . The CD anodes have an increased time constant for better signal-to-noise ratio.
The shapers (type A) are set to produce a symmetric
Fig. 105. One of the TEC end plates.
88
B. Adeva et al. / The construction of the L3 experiment
Fig. 106. Schematic diagram of TEC analog electronics.
output signal with minimal overshoot [50] . For the
pick-up (grid) wires, a different preamplifier and a
special shaper (type B) with a differential input are
used . The shapers for the LR anodes, the pick-up wires
and the CD anodes provide additional output signals to
the level 1 and level 2 trigger processors . Calibration of
the CD channels is done by injecting known charges at
the corresponding preamplifier inputs .
The design parameters of the digital readout system
of the TEC are given by the 45-kHz bunch crossing rate
and the 50-Hz events rate accepted by the trigger level
2. To achieve this, the readout system has to buffer 10
events at trigger level 1 . The 2 Mb of raw data per TEC
event, coming from 2000 readout channels, have to be
reduced considerably before being transferred to the L3
data acquisition system . Therefore, a fast data reduction
processor (DRP) is attached to each p, :; of digitization
units.
The TEC readout system (fig . 107) consists of 60
VME crates organized in 4 chains of 15 crates. Each
crate houses up to 38 FADC channels and its control
unit, the crate master (CM) . In a fifth chain, the FADC
units are replaced by charge to time converters (QTC)
for readout of the Z chambers and by multiplexers to
read the scintillating fibers . Special modules have been
designed to interface the crates with the monitoring
computer, the L3 trigger system and the DAQ system .
The TEC data are written into a LeCroy 1892 FAST'
_ _ L_ .
_ 4 T1 e l1
ni
1 0 riertoly
BUJ
where they. _re
Where
are picked up Dy the L") DAQ
system . A program running on the host computer initializes and supervises the complete system .
The shaper output signal of every anode wire is
digitized by one FADC with a 100-MHz clock rate .
Each FADC consists of a 6-bit ADC chip (TRW TDC
1029-J7C) and 1-kB ECL memory (Hitachi HM2112-1).
This allows one to digitize the incoming pulses in 10 .24
tts, covering the maximum TEC drift time . The FADC
input can be switched under program control to a signal
generated by the crate master for calibration . Two
FADC channels are connected to one DRP to reduce
the amount of data transferred downstream in the readout system. The two FADC channels and one DRP are
built as one VME board (fig. 108) .
The DRP is built around a Texas Instruments chip
TMS 99105 with a 24-MHz clock. It has a 32-kByte
RAM memory for program, data and multievent buffering. Started by a trigger level 2 accept, the DRP reduces
the FADC raw data to about 5% . The output is written
into a dual port memory from where it is collected by
the crate master (CM). For a typical TEC event, the
computation time is less than 5 ms . A check sum can be
#3
U
0
a
U
0
a
U
U
w
#7
#8
w
MONITORING
VAX 750
COMPUTER
Q
1
Fig. 107. Schematic diagram of the central track detector
readout systems.
B. Aaeva et al.
The construction of the L3 experiment
Fig. 108. A VME module containing two Flash ADC channels
and one DRP.
calculated by the DRP and added to its output .
Each VME crate is controlled by a CM, which
consists of three PC boards. It is built around a Motorola
68000 12-MHz CPU. The central function of the CM is
to communicate with the DRP units in the crate and to
transfer the DRP data to the data acquisition system .
The CM also contains the FADC main control unit
(FMC) which accepts the primary trigger input signals
and controls all FADC functions. The data collected by
the CM from all DRP are stored in a 64-kByte output
memory (OM) . The OM of 15 crates build a chain
which is connected to the main DAQ system through a
fast readout sequencer and the FASTBUS memory
module.
A special VME crate, the databox, contains modules
which control the flow of data from the CM to their
destinations . The readout scanner module (R5) feeds
the data from the OM to the receiving memory module .
A lookup table flags crates that have to be skipped in
the readout and crates whose output data should be
copied into a spy channel. Three spy channels equipped
with 256-kByte memory each enable the monitoring
program to investigate TEC data without interfering
with the main data stream .
11 .2 .3. Infrastructure
To achieve the spatial resolution of 50 lam, the TEC
is operated with a gas mixture of 809 CO, and 20%
iC4 Hto , a gas with a low drift velocity, at 2 bar. The
drift velocity_ and hence the spatial resolution, depends
strongly on the pressure and the stability of the gas
mixture, thus the iC4H)() content must be stable within:
0.1% . Fig. 109 summarizes the design of the TEC gas
system, which operates in closed loop to guarantee long
term stability. The mixture is stored in a 1-m3 barrel
and circula."ed through a filter and an Oxysorb purifier
to keep the oxygen content below 1 ppm. The purified
gas passes through TEC at a flow of 200 1 bar/h . The
89
gas quality is continuously monitored by a mass spectrometer and the water content is measured by an
hygrometer. A small drift chamber monitors changes in
drift velocity, efficiency and mean pulse height due to
small changes in the gas composition. A VME computer
supervises the gas system and passes status information
to the monitoring computer and to the L3 slow control
system .
system outrYaawo
Curs-hoc. t-e
h
resistor
ThP hiah
..D . . unIt~ae
aabv system
1411.+.°_Vl ci1d111S
for the field shaping wires, as well as the anode and
potential wires. Since the TEC is operated with a low
drift velocity, linearly dependent on the value of the
electric field, a stability better than 0.5 V/cm is necessary. For a safe start, the 210 power supplies are ramped
at a speed of 100 V/s. Since the high voltage resistor
chains and the preamplifiers are attached to the end
plates of the chamber, their temperature has to be
controlled by a cooling and heating system . There are
96 temperature sensors distributed over the inner and
outer cylinders, as well as over the end plates . The three
magnetic field components are also measured at two
positions on each end plate.
11 .?.4. TEC calibration
Each TEC segment is equipped on its outer surface
with a plastic scintillating fiber ribbon to monitor the
low drift velocity (6 lam/ns) to an accuracy of 0.1% (fig .
110) . A ribbon is comprised of 143 fibers, each 700 lim
wide, 1000 lane thick and 1 .3 m in length . The fibers in
each ribbon are read out using two multianode microchannel photomultiplier tubes. The signals from each
tube are multiplexed serially using the MX4 microplex
chip and are interfaced to the standard data reduction
processor of the T1 C 1511 .
J
L,.
Fig. 109. Schematic diagram of TEC gas system .
B. Adeaa et al. / The construction of the L3 experiment
20
DET4IL A
m
Z
T- -T-'- '
1
15
w
w
m 5
OUTER TEC
O
r,
-40
.,
I
--I
-20
FIBER NUMBER
L
n
UL,
0
20
(OBSERVED - PREDICTED)
n.
40
Fig. 111. Difference between the fiber position with a hit from
the predicted fiber position using drift time information.
'The feasibility of this calibration system was demonstrated in a test beam during March 1989 [52]. Fig. 111
shows the difference between the positions of fibers
with a hit and the predicted fiber positions using the
drift time information of the nearest anode wire of
TEC . These residuals peak about one fiber position .
The residuals at large deviations are due to the presence
of more than one beam track per trigger.
11.2.5. Test results from prototypes
Since the most important design goal, an average
resol ation of 50 ILm in the measurement of the R-0
coordinate, was reached on a prototype [47], much time
has been spent to understand the variation of this
resollution :
- Tiie sampled track length influences the width of the
electron arrival time distribution and the number of
primary electrons collected at the anode. An acceptance of about 2.4 mm was found to be a good
compromise.
- As the polar angle 19 deviates from 90', the resolution improves clue to increased electron statistics (fig.
1121) . When the azimuthal angle 0 deviates fr,-m 0°
with respect to an anode plane, the resolution deteriorates due to a stretching of the arrival times.
This effect is small for the L3 TEC, since the maximum value of 45 is 7 .5 ° (fig. 112b).
Fig . 110 . TEC calibration usingplastic scintillating fibers (PSF) .
The drift distance-time relationship is obtained for
every anode by averaging over the fitted tracks for every
fiber using the e + e- interaction point and the fiber
position . For every anode, an average drif! time is
plotted for all fibers of the segment . Since each fiber
yields azimuthal position information (with an rms of
700 [.m/ 12 ), the slope of such a plot is the nvcrse of
the drift velocity of the specific anode. Monte Carlo
studies have shown, that for five tracks per fiber (b-h
run at a luminosity of 10 31 cm -2 s - 1 ) the drift distance
resolution is of the order of 10 jim, determining the
drift velocity for each anode with a 0.1% accuracy.
a
Ei
Z
.70
Ei
Z0
"0
a
w
30
d iQa,
10
AT (1,-G'
10
30
50
POLAR ANGLE 9 [°l
70
50
0N
w
30
QF
Qa
b 1
AT 0 = 90°
0
5
10
15
20
25
AZIMUTHAL ANGLE (+ 1*1
Fig . 112 . Impact of changes in the polar angle (A) and in the az muthal angle (13) on the
R-1, resolution .
B . Adeoa et al. / The construction of the L3 experiment
- The range of drift velocities is given on the one hand
by the wire geometry and the resulting high voltages
and on the other by the possible 8-bunch operation
of LEP . Inside this range, a measurement of the
resolution as a function of drift velocity indicated an
optimum of about 6 [im/ns .
- A tuning of the shaping amplifier for symmetric
output and the use of a 80%D C02-20`6 iC4H to gas
mixture at 2 bar gives an optimum between resolution and running conditions .
A Z-coordinate resolution of about 2 cm was reached by charge division. The same R-45 resolution was
obtained from the CD wires as from the standard
anodes . The left-right ambiguity is resolved by comparing signals induced on the neighboring grid wires [d91.
These signals can also be processed and read out by the
FADC/DRP system and be used in the trigger system .
Because of the restricted radial extension of the
TEC, the two track resolution is important . It was
studied by superimposing single hits from test beam
events. Beyond a separation of 450 [Lm in drift distance,
fully efficient two track resolution can be expected [531.
11.2 .6. Results from test beam
The complete detector system has been tested in a
pion beam at CERN during March 1989. The components were operated under standard conditions as foreseen for LEP operation, including proper temperature
and cable lengths.
The quality of the TEC signals was monitored by
switching several DRP to "raw data mode" to display
the full DRP memory content from the even.3. Fig . 113
demonstrates the excellent performance of the digitized
signals after pulse shaping from a multitrack event . The
FADC
I
100
E
Z
0
ó
w
w
PRELIMINARY SINGLE WIRE RESOLUTION
SECTOR * 13 ANODE * 30
0 = 375° 0=40°
80
60
50
40
FIT c =
A'x +W
A = 12km/ cm
B = 35 2 ~, m
Z
5
0
1
10
-._----
15
20
DRIFTLENGTH x [mm]
25
30
35
Fig. 114. Single wire resolution from the time expansion cham
ber operated at nominal conditions in a 15 GeV/c pion test
beam.
pulse at the extreme right is the time reference signal .
The triangles indicate the peak positions found offline
by the same peak finder program running in the DRP
operating in normal mode. Fig . 114 shows an example
of the single wire resolution as a function of the track
distance from the anode . This has been obtained with a
straight line fit on drift times determined from the DRP
information in one of the TEC sectors . The average
resolution stays well below the design goal of 50 pm.
11 .3. The Z detector
The Z detector (fig. °'0) consists of two cylindrical
proportional chambers with cathode strip readout,
covering the outer cylinder of the TEC (fig. 103). The
strips of the four cathodes form angles of 90 ° , 70.1 ° ,
--70.1' and 0 ° with respect to the beam direction,
respectively . The three supporting cylinders are built of
polyurethane foam as filling material, reinforced by
Row DRP 1117 Soft 152010"
1000
Z CHAMBER
E
i
Z
0
w
N
Fig . 113. Display of FADC raw data for a multitrack event
and the time marker sig[. ,- 1 (extreme right) . The triangles
indicate the peak position found by the peak-finding program .
0 90
70
50
POLAR ANGLE 0 t °l
30
Fig . 115 . Spatial resolution of a Z detector prototype as a
function of polar angle.
92
B. Adeva et a1. / The construction of the L3 experiment
200-[Lm glass fiber epoxy. Both cover layers of the
middle cylinder and the outer (inner) layer of the inner
(outer) cylinder consist of 50-Rm Kapton foil carrying
the aluminum cathode strips of 4.4-mm pitch. On both
ends of the cylinders, two glass fiber reinforced epoxy
rings hold the wire feedthroughs. In order to avoid
electrostatic displacements, the chamber is operated in
drift mode with every second wire at ground potential.
The Z detector has an effective length of 106,38 mm, an
outer diameter of 980 mm and a thickness of 21.5 mm,
representing about 1.36 of a radiation length . An 80%
argon and 20% C02 gas mixture is used for operation
[54].
T'he high voltage is supplied on one end of the
cylinder; the signals from the 920 cathode strips are
read out from the opposite end . Preamplifier boxes
carrying four 4-fold hybrid circuits are positioned on
the conical end flange. The signals are fed via 45 m
coaxial cable, line drivers and another 70 m twisted pair
cable to the ADC inputs . The digital readout forms part
of the TEC readout system (fig. 107), the FADC/DRP
units being replaced by 16-fold 8-bit ADC. A calibration system will pet :orm a quick check of all channels,
measure the gain and rms noise of individual channels
and the crosstalk between them.
The resolution as function of ® was studied with a
prototype of nearly the same length (828 mm) but with
a reduced diameter (246 mm) (fig. 115). The average
single track resolution over the full range 45 ° < ® <
135 0 was about 300 tLm. The double track resolution
was 7 mm at 90% confidence level [55].
12. Trigger and data acquisition
12.1. Introduction
After each beam crossing, the trigger decides whether
an e+ e - interaction took place and if so, whether the
event should be recorded . This function is performed at
three levels of increasing complexity, reducing the 45kHz beam crossing rate to a few Hz of tape writing rate.
The quality of the accepted data is monitored. The
detector parameters are also monitored, for detector
calibration and for safety (slow control).
The online computer system consists of a VAX 8800,
clustered with five smaller VAX monitoring each of the
main detector components and the trigger system . 11-he
cluster is connected via Ethernet to VME crates and
personal computers which acquire the slow control data
and to VAX stations for event display and run control.
The data acquisition uses mostly FASTBUS, chosen for
its speed and flexibility . The system includes ample
buffering capacity to allow asynchronous operation
without contributing to the dead time.
12.2. Trigger levels
All the detectors are read by the front end electronics for each beam crossing. In addition to the main
data, each detector provides coarser and less accurate
trigger data available in digitized form within a few [Ls.
The level 1 trigger analyzes the trigger data and either
initiates the digitization of the main data or clears the
front end electronics be!"ore the next beam crossing, i.e.
within 22 jLs, so that negative decisions at level 1 do not
contribute to the dead time. After a positive decision,
the detector data are digitized and stored within 500 ps
in multievent buffers and the system is readied for the
next beam crossing . The expected level 1 trigger rate is
100 Hz, corresponding to a dead time of 5%, but the
system can cope with a trigger rate up to 500 l4z with a
25% dead time.
After a level 1 trigger, the trigger data are further
analyzed by four programmable processors (XOP), each
one disposing of an average time per event of 8 ms
under the most adverse condition of a 500-Hz trigger
rate. This level 2 trigger should reduce the rate of
accepted events by a factor of 10.
The level 3 trigger is performed by three 3081/E
which have at their disposal the original trigger data,
the results of the calculations performed by the level 1
and level 2 processors and the complete set of digitized
data fi o n all the detector components. These data are
then used for a further filtering of the events . The time
available for each event is now about 10 times longer
and the information much more complex, thus a further
reduction of a factor 10 on the number of accepted
events is expected from this third level trigger . Only
when this last scrutiny arrives at a positive decision, the
event is transmitted to the main data acquisition computer to be written on tape at an expected rate of I Hz
at the Z° peak.
12.3. Data flow
The digitized data for each detector component may
be stored in several event memories situated in the
"detector" FASTBUS crates (fig. 116). Data from all
parts of the detector are then collected together and
sent to the central crate. The merging of the data from
separate substreams is performed by the combination of
three FASTBUS modules, a general purpose master
(GPM) [56], a block mover (BM) [57] and a dual slave
memory (DSM) [58]. The GPM is a FASTBUS master
which monitors the status of the source memories
(LRS1892 and DSM) and sets up the block transfer
parameters in the BM. The BM then takes up mastership of the crate and cable FASTBUS segments and
performs a series of block moving from several source
memories to one destination memory (DSM). The function of the BM is controlled by a microcode, and a
B. Adeva et al. / The constniction of the L3 experiment
MUON CHAMBER
TRIGGER DATA
93
12 .4. The level 1 trigger
The level 1 trigger is simply the logical OR of trigger
conditions from different sources : calorimetric trigger,
muon trigger, TEC trigger and scintillator trigger .
Fig. 116. The L3 data acquisition system.
variety of FASTBUS operations can be easily implemented . Furthermore, each detector component has,
interfaced to its computer, a dedicated FASTBUS crate
with a DSM which is on the same cable segment as the
DSM of the central crate. The data from each detector
component can therefore also be monitored in "spy
mode" on the detector computer.
An important exception to this procedure is the
TEC . Data reduction processors (DRP) are used at the
front end to reduce the large amount of data generated
by this detector by a factor of 20. Since the DRP need 5
ms to process a typical event and transfer it to the
buffer, they are only started by the positive decision of
the level 2 trigger.
One of the DSM on the central crate receives from
the level 2 processors the trigger data together with the
level 2 decision . The GPM examines this decision. If it
is negative, the event is simply erased from each subdetector DSM and from the front end memories of the
TEC . If it is positive, the DRP of the TEC are started
and the BM is instructed to merge the information
coming from the different subdetectors and to send
them to one of the three 3081/E computing units which
are on its cable segment.
The central crate is connected to the VAX 8800 with
the 4-MB/s CERN host interface (CHI). The CHI can
perform any FASTBUS action, c!?eck and monitor collected data and transfer them to the VAX .
12.4.1. Calorimetric trigger
The calorimetric trigger processes the information
given by the electromagnetic and hadronic calorimeters
and by the luminosity monitor (256, 384 and 32 channels respectively) ; it reaches a final decision 16.8 lis
after the beam crossing and is built with 350 CAMAC
modules forming a digitizer part and a processor part.
The CAMAC bus is only used for initial loading and for
testing purposes. The trigger data flow on front panel
differential ECL buses, 16 bits wide. Data from different buses can merge together making synchronous operation of all the modules necessary . This is achieved with
a centralized and programmable timing source which
distributes the strobes to the whole trigger system.
CAMAC 16 channels fast encoding and readout ADC
(FERA) modules, LRS4300, are used for a fast digitization of the information whereas the processor part is
built around memory lookup units (MLU LRS2372)
and arithmetic logic units (ALU LRS2378).
For the electromagnetic calorimeter, the outputs of
30 BGO crystals are grouped together to obtain a
segmentation of 32 in 45 and of 8 in ®. These 256
signals are digitized in 8.5 ~Ls with an 11-bit range and a
sensitivity of 25 MeV/bit . The luminosity monitors give
16 signals on either side, corresponding to 16 segments
in 0. Two signals are extracted from each hadron
calorimeter module. The first (layer A) corresponds to
the chambers in the first interaction length . The remaining chambers form the layer B. The last modules on
each side of the barrel do not have a layer A since they
can only be reached by particles from the interaction
region which have crossed the A layer of other modules
(fig. 117). The resulting segmentation is 16 in 0 and 11
(layer A) or 13 (layer B) in !9, with a total of 384
channels . These signals are digitized in 4.8 Rs with a
10-bit range and 50 MeV/bit .
CAL CRI METRIC
TRIGGER
36
87
65
SIG HAL SEGNENTA110N
Be
83
IN
RO
VIEW
Bomei HC
Aa
1
I9
EB
TEC
E1/C6;'
ES
.
t
E~d,
p HC
61
Lum-11II
LO
Yonno "
Fig. 117. Detector segmentation for trigger signals.
94
B. Adeua et al. / The construction of the L3 experiment
The data digitized by the FERA are read at 120
ns/word via the front panel bus ; the data from two
groups of FERA are multiplexed into a single bus and
go at 60 ns/word through memory lookup units (MLU,
LR52372) which equalize the energy scale for all the
calorimeter parts and remove the coherent noise contribution . The output of these MLU requires only 12 bits,
and one of the highest bits is programmed to give a
signal ("hit") if the energy recorded in the single trigger
cell is above a given threshold, different for each
calorimeter and function of ®. These signals are used
by the "hit counting trigger" as described below . The
energy data from the MLU are presented on a bus to
the second part of the processor at one word every 60
ns. The operations of sum and accumulate, addition and
subtraction are performed by fast arithmetic and logic
units (ALU, LRS2378) [591 ; more complex operations
are performed by MLU ; intermediate data are stored in
data stacks (DS, LRS2375) . The patterns of timing
signals necessary to drive the system are stored in fast
memories (ECLine Drivers, or ED) [601 . Extensive use
is also made of the bus switch (BSW) [611 module which
latches two 16-bit ECL words and multiplexes data
from two buses onto a single bus. In order to speed up
the data flow, data from the hadron calorimeter are
presented in parallel on seven different buses. Since the
BGO data need a longer time to be digitized, they are
ready when the flow of the HC data is terminated and
they are sent on the last four of the same buses.
For each calorimeter (BGO, HC layer A, HC layer
B), the data corresponding to a fixed & and different 0
values are summed together (45-sums) and similarly the
data corresponding to a fixed 0 and different values of
0 ( 0-sums). The 640 trigger data are therefore reduced
to 96 Plements, which are used to perform the following
trigger calculations :
Total energy trigger : The 0 sums are added over
to give the total electromagnetic, total hadronic and
total energies . A partial sum is also performed limited
to the central part of the detector. A trigger is given if
the total energy is above a predefined threshold, which
can be different if the energy is localized in the central
part of the detector and can also depend on the ratio of
electromagnetic to hadronic energy .
Cluster trigger : A cluster is a localized deposit of
energy observed in different detector layers at the same
O, 0 coordinates, the energy threshold depending on
tr e calorimeters involved . A trigger is given if at least
one cluster is found. Clusters are searched for independently in the two projections R-0 and R-0 . The
information from TEC and the scintillation couwers
can contribute to the definition of a cluster in the }t-O
View .
Single photon trigger : A cluster in the BGO is
accepted even if its energy is very low, provided it
accounts almost for the totality of the e.m . energy
detected . No track must be detected by the TEC in
coincidence with the cluster in the R-45 projection .
Hit counting trigger : A trigger is given if the number
of hits detected by the MLU in the first part of the
processor is above a certain threshold.
In addition, the luminosity monitor data are presented on one bus and the data corresponding to the
two opposite sections of the detector are stored in two
data stacks . A search is made for two high energy hits
with strong back to back correlation which is an indication of Bhabha events and gives rise to a luminosity
trigger . If a high energy hit is measured in only one
monitor and, in addition, some energy is measured in
the central part of the detector, the event is accepted as
a single tag trigger .
12 .4.2 . Muon trigger
The trigger processor searches for tracks originating
at the interaction point. It is composed of 120 CAMAC
modules, all controlled by a single source of synchronous clock pulses . The main module is the hit array
(HA, LRS2376), a 1 kb memory with two modes of
operation, load and search, corresponding to the two
steps of the track finding procedure defined below .
Each muon chamber wire sends a signal to the 96
channel FASTBUS TDC. The same signals are also sent
via the FASTBUS module auxiliary connector to a
personality card (PC) for the trigger purpose. Inputs
from two adjacent wires are ORed and stored in a hit
memory . The 48 hit memories are enabled for the
duration of the chambers drift time (1 .2 lis) . For the
trigger the chamber wires are grouped into "trigger
cells" which, for the P chambers, coincide with the
physical chamber cells (16 to 24 wires) while, for the Z
chambers, the information from the adjacent two wires
of each double plane are combined together to give a
single trigger cell. The personality card controller (PCC)
is a FASTBUS module which accesses the PC and
decides about the presence of a track in each trigger
cell . For the P chambers the PCC groups the input data
according to the trigger cell segmentation, counts the
number of fired hit memories within the trigger cell and
compares it with a preset threshold number . If the
number of hits i5 above threshold, the PCC encodes a
10-bit word with the layer number (2 bits), the cell
number (7 bits) and one control bit. For the Z chamber
the processing is simpler since a trigger cell corresponds
to a single hit memory . The data are processed by the
PCC in parallel for all octants and therefore a total of
16 buses, 8 for the P end 8 for the Z chambers, feed the
trigger data into the trigger processor at tie same time .
In the load step, the hit addresses are presented by
the PCC on each bus to a number of HA (4 for the Z
chambers and 3 for the P chambers). Only one HA,
whose layer number assignment agrees with the layer
number presented on the bus, picks up the cell number,
B. Adeva et al. / The construction of the L3 experiment
interprets it as a load address and writes 1 in the
corresponding location of its hit memory .
For the search step a number of possible "roads" of
tracks originating from the interaction point are predefined. Each road is parameterized by its central cell
number and its half width in each one of the three
chambers layers . Each road corresponds to a certain
region of the muon production angle in 0, the transverse momentum and the electric charge. All the possible tracks with P, > 1 GeV/c are defined. Track finding
starts after all the PCC have finished loading the trigger
data . A control stack presents road parameters of each
layer to the respective HA and interrogates whether the
HA finds any hits within the specified range. In the
R-45 plane the three layers of P chambers are used . The
answers from the three HA are collected at one place
and the track is identified if a coincidence condition
(3-fold or majority of 2) is satisfied between the three
layers . The large bending of the low momentum muons
can cause the road pattern to interest two neighboring
octants. For these roads the answers of the HA corresponding to the two octants are collected together . In
the R-Z plane (Z chambers) there are four chamber
layers and a similar procedure is followed . The following conditions give a trigger:
Single muon trigger: A muon track is defined in the
R-0 plane as û coincidence of all three chamber layers
and in the R-Z plane as a coincidence of all four
chamber layers . At least one octant should have a track
identified both in the R-P and R-Z planes . This
trigger is effective in the region 44 ° < O < 136 ° where
the chambers have a complete O coverage .
Di-muon trigger: A muon track is defined by a
twofold coincidence of any two layers both in the R-4)
and R-Z planes but at least two octants should have a
track identified and the two tracks should satisfy a
coplanarity condition. This trigger is useful for the
larger angular region 36 ° < O < 144° where the angular coverage of the chambers is incomplete .
Small-angle muon trigger: A muon track is defined
by the presence in the R-45 plane of a single hit in the
inner P chambers and in the R-Z. plane by a coincidence of both layers of inner Z chambers . Furthermore,
if a track is found in the forward half of the detector,
another should be found in the backward half . There is
also the possibility to accept two tracks both in the
forward or backward half of the detector. This trigger
covers the small angle region (36 ° < O < 44 ° , 136 ° <
H < 144` ) where only one layer ol r chainbe s is
available.
12.4 .3. TEC trigger
For each of the 24 outer TEC segments the trigger
uses 14 wires out of 54 1621 . The data from all TEC
segments are processed in parallel : a segment divider
module (SD) divides the total drift time into two bins
95
and solves the left-right ambiguities by means of signals induced on the grids located at the right and left of
the anode plane [631 . In this manner, the R-0 plane is
subdivided into 96 0 bins . Thus, after processing by the
SD modules, the level 1 TEC trigger information consists of a 96 x 14 bit matrix .
For each 0 bin, a track finder module (TF) searches
for the presence of tracks which leave the TEC in this 0
bin and originate at the beam line. The 96 sets of 14
signals are used to address random access memories
(RAM) which contain the topologies of all relevant
tracks, allowing for the effects of inefficiencies and
additional hits. The TF perform the track search in
parallel in less than 1 I.s . Three types of tracks are
defined :
- Tracks with polar angle 0 > 42 ° and transverse
momentum P, > 600 MeV/c are contained in a single
0 bin and the track search can be realized with a
16-kbit RAM addressed by the 14 data bits from this
single 40 bin. The lower limit of 42 ° on 0 is set by the
TEC geometry : tracks with smaller polar angles miss
the outermost wires.
- Tracks with 0 > 42 ° and P, > 150 MeV/c cross
up to three adjacent 45 bins . The corresponding SD
modules provide therefore 5 x 14 bits of information,
i.e . one time 14 bits from the "reference bin" plus two
times 2 x 14 bits from the two pairs of bins adjacent to
the central one. To keep the size of RAM memory to a
manageable level, it is necessary to reduce this information. The 14 bits of each (b bin are grouped radially two
by two. The grouping is an AND or OR, independently
programmable for each pair of bits . If the background
conditions are good, all pairs can be set to OR to
maximize trigger efficiency . If background conditions
are bad, all pairs can be set to AND so as to increase
the rejection of spurious tracks . As a compromise, if the
background is localized at small radii, the signals in this
region can be set to AND, the others at larger radii to
OR .
- Forward tracks with 0 > 25* and P, > 100
MeV/c. The search for small polar angle tracks is
performed with the seven innermost wires. The algorithm described above is applied, but no AND or OR
is now necessary. Since the same masks are used, the P,
cut is lower for the forward tracks .
Becautie of tl±e difference in maximum drift time
between the inner and outer wires, the search for Lhe
forward ~racks is performed first. in 5 [is from the beam
-...., .,., ;-,
. ..b t i tre A ftPr n further 5 us the search for the
central tracks can begin. The search is completed within
1.1 [Ls. At the end of the search a track adder module
counts the total number of tracks found, the number of
clusters (a cluster being defined as any number of
contiguous tracks) and the number of pairs of tracks
with an acoplanarity angle smaller than some programmable value. The level 1 TEC trigger decision is taken
96
B. Adeva et al. / The construction of the L3 experiment
on the basis of these numbers, and the information on
the tracks found is sent to the calorimetric trigger
processor as well as to the level 2 trigger .
12.4.4. Scintillator trigger
The scintillator triggers, based on the signals of 30
barrel and 32 end cap counters, are the following:
Multiplicity trigger: It requires a coincidence of two
out of the 30 barrel counters and is used to trigger on
cosmic muons in calibration runs. During LEP operation this trigger is efficieris for events with two muons
or two hadronic jets, thus it serves as a simple backup
trigger for the -íi-muon and cluster triggers, and is
useful to monitor their efficiency .
Coincidence pattern : This allows us to select predefined patterns of hits, chosen from the barrel and the
end cap counters, and in coincidence with the beam
gate. The following trigger conditions can be programmed:
- two counters in different barrel octants;
- one barrel counter and one end cap counter;
- one forward and one backward end cap counter;
- two forward (or two backward) end cap counters in
different quadrants.
The scintillator signals are also sent to the calorimetric trigger to contribute to the decision of the cluster
trigger.
12.4.5. Trigger control
The trigger control implements the final level 1 trigger decision and synchronizes the data acquisition and
the level 1 trigger with the beam crossing signal . Before
every beam crossing, the trigger control checks if all the
detector components are ready for a new event. If they
are, it sends a CLEAR signal to reset the whole DAQ
system . increments the event number counter and starts
the next cycle; then the beam crossing signal is sent out
to sample the data of the whole detector and to initkïte
the level 1 trigger processors . The results from the
trigger processors are returned and evaluated before the
next beam crossing. If the event is rejected, the system
is reset by the CLEAR signal and ready for the next
event. If the event is accepted, an ACCEPT signal is
sent to the subdetectors to start the data conversion and
buffering. Durin this time the subdetectors must set
FALSE on their READY line to prevent further events
from being accepted
The results of the level 1 trigger processors are
combined into a 16-bit trigger word . Together with a
16-bit event number it is sent to the subdetectors and
attached to the event data . This provides a check of the
data integrity at the event building stage. The trigger
word also provides information for event selection of
the online: monitoring and is a guide for the level 2 and
level 3 computations . Trigger control also provides timing signals for taking cosmic data or synchronizing test
signal generators to calibrate the detector and test the
DAQ system.
12.5. The level 2 trigger
The level 2 trigger scheme is shown in fig. 116. The
multiport multievent buffer (MMB) is an 8 events deep,
256 words per event, first in/first out input memory
[641 . After each beam crossing, all data (4 k 16-bits
words) delivered by the front end trigger digitizers are
stored in parallel in the 60 ECL input ports at the speed
of 60 ns per word . The final and some intermediate
results of all the level 1 trigger processors are also
stored . One of the ports receives the trigger word and
the event number generated by the trigger control logic.
The level 2 trigger receives also information which was
not available in time to be processed by the level 1 . In
particular, it receives charge and drift time information
from the charge division wires of the TEC, which allow
to define the track coordinates in three dimensions [621 .
Data acquisition management is hard wired and
synchronized by signals delivered by the level 1 trigger.
All the data barks connected to the input ports are
overwritten at each beam crossing until a level 1 signal
validates the event. This increments the input event
pointer and the status register .
Four XOP processors work in round robin mode
between two FASTBUS segments . XOP is a fast trigger
processor designed at CEI?N [651 and Uly integrated iii
FASTBUS [661 . It is microprogrammable and executes
192 bits wide microinstructions in 100 ns on 16-bits
data words. It communicates with the external world via
a VMF interface ~or program loading and a FASTBUS
interface [671 for data taking and processing . When idle,
each XOP competes for mastership of the input cra e
segment. The winner reads the MMB status word . If
positive, it reads the earliest event in each memory and
decrements each MMB status register, thus building a
complete event with its event number. This readout is
decoupled from level 1 operation since the MMB memory provides a simultaneous random read/write access .
When the readout is completed the XOP releases mastership and starts computation.
The main purpose of this computation is to reduce
the event rate by :
a) the detection of the clustered energy in the BCJO and
two lateral l iyers of hadron calorimeter by correlating them in a full O-4) plane;
b) the longitudinal and transverse energy balance of the
clustered energy ;
cl the recognition of the vertex along the beam axis by
using the charge division wire of the TEC chamber.
The programmability of the XOP provides ample
flexibility in the selection criteria.
After the computation is finished, the XOP arbitrates for mastership on the output segment in order to
B. Adera et al. / The construction of the L3 experiment
write data and results, including the final decision on
the acceptance of the event, into the DSM on the
central crate. The same data can be read in spy mode by
the DSM connected to the trigger computer and used to
monitor the trigger .
Cn
LTp-lef
12 .6. The level 3 trigger
The level 3 trigger, made by three 3081/E emulators,
is embedded in the main flow of the data acquisition .
The 3081/E is a computer developed at SLAG and
CERN which emulates a subset of the IBM 370 instruction set and runs as fast as an IBM 370/168 . Each
3081/E is equipped with a FASTBUS interface with
two cable segment ports completely symmetric and independent, one used for data input, another for data
output : I/O operations can be done by one port at a
time, while the control and status register (CSR#0) is
common to both ports and can be simultaneously
accessed by them to know the status of the machine .
Through this interface the 3081/E becomes a FASTBUS slave geographically addressable on cable segment .
As a consequence the level 3 architecture relies on the
use of intercommunicating masters on both input and
output segments to control all the ,spects of the data
flow. When a 3081/E is free its input responds to T-pin
broadcast and receives a complete event at a speed of
16 MB/s. It then starts a computation for the event
selection.
Unlike the level 1 and level 2 triggers, for which only
the trigger data with coarse granularity and lower resolution are available for the trigger decision. the level 3
trigger has access to the complete digitized data with
finer granularity and higher resolution. A complicated
algorithm written in FORTRAN and tested with the
offline computer is executed . The selection of good
events is based on
a) the correlation of the energy deposited in the BGO
and hadron calorimeters,
b) the reconstruction of muon track in the Z chamber.,,
c) the reconstruction of the vertex in the TEC chamber.
A steering program minimizes the processing time by
properly arranging the sequence of the above calculations.
In case of a positive level 3 decision, a service
request (SR) signal is asserted on the output port and
the FASTBUS computer interface (CHI) transfers the
data fron' the emulator memory to the main data
acquisition compuieÎ for tape writing .
1?.7.
The online cwnputers and sofáu-are
The online computer system of the L3 apparatus is
sketched in fig. 118 . It is centered on a cluster of DEC
VAX . Three TA78 tape drives, two TA90 cartridge
drives and 10 GB of disks are connected via the 1/O
FASTBUS
From
SPY
I Mu-
Haa Ca
C -Dut
97
QUO
Computer
Dl<,K
SPY
TEC
Tnyger
Compute,
Computer
TAF
MAir,
Online
Host
Computer
DIS .,
'xGf
CONT
Ethernet
Bridge
vmE
to
1
PC
Deleclor Controi
INA-00, IL Cw .b
Saiely
Monitor
Sao-Detector Conau~e ana D~ap~ay
LEP Cenlroi
LEPICS
CERN OnsCumpu1e,s
Run
Atarm
ConUO . Console
Consoio
Ethernet
WpIR
SI . . ion
Histogram ana
Event D "9piay
in-mvIN
W
~TON
Fig. 118 . The L3 online computer system.
server HSC70. The main data acquisition computer is a
VAX 8800. Five smaller VAX devoted to each of the
main detector components and one to monitor the
trigger system are attached to the cluster . These VAX
also form, via Ethernet, a local area VAX cluster
(LAVC) with a number of VAXstations used as intelligent command consoles and as multiwindow graphics
displays . One of the VAXstations is used for the run
control . The slow control data are gathered by a series
of VME crates and PC, which are linked to the cluster
via a second Ethernet .
The online software has been developed using the
MODEL library package developed at CERN . Swung.
stopping, etc ., of both the event data flow and monitoring processes is under operator direction via a master
process running on the ruri control VAXstation . When
the run is active the event data arrive from th-C 30'01 /E
into the CHL A process running on the 8800 transfers
the event out of the 01-11 and into a buffer in the SRO,)
memory . The process then assigns an event number and
finishes the formatting . A subsequent process picks up
ttie event from memory and writes it to the tape in
machine independent format. Concurrently with the
event writing, but at a lower priority, monitoring
processes are reading events out of the memory buffer
on a sampling basis . On the 8800, only those monitoring
tasks which require data from more than one detector
component are performed, including the partial reconstruction of events using the L3 offline software. The
outputs of these tasks are buffered on disk for event
display and for further analysis . A bank of eight VAXsr :a_inns is available for this.
The data for the monitoring and control of individual detector components are acquired by the detector
computers which can access the detector component
data cal a sampling basis. possibly sub;ect to predefined
conditions . While the 8800 receives only the events
accepted by the le\,el 3 trigger, the individual detector
computess can have access to all the events accepted by
B. Adeva et al. / The construction of the L3 experiment
98
the level 1 trigger, ~ynd also during calibration and setup
periods. Each one of these computers has a console
VAXstation running processes for analysis and display
of the data.
The L3 detector is monitored for overall safety and
detector integrity. The LEP General Safety Serv ;ces
microVAX continuously monitors conditions in the experimental area to detect and prevent hazards such as
the accumulation of explosive gases. This microVAX is
linked to the LEP control room via Ethernet, and,
should a dangerous situation begin to develop and not
be responded to, the power to the area is cut. A function of the slow control microVAX is to respond to
these promptings and alert operators to initiate less
drastic responses. These two microVAX are on an uninterruptible power source. Other functions of the programs running on the slow control VAX -tre to ensure
that the data taking conditions are within specified
tolerances and alert the operators should they change.
Should the operators not respond, it can inform devices
controlling other parts of the detector operation. All
these rr- Sages are logged for later investigation.
For precise reconstruction of the events it is also
necessary to set, monitor and record many detector
parameters at a much finer level than that needed for
slow control and safety purposes . This task is distributed (fig. 118) between the PC and VME microprocessors which control the hardware and the VAX
computers. Periodically, or on request, th - microprocessors transfer the current settings to disk files on the
VAX cluster. As a debugging tool . these files can be
immediately dumped to consoles . Periodically, processes on the 8800 pick up this data and format it into
ZEBRA banks and insert it into the event data stream,
from which it is written to tape . An alternate path is to
send these banks ur an Ethernet link to the L3 offline
computer LEPICS, where they are processed for inclusion in the master database. The online copy of the
database is also updated by these processes. This database is used for the event reconstruction and display
mentioned above. Filling it during data taking ensures
that reconstruction results acquired online will be reproducible offline. Another function of the online database
is to allow monitoring of these parameters over time .
The online database has a validity interval reaching
back about one week which allows these parameters and
their correlations to be histogrammed versus time .
13 . LE
NET: L3's intercontinental computer network
13.1 . The origin and evolution
of LEP3NET
L3 recognized in 1981 that completion of the detector and preparation of the data analysis would require a
sophisticated system of computer links between the
members of the Collaboration [68,69]. Prior to data
taking, L3 physicists, enginee-s and technicians in the
US, Europe and Asia would need a means of instant
electronic communication with their colleagues at
CERN and at the collaborating institutions . Because of
the precision and diversity of the L3 detection systems
and the richness of the L3 physics program, the offline
software development task is significantly larger than
for any previous high energy physics experiment, requiring several hundred man years of work . It was therefore
vital to get the means to allow physicists to work
efficiently while at their home sites and to coordinate
with and contribute to the mainstream of software
development work going on at CERN . This led to
LEP3NET: L3's intercontinental computer network.
LEP3NET began in 1982-1983 as a pilot project,
involving links between Caltech, DESY and CERN, for
the MARK J and L3 experiments. The network was
initially based on the public packet switching networks
TELENET (US), DATEX-P (Federal Republic of
Germany) and TELEPAC (Switzerland). Public network usage soon expanded to include links to Michigan,
Amsterdam, Madrid and Aachen . Dedicated links to
Annecy, Lyon, Rome and Naples continued to be used,
with progressive migration (wholly or in part) to X25.
The performance of international links using the
public packet networks was a fraction of the maximum
line speed (typically 4.8 or 9.6 kb/s in 1983) and the
charges for the volume of data sent were quite high . The
fiery fact that charges were volume-sensitive led to the
unacceptable situation that monthly bills could rise to
unpredictable levels . These factors soon made leased
lines the preferred solution . Following a feasibility demonstration using a leased satellite link between Caïtech
and Princeton in 1985-1986, the network became operational on January 30, 1986 when a transatlantic line
was del.vered by AT & T and the Swiss PTT. From
then on, the network lines and switches demonstrated
mean time between failures measured in months and
mean times to repair in hours in most cases.
The current topology of LEP3NET is shown in fig.
119. LEP3NET is widely used by high energy physicists
in the USA and in Europe . Increases in network bandwidth have been achieved through more sophisticated
and expensive modems on the existing LEP3NET lines.
In July 1986, Codex moderrN running at 16 .8 kb/s were
installed on the LEP3i tET transatlantic lines. The
Caltech-MIT and MI"('-LBL links are now running at
19.2 kb/s. The CAMTEC packet switches at CERN
and MIT were upgraded to models capable of switching
packets between lines running at up to 64 kb/s . Most
recently, the presence of the higher speed X25 TELEFILE switches at MIT and CERN, which are key sites
both on LEP3NET and ESNET, has led to the decision
to move some key lines to the faster switches . In September 1988, the speed of the LEP3NET transatlantic
B. .Adeva et al. / The construction of the L3 experiment
99
NIK
Fig . 119 . The LEP3NET and ESNET-X.25 .
line was increased to 56 kb/s . This became economically feasible with the advent of the TAT-8 Transatlantic optical fiber cable.
programming flexibility and proven long term reliability.
13.2. LEP3NET design elements
The facilities offered by LEP3NET are detailed below.
.- account the
:
The design of LEP3NET takes .to
worldwide spread of the Collaboration, the limited
manpower available to construct, develop and maintain
the network and above all the limited budget . Some of
the design elements are:
1) The data communications protocols are based on,
the internationally recognized standard X25, which
sends the data from source to destination in packets,
including information for error checking, and error recovery procedures to ensure that the data is received
error-free. The X25 protocol was chosen for LEP3NET
for a number of compelling reasons. X25 is the onl,
way to reach ma ay of U's European collaborators and
it allows transparent connections tc - established across
combined leased-line and publ: - networks . The X25
protocols are supported, and off-the-shelf interfaces are
provided, by all major computer manufacturers .
2) In order to support the full range of services
needed by the physicis?s, several sets of higher-level
protocols run on top of X25 . This includes DECN ET
and the Coloured Books protocols. The Coloured Books
protocol has been implemented on many machines to
provide a high level user interface on top of the X25
protocol and has particularly valuable features for retries and resumption after interruptions.
3) The data communications equipment is all standard, commercially available. This includes the packet
switches and computer interfaces . The CAMTEC packet
switches were chosen on the bass of performance/cost,
13.3. LEP3NET network services
13 .3 . :. Terminal access to remote computers
Any LEP3NET computer can make terminal calls
directly to any other LEP3NET host . The X25 protocol
avoids the overheads of routing through intermediate
hosts and terrestriad ®4nes. minimizing propagation delays . Except under hen%y load, the switching delays are
still small compared with the cable transit times for
coast-to-coast or transatlantic nulls. Remote we of fullscreen facilities (such as the VAX TPU editor or IBM
VM/CMS) over 11000 miles of LEP3NET cable is
relatively comfortable, even though the 200-ms delay
for remotely echoed characters is quite visible. Wittt the
connection of D's "LEPICS" IBM 3090 to LEP3NET
in February 1988, it became evident that full screen
access to LEPICS, using character by character remote
echoing, often places a heavy load on LEI 3NET. Even
with an unloaded network, propagation delays make
this mode of access slow . A software package supporting IBM "327x" full screen terminal emulation on VAX
a_-- a___TL . . ..~ ,.L . . .,o e,- . --- n
cOMPULCrh LILLJ UCC11 VI71Gi111C11 . A IIG Pa%.1-r,1 aaea:nissaaasse., ae
lo ,-al screen image on the VAX at the user's site mnd
only changes are transmitted to and from the IBM
whenever the "enter" or "attention" key is pressed. The
package also provides extensive support for "key mapping", which is needed to make remote use convenient
on non-IBM remote terminals by emulation of the PF
(permanent function) keys, whose use is an integral part
of working on an IBM VM/CMS computer system .
100
B. Adeua et al. / The construction of the L3 experiment
13.3.2. Electronic mail
Electronic mail over LEP3NET has removed almost
all need for paper mail and the directneEs and speed of
mail exchange has also decreased the need for long
distance phone calls. In many cases, the exchange of
many mail messages within a short time takes the place
of a telephone discussion, with the added advantage of
giving time to think and to formulate ideas clearly. The
electronic mail over LEP3NET has the advantages of
immediacy (in most cases) and reliability . Mail can be
sent to computers which are down for maintenance or
disconnected due to temporary line problems; delivery
of the mail will take place as soon as the connection is
reestablished .
13.3.3. File transfer
The Coloured Rooks file transfer system supports
transfer of programs and binary files between many
types of computers (e .g. VAX, IBM, Gould, ete). The
system offers data compression, automatic re-tries, and
automatic resumption from "marks" after any interruption . File transfer requests are sent to a manager process and control is immediately returned to the user
while the transfer is handled by a background sub-process. These features make it easy to transfer programs
and small data samples of up to a few tens of megabytes . Even though the line bandwidth makes such
transfers last many hours, they can be confidently lelt
to run while other work continues.
13 .3 .4. Decnet
DECNET "data link mapping" circuits have been
established over LEP3NET between Caltech and CERN
and between Farvard and CERN . These circuits link
the European and USA HEP DECNET in a way that is
transparent to most users. In spite of the obvious value
of a link between USA and European HEP, and the
great range of facilities offered by DECNET, L3 itself
continues to use the Coloured Books network software
for most network traffic . The Coloured Books software's
greater immunity to network disturbances, its more
efficient use of the limited bandwidth, and its availability on non-DEC machines, make it the natural choice
for most serious work . Nevertheless, LEP3NET does
not impose a choice of network software. Coloured
Books and DECNET can coexist on the same machines
using the same physical connections .
13 .4 . Examples of LEP3NET usage
Even before the official start of LEP3NET, the
Princeton group, which is responsible for the BGO
electronics and readout, was making heavy use of a
LEP3NET pilot project linking them to CERN via a
Princeton -Caltech satellite link and the Telenet gateway at Caltech. The Princeton group has continued
their heavy network usage which has permitted them to
continue to contribute to the analysis of BGO test beam
data. Network access to the test beam data acquisition
system has proved invaluable for the preparation and
debugging of the system by experts who were usually
not at CERN .
The muon chamber reconstruction software has been
written almost exclusively by people resident in the
USA, but used the latest version of the SIGEL3 L3
Monte Carlo simulation program developed at CERN .
Soon after the startup of LEP3NET, the complete
software base needed to run the Monte Carlo (some 50
MB) was transferred to MIT and regularly updated.
More recently, with the creation of a CERN-based
branch of the muon chamber software group, there has
been a frequent interchange of new software .
Coordination of the L3 computing and software
tusks requires an active involvement in many areas.
Network access is also used for examining and resolving
problems with the network. In addition, specific projects at participating institutions require access to software developed at other institutes in the collaboration .
For example, the Monte Carlo study of light collection
in crystals under calibration by the RFQ system required the collection of software from L3's European
collaborators.
13.5. Future network needs and LEP3NET
The success of LEP3NET in offering a high quality,
general purpose service at a cost comparable to that of
the line rentals has made it an attractive model for the
future of HEP networking in the US . The HEPNET
Technical Coordinating Committee incorporated much
of LEP3NET's experience and design principles in its
recommendations for the ESNET X25 backbone.
In the near future, the main problem of LEP3NET
will be its limited speed. Early analyses of the L3
network needs made in 1984 and 1985 [68,69] showed
that the principal links to CERN should reach speeds in
the range of 224 kb/s soon after LEP startup, rising
above the Mb/s range when LEP Phase I reaches its
design luminosity. These high speeds are primarily
needed to support remote interactive terminal sessions,
rapid transmission of a minute fraction of the data, file
transfer for program development and physics analysis,
along with several other services . Each physics group is
expected to need net;°.,ork access to CEIZN 11'1 the EILÎ.
kb/s range or higher.
This early analysis has since been confirmed by
detailed analyses performed by the HEPNET Review
Committee (HRC) for high energy physics as a whole
[70] . This has led the HRC to recommend provision of
Mb //s speeds on the ESNET backbones used by HEP
by 1989 . NSFNET also has planned links to Europe in
this speed range, although these links will be shared by
B. Adeva et aL / The construction of the L3 experiment
a large, broadly based scientific community. In Europe,
several initiatives which seek to provide 2-Mb/s links to
CERN have been launched, in response to the findings
of study groups on the computing and networking needs
for the LEP experiments [71,721 .
Although it is hoped that some of L3's future high
bandwidth networking needs will be satisfied by the
expansion of "general purpose" network,, such as
ESNET or NSFNET in the US, LEP3NET will continue to be W's primary network for the next few years .
Only LEP3NET will be able to provide the full range of
higher level protocols, rapid interactive access, and
guaranteed bandwidth for L3's highest priority needs .
References
[1] L3 collaboration, Letter of Intent (January 1982);
L3 collaboration, Technical Proposal (May 1983).
[2) D . Lehm, G. Petrucci and G . Stefanini, technical note
ALEPH 87-55, note 87-10 (August 1987).
(3] U . Becker et al ., Nucl. Instr. and Meth . 180 (1981) 61 ;
P . Duinker et al ., Nucl. Instr. and Meth . 201 (1982) 351 .
[41 P. Duinker et al., Nucl . Instr. and Meth . A273 (1988) 814 .
[5) U . Becker et al ., Nucl . Instr . and Meth. 128 (1975) 593 ;
C . Willmott, Nucl . Instr . and Meth . A263 (1988) 10.
(61 W .E. Toth, Prototype octant construction and evaluation
with production phase recommendations, CSDL-R-1885
(1987) unpublished .
[71 N .K . Chnabra and K . Narender, Computerized structure
analysis of the muon octant frame, CSDL-R-2011 (1987)
unpublished .
[8] M .G. Dix et al ., NASA Technical Briefs (1981) 319 .
[91 P.G . Seiler et al ., The Laser Beacon, L3 Muon Chamber
Group Internal Note, 85-4 (1985) unpublished .
[101 H . Anderhub, M . Devereux and P.G . Seiler . Nucl . Instr .
and Meth . 176 (1980) 323 .
III ] J .C . Guv, F . Hartjes and J . Konijn, Nucl . Instr . and Meth .
204 (1982) 77 ;
F . Hartjes and J . Konijn, Nucl. Instr . and Meth . 217
(1983) 311 ;
F . Hartjes, J . Konijn and Y . Peng, Nucl . Instr . and Meth .
A269 (1988) 544 .
[12] P . Rewiersma, NIKHEF-H, Internal note, L3 wire amplifier (1986) unpublished, hybrid made by Philips .
[131 P. Rewiersma, NIKHEF-H, Internal note DISC .DOC27 .03 .87PR, unpublished.
[141 S . Burov et al ., CERN -EP/88-84 .
1151 A . Arefiev et al ., Nucl . Instr. and Meth . A275 (1989) 71 .
(161 A Bobchenko et al., Sov. J . Nucl . 30 (1979) 805 :
S. Denisov et al ., Nucl . Phys . B61 (1973) 62 ;
H
llaby e! at Soy. f_ Nucl . Phys . 13 (1971) 295 :
Yu . Gorin et al ., .nov . J . Nucl . Phys . 18 (1974) 173 .
[171 Yu . Galaktionov et al ., Nucl . Instr . and Meth . A251
(1986) 258 ;
A . Arefiev et al ., Nucl . Instr. and Meth . 285 (1989) 403 .
[181 B. Bleichert et al ., Nucl . instr . and Meth . A254 (1987) 529.
1191 U . Martyn and J .F . Zhou, Nucl . Instr . and Meth . A256
(1987) 143 .
(20] R . D'Alessandro, preprint DFF#72 (1988) :
E . Gallo, preprint DFF#76 (1988) .
[211 M. Bocciolini et al ., Nucl . Instr. and Meth . A257 (1987)
509 .
[221 M . Bocciolini et al ., Nucl . Instr. and Meth . A257 (1988)
548 .
(231 R. Sumner, Nucl . Instr . and Meth . A265 (1988) 252 .
(241 For BGO machining, see :
- M . Lebeau et J .C . Le Marec, Usinage des cristaux de
BGO, LAPP, Dossier ANVAR 2101 (1985) ;
- M . Lebeau et H. Vey, Rodage et polissage des cristaux
de BGO, LAPP, Rapport interne 19/02/85 ;
- M . Lebeau, Recherche fondamentale et transfert technologique : une collaboration LAPP (Annecy)-SIC
(Shanghai), Rev . Technique APAVE 236 (1986) 67.
[251 M . Schneegans, Nucl . Instr. and Meth. A257 (1987) 528,
and, Test and preparation of BGO crystals for the L3
calorimeter, to be submitted to Nucl . lnstr . and Meth .
[261 C. Laviron and P. Lecoq, CERN report L3-416, (1986) .
[271 M . Lebeau, LAPP report 1-3-584 (1986) .
[28] M . Chemarin, IPN Lyon, CERN'-1-3-394 (1985) ;
M . Chemarin and M . El Kacimi, CERN-1-3/88-621
(1988).
[291 EUCLID : a computer aided design software from
MATRA-DATAVISION-France.
[301 Technical specification LAPP (April 5, 1985) ;
Selected company : Elicotteri Meridionali, Centro Compositi Sud, Gruppo Agusta Frosinone, Italy ;
CERN contract LB/CR/987 (June 6, 1987) .
1311 M . Lebeau, J . Mater. Sci . Lett . 4 (1985) 779.
[32] Finite Element Calculation code MODULEF developed
by INRIA-France .
[331 Diodes for the L3 BGO Calorimeter : Quality tests and
mouniine . PITHA 88/21 .
(341 M . Goyot, B . Ille, P . Lebrun, J .P . Martin, Nuel . Insu . and
Meth . A263 (1988) 180 .
[351 M . Bosteels, t.EP/IM/MB/Y N (1985) .
[361 Roll-bound Aluminum inflated cooling panels hot-rolled
by ALLAN SPA, Milano, Italy .
(371 J .A . lakken et at . . CERN- EP/89-16 :
P.E . Kaaret . th:--sis, Princeton University (1989), ref.
DoE/ER/3(,7~,' :i0 .
[38) J .A . Bakken et al ., Nucl . Instr . and Meth . A275 (1989) 81 .
[391 B. Borgia et al ., Internal Report Dept. di Fisica, Università di Roma "La Sapienza" 925 (1988) and Nuel.
Instr. and Myth . A278 (1989) 699 .
[401 J .A . Bakken et al ., Nucl . Instr . and Meth . A270 (1988)
397 .
[411 C:. Rippich, "Monte Carlo Results for the L3 Luminosity
Monitor", (1984) and L3 Technical Proposal (1983) chap .
9.
[421 C . Rippich, CMU-HEP 86-14 (1986) (this reference deals
with an earlier version of the monitor design) .
[431 G . Von Holtey . CERN yellow report 89-06, vol . 2 . p . 896 .
[441 J .F. Cra'Aford et cil . . Nucl . lnstr . and Meth . 127 (1975)
173 .
[451 F .A . Berends and R . Kleiss, Ttlucl . Phys . B228 (1983) 537 .
1461 H . Anderhub et ai ., Nucl . Instr . and Meth . A252 (1986)
357 .
[471 H . Anderhub et al ., Nucl . Insu . and Meth . A263 (1988) 1 .
102
B. Adeva et al. / The construction of the L3 experiment
[48] H. Anderhub et al ., Nucl . Instr. and Meth . A265 (1988)
50 .
[49] A. B6hm et al ., Nucl . Instr. and Meth. A273 (1988) 471.
[50] U. R6ser et al ., A shaping amplifier for high resolution
drift chambers operated at low drift velocity with Flash
ADC readout, in preparation .
[51] H. Akbari et al., Multianode readout of scintillating fibers
for L3 Veriex Chamber calibration, to be published in
Proc . Scintillating Fiber Workshop at Fermilab, 1988 .
[52] H. Akbari et al ., Performance of the multianode readout
of scintillating fibers used for calibration of the L3 vertex
chamb, , in preparation.
[53] G. Viertel, Research and Development on Time Expansion Chambers, Invited Talk given at the Int. Symp. on
Position Sensitive Detectors in High Energy Physics,
Dubna, USSR, 1987 .
[54] K. Deiters, The Z detector of the L3 experiment, ibid .
[55] W. Friebel et al ., PHE 87-08, Zeuthen (1987).
[56] H. Muller and R. Vachon CERN EP, Electronics Note
85-02.
1 :)7) L, Pregemig, The Block Mover, presented at the 1985
IEEE Nuclear Science Symposium, San Francisco, CA,
USA.
[58] H. Muller, C.M . Story and S. Falciano, CERN-EP Electronics Note 87-04.
[59] F. Cesaroni, S. Di Marco, E. Gennari and S. Gentile Nucl .
Instr. and Meth. A260 (1987) 425.
[60] LAPP/SCAIME~ Ecline Driver User's Manual, Technical
report.
[61] F. Cesaroni, E. Gennari, S. Gentile and P. Pacchiarotti,
Nucl . Instr. and Meth. A260 (1987) 546.
[62] M. Bourquin et al ., Charged particle trigger for the L3
experiment, Proc . Int. Conf. on the Impact of Digital
Microelectronics and Microprocessors on Particle Physics,
ICTP, Trieste, 1988.
[63] A. Boehm et al ., Nucl . Instr. and Meth . A273 (1988) 4712.
[64] J. Lecoq, M. Moynot and G. Perrot, F-682B Multi-port
Multi-event Buffer (MMB), LAPP Internal Report
23.01.85 revised 10.04.87.
[65] T. Lingjaerde, Proc . Topical Conf. on the Application of
Microprocessors to High Energy Physics Experiments
(1981) CERN, Geneva, CERN report 81-07.
[66] J. Lecoq, M. Moynot, G. Perrot, P. Baehler and C. Ljuslin, Proc. Fastbus Software Workshop (1985) CERN,
Geneva, CERN Report 85-15.
[67] G. Perrot, XFMI/XFSI Specifications, LAPP Technical
Document, revised 1987.
[68] H. Newman, Caltech DoE and NSF Research Proposal
CALT-68-1109 (1984).
[69] R. Mount, L3 Technical Note No. 351 (1985) .
[70] High Energy Physics Computer Networking, Report of
the HEFNET Review Committee (1988) .
[71] D. Williams (ed), The Computing Needs of the LEP
Experiments (the MUSCLE Report), CERN '1D and EP
Divisions (1988).
[72] D. Williams (ed.), Green Book II Study: ~_omputing for
Experiments, CERN, (1988) .