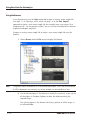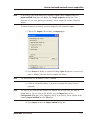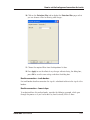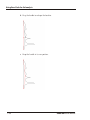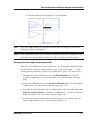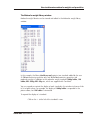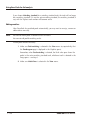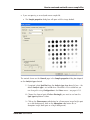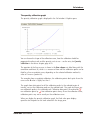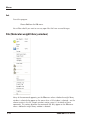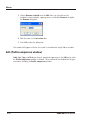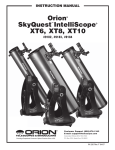
1
GeneTools
Reference
Although all possible care has been taken in the preparation of this publication,
Synoptics Limited accepts no liability for any inaccuracies that may be found.
Synoptics Limited reserves the right to make changes without notice both to this
publication and to the product that it describes.
No part of this publication may be reproduced, stored in a retrieval system or
transmitted in any form or by any means electronic, mechanical, photocopying,
recording or otherwise without the prior permission of the copyright owner.
Version 08-3d.3.SynGene
© Synoptics Limited 2000–2008
Synoptics Ltd
Beacon House, Nuffield Road
Cambridge, CB4 1TF, UK
Tel: +44 (0)1223 727100
Fax: +44 (0)1223 727101
Email: [email protected]
Internet: www.synoptics.co.uk
Contents
Using GeneTools for Gel analysis
1
How to create and work with secure sample files . . . . . . . . . . . . . . . . . . 1-1
File formats . . . . . . . . . . . . . . . . . . . . . . . . . . . . . . . . 1-1
Opening a secure sample file . . . . . . . . . . . . . . . . . . . . . . . . 1-2
Creating a new secure sample file . . . . . . . . . . . . . . . . . . . . . . 1-11
Using the Browser . . . . . . . . . . . . . . . . . . . . . . . . . . . . . 1-12
Acquiring an image to create a secure sample file . . . . . . . . . . . . . . . 1-13
Importing settings from existing secure Gel sample files . . . . . . . . . . . . 1-14
Editing sample properties . . . . . . . . . . . . . . . . . . . . . . . . . . 1-20
Saving a secure sample file . . . . . . . . . . . . . . . . . . . . . . . . . 1-20
How to place, position and work with tracks . . . . . . . . . . . . . . . . . . . 1-22
Overview . . . . . . . . . . . . . . . . . . . . . . . . . . . . . . . . . 1-22
Locating tracks automatically . . . . . . . . . . . . . . . . . . . . . . . . 1-24
Locking tracks . . . . . . . . . . . . . . . . . . . . . . . . . . . . . . . 1-25
Placing individual tracks on a sample . . . . . . . . . . . . . . . . . . . . 1-26
Deleting tracks . . . . . . . . . . . . . . . . . . . . . . . . . . . . . . 1-30
Adjusting the overall position of the tracks on a sample . . . . . . . . . . . . 1-30
Adjusting the track splay . . . . . . . . . . . . . . . . . . . . . . . . . . 1-32
Moving and tilting a single track . . . . . . . . . . . . . . . . . . . . . . . 1-35
Adjusting track width . . . . . . . . . . . . . . . . . . . . . . . . . . . 1-40
Adjusting the Rf start and end lines . . . . . . . . . . . . . . . . . . . . . 1-43
Enabling and disabling tracks . . . . . . . . . . . . . . . . . . . . . . . . 1-47
Adding a description for a track . . . . . . . . . . . . . . . . . . . . . . . 1-47
Displaying track properties . . . . . . . . . . . . . . . . . . . . . . . . . 1-49
How to set the background correction for tracks . . . . . . . . . . . . . . . . . 1-51
Setting the integration parameters . . . . . . . . . . . . . . . . . . . . . . 1-51
Setting or changing a manual baseline . . . . . . . . . . . . . . . . . . . . 1-56
Deleting a manual baseline . . . . . . . . . . . . . . . . . . . . . . . . . 1-59
How to locate and edit peaks on a track . . . . . . . . . . . . . . . . . . . . . 1-59
Locating the peaks on a track automatically . . . . . . . . . . . . . . . . . 1-60
GeneTools User Manual
Contents-1
Contents
Adding a peak semi-automatically . . . . . . . . . . . . . . . . . . . . . . 1-61
Adding a peak manually . . . . . . . . . . . . . . . . . . . . . . . . . . 1-63
Selecting peaks . . . . . . . . . . . . . . . . . . . . . . . . . . . . . . 1-64
Deleting peaks . . . . . . . . . . . . . . . . . . . . . . . . . . . . . . 1-67
Adjusting the position of a peak . . . . . . . . . . . . . . . . . . . . . . . 1-68
Adjusting the position of a peak’s bounds . . . . . . . . . . . . . . . . . . 1-70
Displaying peak properties . . . . . . . . . . . . . . . . . . . . . . . . . 1-71
How to determine molecular weights and quantities . . . . . . . . . . . . . . . . 1-72
Setting the quantity calibration method . . . . . . . . . . . . . . . . . . . 1-73
Specifying how molecular weights are calculated from standard tracks . . . . . 1-75
Creating quantity calibrations without using standard tracks . . . . . . . . . . 1-76
Determining molecular weights/quantities using standard tracks. . . . . . . . . 1-79
Removing molecular weight and quantity assignments from peaks . . . . . . . 1-84
Reassigning molecular weights/quantities in a standard track . . . . . . . . . . 1-85
Viewing molecular weight and quantity results . . . . . . . . . . . . . . . . 1-87
Working with molecular weight libraries . . . . . . . . . . . . . . . . . . . 1-92
How to match peaks on different tracks . . . . . . . . . . . . . . . . . . . . . 1-105
Setting the method and parameters used for matching . . . . . . . . . . . . 1-107
Setting a matching standard . . . . . . . . . . . . . . . . . . . . . . . . 1-109
Editing matches . . . . . . . . . . . . . . . . . . . . . . . . . . . . . 1-110
Viewing match results . . . . . . . . . . . . . . . . . . . . . . . . . . . 1-112
Dendrogram . . . . . . . . . . . . . . . . . . . . . . . . . . . . . . . 1-115
How to compare peak profiles . . . . . . . . . . . . . . . . . . . . . . . . . 1-117
Changing the scale in the Profile comparison window . . . . . . . . . . . . 1-123
Matching tracks in the Profile comparison window . . . . . . . . . . . . . . 1-123
How to print and export Gel results . . . . . . . . . . . . . . . . . . . . . . 1-127
Printing a report showing Gel results . . . . . . . . . . . . . . . . . . . . 1-127
Printing reports – Profile comparisons. . . . . . . . . . . . . . . . . . . . 1-129
Exporting results to Excel . . . . . . . . . . . . . . . . . . . . . . . . . 1-130
Saving results in a comma separated values format file . . . . . . . . . . . . 1-131
Creating a report in Word . . . . . . . . . . . . . . . . . . . . . . . . . 1-132
Copying a picture of an image to the clipboard . . . . . . . . . . . . . . . 1-133
Contents-2
GeneTools User Manual
Contents
Using GeneTools for High Throughput Gel analysis
2
Using GeneTools for Manual band quantification
3
Using GeneTools for Spot blot analysis
4
How to create and work with secure sample files . . . . . . . . . . . . . . . . . . 4-1
Opening a secure sample file . . . . . . . . . . . . . . . . . . . . . . . . 4-2
Creating a new secure sample file . . . . . . . . . . . . . . . . . . . . . . 4-6
Using the Browser . . . . . . . . . . . . . . . . . . . . . . . . . . . . . 4-7
Acquiring an image to create a secure sample file . . . . . . . . . . . . . . . 4-8
Importing settings from existing secure Spot blot sample files . . . . . . . . . . 4-9
Importing settings from a saved sample file . . . . . . . . . . . . . . . . . . 4-14
Editing sample properties . . . . . . . . . . . . . . . . . . . . . . . . . . 4-15
Saving a secure sample file . . . . . . . . . . . . . . . . . . . . . . . . . 4-15
How to add and remove spot frames. . . . . . . . . . . . . . . . . . . . . . . 4-16
Adding spot frames automatically . . . . . . . . . . . . . . . . . . . . . . 4-16
Adding new spot frames . . . . . . . . . . . . . . . . . . . . . . . . . . 4-18
Removing spot frames . . . . . . . . . . . . . . . . . . . . . . . . . . . 4-21
How to adjust the size and shape of spot frames . . . . . . . . . . . . . . . . . 4-21
Setting the size of all spot frames to the same size and shape . . . . . . . . . 4-21
Changing between circular and rectangular spot frames . . . . . . . . . . . . 4-22
Adjusting the size of circular spot frames . . . . . . . . . . . . . . . . . . . 4-22
Adjusting the size and shape of rectangular spot frames . . . . . . . . . . . . 4-24
How to adjust the spot frame positions . . . . . . . . . . . . . . . . . . . . . . 4-26
Adjusting the position of a single spot frame . . . . . . . . . . . . . . . . . 4-26
Adjusting the positions of all the spot frames in a grid . . . . . . . . . . . . . 4-26
How to lock the spot frames on a sample . . . . . . . . . . . . . . . . . . . . 4-32
How to show or hide identification labels on the spot frames . . . . . . . . . . . . 4-32
How to set the quantity calibration method . . . . . . . . . . . . . . . . . . . . 4-33
How to assign quantities to spot frames . . . . . . . . . . . . . . . . . . . . . 4-34
How to apply background correction to results . . . . . . . . . . . . . . . . . . 4-35
How to view Spot blot results . . . . . . . . . . . . . . . . . . . . . . . . . . 4-37
How to define an incidence condition . . . . . . . . . . . . . . . . . . . . . . 4-39
How to print and export Spot blot results. . . . . . . . . . . . . . . . . . . . . 4-41
Printing Spot blot results . . . . . . . . . . . . . . . . . . . . . . . . . . 4-41
Exporting Spot blot results to Excel . . . . . . . . . . . . . . . . . . . . . 4-42
Saving results in a comma separated values format file . . . . . . . . . . . . 4-43
GeneTools User Manual
Contents-3
Contents
Copying a picture of an image to the clipboard . . . . . . . . . . . . . . . . 4-44
Using GeneTools to count colonies
5
Windows
6
Gel windows . . . . . . . . . . . . . . . . . . . . . . . . . . . . . . . . . . 6-2
Adjusting the panes in a Gel window . . . . . . . . . . . . . . . . . . . . . 6-3
Track label pane . . . . . . . . . . . . . . . . . . . . . . . . . . . . . . 6-3
Description pane . . . . . . . . . . . . . . . . . . . . . . . . . . . . . . 6-4
Image pane . . . . . . . . . . . . . . . . . . . . . . . . . . . . . . . . 6-4
Profile pane . . . . . . . . . . . . . . . . . . . . . . . . . . . . . . . . 6-6
Peak value pane . . . . . . . . . . . . . . . . . . . . . . . . . . . . . . 6-6
Graphics pane . . . . . . . . . . . . . . . . . . . . . . . . . . . . . . . 6-7
Results pane . . . . . . . . . . . . . . . . . . . . . . . . . . . . . . . 6-14
Molecular weight library window . . . . . . . . . . . . . . . . . . . . . . . . 6-17
Profile comparison window . . . . . . . . . . . . . . . . . . . . . . . . . . . 6-18
Viewing tracks. . . . . . . . . . . . . . . . . . . . . . . . . . . . . . . 6-20
Selecting tracks for a comparison . . . . . . . . . . . . . . . . . . . . . . 6-20
Viewing profiles . . . . . . . . . . . . . . . . . . . . . . . . . . . . . . 6-21
Setting a reference track . . . . . . . . . . . . . . . . . . . . . . . . . . 6-22
Matching tracks in the Profile comparison window . . . . . . . . . . . . . . 6-23
Other Profile comparison window operations. . . . . . . . . . . . . . . . . 6-25
Colony counting window . . . . . . . . . . . . . . . . . . . . . . . . . . . . 6-26
Spot blot/Manual band quantification window . . . . . . . . . . . . . . . . . . 6-28
Image pane . . . . . . . . . . . . . . . . . . . . . . . . . . . . . . . . 6-29
Results/Incidence/Calibration graph pane . . . . . . . . . . . . . . . . . . . 6-31
Image controls . . . . . . . . . . . . . . . . . . . . . . . . . . . . . . . . . 6-33
The Histogram viewer . . . . . . . . . . . . . . . . . . . . . . . . . . . 6-34
Toolbars
The Standard toolbar .
Open . . . . . .
Save. . . . . . .
Help . . . . . .
Sample properties
Report toolbar . . . .
Report setup . . .
Contents-4
7
.
.
.
.
.
.
.
.
.
.
.
.
.
.
.
.
.
.
.
.
.
.
.
.
.
.
.
.
.
.
.
.
.
.
.
.
.
.
.
.
.
.
.
.
.
.
.
.
.
.
.
.
.
.
.
.
.
.
.
.
.
.
.
.
.
.
.
.
.
.
.
.
.
.
.
.
.
.
.
.
.
.
.
.
.
.
.
.
.
.
.
.
.
.
.
.
.
.
.
.
.
.
.
.
.
.
.
.
.
.
.
.
.
.
.
.
.
.
.
.
.
.
.
.
.
.
.
.
.
.
.
.
.
.
.
.
.
.
.
.
.
.
.
.
.
.
.
.
.
.
.
.
.
.
.
.
.
.
.
.
.
.
.
.
.
.
.
.
.
.
.
.
.
.
.
.
.
.
.
.
.
.
.
.
.
.
.
.
.
.
.
.
.
.
.
.
.
.
.
.
.
.
.
7-1
7-1
7-1
7-2
7-2
7-2
7-2
GeneTools User Manual
Contents
Preview . . . . . . . . . . . . . . . . . . . . . . . . . . . . . . . . . . 7-2
Print. . . . . . . . . . . . . . . . . . . . . . . . . . . . . . . . . . . . 7-3
Export table to Excel . . . . . . . . . . . . . . . . . . . . . . . . . . . . 7-3
Save table to CSV file . . . . . . . . . . . . . . . . . . . . . . . . . . . . 7-3
Export to Word . . . . . . . . . . . . . . . . . . . . . . . . . . . . . . . 7-3
Save to clipboard . . . . . . . . . . . . . . . . . . . . . . . . . . . . . . 7-3
Track toolbar . . . . . . . . . . . . . . . . . . . . . . . . . . . . . . . . . . 7-4
Locate tracks . . . . . . . . . . . . . . . . . . . . . . . . . . . . . . . . 7-4
Lock all . . . . . . . . . . . . . . . . . . . . . . . . . . . . . . . . . . 7-4
Position all . . . . . . . . . . . . . . . . . . . . . . . . . . . . . . . . . 7-4
Splay all . . . . . . . . . . . . . . . . . . . . . . . . . . . . . . . . . . 7-5
Move/tilt . . . . . . . . . . . . . . . . . . . . . . . . . . . . . . . . . . 7-5
Width . . . . . . . . . . . . . . . . . . . . . . . . . . . . . . . . . . . 7-5
Rf start position. . . . . . . . . . . . . . . . . . . . . . . . . . . . . . . 7-5
Rf end position . . . . . . . . . . . . . . . . . . . . . . . . . . . . . . . 7-5
Zoom toolbar . . . . . . . . . . . . . . . . . . . . . . . . . . . . . . . . . . 7-6
Zoom in . . . . . . . . . . . . . . . . . . . . . . . . . . . . . . . . . . 7-6
Zoom out . . . . . . . . . . . . . . . . . . . . . . . . . . . . . . . . . 7-6
Zoom reset . . . . . . . . . . . . . . . . . . . . . . . . . . . . . . . . 7-6
Calibrations toolbar . . . . . . . . . . . . . . . . . . . . . . . . . . . . . . . 7-7
Integration parameters . . . . . . . . . . . . . . . . . . . . . . . . . . . 7-7
Quantity calibration . . . . . . . . . . . . . . . . . . . . . . . . . . . . . 7-7
Assign quantity . . . . . . . . . . . . . . . . . . . . . . . . . . . . . . . 7-7
Molecular weight calibration . . . . . . . . . . . . . . . . . . . . . . . . . 7-7
MW/quantity standard. . . . . . . . . . . . . . . . . . . . . . . . . . . . 7-8
Profile comparison window . . . . . . . . . . . . . . . . . . . . . . . . . 7-8
Database toolbar . . . . . . . . . . . . . . . . . . . . . . . . . . . . . . . . 7-8
Archive gel to database . . . . . . . . . . . . . . . . . . . . . . . . . . . 7-8
Open GeneDirectory . . . . . . . . . . . . . . . . . . . . . . . . . . . . 7-9
Connect to database . . . . . . . . . . . . . . . . . . . . . . . . . . . . 7-9
Peak matching toolbar . . . . . . . . . . . . . . . . . . . . . . . . . . . . . . 7-9
Band matching . . . . . . . . . . . . . . . . . . . . . . . . . . . . . . . 7-9
Matching standard . . . . . . . . . . . . . . . . . . . . . . . . . . . . . 7-10
Spot blot toolbar . . . . . . . . . . . . . . . . . . . . . . . . . . . . . . . . 7-10
All spots same size . . . . . . . . . . . . . . . . . . . . . . . . . . . . . 7-10
Position control points . . . . . . . . . . . . . . . . . . . . . . . . . . . 7-10
Locate . . . . . . . . . . . . . . . . . . . . . . . . . . . . . . . . . . 7-11
Position any spot . . . . . . . . . . . . . . . . . . . . . . . . . . . . . 7-11
GeneTools User Manual
Contents-5
Contents
Background correction . . . . .
Lock position . . . . . . . . .
Spot incidence parameters . . .
Circle . . . . . . . . . . . .
Rectangle . . . . . . . . . . .
Free hand. . . . . . . . . . .
Quantity calibration parameters .
Assign quantity . . . . . . . .
Menus
.
.
.
.
.
.
.
.
.
.
.
.
.
.
.
.
.
.
.
.
.
.
.
.
.
.
.
.
.
.
.
.
.
.
.
.
.
.
.
.
.
.
.
.
.
.
.
.
.
.
.
.
.
.
.
.
.
.
.
.
.
.
.
.
.
.
.
.
.
.
.
.
.
.
.
.
.
.
.
.
.
.
.
.
.
.
.
.
.
.
.
.
.
.
.
.
.
.
.
.
.
.
.
.
.
.
.
.
.
.
.
.
.
.
.
.
.
.
.
.
.
.
.
.
.
.
.
.
.
.
.
.
.
.
.
.
.
.
.
.
.
.
.
.
.
.
.
.
.
.
.
.
.
.
.
.
.
.
.
.
.
.
.
.
.
.
.
.
.
.
.
.
.
.
.
.
7-11
7-11
7-11
7-12
7-12
7-12
7-12
7-12
8
File (Sample and Profile comparison windows) . . . . . . . . . . . . . . . . . . . 8-1
New (Import). . . . . . . . . . . . . . . . . . . . . . . . . . . . . . . . 8-2
Open . . . . . . . . . . . . . . . . . . . . . . . . . . . . . . . . . . . 8-8
Browse . . . . . . . . . . . . . . . . . . . . . . . . . . . . . . . . . . 8-9
Close. . . . . . . . . . . . . . . . . . . . . . . . . . . . . . . . . . . 8-11
Save . . . . . . . . . . . . . . . . . . . . . . . . . . . . . . . . . . . 8-11
Save as . . . . . . . . . . . . . . . . . . . . . . . . . . . . . . . . . . 8-11
Select Source (Twain) . . . . . . . . . . . . . . . . . . . . . . . . . . . 8-12
Acquire (Twain) . . . . . . . . . . . . . . . . . . . . . . . . . . . . . . 8-13
New library . . . . . . . . . . . . . . . . . . . . . . . . . . . . . . . . 8-13
Open library . . . . . . . . . . . . . . . . . . . . . . . . . . . . . . . 8-14
Import method . . . . . . . . . . . . . . . . . . . . . . . . . . . . . . 8-15
Export table to Excel . . . . . . . . . . . . . . . . . . . . . . . . . . . . 8-16
Save table to CSV file . . . . . . . . . . . . . . . . . . . . . . . . . . . 8-17
Export to Word . . . . . . . . . . . . . . . . . . . . . . . . . . . . . . 8-18
Save to clipboard . . . . . . . . . . . . . . . . . . . . . . . . . . . . . 8-19
Printer setup . . . . . . . . . . . . . . . . . . . . . . . . . . . . . . . 8-19
Report setup . . . . . . . . . . . . . . . . . . . . . . . . . . . . . . . 8-20
Print preview . . . . . . . . . . . . . . . . . . . . . . . . . . . . . . . 8-26
Print . . . . . . . . . . . . . . . . . . . . . . . . . . . . . . . . . . . 8-27
Recently opened files . . . . . . . . . . . . . . . . . . . . . . . . . . . 8-28
Sample properties . . . . . . . . . . . . . . . . . . . . . . . . . . . . . 8-28
Exit . . . . . . . . . . . . . . . . . . . . . . . . . . . . . . . . . . . 8-40
File (Molecular weight library window) . . . . . . . . . . . . . . . . . . . . . . 8-40
Unlock . . . . . . . . . . . . . . . . . . . . . . . . . . . . . . . . . . 8-41
Lock . . . . . . . . . . . . . . . . . . . . . . . . . . . . . . . . . . . 8-41
Change password . . . . . . . . . . . . . . . . . . . . . . . . . . . . . 8-42
Contents-6
GeneTools User Manual
Contents
Properties. . . . . . . . . . . . . . . . . .
Edit (Gel window) . . . . . . . . . . . . . . . .
Integration parameters . . . . . . . . . . . .
Molecular weight calibration . . . . . . . . .
Quantity calibration . . . . . . . . . . . . .
Band matching . . . . . . . . . . . . . . .
Edit (Spot blot/Manual band quantification window) .
Quantity calibration . . . . . . . . . . . . .
Edit (Colony counting window) . . . . . . . . . .
Edit (Molecular weight library window) . . . . . . .
New standard . . . . . . . . . . . . . . . .
Edit standard . . . . . . . . . . . . . . . .
Delete standard . . . . . . . . . . . . . . .
Rename standard . . . . . . . . . . . . . .
Edit (Profile comparison window) . . . . . . . . .
View (Gel window) . . . . . . . . . . . . . . . .
Profile comparison. . . . . . . . . . . . . .
Histogram . . . . . . . . . . . . . . . . .
Zoom in . . . . . . . . . . . . . . . . . .
Zoom out. . . . . . . . . . . . . . . . . .
Zoom reset . . . . . . . . . . . . . . . . .
Align banks of tracks . . . . . . . . . . . . .
Display corrected profiles. . . . . . . . . . .
Peak markers . . . . . . . . . . . . . . . .
Peak bounds . . . . . . . . . . . . . . . .
Tracks . . . . . . . . . . . . . . . . . . .
Match lines . . . . . . . . . . . . . . . . .
Peak numbers only . . . . . . . . . . . . .
Molecular weight . . . . . . . . . . . . . .
Quantities . . . . . . . . . . . . . . . . .
Matching . . . . . . . . . . . . . . . . . .
Maximize pane . . . . . . . . . . . . . . .
Toolbars submenu . . . . . . . . . . . . . .
Toolbar buttons on menus . . . . . . . . . .
Status bar . . . . . . . . . . . . . . . . . .
View (Spot blot/Manual band quantification window)
Spot numbers . . . . . . . . . . . . . . . .
View (Colony counting window) . . . . . . . . . .
GeneTools User Manual
.
.
.
.
.
.
.
.
.
.
.
.
.
.
.
.
.
.
.
.
.
.
.
.
.
.
.
.
.
.
.
.
.
.
.
.
.
.
.
.
.
.
.
.
.
.
.
.
.
.
.
.
.
.
.
.
.
.
.
.
.
.
.
.
.
.
.
.
.
.
.
.
.
.
.
.
.
.
.
.
.
.
.
.
.
.
.
.
.
.
.
.
.
.
.
.
.
.
.
.
.
.
.
.
.
.
.
.
.
.
.
.
.
.
.
.
.
.
.
.
.
.
.
.
.
.
.
.
.
.
.
.
.
.
.
.
.
.
.
.
.
.
.
.
.
.
.
.
.
.
.
.
.
.
.
.
.
.
.
.
.
.
.
.
.
.
.
.
.
.
.
.
.
.
.
.
.
.
.
.
.
.
.
.
.
.
.
.
.
.
.
.
.
.
.
.
.
.
.
.
.
.
.
.
.
.
.
.
.
.
.
.
.
.
.
.
.
.
.
.
.
.
.
.
.
.
.
.
.
.
.
.
.
.
.
.
.
.
.
.
.
.
.
.
.
.
.
.
.
.
.
.
.
.
.
.
.
.
.
.
.
.
.
.
.
.
.
.
.
.
.
.
.
.
.
.
.
.
.
.
.
.
.
.
.
.
.
.
.
.
.
.
.
.
.
.
.
.
.
.
.
.
.
.
.
.
.
.
.
.
.
.
.
.
.
.
.
.
.
.
.
.
.
.
.
.
.
.
.
.
.
.
.
.
.
.
.
.
.
.
.
.
.
.
.
.
.
.
.
.
.
.
.
.
.
.
.
.
.
.
.
.
.
.
.
.
.
.
.
.
.
.
.
.
.
.
.
.
.
.
.
.
.
.
.
.
.
.
.
.
.
.
.
.
.
.
.
.
.
.
.
.
.
.
.
.
.
.
.
.
.
.
.
.
.
.
.
.
.
.
.
.
.
.
.
.
.
.
.
.
.
.
.
.
.
.
.
.
.
.
.
.
.
.
.
.
.
.
.
.
.
.
.
.
.
.
.
.
.
.
.
.
.
.
.
.
.
.
.
.
.
.
.
.
.
.
.
.
.
.
.
.
.
.
.
.
.
.
.
.
.
.
.
.
.
.
.
.
.
.
.
.
.
.
.
.
.
.
.
.
.
.
.
.
.
.
.
.
.
.
.
.
.
.
.
.
.
.
.
.
.
.
.
.
.
.
.
.
.
.
.
.
.
.
.
.
.
.
.
.
.
.
.
.
.
.
.
.
.
.
.
.
.
.
.
.
.
.
.
.
8-43
8-44
8-45
8-50
8-52
8-53
8-56
8-56
8-57
8-57
8-57
8-59
8-61
8-61
8-62
8-63
8-63
8-64
8-64
8-64
8-64
8-65
8-65
8-65
8-66
8-66
8-66
8-67
8-67
8-67
8-67
8-68
8-68
8-69
8-69
8-69
8-70
8-70
Contents-7
Contents
View (Profile comparison window) . . . . . . . . . . . . . . . . . . . . . . . . 8-70
Plot mode submenu . . . . . . . . . . . . . . . . . . . . . . . . . . . . 8-71
View (Molecular weight library window) . . . . . . . . . . . . . . . . . . . . . 8-71
Track . . . . . . . . . . . . . . . . . . . . . . . . . . . . . . . . . . . . . 8-72
Locate tracks . . . . . . . . . . . . . . . . . . . . . . . . . . . . . . . 8-73
Width individual. . . . . . . . . . . . . . . . . . . . . . . . . . . . . . 8-73
Height individual . . . . . . . . . . . . . . . . . . . . . . . . . . . . . 8-73
Lock all. . . . . . . . . . . . . . . . . . . . . . . . . . . . . . . . . . 8-74
Position all . . . . . . . . . . . . . . . . . . . . . . . . . . . . . . . . 8-74
Splay all . . . . . . . . . . . . . . . . . . . . . . . . . . . . . . . . . 8-76
Move/tilt . . . . . . . . . . . . . . . . . . . . . . . . . . . . . . . . . 8-78
Width . . . . . . . . . . . . . . . . . . . . . . . . . . . . . . . . . . 8-84
Rf start position . . . . . . . . . . . . . . . . . . . . . . . . . . . . . . 8-86
Rf end position . . . . . . . . . . . . . . . . . . . . . . . . . . . . . . 8-86
Invert profile . . . . . . . . . . . . . . . . . . . . . . . . . . . . . . . 8-90
Edit manual baseline . . . . . . . . . . . . . . . . . . . . . . . . . . . . 8-90
Delete manual baseline . . . . . . . . . . . . . . . . . . . . . . . . . . 8-94
MW/quantity standard . . . . . . . . . . . . . . . . . . . . . . . . . . . 8-94
Matching standard . . . . . . . . . . . . . . . . . . . . . . . . . . . . . 8-95
Insert. . . . . . . . . . . . . . . . . . . . . . . . . . . . . . . . . . . 8-96
Delete . . . . . . . . . . . . . . . . . . . . . . . . . . . . . . . . . . 8-99
Enable . . . . . . . . . . . . . . . . . . . . . . . . . . . . . . . . . 8-100
Disable . . . . . . . . . . . . . . . . . . . . . . . . . . . . . . . . . 8-100
Copy to clipboard . . . . . . . . . . . . . . . . . . . . . . . . . . . . 8-100
Description . . . . . . . . . . . . . . . . . . . . . . . . . . . . . . . 8-100
Properties . . . . . . . . . . . . . . . . . . . . . . . . . . . . . . . . 8-102
Peak . . . . . . . . . . . . . . . . . . . . . . . . . . . . . . . . . . . . . 8-104
Assign molecular weight. . . . . . . . . . . . . . . . . . . . . . . . . . 8-104
Assign quantity . . . . . . . . . . . . . . . . . . . . . . . . . . . . . . 8-110
Unassign molecular weight . . . . . . . . . . . . . . . . . . . . . . . . 8-112
Unassign quantity . . . . . . . . . . . . . . . . . . . . . . . . . . . . 8-112
Locate submenu . . . . . . . . . . . . . . . . . . . . . . . . . . . . . 8-113
Delete submenu . . . . . . . . . . . . . . . . . . . . . . . . . . . . . 8-113
Match submenu . . . . . . . . . . . . . . . . . . . . . . . . . . . . . 8-114
Properties . . . . . . . . . . . . . . . . . . . . . . . . . . . . . . . . 8-114
Profile . . . . . . . . . . . . . . . . . . . . . . . . . . . . . . . . . . . . 8-114
Reference . . . . . . . . . . . . . . . . . . . . . . . . . . . . . . . . 8-115
Show . . . . . . . . . . . . . . . . . . . . . . . . . . . . . . . . . . 8-115
Contents-8
GeneTools User Manual
Contents
Show all . . . . . . . . .
Hide all . . . . . . . . .
Include in matching . . .
Export to Excel . . . . . .
Properties . . . . . . . .
Matching. . . . . . . . . . .
Parameters. . . . . . . .
Include all . . . . . . .
Exclude all from matching
Database menu . . . . . . . .
Archive gel to database . .
Open GeneDirectory . . .
Connect to database . . .
Spots . . . . . . . . . . . .
Circle . . . . . . . . . .
Rectangle . . . . . . . .
Free hand . . . . . . . .
All spots same size . . . .
Position control points . .
Locate . . . . . . . . .
Position any spot . . . . .
Background correction . .
Lock position . . . . . .
Spot incidence parameters
Delete . . . . . . . . .
Delete all . . . . . . . .
Assign quantity . . . . . .
Unassign quantity . . . .
Extras . . . . . . . . . . . .
User name. . . . . . . .
Configuration . . . . . .
Save sample defaults . . .
Load sample defaults . . .
Window . . . . . . . . . . .
New window . . . . . .
Cascade . . . . . . . . .
Tile . . . . . . . . . . .
Arrange icons . . . . . .
GeneTools User Manual
.
.
.
.
.
.
.
.
.
.
.
.
.
.
.
.
.
.
.
.
.
.
.
.
.
.
.
.
.
.
.
.
.
.
.
.
.
.
.
.
.
.
.
.
.
.
.
.
.
.
.
.
.
.
.
.
.
.
.
.
.
.
.
.
.
.
.
.
.
.
.
.
.
.
.
.
.
.
.
.
.
.
.
.
.
.
.
.
.
.
.
.
.
.
.
.
.
.
.
.
.
.
.
.
.
.
.
.
.
.
.
.
.
.
.
.
.
.
.
.
.
.
.
.
.
.
.
.
.
.
.
.
.
.
.
.
.
.
.
.
.
.
.
.
.
.
.
.
.
.
.
.
.
.
.
.
.
.
.
.
.
.
.
.
.
.
.
.
.
.
.
.
.
.
.
.
.
.
.
.
.
.
.
.
.
.
.
.
.
.
.
.
.
.
.
.
.
.
.
.
.
.
.
.
.
.
.
.
.
.
.
.
.
.
.
.
.
.
.
.
.
.
.
.
.
.
.
.
.
.
.
.
.
.
.
.
.
.
.
.
.
.
.
.
.
.
.
.
.
.
.
.
.
.
.
.
.
.
.
.
.
.
.
.
.
.
.
.
.
.
.
.
.
.
.
.
.
.
.
.
.
.
.
.
.
.
.
.
.
.
.
.
.
.
.
.
.
.
.
.
.
.
.
.
.
.
.
.
.
.
.
.
.
.
.
.
.
.
.
.
.
.
.
.
.
.
.
.
.
.
.
.
.
.
.
.
.
.
.
.
.
.
.
.
.
.
.
.
.
.
.
.
.
.
.
.
.
.
.
.
.
.
.
.
.
.
.
.
.
.
.
.
.
.
.
.
.
.
.
.
.
.
.
.
.
.
.
.
.
.
.
.
.
.
.
.
.
.
.
.
.
.
.
.
.
.
.
.
.
.
.
.
.
.
.
.
.
.
.
.
.
.
.
.
.
.
.
.
.
.
.
.
.
.
.
.
.
.
.
.
.
.
.
.
.
.
.
.
.
.
.
.
.
.
.
.
.
.
.
.
.
.
.
.
.
.
.
.
.
.
.
.
.
.
.
.
.
.
.
.
.
.
.
.
.
.
.
.
.
.
.
.
.
.
.
.
.
.
.
.
.
.
.
.
.
.
.
.
.
.
.
.
.
.
.
.
.
.
.
.
.
.
.
.
.
.
.
.
.
.
.
.
.
.
.
.
.
.
.
.
.
.
.
.
.
.
.
.
.
.
.
.
.
.
.
.
.
.
.
.
.
.
.
.
.
.
.
.
.
.
.
.
.
.
.
.
.
.
.
.
.
.
.
.
.
.
.
.
.
.
.
.
.
.
.
.
.
.
.
.
.
.
.
.
.
.
.
.
.
.
.
.
.
.
.
.
.
.
.
.
.
.
.
.
.
.
.
.
.
.
.
.
.
.
.
.
.
.
.
.
.
.
.
.
.
.
.
.
.
.
.
.
.
.
.
.
.
.
.
.
.
.
.
.
.
.
.
.
.
.
.
.
.
.
.
.
.
.
.
.
.
.
.
.
.
.
.
.
.
.
.
.
.
.
.
.
.
.
.
.
.
.
.
.
.
.
.
.
.
.
.
.
.
.
.
.
.
.
.
.
.
.
.
.
.
.
.
.
.
.
.
.
.
.
.
.
.
.
.
.
.
.
.
.
.
.
.
.
.
.
.
.
.
.
.
.
.
.
.
.
.
.
.
.
.
.
.
.
.
.
.
.
.
.
.
.
.
.
.
.
.
.
.
.
.
.
.
.
.
.
.
.
.
.
.
.
.
.
.
.
.
.
.
.
.
.
.
.
.
.
.
.
.
.
.
.
.
.
.
.
.
.
.
.
.
.
.
.
.
.
.
.
.
.
.
.
.
.
.
.
.
.
.
.
.
.
.
.
.
.
.
.
.
.
.
.
.
.
.
.
.
.
.
.
.
.
.
.
.
.
.
.
.
.
.
.
.
.
.
.
.
.
.
.
.
.
.
.
.
.
.
.
.
.
.
.
.
.
.
.
.
.
.
.
.
.
.
.
.
.
.
.
8-116
8-116
8-116
8-117
8-117
8-117
8-118
8-120
8-120
8-120
8-120
8-124
8-125
8-126
8-126
8-126
8-127
8-129
8-129
8-130
8-131
8-132
8-132
8-133
8-135
8-135
8-136
8-137
8-138
8-138
8-138
8-145
8-145
8-145
8-146
8-146
8-146
8-146
Contents-9
Contents
Windows open in GeneTools . . . . .
Help. . . . . . . . . . . . . . . . . . .
Help topics . . . . . . . . . . . . .
About GeneTools . . . . . . . . . . .
Image pane and Profile context menus . . .
Track label context menu . . . . . . . . .
Active matching standard . . . . . . .
Peak value pane context menu . . . . . . .
Delete . . . . . . . . . . . . . . .
Graphics pane context menu. . . . . . . .
Scale to fit . . . . . . . . . . . . . .
Save to clipboard. . . . . . . . . . .
Gel window Results pane context menu. . .
Result table commands . . . . . . . .
Profile comparison window context menu . .
Spot blot/Manual band quantification window
Set radius . . . . . . . . . . . . . .
Spot blot/Manual band quantification window
Result table commands . . . . . . . .
Table 1D/Table 2D . . . . . . . . . .
Spot blot/Manual band quantification window
Save to clipboard. . . . . . . . . . .
Molecular weight library context menu . . .
Colony counting exclude region . . . . . .
. . . . . . . . . . . . . . . . . . . . .
Contents-10
. . . . . . . . . . . . .
. . . . . . . . . . . . .
. . . . . . . . . . . . .
. . . . . . . . . . . . .
. . . . . . . . . . . . .
. . . . . . . . . . . . .
. . . . . . . . . . . . .
. . . . . . . . . . . . .
. . . . . . . . . . . . .
. . . . . . . . . . . . .
. . . . . . . . . . . . .
. . . . . . . . . . . . .
. . . . . . . . . . . . .
. . . . . . . . . . . . .
. . . . . . . . . . . . .
Image pane context menu .
. . . . . . . . . . . . .
Results pane context menu
. . . . . . . . . . . . .
. . . . . . . . . . . . .
Quantity calibration context
. . . . . . . . . . . . .
. . . . . . . . . . . . .
. . . . . . . . . . . . .
. . . . . . . . . . . . .
. . .
. . .
. . .
. . .
. . .
. . .
. . .
. . .
. . .
. . .
. . .
. . .
. . .
. . .
. . .
. . .
. . .
. . .
. . .
. . .
menu
. . .
. . .
. . .
. . .
.
.
.
.
.
.
.
.
.
.
.
.
.
.
.
.
.
.
.
.
.
.
.
.
.
.
.
.
.
.
.
.
.
.
.
.
.
.
.
.
.
.
.
.
.
.
.
.
.
.
8-146
8-147
8-147
8-147
8-147
8-148
8-148
8-149
8-149
8-149
8-149
8-150
8-150
8-150
8-151
8-151
8-151
8-153
8-153
8-154
8-154
8-154
8-155
8-155
8-156
GeneTools User Manual
Using GeneTools for Gel analysis
This chapter contains detailed instructions for using GeneTools for Gel analysis. It begins
by describing how you can load sample files and images into GeneTools. It then shows
you how to detect, place and edit tracks on the image, and then detect, place and edit
peaks on the tracks.
This is followed by instructions for calibrating and determining the molecular weights
and quantities represented by peaks on the gels, including how you can use libraries of
molecular weight/quantity standards.
The chapter continues by showing you how to display a window comparing the profiles
on different tracks, including how to compare the profiles of tracks on different gels.
The next section describes how to use GeneTools to match the peaks (bands) on
different tracks to a standard track or to match the track profiles themselves.
The final section in the chapter tells you how to print and export result reports.
How to create and work with secure sample files
File formats
GeneTools stores data in a secure file format – a SynGene Gel document or .sgd file.
These files are also created by compatible acquisition programs, such as GeneSnap.
The secure file format ensures that your data cannot be tampered with, and that your
results are both traceable and reproducible in keeping with Good Laboratory Practice.
Secure sample files may be:
●
analyzed files that have been previously saved in GeneTools – these will contain (for
a gel) information about track positions, peaks, assigned standards, results for
molecular weights, quantities and peak matching, and so on.
●
unanalyzed files that have been saved in an acquisition program, but have not yet
been loaded into and saved in GeneTools.
GeneTools User Manual
1-1
Using GeneTools for Gel analysis
Opening a secure sample file below shows you how to open both unanalyzed and
analyzed secure sample files.
However, you can also load other image files created by non-secure sources (such as
Tiff images generated by a scanner) into GeneTools for analysis. When you do this,
GeneTools copies the original image and saves it in a secure file – any changes you then
make to the original image will have no effect on the image in the secure file. Full
details are given in Creating a new secure sample file, page 1-11.
Opening a secure sample file
To open a secure sample file:
1 Choose Open from the File menu to display a standard Windows Open
dialog box:
2 Use the dialog box to select the required secure sample file.
3 Press Open.
1-2
GeneTools User Manual
How to create and work with secure sample files
What happens next depends on whether you are opening an analyzed or unanalyzed
secure sample, and in the latter case on whether you have set Auto import methods in
the Configuration dialog box.
●
If you are opening an analyzed secure sample file:
●
●
The sample will be opened in a Gel window with all tracks and peaks displayed
as they were when the file was last saved. All previously analyzed results will be
shown in the Results tables.
If you are opening an unanalyzed secure sample file and you have selected Auto
import methods in the Configuration dialog box:
●
The Import method dialog box will open so that you can choose which settings
to import – see Opening or creating a secure sample file with automatic import,
page 1-16, for further details.
GeneTools User Manual
1-3
Using GeneTools for Gel analysis
●
If you are opening an unanalyzed secure sample file with Auto import methods
deselected:
●
The Sample properties dialog box will open with the image loaded:
The controls shown on the General page in the Sample properties dialog box depend
on the type of sample (in the picture shown above, the sample is an ethidium bromide
stained DNA gel).
To set the sample properties:
1 If required, select a different Analysis type from the drop-down list box – the
default Analysis type is set to Gel when GeneTools is first installed, but you
can change this using Configuration in the Extras menu (see page 8-139).
2 Click on one of the direction radio buttons to set the Electrophoresis
direction (the default is Down).
1-4
GeneTools User Manual
How to create and work with secure sample files
3 GeneTools detects the Image type automatically, so you shouldn’t need to
change this setting. However, if you wish to change the setting:
a Click on the Fluorescence radio button for a fluorescence image (bright
bands on a dark background).
b Click on the Absorption radio button for an absorption image (dark bands
on a bright background).
4 The red rectangle on the image preview defines the area of interest – the area
analyzed when GeneTools performs an automatic track location. If required
(for example, if you are working with a multi-layer sample), you can define a
grid of independent areas of interest.
Note
Each area of interest is (nearly) independent of all the other areas of interest defined on
the gel. Molecular weight/quantity standard tracks must be assigned separately within
each area, and matching is carried out between the tracks in the same area and not
with any tracks in other areas. Separate quantity calibrations can be used for each area,
though quantity calibrations can be shared between areas. A single set of integration
parameters is used for all areas, but molecular weight calibration, quantity calibration
and matching parameters can be chosen independently for each area of interest. Tracks
can be located, adjusted and locked independently within each area of interest. Rf start
and end lines can be adjusted independently for each area of interest. The Results and
Graphics panes show details for the selected area of interest only.
To define a grid of independent areas of interest on the gel image:
a Enter the number of Columns in the grid.
b Enter the number of Rows in the grid.
(Leave the numbers of Columns and Rows set to 1 if you just want a single
area of interest.)
GeneTools User Manual
1-5
Using GeneTools for Gel analysis
As you enter the numbers, a grid of red rectangles appears on the image. For
example:
If required, as in this example, you can adjust the shape and position of the
areas of interest – see the following steps.
1-6
GeneTools User Manual
How to create and work with secure sample files
5 To adjust the shape of an area of interest:
a Click in the area of interest that you want to adjust to select it – blue drag
handles appear at the corners and in the middle of the sides of the area of
interest showing that it is selected:
b Move the pointer over the drag handle for the corner or side that you
want to adjust. The shape of the pointer will change to a two-headed
arrow showing that you can drag the handle:
c Press and drag the corner or side as required. The outline of the area of
interest will be redrawn as you drag the handle:
GeneTools User Manual
1-7
Using GeneTools for Gel analysis
d When the corner or side is in the required position, release the mouse
button:
6 To move an area of interest:
a Move the pointer over the area of interest you want to move:
b Press and drag the area of interest. The area of interest will become
selected, the pointer will change to a four-headed arrow and the outline
of the area of interest will be redrawn to show its new position as you
drag it:
c When the area of interest is in the required position, release the mouse
button:
1-8
GeneTools User Manual
How to create and work with secure sample files
7 The next step is to choose between automatic and manual track detection.
Note
Automatic track detection is the recommended way of working with GeneTools – you
can use Configuration in the Extras menu (see page 8-139) to set GeneTools to detect
the tracks automatically by default.
To choose automatic track detection for an area of interest (you can choose
the setting separately for each area of interest):
a Click in the area of interest to select it (this step is unnecessary if there is
only one area of interest).
b Press Locate tracks automatically.
Note
Generally, this is all you have to do as in nearly all cases the GeneTools automatic track
location will be able to locate the tracks on the gel correctly and position track markers
over them accurately without further assistance. However, very occasionally you may
have a gel that causes problems, and the following step allows you to help out the track
detection software by giving an indication of the number of tracks. You will only need
to use this step if the fully automatic track detection has failed.
c If automatic track location has failed to identify the tracks correctly:
i
Check Hint.
ii Enter the approximate number of tracks in the area of interest.
To choose manually how many tracks you want to place in each area of
interest on the gel:
a Click in the area of interest to select it (this step is unnecessary if there is
only one area of interest.)
b Press the Create radio button to enable the tracks for manual positioning
spin box.
c Enter the number of tracks you want to place in that area of interest. The
tracks will be placed at default positions and you will need to position
them manually later.
GeneTools User Manual
1-9
Using GeneTools for Gel analysis
Note
The Leave the tracks unchanged radio button is only enabled when the Sample
properties dialog box is displayed for an existing analyzed sample (see the entry for
Sample properties in the File (Gel) section in the Menus chapter (page 8-28)).
8 Click on the Analysis notes tab and enter any notes you want to save with
the secure sample file.
(The other two pages give information saved with the file in the acquisition
program – see the entry for Sample properties in the File (Gel) section in the
Menus chapter (page 8-28) for details.)
9 Press OK to close the dialog box and display the sample in a Gel window.
If you have set automatic track location, the tracks will be shown on the image and
locked. If you have also set automatic peak location, the peaks will be marked on the
tracks.
Note
The recommended way of working with GeneTools is to use automatic peak location –
use Configuration in the Extras menu (see page 8-139) to set GeneTools to locate
peaks automatically.
If you have not set automatic track location, and have specified a number of tracks, the
tracks will be unlocked ready for you to position them accurately on the image – see
How to place, position and work with tracks, page 1-22, for details.
Once you have opened an unanalyzed file, you should save it in order to save the
track, peak and other settings – see Saving a secure sample file, page 1-20, for details.
1-10
GeneTools User Manual
How to create and work with secure sample files
Creating a new secure sample file
To create a new secure sample file (for example, from a .tif or .bmp image file):
1 Choose New (Import) from the File menu to display a standard Windows
Open dialog box:
2 Choose the type of image file from the Files of type drop-down list box.
3 Use the Look in drop-down list box to select the folder containing the image
file.
4 Click on the file in the list box to select it – the name of the file will appear in
the File name box.
5 Press Open to close the dialog box.
What happens next depends on whether you have selected Auto import methods in
the Configuration dialog box:
●
If you have selected Auto import methods in the Configuration dialog box, the
Import method dialog box will open so that you can choose which settings to
import – see Opening or creating a secure sample file with automatic import,
page 1-16, for further details.
●
If Auto import methods is not selected, the Sample properties dialog box will open
so that you can set the type of image and make other settings – see the picture on
page 1-4 and the instructions following it.
GeneTools User Manual
1-11
Using GeneTools for Gel analysis
Using the Browser
As an alternative to using the Open command to open an existing secure sample file
(see Steps 1–3 in Opening a secure sample file page 1-2) or the New (Import)
command to create a new secure sample file (for example, from a non-secure .tif or
.bmp image file – see the previous section), you can use the GeneTools built-in Browser
to preview and open image files.
To open an existing secure sample file or create a new secure sample file using the
Browser:
1 Choose Browse from the File menu to display the Browser:
Note
The picture shows the Browser in a non-maximized window; it can also be maximized
to fill the document area covering any Image windows or minimized to an icon.
2 Use the left-hand pane in the Browser in exactly the same way as you use the
left-hand pane in Windows Explorer to select the folder containing the
required image.
The right-hand pane in the Browser will show a preview of all the images in
the selected folder.
1-12
GeneTools User Manual
How to create and work with secure sample files
3 Double-click on the image that you want to open.
What happens next depends on whether you are opening an analyzed or unanalyzed
secure sample or creating a new secure sample file.
If you are opening an analyzed secure sample file:
●
The sample will be opened in a Gel window with all tracks and peaks displayed as
they were when the file was last saved. All previously analyzed results will be shown
in the Results tables.
If you are opening an unanalyzed secure sample file or creating a new secure sample
file:
●
If you have selected Auto import methods in the Configuration dialog box, the
Import method dialog box will open so that you can choose which settings to
import – see Opening or creating a secure sample file with automatic import,
page 1-16, for further details.
●
If Auto import methods is deselected, the Sample properties dialog box will open
so that you can set the type of image and make other settings – see the picture on
page 1-4 and the instructions following it.
Acquiring an image to create a secure sample file
GeneTools allows you to acquire an image from a Twain source, such as a scanner or a
digital camera, and create a secure sample file from it.
To select a Twain source so that you can Acquire an image from it:
1 Choose Select Source (Twain) from the File menu to display the Select
Source dialog box:
2 Click on the required source to select it.
GeneTools User Manual
1-13
Using GeneTools for Gel analysis
3 Press Select to confirm the selection and close the dialog box.
To acquire an image from the selected Twain source and create a secure sample file:
1 Choose Acquire (Twain) from the File menu.
A dialog box will be displayed for the selected source so that you can select
acquisition options and acquire the image.
2 Use the dialog box to acquire the image.
What happens next depends on whether you have selected Auto import methods in
the Configuration dialog box:
●
If you have selected Auto import methods in the Configuration dialog box, the
Import method dialog box will open so that you can choose which settings to
import – see Opening or creating a secure sample file with automatic import,
page 1-16, for further details.
●
If Auto import methods is not selected, the Sample properties dialog box will open
so that you can set the type of image and make other settings – see the picture on
page 1-4 and the instructions following it.
Importing settings from existing secure Gel sample files
Automatically importing settings
To set the program to import settings automatically from an existing secure Gel sample
file:
1 Choose Configuration from the Extras menu to display the General page of
the Configuration dialog box.
2 Check Auto import methods.
1-14
GeneTools User Manual
How to create and work with secure sample files
3 Click on the Import tab to display the Import page:
4 Press Browse to display a standard Windows Open dialog box if you want to
select a different file from which to import the settings.
a Select the file from which you want to import settings.
b Press OK to close the Open dialog box.
The name of the selected file will appear in the File name box.
5 Check the boxes for the settings you want to import.
Note
The check boxes are disabled if no file is selected.
6 Press OK to close the Configuration dialog box.
GeneTools User Manual
1-15
Using GeneTools for Gel analysis
Note
The settings you make will be stored as the defaults for the next time you want to
import settings. The controls on this page are also displayed in a dialog box when you:
●
open an unanalyzed image, or
●
create a secure sample file from a non-secure image, or
●
choose Import method from the File menu to import the settings from a saved file
to an existing secure sample file in a Gel window.
Changing the settings in any of these places changes the defaults.
Opening or creating a secure sample file with automatic import
If you have automatic import set when you:
●
open an unanalyzed secure sample file – see Opening a secure sample file,
page 1-2,
●
create a new secure sample file – see Creating a new secure sample file, page 1-11,
●
acquire an image from a Twain source – see Acquiring an image to create a secure
sample file, page 1-13,
the Import method dialog box will open:
1-16
GeneTools User Manual
How to create and work with secure sample files
Note
If you change your mind about using automatic import, press Cancel to close the
Import method dialog box and display the Sample properties dialog box. Then
continue as if you were opening or creating a secure sample file without automatic
import.
To continue opening or creating a secure sample file with automatic import:
1 Click on the Import tab to display the Import page:
2 Press Browse to display a standard Windows Open dialog box if you want to
select a different file from which to import the settings.
Note
The check boxes are disabled if no file is selected.
3 Check or uncheck the boxes if you want to change the settings that are
imported.
Note
The settings you make will be stored as the defaults for the next time you want to
import settings. You can also set the defaults using the Import page of the
Configuration dialog box, or by importing settings to an existing secure sample file by
choosing Import method from the File menu.
4 Press Import to close the Import method dialog box.
GeneTools User Manual
1-17
Using GeneTools for Gel analysis
What happens next depends on whether you have chosen to import Sample
and track settings:
Note
●
If you haven’t imported Sample and track settings, the Sample
properties dialog box will be displayed so that you can set the sample
properties – see Opening a secure sample file, page 1-2.
●
Otherwise (and after you have pressed OK in the Sample properties
dialog box), a Gel window will open containing the new sample created
from the image.
If you have set automatic track location and have not imported Sample and track
settings, the tracks will be locked; otherwise they will be unlocked ready for you to
position them accurately on the image.
You can now use all the program’s analysis procedures to work with the sample.
Note
You can always change the automatically imported settings at a later time by choosing
Sample properties from the File menu to change individual settings (the Sample
properties dialog box also allows you to add notes about the sample to be saved with
it).
See the next section for how to use Import method from the File menu to import
settings from a different secure sample file – this also displays the Import method dialog
box but without the page showing the image.
1-18
GeneTools User Manual
How to create and work with secure sample files
Importing settings from a saved sample file
To apply sample and track settings, molecular weight/quantity standards and/or report
settings from a saved secure sample file to the sample in the selected Gel window:
1 Choose Import method from the File menu to display the Import method
dialog box:
2 Press Browse to display a standard Windows Open dialog box if you want to
select a different file from which to import the settings.
Note
The check boxes are disabled if no file is selected.
3 Check Molecular weight stds. to import the molecular weight/quantity
standard tracks and molecular weight/quantity assignments from a saved
sample file.
For example, if tracks 1 and 5 in the saved file are molecular weight
standards, any previous molecular weight assignments will be removed from
the selected sample and tracks 1 and 5 will become molecular weight
standards.
If peaks 3, 5 and 7 in track 1 of the saved file have assigned molecular
weights/quantities, peaks 3, 5 and 7 in track 1 of the selected sample will be
assigned the same molecular weights/quantities.
GeneTools User Manual
1-19
Using GeneTools for Gel analysis
4 Check Sample and track settings to import the electrophoresis direction,
image type, number of tracks and track positions from a saved sample file.
5 Check Report settings to import the report setup from a saved sample file.
Note
This dialog box is also displayed if you create a new sample from a non-secure image
with automatic import set (though it then has an additional page showing the image).
You can also set the import methods in the Import page of the Configuration dialog
box. The program displays the same import methods in all these places and changing
the settings in any one of them changes the settings in all of them.
Editing sample properties
To view or edit the settings and notes for a sample:
1 Click in the window containing the sample to select it.
2 Choose Sample properties from the File menu to display the General page
of the Sample properties dialog box – see the entry for Sample properties in
the Menus chapter (page 8-28) for details.
Saving a secure sample file
To save a secure sample with a new name:
1 Click in the Gel window containing the sample (or choose it from the list at
the bottom of the Window menu).
1-20
GeneTools User Manual
How to create and work with secure sample files
2 Choose Save as from the File menu to display a standard Windows Save As
dialog box:
3 Use the dialog box to select a folder in which to save the sample.
4 Enter a File name for the sample.
5 Press Save to save the sample in the file.
To save a previously saved secure sample file using the same name:
1 Click in the Gel window containing the sample (or choose it from the list at
the bottom of the Window menu).
2 Choose Save from the File menu. If the secure sample file has not been saved
previously, the Save As dialog box will be displayed so that you can enter a
name: see above.
GeneTools User Manual
1-21
Using GeneTools for Gel analysis
How to place, position and work with tracks
Overview
To enable the program to analyze the image, you must place and position a set of
rectangles (‘tracks’) over the image to define the positions of the electrophoresis tracks.
Locating the tracks on an image automatically
The default way of working with GeneTools is to allow it to locate the tracks on the
image automatically. This is the recommended way of working, unless you have specific
requirements that are not handled appropriately by the automatic detection procedures.
See Locating tracks automatically, page 1-24, for more details.
Placing tracks on an image manually
If required, you can place tracks on the image manually. There are several ways of
doing this:
A You can place tracks on an image when you open an unanalyzed secure
sample file or when you create a new secure sample file (for example, from a
non-secure .tif or .bmp image file) by specifying the number of tracks using
the Sample properties dialog box, which is automatically displayed as part of
the procedure. You can also display this dialog box for an existing sample and
then change the number of tracks specified there, to replace all the tracks on
the sample with a new set of tracks – see the entry for Sample properties in
the Menus chapter (page 8-28) for details. In any of these cases, the image
will eventually be displayed in a Gel window, with the tracks unlocked so that
you can adjust the position of the tracks accurately.
B You can add new tracks to the image in an existing analyzed secure sample
file or delete or replace one or all of its tracks. See the following for more
details:
1-22
●
Placing individual tracks on the sample – page 1-26
●
Deleting tracks – page 1-30.
GeneTools User Manual
How to place, position and work with tracks
Adjusting the position of the tracks on an image
The following sections show you how to adjust the position of the existing tracks on an
image in a sample:
●
Adjusting the overall position of the tracks on a sample – page 1-30
●
Adjusting the track splay – page 1-32
●
Moving and tilting a single track – page 1-35
●
Adjusting track width – page 1-40
●
Adjusting the RF start and end positions – page 1-43.
Other ways to work with tracks
The following sections describe a number of other operations related to working with
tracks:
●
Locking tracks – page 1-25
●
Enabling and disabling tracks – page 1-47
●
Adding a description for a track – page 1-47
●
Displaying track properties – page 1-49.
GeneTools User Manual
1-23
Using GeneTools for Gel analysis
Locating tracks automatically
To set GeneTools so that it will locate the tracks on a gel image automatically:
1 Choose Configuration from the Extras menu to display the Configuration
dialog box:
2 Check Auto locate tracks.
3 Press OK.
Now, when you open an unanalyzed secure sample file, or create a new secure sample
file (for example, from a non-secure .tif or .bmp image file), the tracks will be located
automatically, provided you leave the number of tracks set to 0 in the Sample
properties dialog box.
You can also automatically locate the tracks on an existing gel image in a secure sample
file, by choosing Sample properties from the File menu to display the Sample
properties dialog box and setting the number of tracks to 0. However, the following
procedure is rather quicker.
1-24
GeneTools User Manual
How to place, position and work with tracks
To locate the tracks on an existing gel image automatically:
1 Select the Gel window.
2 If there is more than one area of interest on the gel, click in the one in which
you want to locate the tracks to select it (tracks in other areas of interest will
not be affected).
3 Lock the tracks if they are not already locked (see the next section).
4 Choose Locate tracks from the Track menu.
Locking tracks
The tracks shown on the sample in the Image pane in the Gel window can be either
locked or unlocked.
You need to lock the tracks before you can perform any of the functions that require
the program to analyze the image along the tracks, such as locating the peaks, and
assigning and calculating molecular weights and quantities.
To lock the tracks on a sample in the selected Gel window:
1 If there is more than one area of interest on the gel, click in the one in which
you want to lock the tracks to select it (tracks in other areas of interest will not
be locked).
2 Choose Lock all from the Track menu.
When the tracks are locked, Lock all is checked in the menu and the button is shown
as depressed in the toolbar:
GeneTools User Manual
1-25
Using GeneTools for Gel analysis
To unlock the tracks in the selected area of interest on a sample in the selected Gel
window (tracks in other areas of interest will not be affected):
Choose any of the following track editing commands from the Track menu:
Position All
Splay All
Move/tilt
Width
Rf start position
Rf end position.
Placing individual tracks on a sample
You can place tracks on a sample using:
●
a menu command
●
by double-clicking
●
by dragging out the track.
Each of these is described below.
1-26
GeneTools User Manual
How to place, position and work with tracks
Inserting a track with a menu command
To place a track on a sample using a menu command:
1 Click in the Gel window containing the sample to select it.
2 If there is more than one area of interest, click in the one in which you want
to add the track.
3 Unlock the tracks if they are locked.
4 Click in the track to the right of the space into which you want to insert the
new track:
5 Choose Insert from the Track menu.
Provided there is enough space for the track (including inter-track space), the new track
will be inserted. The new track will have the same size and shape as the selected track:
GeneTools User Manual
1-27
Using GeneTools for Gel analysis
As in the example, you may need to adjust the position or the width of the track after it
has been inserted – see Moving and tilting a single track, page 1-35, for details.
Inserting a track by double-clicking
To place a track on a sample by double-clicking:
1 Click in the Gel window containing the sample to select it.
2 If there is more than one area of interest, click in the one in which you want
to add the track.
3 Choose:
Move/tilt
Or
Width
from the Track menu.
4 Click on a track with the size and shape required for the new track (you can
always change these later).
5 Double-click at the point where you want the track to be.
The inserted track will be centered horizontally at the point you clicked, provided this
would not cause the new track to overlap existing tracks. If there would be an overlap,
the track is not inserted.
You may need to adjust the position or the width of the track after it has been inserted.
Inserting a track by dragging out the track
To place a track on a sample by dragging out the track:
1 Click in the Gel window containing the sample to select it.
1-28
GeneTools User Manual
How to place, position and work with tracks
2 If there is more than one area of interest, click in the one in which you want
to add the track.
3 If Width individual is unchecked in the Track menu, choose it to set
individual width mode.
4 Move the pointer to the position where you want to place one of the corners
of the track (it doesn’t matter which corner):
5 Press and drag out to the opposite corner (a rectangle will be drawn on the
image as you are dragging to show the position of the track):
GeneTools User Manual
1-29
Using GeneTools for Gel analysis
6 Release to place the track on the sample:
As in this example, you may need to adjust the tilt of the track after it has been
inserted.
Deleting tracks
To delete a track from a sample:
1 Click in the Gel window containing the sample to select it.
2 Click in the track in the Image pane to select it.
3 Unlock the tracks if they are locked.
4 Choose Delete from the Track menu or the menu displayed when you
right-click in the Image pane, or press c.
Adjusting the overall position of the tracks on a sample
To adjust the overall positioning of all the tracks (in the selected area of interest) on a
sample together (see Adjusting the track splay (page 1-32) for adjusting both the overall
position and the amount of track splay):
1 Click in the Gel window containing the sample to select it.
2 If there is more than one area of interest, click in the one in which you want
to adjust the tracks.
1-30
GeneTools User Manual
How to place, position and work with tracks
3 Choose Position all from the Track menu.
The tracks will be unlocked and drag boxes will appear at the outer corners of
the two outside tracks:
4 Move the pointer over the drag box at the first corner that you want to move.
The pointer will change to a four-way arrow:
5 Press and drag the corner box to its new position.
The outlines of the tracks’ new positions will be shown as you drag:
GeneTools User Manual
1-31
Using GeneTools for Gel analysis
6 Drop the corner box in its new position:
7 Repeat Steps 4–6 for the diagonally opposite corner if required.
Adjusting the track splay
This topic describes how to adjust the amount by which the tracks (in the selected area
of interest) on a sample are splayed apart. You can also adjust the overall position of the
tracks at the same time, but see Adjusting the overall position of the tracks on a sample
(page 1-30) if you want to adjust the overall position of the tracks without changing the
amount of track splay.
To adjust the amount by which the tracks in an area of interest on a sample are splayed
apart:
1 Click in the Gel window containing the sample to select it.
2 If there is more than one area of interest, click in the one in which you want
to adjust the tracks.
3 Choose Splay all from the Track menu.
1-32
GeneTools User Manual
How to place, position and work with tracks
The tracks will be unlocked and drag boxes will appear at the outer corners of
the two outside tracks:
4 Move the pointer over the drag box at the first corner that you want to move.
The pointer will change to a four-way arrow:
GeneTools User Manual
1-33
Using GeneTools for Gel analysis
5 Press and drag the corner box to its new position.
The outlines of the tracks’ new positions will be shown as you drag:
Note
When you start to drag the box, the Rf start line (or end line if you are dragging a box
at the end of the tracks) will snap to the drag boxes at the start (or end) of the tracks
and any bends in the line will be removed. The start (or end if you are dragging a box
at the end of the tracks) of all the tracks will then snap to the new Rf line and move
with it as you drag it. If you want to adjust the position of the Rf lines, you should do so
when you have finished adjusting the splay (and overall position) of the tracks (see
Adjusting the Rf start and end lines, page 1-43.
6 Drop the corner box in its new position:
7 Repeat Steps 4–6 for the other corners if required.
1-34
GeneTools User Manual
How to place, position and work with tracks
Moving and tilting a single track
The first three steps in moving, tilting or bending a track are the same.
To move, tilt or bend a track, first:
1 If there is more than one area of interest in the image, click in the one
containing the track you want to adjust.
2 Choose Move/tilt from the Track menu. The tracks will be unlocked.
3 Click in the track that you want to adjust to select it. The track will be
highlighted and will have a drag box at each end.
You can now move, tilt or bend the track.
Moving a track
To move an individual track on a sample:
4 Perform Steps 1-3 as above.
5 Move the pointer to a point anywhere within the track (not on the drag
boxes):
GeneTools User Manual
1-35
Using GeneTools for Gel analysis
6 Press and drag the track to its new position:
7 Drop the track in its new position:
1-36
GeneTools User Manual
How to place, position and work with tracks
Tilting a track
To tilt an individual track on a sample:
4 Perform Steps 1–3 as above.
5 Move the pointer over the drag box at the first end that you want to move.
The pointer will change to a four-way arrow:
6 Press and drag the box to its new position. You can drag to any position
provided you do not overlap other tracks or invert the electrophoresis
direction.
The outline of the track’s new position will be shown as you drag:
GeneTools User Manual
1-37
Using GeneTools for Gel analysis
7 Drop the track in its new position:
8 Repeat Steps 5–7 for the other end of the track if required.
Bending a track
To bend an individual track on a sample:
4 Perform Steps 1–3 as above.
5 Double-click at the point on the track where you want to bend it. A new drag
box will appear at that point:
1-38
GeneTools User Manual
How to place, position and work with tracks
When you place the pointer over the drag box, it turns into a four-way arrow:
6 Press and drag the drag box. You can drag to any position provided you do
not overlap other tracks or invert the electrophoresis direction.
The outline of the track’s new shape will be shown as you drag:
GeneTools User Manual
1-39
Using GeneTools for Gel analysis
7 Drop the drag box in its new position:
8 Repeat Steps 5–7 if you want to put any other bends in the track.
To remove a bend in an individual track on a sample:
4 Perform Steps 1–3 as above. Drag boxes will appear at the ends of the track
and at any bend points.
5 Double-click on the drag box at the apex of the bend that you want to
remove.
Adjusting track width
You can adjust the width of an individual track or the width of all tracks (in the selected
area of interest) at the same time.
To adjust the width of all tracks (in the selected area of interest) at the same time:
1 Click in the Gel window containing the sample to select it.
If there is more than one area of interest, click in the one in which you want
to adjust the tracks.
1-40
GeneTools User Manual
How to place, position and work with tracks
2 If Width individual is checked in the Track menu, choose it to leave
individual width mode.
Note
When you adjust the widths of all tracks at the same time, all tracks (in the selected
area of interest) are set to the width of the track that you are using to adjust the track
width.
To adjust the width of individual tracks:
1 Click in the Gel window containing the sample to select it.
If there is more than one area of interest, click in the one in which you want
to adjust the tracks.
2 If Width individual is unchecked in the Track menu, choose it to set
individual width mode.
The following instructions apply whether you are adjusting the width of a single track or
of all tracks.
To adjust track width on a sample:
1 Click in the Gel window containing the sample to select it.
If there is more than one area of interest, click in the one in which you want
to adjust the tracks.
2 Choose Width from the Track menu. The tracks will be unlocked.
3 Click in the track that you want to adjust to select it (any track if you are
adjusting them all). The track will be highlighted and will have a drag box on
each corner:
GeneTools User Manual
1-41
Using GeneTools for Gel analysis
4 Move the pointer over one of the drag boxes (it doesn’t matter which):
5 Press and drag at right angles to the electrophoresis direction (for example,
sideways if the electrophoresis direction is up or down). As you are dragging,
the new outline of the track(s) will be shown:
6 Release to set the new track width:
1-42
GeneTools User Manual
How to place, position and work with tracks
Adjusting the Rf start and end lines
When you compare profiles, the profiles (which may be taken from different secure
sample files) are plotted on an Rf scale from 0 to 1 taken between the Rf start and end
lines.
You can adjust the position of the Rf lines in the electrophoresis direction, the angle of
the lines across the electrophoresis direction, or add bends to the lines.
The first two steps in all these procedures are the same.
Notes
The Rf start position and Rf end position commands are permanently disabled for
High Throughput Gel samples.
Adjusting the overall position or splay of the tracks on the sample also adjusts the
position of the Rf lines, so you should make any adjustments to the track position and
splay before adjusting the Rf lines.
To adjust the Rf start or end position (in the selected area of interest) on a sample:
1 Click in the Gel window containing the sample to select it.
If there is more than one area of interest, click in the one in which you want
to adjust the Rf lines.
2 Choose Rf start position from the Track menu
or
Choose Rf end position from the Track menu.
GeneTools User Manual
1-43
Using GeneTools for Gel analysis
The tracks will be unlocked and two drag boxes will appear on the appropriate Rf line
(the examples show the Rf end line, but the procedures are identical for both):
You can now either just move the whole line along the electrophoresis direction, adjust
the angle of the line or add bends to the line.
To move an Rf line without changing its angle:
3 Follow Steps 1–2 above.
4 Move the pointer over the line, but not over either of the drag boxes. The
pointer will change to a two-way arrow.
5 Press and drag the line to its new position.
The line’s new position will be shown as you drag.
1-44
GeneTools User Manual
How to place, position and work with tracks
6 Drop the line in its new position.
To adjust the angle of an Rf line:
3 Follow Steps 1-2 above.
4 Move the pointer over one of the drag boxes. The pointer will change to a
four-way arrow:
5 Press and drag the box to change the angle of the line.
As you drag, the line’s new position will be shown on the sample (the line
pivots about the other drag box):
GeneTools User Manual
1-45
Using GeneTools for Gel analysis
6 Drop the line in its new position:
To add a bend to an Rf line:
3 Follow Steps 1–2 above.
4 Move the pointer to the point on the sample where you want the apex of the
bend:
5 Double-click. The bend will be added to the line with a new drag box at its
apex:
6 If you want to adjust the position of the bend, place the pointer over the drag
box. The pointer will change to a four-way arrow and you can drag the box
to a new position.
7 Repeat Steps 4–6 for any other bends you want to add.
1-46
GeneTools User Manual
How to place, position and work with tracks
To remove a bend from an Rf line:
3 Follow Steps 1–2 above.
4 Double-click on the drag box at the apex of the bend.
Enabling and disabling tracks
You can choose to exclude the results for individual tracks from printed reports by
‘disabling’ them.
To disable a track:
1 Lock the tracks if they are not already locked – all the tracks on the sample
must be locked, not just those in the area of interest containing the track you
want to disable.
2 Click on the track in the Image or Track label pane to select it.
3 Choose Disable from the Track menu or the pop-up menu displayed when
you right-click in the Track label pane.
When a track is disabled, the label in the Track label pane, the profile in the Profile
pane and values in the Peak value pane are grayed.
To enable a disabled track:
1 Lock the tracks if they are not already locked – all the tracks on the sample
must be locked, not just those in the area of interest containing the track you
want to enable.
2 Click on the track in the Image or Track label pane to select it.
3 Choose Enable from the Track menu or the pop-up menu displayed when
you right-click in the Track label pane.
Adding a description for a track
To add a description for a track:
1 Lock the tracks if they are not already locked – all the tracks on the sample
must be locked, not just those in the area of interest containing the track for
which you want to add a description.
GeneTools User Manual
1-47
Using GeneTools for Gel analysis
2 Click on the track in the Image or Track label pane to select it.
3 Choose Description from the Track menu or the pop-up menu displayed
when you right click in the Track label pane to display the Track description
dialog box:
4 Type the description in the edit box.
5 Press OK to confirm the description and close the dialog box.
The description will be shown in the track description pane in the Gel window –
“Solution XF9” in the following example:
The description will also be shown with the results for individual tracks if they are
included in Gel reports.
1-48
GeneTools User Manual
How to place, position and work with tracks
Displaying track properties
To display information about a track in a Gel window or the Profile comparison
window:
1 Click on the track to select it either
in the Image or Track label pane of a Gel window,
or
in the left-hand pane of the Profile comparison window.
2 Choose Properties from the Track or Profile menu to display the Track
properties dialog box:
●
Tracks are numbered left to right (electrophoresis direction up or down),
top to bottom (electrophoresis direction left) or bottom to top
(electrophoresis direction right).
●
The Intensity range boxes show the minimum and maximum signals along
the length of the track. The signal is the sum of the (spatially filtered) pixel
values (after baseline corrections) across the width of the track divided by
the width of the track.
●
The Width box shows the width of the track in pixels.
●
The Position boxes show the start and end of the track.
GeneTools User Manual
1-49
Using GeneTools for Gel analysis
●
●
The start is given as the number of pixels between the start of the
track and the Rf start line (a positive position means that the Rf start
line crosses the track).
●
The end is given as the number of pixels between the start of the
track and the end of the track.
The Status box shows whether the track is enabled or disabled.
3 Click on the Peaks tab to display a table of information about the peaks in
the track:
1-50
GeneTools User Manual
How to set the background correction for tracks
How to set the background correction for tracks
Setting the integration parameters
Note
The same set of integration parameters is used for all areas of interest on the sample.
To set the parameters used for profile generation and automatic peak location:
1 Choose Integration parameters from the Edit menu to display the
Integration parameters dialog box:
2 Choose how to draw the baseline from which the signal is measured to give
the profile. The signal is the sum of the (spatially filtered) pixel values across
the width of the track.
You can use:
●
None – no baseline correction
●
Track borders
●
Lowest slope
GeneTools User Manual
1-51
Using GeneTools for Gel analysis
●
Track borders & slope – a combination of the last two: the signal is
corrected for the track borders and then the lowest slope correction is
used
●
Rolling disk.
(See the Baseline correction subsections after these instructions (page 1-53) for
details.)
3 If you have chosen to use Rolling disk background correction, enter or edit
the radius of the disk to be used. Some experimentation may be required to
find the best size of disk to use for each image – press Apply to see the effect
of the correction without closing the dialog box.
4 Choose whether to use a baseline offset or not. See Baseline correction after
these instructions for details.
5 Specify the Minimum peak width in image pixels for a peak to be detected.
6 Specify the Minimum peak height in image pixels that a peak must have if it
is to be detected.
7 Specify the Minimum peak volume as a percentage of the total quantity on
the track that a peak must have if it is to be detected.
8 Check All peaks same width to make the detected peaks all have the same
width, and enter the required width in the associated edit box.
9 Specify the width of the Savitsky-Golay filter used in integrating the image –
the greater the width the greater the smoothing effect of the filter. See
Savitsky-Golay filter (page 1-56) for examples.
1-52
GeneTools User Manual
How to set the background correction for tracks
10 Click on the Detection filter tab to display the Detection filter page so that
you can choose a filter for filtering color images:
11 Choose the required filter from the drop-down list box.
12 Press Apply to see the effect of any changes without closing the dialog box;
press OK to save the new settings and close the dialog box.
Baseline correction – track borders
For track borders baseline correction the signal is calculated relative to the signal at the
borders.
Baseline correction – lowest slope
To understand how this method works, consider the following example, which goes
through the process as if you had to do it by hand (naturally all this is done
GeneTools User Manual
1-53
Using GeneTools for Gel analysis
automatically by the program – all you would see is the profile in the first picture
change into the profile in the last picture):
To find the first segment of the baseline, the program starts at one end of the profile
and draws imaginary lines from the start point to all other points on the profile. The
following example just shows three of these lines:
The program then chooses the line of lowest slope. This is the shortest line in this
example as the other lines have larger (less negative) slopes (lines to all other points on
the profile have even larger slopes).
To find the second segment of the baseline, the program moves to the end of the first
segment and again draws imaginary lines from there to the remaining points on the
profile. Again the following example only draws three of these lines:
The program again chooses the line of lowest slope (the shortest line again in this
example) and repeats this process until it gets to the other end of the profile:
1-54
GeneTools User Manual
How to set the background correction for tracks
The corrected signal is then measured as the height above this baseline:
Baseline correction – rolling disk
For this method the program first calculates the position of the line formed by the
center of a disk with the set radius rolled along below the profile. The baseline is then
one radius length above this line, and the corrected signal is measured as the height
above this baseline.
Baseline correction – offset
Choose whether to use a baseline offset or not. The baseline offset moves the baseline
up to the lowest point in the profile.
For example:
with baseline offset becomes
GeneTools User Manual
1-55
Using GeneTools for Gel analysis
Savitsky-Golay filter
The pictures below are examples of the effects of different degrees of spatial filtering.
No filter
Filter width = 11
Filter width = 17
Setting or changing a manual baseline
To set a manual baseline for a track’s profile:
1 Click on the track in the Image pane to select it.
2 Choose Edit manual baseline from the Track menu or the context menu
displayed when you right-click in the Image or Profile pane.
The baseline will be displayed with circular drag handles at its ends and in the
color selected (using Configuration in the Extras menu – see page 8-143) for
the manual baseline.
1-56
GeneTools User Manual
How to set the background correction for tracks
3 If required, double-click on the baseline to add additional drag handles so
that you can bend the line (any peak markers and boundaries will be
removed from the profile):
4 To reshape the baseline:
a Position the pointer over the drag handle you want to move. The pointer
will change to a four-way arrow.
GeneTools User Manual
1-57
Using GeneTools for Gel analysis
b Drag the handle to reshape the baseline.
c Drop the handle in its new position.
1-58
GeneTools User Manual
How to locate and edit peaks on a track
Note
You cannot drag a handle above the profile line. While you are dragging a handle, the
new baseline may be drawn above the profile, but when you release the mouse button
it will be reshaped so that it always lies below it.
For example, when you release the mouse button,
will become
Deleting a manual baseline
To delete a manual baseline for a track:
1 Click on the track in the Image pane to select it.
2 Right-click in the Image pane (or Profile pane) to display a context menu.
3 Choose Delete manual baseline.
How to locate and edit peaks on a track
In order to calculate the molecular weights or quantities for a track, the program must
be able to identify the peaks and peak bounds in the profile. You can do this:
●
automatically – this is the default and is the recommended way of working unless
you have some specific need to use one of the other methods,
●
semi-automatically, or
●
manually.
GeneTools User Manual
1-59
Using GeneTools for Gel analysis
Each of these is described separately in the first three subsections.
After peaks have been located/added you can edit them at any time. See the following
for details:
●
Selecting peaks – page 1-64
●
Deleting peaks – page 1-67
●
Adjusting the position of a peak – page 1-68
●
Adjusting the position of a peak’s bounds – page 1-70.
See also:
●
Displaying peak properties – page 1-71.
Locating the peaks on a track automatically
The program uses a number of criteria, such as the minimum height and width, to
decide whether the local maxima on a profile should be counted as a peak. You can
change these criteria, together with the method used for background correction, by
choosing Integration parameters from the Edit menu – see Setting the integration
parameters, page 1-51.
You can set the program to detect peaks automatically whenever the track positions are
changed or the background correction method is changed.
To set automatic peak detection On or Off:
1 Choose Configuration from the Extras menu to display the General page of
the Configuration dialog box.
2 Check Auto locate peaks to turn automatic peak detection on; uncheck it to
turn it off – see the entry for Configuration from the Extras menu in the
Menus chapter (page 8-139) for details.
Automatic peak detection is the program’s default and the recommended way of
working.
1-60
GeneTools User Manual
How to locate and edit peaks on a track
Locating peaks automatically when automatic peak detection is turned off
Even if you have set automatic peak detection off, you can still use automatic peak
detection to locate the peaks either on a selected track or on all tracks.
Note
You can only locate peaks when the tracks are locked.
To locate the peaks on an individual track:
1 Click on the track in the Image pane to select it.
2 Choose On selected track from the Peak®Locate submenu.
To locate the peaks on all tracks (in the selected area of interest) automatically:
Choose On all tracks from the Peak®Locate submenu.
Adding a peak semi-automatically
Note
You can only add peaks when the tracks are locked.
You can add a peak semi-automatically by specifying its position in the Profile pane or
the Image pane.
To add a peak by specifying its position in the Profile pane:
1 Select the track by clicking on it in the Gel window’s Image pane.
2 In the Profile pane, move the pointer over the position where you want to
add the peak (it may help to magnify the display first):
GeneTools User Manual
1-61
Using GeneTools for Gel analysis
3 Double-click:
A peak will be added with bounds set to the neighboring local minima.
4 If necessary, adjust the position of the peak and its bounds – see Adjusting the
position of a peak, page 1-68, and Adjusting the position of a peak’s bounds,
page 1-70.
To add a peak by specifying its position in the Image pane:
1 Double-click in the Gel window’s Image pane at the position you want to
insert the peak. A peak will be added with bounds set to the neighboring
local minima.
2 If necessary, adjust the position of the peak and its bounds – see Adjusting the
position of a peak (page 1-68) and Adjusting the position of a peak’s bounds,
page 1-70.
Notes
You cannot add a peak within the bounds of another peak. Double-clicking inside an
existing peak has the effect of deleting the existing peak and placing a new peak at the
position clicked, with the bounds again set to the neighboring local minima.
If the track has been defined as a molecular weight standard and has already had
molecular weights assigned to the peaks, any assignments to peaks with higher peak
numbers will be reassigned. This will probably affect the molecular weight calculations
for other tracks. Molecular weight assignments are to the peak number, so when you
add a peak, the peak numbers of all later peaks will be increased by one, so, in effect,
all assignments beyond the added peak will be moved back to the previous peak (see
Reassigning molecular weights in a standard track, page 1-85, if you want to move the
assignments back to the original peaks).
1-62
GeneTools User Manual
How to locate and edit peaks on a track
Adding a peak manually
Note
You can only add peaks when the tracks are locked.
To add a peak manually by specifying the position of its bounds:
1 In the Image pane, click on the track to select it.
2 In the Profile pane, move the pointer over the position where you want to
place the first peak bound (it may help to magnify the display first):
3 Drag to the position you want to place the other peak bound:
GeneTools User Manual
1-63
Using GeneTools for Gel analysis
4 Drop the bound in position:
The peak bounds will be added with the peak shown in the position detected
by the program.
5 If necessary, adjust the position of the peak and its bounds.
Notes
You cannot add a peak within the bounds of another peak. Double-clicking inside an
existing peak has the effect of deleting the existing peak and placing a new peak at the
position clicked, with the bounds again set to the neighboring local minima.
If the track has been defined as a molecular weight standard and has already had
molecular weights assigned to the peaks, any assignments to peaks with higher peak
numbers will be reassigned. This will probably affect the molecular weight calculations
for other tracks. Molecular weight assignments are to the peak number, so when you
add a peak, the peak numbers of all later peaks will be increased by one, so, in effect,
all assignments beyond the added peak will be moved back to the previous peak (see
Reassigning molecular weights/quantities in a standard track, page 1-85, if you want to
move the assignments back to the original peaks).
Selecting peaks
You can select peaks using:
●
The Image pane in the Gel window (this allows you to a select a single peak only)
or
●
1-64
The Profile pane in the Gel window (this allows you to a select a single peak or
several neighboring peaks).
GeneTools User Manual
How to locate and edit peaks on a track
Note
You can only select peaks when the tracks are locked.
To select a peak in the Image pane:
1 If peak markers are not already displayed on the tracks, choose Peak markers
from the View menu – the command is checked in the menu when peak
markers are displayed.
2 Click near the peak in the track (if the peaks are close together, it may help to
magnify the display before trying to select the peak):
The peak and bounds will appear in the Profile pane in the colors chosen (using
Configuration in the Extras menu – see page 8-143) for selected bounds and peaks:
Note
If you right-click, you will select the peak and display a pop-up menu for carrying out
operations on the peak with one action.
The peak whose boundary is closest to the point you clicked will be selected – note
that since the peak markers on the track show the positions of the peaks and not the
GeneTools User Manual
1-65
Using GeneTools for Gel analysis
boundaries this does not necessarily mean the peak whose marker is closest to the point
you clicked.
Note
Selecting the peak also selects the track if it was not already selected.
To select a peak in the Profile pane:
1 In the Gel window’s Image pane, click in the track containing the peak to
select it.
2 In the Profile pane, click on the peak itself, or anywhere within the peak
bounds (if the peaks are close together, it may help to magnify the display
before trying to select the peak):
or
Note
You can right-click on a peak to select it and display a pop-up menu for carrying out
operations on the peak with one action.
When the peak is selected the peak bounds and peak marker will appear in the colors
chosen for selected bounds and peaks.
Note
If you click outside the bounds of any peak, no peak will be selected and any
previously selected peak will be deselected.
To select several neighboring peaks:
1 In the Image pane, click in the track containing the peak to select it.
1-66
GeneTools User Manual
How to locate and edit peaks on a track
2 In the Profile pane, click anywhere within the peak bounds of the peak at
one end of the range of peaks that you want to select:
Note:
If you click outside the bounds of any peaks you will drag out a new peak instead of
selecting peaks.
3 Drag down to the peak at one end of the range of peaks that you want to
select. As you drag through the peaks they will change color to show that they
will be selected.
Deleting peaks
Note
You can only delete peaks when the tracks are locked.
To delete all the peaks from all tracks (in the selected area of interest):
Choose All peaks on all tracks from the Peak®Delete submenu.
GeneTools User Manual
1-67
Using GeneTools for Gel analysis
To delete all the peaks from a track:
1 Click in the track from which you want to delete the peaks to select it.
2 Choose All peaks on selected track from the Peak®Delete submenu.
To delete one or more selected peaks from a track:
1 Select the peak(s) that you want to delete.
2 Choose Selected peak(s) from the Peak®Delete submenu.
or, if you used right-click to select the peak, choose Delete from the pop-up
menu.
Note
If the track has been defined as a molecular weight standard and has already had
molecular weights assigned to the peaks, any assignments to peaks with higher peak
numbers will be reassigned and will have an effect on molecular weight calculations for
other tracks. Molecular weight assignments are to the peak number, so when you delete
a peak, the peak numbers of all later peaks will be reduced by one, so, in effect, all
assignments beyond the deleted peak will be moved on to the next peak (see
Reassigning molecular weights/quantities in a standard track, page 1-85, if you want to
move the assignments back to the original peaks).
Adjusting the position of a peak
Note
You can only move peaks when the tracks are locked.
To adjust the position of a peak:
1 If necessary, adjust the peak bounds – see page 1-70 (you can only adjust the
peak position within the peak bounds).
1-68
GeneTools User Manual
How to locate and edit peaks on a track
2 In the Profile pane, move the pointer over the peak (it may help to magnify
the display first) – the pointer will change to a double-headed arrow:
3 Drag the peak to the new position:
4 Drop the peak in the new position:
GeneTools User Manual
1-69
Using GeneTools for Gel analysis
Note
If you have two adjacent peaks with abutting bounds, and move both peaks to the
common bound, the peaks will be merged into a single peak with the outer bounds
from the merged peaks. If the track is a molecular weight standard track, this may have
an effect on molecular weight assignments – see the notes in Deleting peaks (page 1-67)
for more details.
Adjusting the position of a peak’s bounds
Note
You can only move peak bounds when the tracks are locked.
To adjust a peak’s bounds:
1 In the Profile pane, move the pointer over the bound you want to move (it
may help to magnify the display first) – the pointer will change to a
double-headed arrow:
2 Drag the bound to its new position:
1-70
GeneTools User Manual
How to locate and edit peaks on a track
3 Drop the bound in its new position:
Displaying peak properties
To display properties of the selected peak:
1 Choose Properties from the Peak menu to display the Peak properties dialog
box:
This dialog box is read-only.
●
Peaks are numbered in the electrophoresis direction.
GeneTools User Manual
1-71
Using GeneTools for Gel analysis
●
The Rf position of the peak is given by:
Distance along the track from Rf start line
.
Distance along the track between the Rf start and End lines
2 Press OK to close the dialog box.
How to determine molecular weights and quantities
There are three main steps in determining the molecular weights and/or quantities
represented by the peaks on a gel:
A Set the molecular weight and/or quantity calibration methods. For details, see:
●
Setting the quantity calibration method, next section
●
Specifying how molecular weights are calculated from standard tracks,
page 1-75.
B Calibrate the sample by assigning molecular weight and/or quantity values to
known peaks on the gel.
For quantities, you do this:
●
by assigning quantities to individual peaks on tracks – see Creating quantity
calibrations without using standard tracks, page 1-76
and/or
●
by defining quantity standard tracks – see Determining molecular
weights/quantities using standard tracks, page 1-79.
For molecular weights, you do this:
●
by defining molecular weight standard tracks – see Determining molecular
weights/quantities using standard tracks, page 1-79.
C Display the results. For details, see:
●
1-72
Viewing molecular weight and quantity results, page 1-87.
GeneTools User Manual
How to determine molecular weights and quantities
Setting the quantity calibration method
To set or view the calibration method and units for quantity determinations:
1 If more than one area of interest has been defined on the sample, click in the
area for which you want to set the quantity calibration method – you can set
independent quantity calibration methods for each area of interest.
2 Choose Quantity calibration from the Edit menu to display the Quantity
calibration dialog box:
(You can also display this dialog box by pressing Edit quantity calibration in
the Assign molecular weight/quantity dialog box – see Assigning molecular
weights/quantities to a standard track, page 1-79.)
●
If there is only one area of interest defined on the sample, or you want to
set the calibration for the selected area of interest independently, go to
Step 3.
●
If more than one area of interest has been defined on the sample and you
want to use the calibration defined in one of the other areas for the
selected area of interest, go to Step 6.
3 Click on a radio button to decide whether:
●
the same calibration curve should be used for All tracks
●
Each track should have its own calibration curve.
GeneTools User Manual
1-73
Using GeneTools for Gel analysis
4 Choose the shape of calibration curve(s) from the drop-down list box. You can
choose:
Note
●
Linear through origin (single standard value)
●
Linear (multiple standard values)
●
Linear through origin (multiple standard values)
●
Quadratic
●
Quadratic through origin.
If you select Linear through origin (single standard value) the calibration curve is
drawn through the origin and the last calibration point you have added – in other
words, since this is a single point calibration, adding a new calibration point replaces
the previous one. For the other types of curve, the calibration curve is drawn as the best
fit for all the (relevant) calibration points – adding a new calibration point contributes to
(and does not replace) the calibration from any previous points.
Once you have assigned quantities to peaks, the calibration curve will be
shown in the Quantity calibration tab in the Gel window’s Graphics pane –
see The quantity calibration graph, page 1-89, for more details.
5 Enter your own quantity units in the Units box.
Go to Step 7.
6 If more than one area of interest has been defined on the sample and you
want to use the calibration defined in one of the other areas for the selected
area of interest:
a Check Use another track set as standard.
b Choose the area of interest whose calibration you want to use from the
Track set drop-down list box.
7 Press OK to confirm your selections and close the dialog box.
See Creating quantity calibrations without using standard tracks, page 1-76, and
Determining molecular weights/quantities using standard tracks, page 1-79, for how to
calibrate a gel for quantity measurements.
1-74
GeneTools User Manual
How to determine molecular weights and quantities
Specifying how molecular weights are calculated from standard tracks
Note
You cannot apply a molecular weight calibration outside its area of interest, or combine
molecular weight calibrations from different areas of interest. If you have defined more
than one area of interest on the sample, you will need to use separate molecular weight
standard tracks and create a separate molecular weight calibration for each area. You
will also need to specify how molecular weights are calculated in each area of interest.
To specify how molecular weights are calculated from standard tracks (in the selected
area of interest):
1 Choose Molecular weight calibration from the Edit menu to display the
Molecular weight calibration dialog box:
(You can also display this dialog box by pressing Edit calibration in the Assign
molecular weight/quantity dialog box – see Assigning molecular weights/
quantities to a standard track, page 1-79.)
2 Click on a radio button to choose the shape of calibration curve to use for
calculating molecular weights.
●
Log-linear fit means the best logarithmic curve fit for all points – the curve
may not pass through all the calibration points.
●
Log piecewise linear means a logarithmic curve is drawn between
adjacent points – the curve will pass through all the calibration points but
may not be smooth at those points.
GeneTools User Manual
1-75
Using GeneTools for Gel analysis
Once you have assigned molecular weights to peaks, the calibration curve will
be shown in the MW Calibration tab in the Gel window’s Graphics pane –
see The molecular weight calibration graph, page 1-88, for more details.
3 Click on a radio button to choose whether distance along the track should be
measured From start of track or From Rf baseline.
4 Choose how to calculate molecular weights on a track if there is more than
one standard track.
In the Propagation box you can choose:
●
Use nearest standard, to use the standard track nearest to the track
●
Combine all standards, to calculate a molecular weight from all the
standards and then take the average
●
Interpolate between standards, to interpolate the calibrations from the
two adjacent tracks.
5 Press OK to save the new settings and close the dialog box.
See Determining molecular weights/quantities using standard tracks, page 1-79, for how
to calibrate a gel for molecular weight measurements.
Creating quantity calibrations without using standard tracks
In order to determine quantities from the tracks on a sample, you must first calibrate
the sample by assigning quantities to peaks in the sample to create one or more
calibration curves.
This section describes how to calibrate the quantities on a gel without defining standard
tracks; see Determining molecular weights/quantities using standard tracks, page 1-79,
for how to create a molecular weight/quantity calibration by defining one or more
standard tracks.
The quantity calibration method determines how the quantities for other peaks are
calculated from the quantities you assign to known peaks – see Setting the quantity
calibration method, page 1-73, for details.
1-76
GeneTools User Manual
How to determine molecular weights and quantities
Assigning quantities to peaks
Note
You can only assign quantities to peaks when the tracks are locked – see Locking tracks,
page 1-25).
To assign a quantity to a peak in a track:
1 Select the peak to which you want to assign a quantity.
Note
For Linear through origin (single standard value), the calibration uses a single peak
assignment (the most recent). For the other types of curve, the calibration curve is
drawn as the best fit for all the (relevant) calibration points – adding a new calibration
point contributes to (and does not replace) the calibration from any previous points –
see Setting the quantity calibration method, page 1-73, for how to choose the type of
calibration curve.
2 Choose Assign quantity from the Peak menu (or the pop-up menu displayed
when you right-click on the peak) to display the Assign calibrated quantities
dialog box:
Note
You can also display this dialog box by pressing Assign quantity to peak in the Manual
page of the Assign molecular weight/quantity dialog box – see Assigning quantities to
individual peaks on a standard track, page 1-83.
●
The Peak box is read-only: it shows which peak was selected when you
opened the dialog box.
●
The Raw volume box is read-only: it shows the uncalibrated volume
calculated from the area of the peak.
GeneTools User Manual
1-77
Using GeneTools for Gel analysis
●
The Calibrated quantity box shows the quantity calculated using the
existing calibration, if there is one, and 0 if there isn’t.
●
The radio buttons are disabled if you have chosen to use a single
calibration curve for all tracks – see Setting the quantity calibration
method, page 1-73.
3 Enter a quantity in the Calibrated quantity box to add a new calibration
point to the calibration curve for the selected peak.
4 If you have chosen to use a single calibration curve for all tracks, click on:
●
No propagation if you do not want this quantity assignment applied to
any other tracks.
●
Click on Propagate by peak number to apply this quantity assignment to
the same peak number on all other tracks.
●
Click on Propagate by Rf to apply this quantity assignment to peaks with
the same Rf (within the given Tolerance) on all other tracks.
And:
Enter a figure in the Tolerance box to specify how close the Rf of a peak
on another track has to be to the Rf of the selected peak for it to be
assigned the quantity calibration.
When you have assigned quantities to peaks, the peak markers on the track in the
Image pane will have a mark on them to show that they have been assigned a quantity
(and/or molecular weight):
1-78
GeneTools User Manual
How to determine molecular weights and quantities
Determining molecular weights/quantities using standard tracks
You can use molecular weight/quantity standard tracks to calibrate gels to determine the
molecular weights and quantities represented by the peaks on other tracks on the gel.
Having defined one or more tracks as a molecular weight and/or quantity standard, you
then assign molecular weights and/or quantities to peaks in these tracks to create
molecular weight and/or quantity calibration curves.
Note
This is the only way to calibrate the molecular weight measurements, but for quantities
you can also calibrate the measurements on the gel by assigning known quantities to
individual peaks without defining any quantity standard tracks – see Creating quantity
calibrations without using standard tracks, page 1-76.
Assigning molecular weights/quantities to a standard track
Note
If you have defined more than one area of interest on the gel, you will need to use
separate molecular weight standard tracks and create a separate molecular weight
calibration for each area. You cannot apply a molecular weight calibration outside its
area of interest, or combine molecular weight calibrations from different areas of
interest. For quantities, however, you can set an independent calibration for each area
of interest or choose to use the quantity calibration from a different area of interest –
see Setting the quantity calibration method, page 1-73.
To assign molecular weights and/or quantities to the peaks in a standard track:
1 If you want to assign molecular weights and/or quantities from a molecular
weight standard in a molecular weight library, and the library is not currently
open, choose Open library from the File menu to open it.
2 Click in the required track to select it.
3 Locate the peaks on the track if they haven’t already been located.
4 If necessary, edit the peaks.
(In particular, if you want to assign a set of molecular weights and/or
quantities from a standard, you should remove any spurious peaks to avoid
any values being assigned to them from the standard.)
5 Choose MW/quantity standard from the Track menu (or the pop-up menu
displayed by right-clicking in the track label) to define the track as a molecular
weight standard.
GeneTools User Manual
1-79
Using GeneTools for Gel analysis
The command is checked in the menus and the track is labeled MwS when
the track has been defined as a molecular weight standard (this will change to
QuS if you assign quantities but not molecular weights from a standard or
MQS if you assign molecular weights and quantities).
The Assign molecular weight/quantity dialog box will be displayed open at
the From standard page:
Arrow buttons to select
the track peak
Standards drop-down list
Details of selected standard
Note
This section is concerned with using the Assign molecular weight/quantity dialog box
to assign molecular weights and/or quantities to peaks on standard tracks. However, it
also allows you to change the way molecular weights and/or quantities are calculated
from molecular weight/quantity standard tracks (see Specifying how molecular weights
are calculated from standard tracks, page 1-75, and Setting the quantity calibration
method, page 1-73, for details). The Edit standard page also allows you to create or
edit a molecular weight standard in a library (see Creating a new molecular weight/
quantity standard, page 1-100, and Editing a molecular weight/quantity standard in a
library, page 1-102).
The Selected peak box is read-only and shows the number of the selected peak (you
can select another peak using the arrow buttons). The Calculated MW box is also
read-only and will show the molecular weight of the selected peak calculated using any
other molecular weights you have entered and the peak position – it will show 0 if you
have not entered enough data to calculate a molecular weight.
1-80
GeneTools User Manual
How to determine molecular weights and quantities
The list box shows the contents of the standard selected in the Standards drop-down list
box above it. Standards may contain molecular weight assignments, quantity
assignments or molecular weight and quantity assignments for each peak (there are no
quantity assignments in the standard selected in the example picture).
This dialog box allows you to assign molecular weights and/or quantities from a
standard, or, using the Manual page, assign molecular weights and/or quantities to
individual peaks manually (see the following sections for instructions).
Note
Molecular weight calculations are more accurate for peaks lying within the range of the
calibration standard, where they are calculated by interpolation, rather than outside,
where they are calculated by extrapolation.
When you have assigned molecular weights/quantities to peaks, the peak markers on
the track in the Image pane will have a mark on them to show that they have been
assigned a molecular weight and/or quantity:
Assigning molecular weights/quantities from a molecular weight standard
To assign molecular weights and/or quantities from a molecular weight standard library
(see Working with molecular weight libraries, page 1-92, for more information about
creating and editing molecular weight libraries):
1 If the Selected peak box does not show the peak corresponding to the first
molecular weight/quantity in the standard, use the arrow buttons to select that
peak.
2 Choose the required standard from the Standards drop-down list.
The list box below the Standards drop-down list will show the peak number
and the molecular weights and/or quantities for the standard.
GeneTools User Manual
1-81
Using GeneTools for Gel analysis
3 Press Assign from standard.
Assigning molecular weights to individual peaks on a standard track
To assign molecular weights to individual peaks manually:
1 Click on the Manual tab to display the Manual page:
2 If the Selected peak box does not show the peak to which you want to assign
a molecular weight, use the arrow buttons to select it.
3 Enter the molecular weight that you want to assign in the Assigned MW box.
4 Press Assign value to peak.
The Selected peak box will show the next peak, ready for you to assign the
next molecular weight.
5 Repeat Steps 2–4 for any other molecular weights that you want to assign.
1-82
GeneTools User Manual
How to determine molecular weights and quantities
Assigning quantities to individual peaks on a standard track
To assign quantities to individual peaks on a standard track manually:
1 Click on the Manual tab to display the Manual page:
2 If the Selected peak box does not show the peak to which you want to assign
a quantity, use the arrow buttons to select it.
3 Press Assign quantity to peak to display the Assign calibrated quantities
dialog box so that you can assign a quantity to the selected peak. This dialog
box is also displayed when you assign a quantity to a peak on a non-standard
track – see Assigning quantities to peaks, page 1-77, for how to use the dialog
box.
4 Repeat Steps 2 and 3 for any other peaks.
GeneTools User Manual
1-83
Using GeneTools for Gel analysis
Removing molecular weight and quantity assignments from peaks
Note
You can only remove molecular weight and quantity assignments when the tracks are
locked.
To remove a single molecular weight assignment from a peak in a standard track:
1 Select the peak for which you want to unassign a molecular weight.
2 Choose Unassign molecular weight from the Peak menu (or, if you
right-click to select the peak, choose the same command from the pop-up
menu).
Or
1 Choose Molecular weight from the View menu or click on the MW
Calibration tab in the Graphics pane to display molecular weights in the Peak
value pane.
2 Right-click on the molecular weight assignment in the Peak value pane to
select it and pop up a menu.
3 Choose Delete from the pop-up menu.
To remove a single quantity assignment from a peak in any track:
1 Select the peak for which you want to remove the quantity assignment.
2 Choose Unassign quantity from the Peak menu (or, if you right-click to select
the peak, choose the same command from the pop-up menu).
To remove all molecular weight and quantity assignments from the peaks in a standard
track:
1 Click in the required track to select it.
2 Choose MW/quantity standard from the Track menu (or the pop-up menu
displayed by right-clicking in the track label) so that the track is no longer
defined as a molecular weight/quantity standard.
3 If required, choose MW/quantity standard again to redefine the track as a
molecular weight/quantity standard with different assignments.
1-84
GeneTools User Manual
How to determine molecular weights and quantities
Note
When you assign all the molecular weights from a standard in a molecular weight
library, any previous assignments are removed: see Assigning molecular
weights/quantities to a standard track (page 1-79) for details.
Reassigning molecular weights/quantities in a standard track
In order to determine molecular weights and quantities on gels, you can define one or
more tracks as molecular weight/quantity standards and assign molecular
weights/quantities to peaks in each of those tracks: see Determining molecular
weights/quantities using standard tracks (page 1-79) for details.
GeneTools allows you to reassign the assigned molecular weights or quantities to other
peaks in the track at a later time. This may be necessary, for example, if you add or
delete peaks in the standard track, or if you forget to delete a spurious peak before
assigning all of the molecular weights/quantities in a molecular weight library standard.
Note
For quantities, you can only reassign values assigned from standards – you cannot
reassign quantities assigned manually to peaks on standard tracks or to peaks on
non-standard tracks. For these cases you would need to unassign the quantity assigned
to the existing peak and then assign it to the new peak.
To reassign molecular weights/quantities in a molecular weight standard track:
1 In the Image pane, click in the required track to select it.
Note
You can only reassign molecular weights/quantities when the tracks are locked.
2 In the Gel window’s Graphics pane, click the MW calibration tab to reassign
molecular weights; click the Quantity calibration tab to reassign quantities.
GeneTools User Manual
1-85
Using GeneTools for Gel analysis
3 In the Peak value pane, click on the molecular weight/quantity that you want
to reassign to select it:
4 Drag the molecular weight/quantity to its new position.
As you are dragging, you will see two new lines in the pane, the first under
the pointer, the second snapping to the peak that the molecular
weight/quantity would be reassigned to if you dropped it:
1-86
GeneTools User Manual
How to determine molecular weights and quantities
5 Drop the molecular weight/quantity in its new position.
Note 1
As in the example above, the assignments of later peaks will change in line with the
reassignment of the selected peak.
Note 2
If the reassignment makes any of the other assignments inconsistent (molecular weights
must decrease as peak number increases), the other assignments will be removed.
Viewing molecular weight and quantity results
When you have calibrated (an area of interest on) a gel for molecular weights/quantities,
(see Determining molecular weights/quantities using standard tracks, page 1-79, and
Creating quantity calibrations without using standard tracks, page 1-76) you can view:
●
the molecular weight calibration curve in the MW calibration page in the Gel
window’s Graphics pane – see the next section, The molecular weight calibration
graph
●
the quantity calibration curve in the Quantity calibration page in the Gel window’s
Graphics pane – see The quantity calibration graph, page 1-89
●
the molecular weights/quantities for the selected track in the Peak value pane when
Molecular weight/Quantities is selected in the View menu – see Viewing molecular
weight or quantity results in the Peak value pane, page 1-90
●
the molecular weights and quantities in the Results pane – see Viewing molecular
weight and/or quantity results in the Results pane, page 1-91
GeneTools User Manual
1-87
Using GeneTools for Gel analysis
The molecular weight calibration graph
The molecular weight calibration graph for the selected area of interest on the sample is
displayed in the Gel window’s Graphics pane:
You can choose the shape of the calibration curve, how the calibration should be
propagated to other tracks and the origin for distance measurements along the track –
see Setting the quantity calibration method, page 1-73, for details.
When a molecular weight standard track is selected in the Image pane, the calibration
points are shown on the graph (as in the example).
When you display the molecular weight calibration graph, the Peak value pane displays
molecular weights for the peaks on the track selected in the Image pane.
You can choose whether to plot the calibration curve using a linear or logarithmic scale
– see Configuration (Molecular Weight page) in the Extras menu – page 8-139).
You create the calibration graph by assigning molecular weights to one or more peaks in
one or more tracks – see Determining molecular weights/quantities using standard tracks,
page 1-79, for details.
1-88
GeneTools User Manual
How to determine molecular weights and quantities
The quantity calibration graph
The quantity calibration graph for the selected area of interest is displayed in the Gel
window’s Graphics pane.
You can choose the shape of the calibration curve, how the calibration should be
propagated to other tracks and the quantity units to use – see Setting the quantity
calibration method, page 1-73, for details.
The equation of the line or curve is shown in the Raw volume axis label along with the
correlation coefficient R, which is a measure of how well the calibration points can be
fitted by a line or quadratic curve, depending on the selected calibration method (a
value of 1 means a perfect fit). The example shows a quadratic calibration; the
calibration points don’t quite lie on the curve so the R value is slightly less than 1.
The graph shows data points for all the calibration peaks (in the selected region of
interest), not just the calibration peaks on the selected track. The graph also shows any
non-calibration peaks in the selected track. Calibration data points are marked by ;
non-calibration points by . By definition, non-calibration points always lie on the
calibration curve; calibration points may not lie exactly on the calibration curve.
When you display the quantity calibration graph, the Peak value pane displays
quantities for the peaks on the track selected in the Image pane.
GeneTools User Manual
1-89
Using GeneTools for Gel analysis
You create the calibration graph by assigning quantities to one or more peaks in one or
more tracks – see Determining molecular weights/quantities using standard tracks,
page 1-79, and Creating quantity calibrations without using standard tracks, page 1-76,
for details.
Viewing molecular weight or quantity results in the Peak value pane
Once you have calibrated a sample for molecular weights and/or quantities, you can
view the results calculated for other peaks in the Peak value pane.
To view the molecular weights or quantities calculated for peaks on a track:
1 Choose Molecular weight or Quantities from the View menu.
2 Click in the track for which you want to view results.
The results for the selected track will be shown in the Peak value pane.
1-90
GeneTools User Manual
How to determine molecular weights and quantities
Viewing molecular weight and/or quantity results in the Results pane
To view the results for all tracks (in the selected area of interest):
1 Click on the Results for all tracks tab in the Results pane to display a table
including results for each peak in each track:
(See Step 2 for how to choose which results to display in the table)
The Number identifies each located peak on the track – the peaks are
numbered in the electrophoresis direction.
2 To choose what details to include in the results, right-click on the Results pane
to pop up a menu. The commands on this menu allow you to choose
whether or not to include a column for the corresponding parameter in the
table. The commands are checked in the menu when the columns are
displayed.
3 To make the Results pane fill the Gel window, right-click on the Results pane
to pop up a menu. Choose Maximize pane (or choose the same command
from the View menu).
GeneTools User Manual
1-91
Using GeneTools for Gel analysis
To view a results table for one track only:
1 Click on the track in the Image pane to select it.
2 Click on the Results for selected track tab to display a table including the
molecular weights for each peak:
3 You can maximize the pane and choose what details to display in the same
way as for the Results for all tracks tab.
Note
In the Results pane tables, molecular weight and calibrated quantity results are shown in
red for peaks that have been assigned a value to show that they are calibration peaks.
Working with molecular weight libraries
A molecular weight library is a collection of molecular weight/quantity standards. Each
standard lists the molecular weights and/or quantities for a set of peaks. You use the
library to calibrate a gel by assigning one of the standards contained in the library to
one or more standard tracks in the gel. If you use the same standard solution for
different gels, using a molecular weight library saves you entering the molecular
weights/quantities individually for each peak in the standard tracks.
When you open GeneTools, the default molecular weight library is opened
automatically – see Setting the default molecular weight library, page 1-98, for how to
specify the default library.
You can open previously saved molecular weight libraries or create new ones. You can
create as many different molecular weight libraries as you wish, though in many
circumstances you will find that one will be sufficient. However, you can only have one
library open at a time – opening a new library closes the currently open one.
1-92
GeneTools User Manual
How to determine molecular weights and quantities
The Molecular weight library window
Molecular weight libraries can be viewed and edited in the Molecular weight library
window:
In this example, the library MwLibrary.mwl contains two standards added by the user
(1 Cal test containing quantities only and 10 Cal test containing quantities and
molecular weights) in addition to the molecular weight standards 100bp ladder, 1kb
ladder, BRL-100bp, BRL-10bp etc, which are supplied with GeneTools.
You can expand or contract the display of each standard in the window to show or hide
its list of peak values. For example, the display of 100bp ladder is expanded in the
picture above, but 1kb ladder is contracted.
To expand the display of a standard:
Click on the + to the left of the standard’s name.
GeneTools User Manual
1-93
Using GeneTools for Gel analysis
To contract the display of a standard:
Click on the - to the left of the standard’s name.
When you start up the program, the Molecular weight library window is opened
automatically showing the default Molecular weight library (see Setting the default
molecular weight library, page 1-98, for how to specify the default library), but you can
also use it to create a new library or to open a previously saved library.
Closing the Molecular weight library window
To close the Molecular weight library window:
1 Click in it or choose it from the Window menu to select it.
2 Choose Close from the File menu.
Clicking on the close button at the top right-hand corner of the Molecular weight library
window only minimizes the window.
Creating a new molecular weight library
To create a new molecular weight library:
Choose New library from the File menu.
If the Molecular weight library window is open and you have any unsaved changes, you
will be asked if you want to save them before the library is closed. The Molecular
weight library window will then be reopened with a new empty library for you to create
new molecular weight/quantity standards – see Creating a new molecular weight/
quantity standard, page 1-100.
You can associate text with a molecular weight library to document it – see the next
section.
Once you have created the new standard(s) you can save the new molecular weight
library – see Saving a molecular weight library, page 1-96.
1-94
GeneTools User Manual
How to determine molecular weights and quantities
Setting and viewing properties of a molecular weight library
To set or view properties associated with a molecular weight library:
1 Open the library if it is not already open.
If the library is already open, click in the Molecular weight library window or
choose it from the list at the bottom of the Window menu to select it.
2 Choose Properties from the File menu to display the Library properties
dialog box:
●
The Date created and Date modified boxes are read-only and show the
dates on which the library was created and last modified.
●
The Author and Name boxes can be edited provided the molecular
weight library is unlocked – see Locking and unlocking molecular weight
libraries, page 1-99.
3 Enter text in the Author and Name boxes to document the molecular weight
library.
4 Press OK to close the dialog box.
5 Choose Save from the File menu to save the new properties.
GeneTools User Manual
1-95
Using GeneTools for Gel analysis
Saving a molecular weight library
To save a molecular weight library with a new name:
1 Click in the Molecular weight library window or choose it from the list at the
bottom of the Window menu to select it.
2 Choose Save as from the File menu to display a standard Windows Save As
dialog box:
3 Use the dialog box to select a folder in which to save the molecular weight
library.
4 Enter a File name for the molecular weight library.
5 Press Save to save the library in the file.
To save a previously saved molecular weight library using the same name:
1 Click in the Molecular weight library window or choose it from the list at the
bottom of the Window menu to select it.
2 Choose Save from the File menu. If the molecular weight library has not been
saved previously, the Save As dialog box will be displayed so that you can
enter a name: see above.
1-96
GeneTools User Manual
How to determine molecular weights and quantities
Note
Saving a molecular weight library does not set it as your default molecular weight
library, so it will not be reopened when you next start up GeneTools. See Setting the
default molecular weight library, page 1-98, for how to specify the default molecular
weight library.
Opening a molecular weight library
To open a molecular weight library:
1 Choose Open library from the File menu to display a standard Windows
Open dialog box:
2 Use the dialog box to select the required molecular weight library file.
3 Press Open.
The library will be opened in the Molecular weight library window.
Note
Opening a molecular weight library does not set it as your default molecular weight
library, so it will not be reopened when you next start up GeneTools. See Setting the
default molecular weight library, page 1-98, for how to specify the default molecular
weight library.
GeneTools User Manual
1-97
Using GeneTools for Gel analysis
Setting the default molecular weight library
To specify the default molecular weight library:
1 Choose Configuration from the Extras menu to display the Configuration
dialog box.
2 Click on the Molecular Weight tab to display the Molecular Weight page:
The File name box shows the path and name of the file containing the
default molecular weight library, which you can use for assigning standard
molecular weights to standard tracks.
3 Enter the path and name for the new default molecular weight library in the
File name box, or press Browse to display a standard Windows Open dialog
box so that you can choose the new file.
Note
1-98
You can also click on a radio button in this page of the dialog box to choose whether
the calibration graph shown in the MW calibration tab in the Graphics pane should
have a Linear or Logarithmic scale.
GeneTools User Manual
How to determine molecular weights and quantities
Locking and unlocking molecular weight libraries
You can lock molecular weight libraries to prevent them being edited.
To lock a molecular weight library:
1 Open the library if it is not already open.
If the library is already open, click in the Molecular weight library window or
choose it from the list at the bottom of the Window menu to select it.
2 Choose Lock from the File menu.
(The command will become disabled in the menu and Unlock will become
enabled.)
3 Choose Save from the File menu to save the locked status of the file.
While the library is locked, the commands for editing it in the Edit menu and the
pop-up menu displayed when you right-click in the Molecular weight library window
are disabled.
You can protect the library further by setting a password, which will be required to
unlock the library – see Setting a password for a molecular weight library, page 1-100.
To unlock a molecular weight library:
1 Open the library if it is not already open.
If the library is already open, click in the Molecular weight library window or
choose it from the list at the bottom of the Window menu to select it.
2 Choose Unlock from the File menu to display the Enter password dialog
box:
GeneTools User Manual
1-99
Using GeneTools for Gel analysis
3 Enter the Password (if any) and press OK (see the next section for setting a
password) – just press OK if no password is set.
You will be told if the password is incorrect.
When the library is unlocked, Unlock will become disabled in the menu and Lock will
become enabled.
Setting a password for a molecular weight library
To set or change the password for a molecular weight library:
1 Open the library if it is not already open.
If the library is already open, click in the Molecular weight library window or
choose it from the list at the bottom of the Window menu to select it.
2 Choose Change password from the File menu to display the Change
password dialog box:
3 Enter the Old password – the characters will be shown as * for security.
4 Enter the New password – the characters will be shown as * for security.
5 Enter the new password again in the Confirm new box to check that you
typed it correctly.
6 Press OK to set the new password and close the dialog box.
Creating a new molecular weight/quantity standard
You can only create a new molecular weight standard if the library is unlocked – see
Locking and unlocking molecular weight libraries, page 1-99.
To create a new molecular weight/quantity standard in a library:
1 Open the library if it is not already open.
1-100
GeneTools User Manual
How to determine molecular weights and quantities
If the library is already open, click in the Molecular weight library window or
choose it from the list at the bottom of the Window menu to select it.
2 Choose New standard from the Edit menu (or right-click in the window to
display a pop-up menu and choose New) to display the New standard dialog
box:
Note
You can also display this dialog box by pressing New standard on the Edit standard
page of the Assign molecular weight/quantity dialog box.
3 Enter a name for the Standard.
4 Press OK to display the Edit molecular weight standard dialog box:
5 Enter the first Peak number, (ie, 1).
6 Enter its Molecular weight (molecular weights must decrease as peak number
increases) and/or Quantity (there is no restriction on the order of quantities).
GeneTools User Manual
1-101
Using GeneTools for Gel analysis
7 Press Insert. The peak number and associated molecular weight and/or
quantity will appear in the list box at the top of the dialog box.
The Peak number will be increased by 1 ready for you to add the next peak.
8 Repeat Steps 6–7 for the remaining peaks.
9 Press OK to close the dialog box. The new standard will appear in the
Molecular weight library window.
Editing a molecular weight/quantity standard in a library
You can only edit a molecular weight standard if the library is unlocked – see Locking
and unlocking molecular weight libraries, page 1-99.
To edit a molecular weight standard in a library:
1 Open the library if it is not already open.
If the library is already open, click in the Molecular weight library window or
choose it from the list at the bottom of the Window menu to select it.
2 Select the standard in the Molecular weight library window by clicking on the
standard’s name or any of the values in its list.
3 Choose Edit standard from the Edit menu (or right-click on the standard’s
name or any of the peaks in its list to display a pop-up menu and choose
Edit) to display the Edit molecular weight standard dialog box:
1-102
GeneTools User Manual
How to determine molecular weights and quantities
Note
You can also display this dialog box from the Edit standard page of the Assign
molecular weight/quantity dialog box – select the standard you want to edit in the
drop-down list box and press Edit standard.
The list box shows the peaks and the molecular weights/quantities assigned to
them in the standard.
To change a peak in the standard:
1 Select the peak you want to change by clicking on it in the list of values. The
peak number, molecular weight and quantity will be shown in the Peak
number, Molecular weight and Quantity boxes.
2 Change the Peak number and/or Molecular weight and/or Quantity as
required.
3 Press Change.
To add a new peak to the standard:
1 Enter the Peak number (it must be different from any existing peak numbers).
2 Enter the Molecular weight (molecular weights must decrease as peak
number increases) and/or Quantity (there is no restriction on the order of
quantities).
3 Press Insert.
To delete a peak from the standard:
1 Select the peak you want to delete by clicking on it in the list of peaks. The
peak number, molecular weight and quantity will be shown in the Peak
number, Molecular weight and Quantity boxes.
2 Press Delete.
GeneTools User Manual
1-103
Using GeneTools for Gel analysis
Renaming a standard in a molecular weight library
You can only rename a molecular weight standard if the library is unlocked – see
Locking and unlocking molecular weight libraries, page 1-99.
To rename a molecular weight standard in a library:
1 Open the library if it is not already open.
If the library is already open, click in the Molecular weight library window or
choose it from the list at the bottom of the Window menu to select it.
2 Select the standard in the Molecular weight library window by clicking on the
standard’s name.
3 Choose Rename standard from the Edit menu (or right-click on the
standard’s name to display a pop-up menu and choose Rename) to display
the Rename dialog box:
4 Edit the name in the New name box.
5 Press OK to close the dialog box.
The standard will appear with the new name in the Molecular weight library window.
Deleting a standard from a molecular weight library
You can only delete a molecular weight standard from a library if the library is unlocked
– see Locking and unlocking molecular weight libraries, page 1-99.
To delete a molecular weight standard from a library:
1 Open the library if it is not already open.
If the library is already open, click in the Molecular weight library window or
choose it from the list at the bottom of the Window menu to select it.
1-104
GeneTools User Manual
How to match peaks on different tracks
2 Select the standard in the Molecular weight library window by clicking on the
standard’s name.
3 Choose Delete standard from the Edit menu (or right-click on the standard’s
name to display a pop-up menu and choose Delete).
How to match peaks on different tracks
Notes
The operations described in this section are only available if you have purchased the
GeneTools Match software option.
This section shows you how to carry out matches between tracks lying within the same
area of interest. However, you can also carry out matches between tracks using the
Profile comparison window (see page 1-117), and in the Profile comparison window
you can carry out matches between tracks in different areas of interest or even on
different gels.
The GeneTools matching software allows you to match:
●
Bands: matching is between the peaks that have been detected on the tracks. All
tracks (in the selected area of interest) are matched to the peaks on a selected
‘matching standard track’ – see Setting a matching standard, page 1-109.
●
Profiles: matching is between the intensity profile of each track against the intensity
profile of each of the other tracks.
See Setting the method and parameters used for matching, page 1-107, for how to
choose which type of matching to use and for how to set the criteria used for matching.
The matching results are updated automatically whenever you carry out an action that
might change the results.
If required, you can edit band matching (but not profile matching) manually – see
Editing matches, page 1-110.
You can view details of the matching results in the Results pane – see Viewing match
results, page 1-112.
GeneTools User Manual
1-105
Using GeneTools for Gel analysis
If you choose Peak matching from the View menu or click on the Dendrogram tab in
the Graphics pane:
●
The Graphics pane shows the dendrogram – see Dendrogram, page 1-115.
●
If you have set Band matching:
●
the Peak value pane shows the positions of the peaks in the active matching
standard.
●
if Match lines is selected in the View menu, the Image pane shows lines joining
the matched peaks (you can use Configuration in the Extras menu to set the
colors of the match lines – see page 8-143):
Note that the match peak selected in the Peak value pane is shown in a different
color.
1-106
GeneTools User Manual
How to match peaks on different tracks
Setting the method and parameters used for matching
You can choose different methods of matching and tolerance values for each area of
interest on the sample.
To set or view the tolerance and method used for matching in the selected area of
interest:
1 Choose Band matching from the Edit menu to display the Matching
parameters dialog box:
2 In the Matching box:
a In the Type box, select Band or Profile to decide whether to match tracks
using the detected bands (peaks) or the intensity profiles.
GeneTools User Manual
1-107
Using GeneTools for Gel analysis
Note
When Profile is selected:
●
There is no need to detect the peaks on the tracks (unless you choose to match on
the basis of molecular weights – see Step c).
●
There is no need to define a matching standard – see next section.
●
The Similarity Coefficient controls in the Matching parameters dialog box are
disabled.
●
The Matching comparisons and Matching matrix pages in the Results pane will be
blank – see Viewing match results, page 1-112.
b If you selected Band in the Type box, select Dice or Jaccard from the
Similarity Coefficient box to choose how the similarity coefficients should
be calculated – see Similarity matrix, page 1-114, for how the similarity
coefficients are defined.
c In the Alignment box, click on a radio button to choose whether matching
should be carried out on the basis of:
●
Position – distance from start of track
●
Rf – relative position between Rf start and end lines on the tracks
●
MW – molecular weight calculated using the molecular weight
calibration curve(s) for the tracks (see How to determine molecular
weights and quantities, page 1-72).
3 Enter a Tolerance figure to set a limit to the accuracy required when
matching peaks (this does not have to be a whole number).
Note
For Profile matching, the Tolerance must be set to a number less than or equal to 1.
4 In the Dendrogram Drawing box:
a Choose whether to use UPGMA or Neighbor Joining as the linkage rule
for the dendrogram – see The dendrogram, page 6-10, for a description of
these linkage rules.
b Check or uncheck Include MW standard(s) to choose whether molecular
weight standard tracks should be included in the dendrogram.
1-108
GeneTools User Manual
How to match peaks on different tracks
5 Press Apply to see the effect of changing the matching parameters without
closing the dialog box; press OK to set the matching parameters and close the
dialog box.
Setting a matching standard
If you choose Band as the matching Type for carrying out matches (see previous
section), the bands (peaks) on each track in an area of interest are matched to the
bands on a specified matching standard in that area of interest. This section shows you
how to set the matching standard.
Note
When you choose Profile as the matching Type, the intensity profile of each track in an
area of interest is matched to each of the other tracks in the area of interest without
reference to any matching standard track. You can select one or more matching
standards, but they will have no effect on the results for profile matching – this is shown
by the fact that none of them will be marked as the active matching standard (see later
in this section).
To make a track a matching standard for the selected area of interest:
1 Click on the track in the Image pane to select it.
2 Choose Matching standard from the Track menu.
Or
1 Right-click on the track’s label in the Track label pane to select it and pop up
a menu.
2 Choose Matching standard from the menu.
The track label will show MS* – the MS means it is a matching standard, the * means it
is the active matching standard (any previous active matching standard will now show
MS to show that it is still a matching standard but no longer the active one).
To make a matching standard the active matching standard:
1 Right-click on the track’s label in the Track label pane to select it and pop up
a menu.
2 Choose Active matching standard from the menu.
GeneTools User Manual
1-109
Using GeneTools for Gel analysis
If you choose Matching standard for a matching standard track, the track will no longer
be a matching standard. If it was the active matching standard, the matching standard (if
any) with the highest track number will become active.
Editing matches
After GeneTools has matched peaks automatically, you may want to reassign, remove or
add matches manually.
Notes
You cannot match peaks in different areas of interest.
You cannot edit profile matching results.
To edit peak matches manually:
1 Make sure Peak matching is selected in the View menu (or, equivalently, that
the Dendrogram page is displayed in the Graphics pane).
Remember, when Peak matching is selected, the Peak value pane shows the
peaks in the active matching standard track, whichever track is selected in the
Image pane – see Step 3.
2 Make sure Match lines is selected in the View menu.
1-110
GeneTools User Manual
How to match peaks on different tracks
3 Click on the (matching standard) peak in the Peak value pane that you want
to match to a peak in another track:
If there are any matches for this peak already, they will be shown in the
Image pane joined by a line in the color defined for the selected matching
peak (see page 8-143 for how to set the color using Configuration in the
Extras menu).
4 In the Image pane, double-click on the peak (in another track) that you want
to match or unmatch to the peak in the active matching standard that you
selected in the previous step:
●
If there is already a match between the peak you double-clicked on and
any peak in the active matching track, it will be removed.
●
Otherwise, if there is already a match between the selected matching peak
and any of the other peaks in the track, it will be moved to the peak you
double-clicked on.
●
Otherwise, the selected matching peak will be matched to the peak you
double-clicked on.
GeneTools User Manual
1-111
Using GeneTools for Gel analysis
Viewing match results
When you have performed a match, the Results pane can show (for the selected area of
interest):
●
matching comparisons – the results for matching peaks on all (enabled) tracks (this is
blank for profile matching)
●
a matching matrix – an overview of which peaks on the active matching standard are
matched on the other tracks (this is blank for profile matching)
●
a similarity matrix – a table showing the correlation between each pair of tracks.
To expand the Results pane to fill the Gel window:
Click in the Results pane and choose Maximize pane from the View menu.
To return the pane to its normal size:
Choose Maximize pane from the View menu again.
Or
Adjust the size of the Gel window.
Matching comparisons
Note
The Matching comparisons page shows band matching results – it is blank when profile
matching is selected.
The Matching comparisons page in the Results pane shows the results for matching
peaks on all (enabled) tracks in the selected area of interest.
To choose what details to include in the results, right-click on the Results pane to pop
up a menu. Apart from the Maximize pane command at the bottom of the menu, the
1-112
GeneTools User Manual
How to match peaks on different tracks
commands on this menu allow you to choose whether or not to include a column for
the corresponding quantity in the table. The commands are checked in the menu when
the columns are displayed.
Note
The results will not be shown for disabled tracks (all tracks except 4, 5 and 6 have been
disabled for the example picture).
Each row in the table corresponds to a peak in the active matching standard, which is
identified by (Reference) in the Table Heading.
For all the other tracks, the results are shown only for any peaks that match tracks in the
active matching standard. In the example picture, peaks 1, 2 and 5 in Track 5, match
the same numbered peaks in the matching standard (Track 4), but in Track 6, while
peak 4 matches peak 4, peak 2 matches peak 3 in the active matching standard.
Molecular weight and quantity results are shown in red if the corresponding peaks have
been assigned a molecular weight or a quantity, respectively.
Matching matrix
Note
The Matching matrix page shows band matching results – it is blank when profile
matching is selected.
The Matching matrix page in the Results pane shows a table identifying which peaks in
the tracks in the selected area of interest match the peaks in the active matching
standard.
Note
The results will not be shown for disabled tracks (all tracks except 3, 4 and 6 have been
disabled for the example picture).
Each row in the table corresponds to a peak in the active matching standard, which is
identified by red Xs in its column.
GeneTools User Manual
1-113
Using GeneTools for Gel analysis
For all the other tracks, an X shows that there is a peak in the track matching a peak in
the active matching standard. The row containing the X identifies which peak in the
active matching standard is being matched. In the example picture, Track 3 has peaks
matching peaks 1 and 4 in the matching standard.
Note
The matching matrix does not identify which peaks in Tracks 3 and 6 are the matching
peaks (the peak numbers refer to the matching standard) – you can look at the
Matching comparisons table to identify the peaks.
Similarity matrix
The Similarity matrix page in the Results pane shows the correlation between each pair
of tracks in the selected area of interest.
Note
The results will be shown for all tracks in the selected area of interest, including any that
are disabled.
The calculation of the similarity coefficients depends on the Type of matching selected
in the Matching parameters dialog box (see Setting the method and parameters used
for matching, page 1-107):
●
Band matching – the Matching parameters dialog box allows you to choose
between two ways of calculating the similarity coefficient for any pair of tracks A
and B:
●
Jaccard:
Number of Matching Peaks
Total Number of Peaks – Number of Matching Peaks
●
Dice:
2 ´ Number of Matching Peaks
Total Number of Peaks
1-114
GeneTools User Manual
How to match peaks on different tracks
Where the ‘Number of Matching Peaks’ means the ‘number of peaks common to A
and B that match to a common peak on the matching standard’, and the ‘Total
Number of Peaks’ means ‘the number of peaks on A + the number of peaks on B
including both matching and non-matching peaks’.
●
Profile matching – the similarity coefficient for any pair of tracks A and B shows the
correlation between the intensity profiles on the two tracks.
Dendrogram
See page 6-10 for some background information about dendrograms.
When you match tracks on a Gel sample, GeneTools automatically creates a
dendrogram and displays it in the Gel window’s Graphics pane. The Matching
parameters dialog box (see Setting the method and parameters used for matching,
page 1-107) allows you to choose between using UPGMA or Neighbor Joining as the
linkage rule for the dendrogram. The choice of linkage rule determines the method
used to calculate the measure of similarity between clusters of similar tracks and affects
the way the dendrogram is displayed. For example:
●
UPGMA
The UPGMA dendrogram is right-aligned and drawn against a scale, which is shown
along the top of the pane.
GeneTools User Manual
1-115
Using GeneTools for Gel analysis
●
Neighbor Joining
The Neighbor-joining dendrogram is not right-aligned and the lengths of the
individual branches are shown on the lines themselves.
If required, you can change the colors used for the Neighbor-joining dendrogram
nodes and leaves – see page 8-143 for details.
For the Neighbor-joining dendrogram, you can also choose which node in the tree
to display at the root of the dendrogram – see the next section.
If the dendrogram is larger than the Graphics pane, you can increase the size of the
pane, scroll the dendrogram to view hidden parts or scale the dendrogram to fit the
Graphics pane.
To scale the dendrogram to fit the Graphics pane:
1 Right-click in the dendrogram to display the dendrogram context menu.
2 Choose Scale to fit.
The dendrogram will be scaled to fit the Graphics pane.
Scale to fit is checked in the dendrogram context menu when autoscaling is selected;
choose the command again to switch autoscaling off.
If you resize the Graphics pane while Scale to fit is selected, the dendrogram will be
rescaled so that it still fills the pane.
1-116
GeneTools User Manual
How to compare peak profiles
Changing the root in a Neighbor-joining dendrogram
To choose a different node to be the root of the dendrogram:
Click on the node in the dendrogram:
The dendrogram will be redisplayed with the selected node at the root:
Note that this only affects the way the tree is displayed – the correlation values and
connectivity of the tree are unaffected.
How to compare peak profiles
This section describes how to use the Profile comparison window. The Profile
comparison window allows you to compare the profiles of selected tracks, which may
be on different gels. Additionally, if you have purchased the GeneTools Match software
option, you can use the Profile comparison window to perform track matching
between tracks, which, unlike the matching procedure described in How to match
GeneTools User Manual
1-117
Using GeneTools for Gel analysis
peaks on different tracks (see page 1-105), may be in the same or different areas of
interest, or even on different gels.
Note
In order to support the matching operations, when the Match software option is
enabled, the Profile comparison window has an additional pane and some additional
commands. However, many of the Profile comparison window operations are the same
as when the Match software option is not enabled, so to avoid repetition, unless they
explicitly say otherwise, the following instructions apply whether the Match software
option is enabled or not.
To compare the profiles on different tracks and/or different gels:
1 If you want to compare profiles in any secure sample files that are not already
open, open them – you can only compare track profiles for tracks in open
secure sample files.
2 Choose Profile comparison from the View menu. The Profile comparison
window will open.
The appearance of the window depends on whether the GeneTools Match
software option is installed:
Match software option not installed
1-118
GeneTools User Manual
How to compare peak profiles
Match software option installed
The Track browser pane (the left-hand pane) shows the path and filenames for
all the open Gel windows and allows you to select which tracks to include in
the comparison.
The Profiles pane (the right-hand pane for systems without the GeneTools
Match software option, as in the example; the center pane for systems with it)
is used to plot the intensity profiles for the selected tracks.
The third pane is the Match results pane (the right-hand pane for systems with
the GeneTools Match software option; absent for systems without it) contains
the similarity matrix and dendrogram tabs showing the matching results.
3 In the Track browser pane, click on the + icon(s) next to the secure sample
file(s) containing the tracks that you want to compare (or double-click
anywhere else in the row)
GeneTools User Manual
1-119
Using GeneTools for Gel analysis
to display the tracks in the file:
(Click on the - icon or double-click again anywhere else in the row to hide
the tracks in the left-hand pane.)
4 Click on the first track that you want to include in the comparison.
5 Choose Show from the Profile menu (or the context menu displayed if you
right-click on the track).
(As an alternative to steps 4 and 5, just double-click on the track.)
Show will be checked in the menu when a profile is shown, a line showing
the color used for drawing the profile will be shown next to the track in the
left-hand pane and the profile will be drawn in the Profiles pane.
(Choosing Show again for the same track, or double-clicking again, removes
the track from the comparison.)
Note
1-120
To include all of the tracks in the comparison, choose Show all from the Profile menu;
to remove all of the tracks from the comparison, choose Hide all from the Profile
menu.
GeneTools User Manual
How to compare peak profiles
6 Repeat Steps 4 and 5 for any other tracks you want to include in the
comparison:
(In the example all the profiles are for tracks on the same gel, but you can use
the same procedure to include tracks from different files in the same
comparison if you wish).
The vertical scale shows the image gray level. The default horizontal scale is
the Rf value from 0 (the Rf start position) to 1 (the Rf end position) (see
Adjusting the Rf start and end positions, page 1-43, for how to set these), but
if you have assigned molecular weights to a standard track, you can also use
(log) molecular weight for the horizontal scale – see the next step.
Note
If you have purchased the GeneTools Match software option, the parameter chosen for
the horizontal scale also determines the alignment used when matching tracks in the
Profile comparison window – see Matching tracks in the Profile comparison window,
page 1-123, for details.
7 To choose whether to use Rf or (log) molecular weight for the horizontal scale
for plotting profiles in the Profile comparison window, choose MW or Rf
from the View®Plot mode submenu.
Note
If you choose MW and have not yet assigned molecular weights to a standard track, the
profile plot will be blank – see Assigning molecular weights/quantities to a standard
track, page 1-79.
GeneTools User Manual
1-121
Using GeneTools for Gel analysis
8 If required, select a track and choose Reference from the Profile menu (or
the menu displayed if you right-click on the track) to highlight one of the
tracks in a comparison as a reference:
Track 4 in the example is the reference track.
Note
If you have purchased the GeneTools Match software option, the reference track will
also be used as the Matching standard track for peak matching comparisons – see
Matching tracks in the Profile comparison window, page 1-123, for details.
If you repeat Step 8 for another track, the new track will become the reference – only
one track in a comparison can be defined as the reference track.
If the track you define as the reference is not already included in the comparison, it will
become shown in the comparison automatically. However, you can then hide it if
required (see Step 5) without it losing the status of being the reference – if you show it
again it will still be the reference, provided you have not chosen another track as the
reference meanwhile.
You can use Configuration in the Extras menu (see page 8-143) to change the colors
and line styles of profiles in the Profile comparison window.
1-122
GeneTools User Manual
How to compare peak profiles
Changing the scale in the Profile comparison window
To increase the horizontal scale in the Profiles pane in the Profile comparison window:
1 If necessary, use the scroll bar to move the point of interest in the profiles to
the middle of the Profiles pane (the scale will be expanded about the center
of the pane).
2 Choose Zoom in from the View menu.
You can only see part of the Rf/MW range when the profile window is zoomed; you
can use the horizontal scroll bar to choose which part of the range to view.
To reduce the horizontal scale in the Profiles pane Profile comparison window:
Choose Zoom out from the View menu.
To remove any magnification from the Profiles pane in the Profile comparison window:
Choose Zoom reset from the View menu.
Matching tracks in the Profile comparison window
Note
The operations described in the section are only available if you have purchased the
GeneTools Match software option.
This section shows you how to use the Profile comparison window to carry out track
matching. You can also carry out track matching using a gel window (see How to match
peaks on different tracks, page 1-105), and the two methods share many features.
However, one difference between the two techniques is that in a Gel window, you can
only match peaks on tracks that lie within the same area of interest, while in the Profile
Comparison window you can match tracks lying in different areas of interest, or even
on different gels. On the other hand, if you match peaks in a Gel window, you can get
more detailed results in the form of the matching comparisons table and the similarity
matrix, and you can edit band (peak) matching results manually.
GeneTools User Manual
1-123
Using GeneTools for Gel analysis
Controlling the way tracks are matched in the Profile comparison window
To control the way tracks are matched in the Profile comparison window:
Choose Parameters from the Matching menu to display the Matching
parameters dialog box:
This dialog box is also used to control matching in Gel windows, and with two
exceptions it is used in exactly the same way. The exceptions are:
●
There is no Include Molecular Wt standard(s) checkbox when it is displayed for
the Profile comparison window – see the next section for how to choose which
tracks are included in the matching.
●
The Alignment radio buttons are disabled – the setting (Rf or MW) is controlled by
the commands in the View®Plot mode submenu, which also set the horizontal axis
of the graphs in the Profiles pane.
See Setting the method and parameters used for matching, page 1-107, for details of the
other settings in the Matching parameters dialog box.
1-124
GeneTools User Manual
How to compare peak profiles
Selecting which tracks to include in a matching
To choose which tracks to include in a matching in the Profile comparison window:
1 In the Track browser pane, click on the first track that you want to include in
the comparison.
2 Choose Include selected in matching from the Matching menu (or the
context menu displayed if you right-click on the track).
(Choosing Include selected in matching again for the same track removes the
track from the matching.)
Notes
To include all of the tracks in the matching, choose Include all from the Matching
menu; to remove all of the tracks from the matching, choose Exclude all from the
Matching menu.
There is no link between ‘showing a track’ in the Profiles pane and including a track in
the matching – tracks can be matched without being shown, and vice versa. The status
of each of the tracks is shown next to the commands in the Profile and Matching
menus when the track is selected and by the icons in the Track browser pane – for
example:
Tracks 1 and 6 are not shown and not included in the matching; Track 2 is shown but
not included in the matching; Track 3 is shown, included in the matching and is the
reference track; Track 4 is shown and included in the matching; and Track 5 is included
in the matching but not shown.
GeneTools User Manual
1-125
Using GeneTools for Gel analysis
Selecting a matching reference track for peak matching
If you choose Band (peak) matching in the Matching parameters dialog box, the peaks
detected on all of the tracks included in the matching are matched to the peaks on a
selected matching reference track.
To select a matching reference track for peak matching:
Select a track in the Track browser pane and choose Reference from the
Profile menu (or the menu displayed if you right-click on the track).
The matching reference track must also be included in the matching (see previous
section) if it is to be used for Band matching – if Band (peak) matching is selected in
the Matching parameters dialog box, you will be reminded if there is no reference
track selected or if the reference track is not included in the matching.
Matching results in the Profile comparison window
The results of carrying out a matching in the Profile comparison window are shown in
the window’s Results pane at the right-hand side of the window. The pane has two
tabs:
●
1-126
Similarity matrix
GeneTools User Manual
How to print and export Gel results
●
Dendrogram
You can work with these results panes in exactly the same way as in the Gel window –
see Similarity matrix, page 1-114, and Dendrogram, page 1-115, for details.
How to print and export Gel results
Printing a report showing Gel results
To print a report showing the results for the selected area of interest on a gel:
1 If you have not already done so, enter your laboratory’s name and a heading
for reports in the General page of the Configuration dialog box (see
page 8-139).
2 Click in the Gel window or choose it from the Window menu to select it.
GeneTools User Manual
1-127
Using GeneTools for Gel analysis
3 Choose Report setup from the File menu to display the Report Setup dialog
box:
Note
If the paper selected for the currently selected printer is less than 150 mm in either
dimension (for example if you are using a video printer), a simplified report containing
the image and some brief identification and image information will be printed. The
settings in the Report setup dialog box have no effect on the content of this simplified
report.
4 Select the check boxes for the items you want to include in the report.
1-128
GeneTools User Manual
How to print and export Gel results
5 Click on the Matching tab to display the Matching page in the Report setup
dialog box:
6 Select the check boxes for the items you want to include in the report.
7 To preview the report before you print it, choose Print preview from the File
menu.
8 Choose Print from the File menu (if you are previewing the report, you can
also press Print in the preview window).
Printing reports – Profile comparisons
To print a report showing Profile comparisons:
1 If you have not already done so, enter your laboratory’s name and a heading
for reports in the General page of the Configuration dialog box – see the
entry for Configuration in the Extras menu in the Menus chapter (page
8-139).
2 Click in the Profile comparison window or choose it from the Window menu
to select it.
GeneTools User Manual
1-129
Using GeneTools for Gel analysis
3 To preview the report before you print it, choose Print preview from the File
menu.
4 Choose Print from the File menu (if you are previewing the report, you can
also press Print in the preview window).
See the entry for Printer Setup in the Menus chapter, page 8-19, for how to select and
set up the printer to use.
Exporting results to Excel
Gel windows
To export results to Excel:
1 Select the results table that you want to export by clicking on its tab in the
Results pane – see page 6-14 for information about the tables that can be
displayed in the Results pane.
2 If you want to change the columns shown in the table, right-click on the table
to display the Results context menu and choose the required parameter to
add to or remove from the table.
3 Repeat Step 2 until the required columns are displayed.
4 Choose Export table to Excel.
Unless you have already exported a table to Excel in the current session, Excel will be
opened and a new workbook created.
The first sheet in the workbook will be named Image document data and will contain
the secure sample’s file name, and data taken from the Information page of the
Sample properties dialog box.
The second sheet in the workbook will contain the exported table and will be named
appropriately.
If you have already exported a table to Excel in the current session:
●
1-130
if the results table selected in the Results pane already exists in the workbook, the
results will be updated
GeneTools User Manual
How to print and export Gel results
●
otherwise, a new sheet will be added for the new table and named appropriately.
Note 1
GeneTools identifies sheets in the workbook by their names. If you rename a sheet and
export the table again, a new sheet will be added for the table and the original sheet
will not be updated.
Note 2
After you have exported a table to Excel in a session, GeneTools maintains a link to the
workbook it created but does not use the name of the workbook to identify it. This
means that you can save the workbook with another name if you wish. However, it also
means that once you have exported a table to Excel, you should leave the workbook
open in Excel until after you have closed GeneTools.
Profile comparison window
To export the data points (Rf and height values) to Excel for a track displayed in the
Profile comparison window (see Profile comparison window, page 6-18, for more
information about the Profile comparison window):
Select a track in the Track browser pane and choose Export to Excel from the
Profile menu (or the menu displayed if you right-click on the track).
Note
Export to Excel is only enabled for tracks that are currently ‘shown’ in the Profile
comparison window.
The data (one data point for each pixel along the track) will be exported to a new
worksheet in Excel, which will be opened if it is not already open.
Saving results in a comma separated values format file
To save results to a comma separated values text file:
1 Select the results table that you want to export by clicking on its tab in the
Results pane.
2 If you want to change the columns shown in the table, right-click on the table
to display the Results context menu and choose the required parameter to
add to or remove from the table.
3 Repeat Step 2 until the required columns are displayed.
GeneTools User Manual
1-131
Using GeneTools for Gel analysis
4 Choose Save table to CSV file to display the Save as CSV File dialog box:
This is a standard Windows Save as dialog box.
5 Use the dialog box to select a folder in which to save the CSV file.
6 Enter a File name for the CSV file.
7 Press Save to save the results in the file.
Creating a report in Word
To create a Word document containing a report showing Gel results for the selected
area of interest:
1 If you have not already done so, enter your laboratory’s name and a heading
for reports in the General page of the Configuration dialog box.
2 Click in the Gel window or choose it from the Window menu to select it.
3 Choose Report setup from the File menu to display the Report setup dialog
box – see page 1-128 for how to use this dialog box.
4 Choose Export to Word from the File menu to open a new Word document
and build the report.
1-132
GeneTools User Manual
How to print and export Gel results
A new Word document will be opened and the report created within it.
Copying a picture of an image to the clipboard
To copy a picture of the image in the Image pane in the current window to the
clipboard:
Choose Save to clipboard from the File menu.
GeneTools User Manual
1-133
Using GeneTools for Gel analysis
1-134
GeneTools User Manual
Using GeneTools for High
Throughput Gel analysis
Most operations you will need to carry out for the analysis of High Throughput Gel
samples are also used for Gel samples – see Getting started with High Throughput Gel
analysis in the GeneTools Getting Started manual for full instructions on the operations
specific to High Throughput Gel samples; see the previous chapter in this manual, Using
GeneTools for Gel analysis, for operations common to High Throughput Gel and Gel
samples.
GeneTools User Manual
2-1
Using GeneTools for High Throughput Gel analysis
2-2
GeneTools User Manual
Using GeneTools for Manual band
quantification
See Getting started with Manual band quantification in the GeneTools Getting Started
manual for full instructions on using GeneTools for Manual band quantification.
GeneTools User Manual
3-1
Using GeneTools for Manual band quantification
3-2
GeneTools User Manual
Using GeneTools for Spot blot
analysis
This chapter contains detailed instructions for using GeneTools for Spot blot analysis.
The chapter begins by describing how you can load sample files and images into
GeneTools. It then shows you how to place spot frames over the spots and change their
sizes and positions – the spot frames are the areas within which GeneTools takes
quantity measurements from the spots on the image.
This is followed by instructions for calibrating the results so that you can measure
quantities from the spots.
The final section in the chapter describes how to use GeneTools to view, print and
export the results.
How to create and work with secure sample files
See File formats, page 1-1, for a description of the secure file format used by
GeneTools.
GeneTools User Manual
4-1
Using GeneTools for Spot blot analysis
Opening a secure sample file
To open a secure sample file:
1 Choose Open from the File menu to display a standard Windows Open
dialog box:
2 Use the dialog box to select the required secure sample file.
3 Press Open.
What happens next depends on whether you are opening an analyzed or unanalyzed
secure sample, and in the latter case on whether you have set Auto import methods in
the Configuration dialog box.
●
If you are opening an analyzed secure sample file:
●
●
If you are opening an unanalyzed secure sample file and you have selected Auto
import methods in the Configuration dialog box:
●
4-2
The sample will be opened in a Spot blot/Manual band quantification window
with all spot frames displayed as they were when the file was last saved. All
previously analyzed results will be shown in the Results table.
The Import method dialog box will open so that you can choose which settings
to import – see Opening or creating a secure sample file with automatic import,
page 4-11, for further details.
GeneTools User Manual
How to create and work with secure sample files
●
If you are opening an unanalyzed secure sample file:
●
The Sample properties dialog box will open with the image loaded:
The controls shown on the General page in the Sample properties dialog box depend
on the Analysis type selected.
1 If required, select Spot blot from the Analysis type drop-down list box – the
default Analysis type is set to Gel when GeneTools is first installed but you
can change this using Configuration in the Extras menu – see page 8-139.
2 Choose the shape of spots (Circle or Rectangle) you want to use from the
Spot type drop-down list box.
3 Click on the Fluorescence radio button for a fluorescence image (bright spots
on a dark background); click on the Absorption radio button for an
absorption image (dark spots on a bright background).
GeneTools User Manual
4-3
Using GeneTools for Spot blot analysis
GeneTools detects the Image type automatically, so you shouldn’t need to
change this setting.
4 Do one of:
●
●
Press Locate spots automatically if you want GeneTools to detect the
positions of the spots automatically:
●
Check Gridded if you want GeneTools to place a rectangular grid of
spot frames over the spots it detects.
●
Uncheck Gridded if you want GeneTools to place spot frames only
where it actually found spots.
Press Create spots for manual positioning to place a rectangular grid of
spot frames in a default position on the image:
●
●
Enter the number of Columns and Rows you want to appear in the
grid.
Press Leave the spots unchanged if you do not want to put any spot
frames on the image yet. You will be able to add spots manually later –
see Adding new spot frames, page 4-18.
5 Click on the Analysis notes tab and enter any notes you want to save with
the secure sample file.
The other two pages give information saved with the file in the acquisition
program – see the entry for Sample properties in the Menus chapter,
page 8-28, for details.
4-4
GeneTools User Manual
How to create and work with secure sample files
6 Press OK to close the dialog box and display the sample in a Spot
blot/Manual band quantification window:
If you have set Gridded, a grid of spot frames of the chosen shape will be shown on
the image and their positions automatically adjusted within the grid cells to fit over any
spots that are detected – see How to adjust the spot frame positions, page 4-26, for
how to move and resize the frames if necessary.
If you have not set Gridded, spot frames of the chosen shape will be shown on the
image at any detected spots – see How to adjust the spot frame positions, page 4-26,
and How to add and remove spot frames, page 4-16.
See also How to adjust the size and shape of spot frames, page 4-21.
GeneTools User Manual
4-5
Using GeneTools for Spot blot analysis
Creating a new secure sample file
To create a new secure sample file (for example, from a non-secure .tif or .bmp image
file):
1 Choose New (Import) from the File menu to display a standard Windows
Open dialog box:
2 Choose the type of image file from the Files of type drop-down list box.
3 Use the Look in drop-down list box to select the folder containing the image
file.
4 Click on the file in the list box to select it – the name of the file will appear in
the File name box.
5 Press Open to close the dialog box.
What happens next depends on whether you have selected Auto import methods in
the Configuration dialog box:
●
4-6
If you have selected Auto import methods in the Configuration dialog box, the
Import method dialog box will open so that you can choose which settings to
import – see Opening or creating a secure sample file with automatic import,
page 4-11, for further details.
GeneTools User Manual
How to create and work with secure sample files
If Auto import methods is not selected, the Sample properties dialog box will open so
that you can set the type of image and make other settings – see the picture on
page 4-3 and the instructions following it.
Using the Browser
As an alternative to using the Open command to open a secure sample file (see
Steps 1–3 in Opening a secure sample file page 4-2) or the New (Import) command to
create a new secure sample file (for example, from a non-secure .tif or .bmp image file
– see the previous section), you can use the GeneTools Browser to preview and open
image files.
To open an existing secure sample file or to create a new secure sample file using the
Browser:
1 Choose Browse from the File menu to display the Browser:
2 Use the left-hand pane in the Browser to select the folder containing the
required image in exactly the same way as you use the left-hand pane in
Windows Explorer.
The right-hand pane in the Browser will show a preview of all the images in
the selected folder.
GeneTools User Manual
4-7
Using GeneTools for Spot blot analysis
3 Double-click on the image that you want to open.
What happens next depends on whether you are opening an analyzed or unanalyzed
secure sample or creating a new secure sample file.
If you are opening an analyzed secure sample file:
●
The sample will be opened in a Spot blot/Manual band quantification window with
all spot frames displayed as they were when the file was last saved. All previously
analyzed results will be shown in the Results table.
If you are opening an unanalyzed secure sample file or creating a new secure sample
file:
●
If you have selected Auto import methods in the Configuration dialog box, the
Import method dialog box will open so that you can choose which settings to
import – see Opening or creating a secure sample file with automatic import,
page 4-11, for further details.
●
If Auto import methods is not selected, the Sample properties dialog box will open
so that you can set the type of image and make other settings – see the picture on
page 4-3 and the instructions following it.
Acquiring an image to create a secure sample file
GeneTools allows you to acquire an image from a Twain source, such as a scanner or a
digital camera, and create a secure sample file from it.
In order to acquire the image you need to select the Twain source first.
To select a Twain source so that you can acquire an image from it:
1 Choose Select Source (Twain) from the File menu to display the Select
Source dialog box:
4-8
GeneTools User Manual
How to create and work with secure sample files
2 Click on the required source to select it.
3 Press Select to confirm the selection and close the dialog box.
To acquire an image from the selected Twain source and create a secure sample file:
1 Choose Acquire (Twain) from the File menu.
A dialog box will be displayed for the selected source so that you can select
acquisition options and acquire the image.
2 Use the dialog box to acquire the image.
Once the image has been acquired:
●
If you have selected Auto import methods in the Configuration dialog box, the
Import method dialog box will open so that you can choose which settings to
import – see Opening or creating a secure sample file with automatic import,
page 4-11, for further details.
●
If Auto import methods is not selected, the Sample properties dialog box will open
so that you can set the type of image and make other settings – see the picture on
page 4-3 and the instructions following it.
Importing settings from existing secure Spot blot sample files
Automatically importing settings
To set the program to import settings automatically from an existing secure Spot blot
sample file
1 Choose Configuration from the Extras menu to display the General page of
the Configuration dialog box.
2 Check Auto import methods.
GeneTools User Manual
4-9
Using GeneTools for Spot blot analysis
3 Click on the Import tab to display the Import page:
4 Press Browse to display a standard Windows Open dialog box if you want to
select a different file from which to import the settings.
a Select the file from which you want to import settings.
b Press OK to close the Open dialog box.
The name of the selected file will appear in the File name box.
5 Check the boxes for the settings you want to import – the relevant boxes for a
Spot blot sample are Spot blot settings and Report settings.
Note
The check boxes are disabled if no file is selected.
6 Press OK to close the Configuration dialog box.
Note
4-10
The settings you make will be stored as the defaults for the next time you want to
import settings. The controls on this page are also displayed in a dialog box when you:
●
open an unanalyzed image, or
●
create a secure sample file from a non-secure image, or
GeneTools User Manual
How to create and work with secure sample files
●
choose Import method from the File menu to import the settings from a saved file
to an existing secure sample file in a Spot blot window.
Changing the settings in any of these places changes the defaults.
Opening or creating a secure sample file with automatic import
If you have automatic import set when you:
●
open an unanalyzed secure sample file – see Opening a secure sample file,
page 4-2,
●
create a new secure sample file – see Creating a new secure sample file, page 4-6,
●
acquire an image from a Twain source – see Acquiring an image to create a secure
sample file, page 4-8,
the Import method dialog box will open:
Note
If you change your mind about using automatic import, press Cancel to close the
Import method dialog box and display the Sample properties dialog box. Then
continue as if you were opening or creating a secure sample file without automatic
import.
GeneTools User Manual
4-11
Using GeneTools for Spot blot analysis
To continue opening or creating a secure sample file with automatic import:
1 Click on the Import tab to display the Import page:
2 Press Browse to display a standard Windows Open dialog box if you want to
select a different file from which to import the settings.
Note
The check boxes are disabled if no file is selected.
3 Check or uncheck the boxes if you want to change the settings that are
imported – the relevant boxes for a Spot blot sample are Spot blot settings
and Report settings.
Note
The choices you make will be stored as the defaults for the next time you want to
import settings. You can also set the defaults using the Import page of the
Configuration dialog box, or by importing settings to an existing secure sample file by
choosing Import method from the File menu.
4 Press Import to close the Import method dialog box.
What happens next depends on whether you have chosen to import Spot
blot settings:
●
4-12
If you haven’t imported Spot blot settings, the Sample properties dialog
box will be displayed so that you can set the sample properties – see
GeneTools User Manual
How to create and work with secure sample files
Opening a secure sample file, page 4-2, for details.
When you have done that, a Spot blot/Manual band quantification
window will open containing the new sample created from the image.
●
Otherwise, a Spot blot/Manual band quantification window will open
immediately containing the new sample created from the image with the
imported spot frames in position – see later in this chapter for information
about working with spot frames.
You can now use all the program’s analysis procedures to work with the sample.
Note
You can always change the automatically imported settings at a later time by choosing
Sample properties from the File menu to change individual settings (the Sample
properties dialog box also allows you to add notes about the sample to be saved with
it).
See the next section for how to use Import method from the File menu to import
settings from a different secure sample file – this also displays the Import method dialog
box but without the page showing the image).
GeneTools User Manual
4-13
Using GeneTools for Spot blot analysis
Importing settings from a saved sample file
To apply spot blot and/or report settings from a saved secure sample file to the sample
in the selected Spot Blot/Manual Quantification window:
1 Choose Import method from the File menu to display the Import method
dialog box:
2 Press Browse to display a standard Windows Open dialog box if you want to
select a different file from which to import the settings.
Note
The check boxes are disabled if no file is selected.
3 Check the boxes for the settings you want to import – the relevant boxes for a
Spot blot sample are Spot blot settings and Report settings.
Note
4-14
This dialog box is also displayed if you create a new sample from a non-secure image
with automatic import set (though it then has an additional page showing the image).
You can also set the import methods in the Import page of the Configuration dialog
box. The program displays the same import methods in all these places and changing
the settings in any one of them changes the settings in all of them.
GeneTools User Manual
How to create and work with secure sample files
Editing sample properties
To view or edit the settings and notes for a sample:
1 Click in the window containing the sample to select it.
2 Choose Sample properties from the File menu to display the General page
of the Sample properties dialog box – see the entry for Sample properties in
the Menus chapter (page 8-28) for details.
Saving a secure sample file
To save a secure sample with a new name:
1 Click in the Sample window containing the sample (or choose it from the list
at the bottom of the Window menu).
2 Choose Save as from the File menu to display a standard Windows Save As
dialog box:
3 Use the dialog box to select a folder in which to save the sample.
4 Enter a File name for the sample.
5 Press Save to save the sample in the file.
GeneTools User Manual
4-15
Using GeneTools for Spot blot analysis
To save a previously saved secure sample file using the same name:
1 Click in the Sample window containing the sample (or choose it from the list
at the bottom of the Window menu).
2 Choose Save from the File menu. If the secure sample file has not been saved
previously, the Save As dialog box will be displayed so that you can enter a
name: see above.
How to add and remove spot frames
Adding spot frames automatically
To locate spots automatically on a non-gridded Spot blot image (or to fine-adjust the
size and position of the spot frames on a gridded sample):
1 Choose All spots same size from the Spots menu to choose whether or not
to force all the spot frames to have the same size.
2 Choose Locate from the Spots menu to display the Spot Location Tool dialog
box:
4-16
GeneTools User Manual
How to add and remove spot frames
The dialog box allows you to set the criteria used for detecting spots:
●
The red vertical lines in the Binary threshold control set the lower and
upper boundaries of the range of intensities corresponding to spots in the
image – areas in the image within this range will be marked in blue while
the Spot Location Tool dialog box is open.
●
The Area criteria controls set the minimum and maximum size of spots –
spot frames will appear on areas in the image satisfying both the Binary
threshold and Area criteria.
3 Set the minimum and maximum areas for spots in the Min Spot Area and
Max Spot Area boxes.
4 Press Apply to set the area criteria without closing the dialog box – spot
frames will appear on areas in the image satisfying both the Binary threshold
and the new Area criteria.
5 Drag the red boundary markers in the Binary threshold control until the
spots, but not the background, in the image are colored blue – as you adjust
the boundaries, the spot frames on the image will show where the spots are
detected.
6 If necessary, repeat Steps 2–5 until the spot frames are accurately positioned
on the spots in the image.
Note
If All spots same size is not set, the spot frames will be sized optimally for each spot; if
it is set, they will all be set to the size of the largest spot.
Note
For a gridded sample, this procedure allows fine adjustment of the size and position of
the existing spot frames, which must substantially overlap the actual spots on the image.
GeneTools User Manual
4-17
Using GeneTools for Spot blot analysis
Adding new spot frames
When the sample is non-gridded (see Step 3 on page 4-4), you can place your own
spot frames on the sample.
Circular frames
(See also Adding a copy of a spot frame, page 4-20.)
To place a circular spot frame on a non-gridded Spot blot sample:
1 If it isn’t already selected, choose Position any spot from the Spots menu to
unlock the sample for placing and moving spot frames.
2 If All spots same size is selected in the Spots menu, choose the command
again to deselect it.
3 If it isn’t already selected, choose Circle from the Spots menu – this will
change the shape of the currently selected frame.
You place the circle by dragging out its bounding rectangle.
4 Move the pointer to where you want to place the top left-hand corner of the
bounding rectangle:
5 Press the mouse button and drag to the bottom right-hand corner of the
bounding rectangle:
4-18
GeneTools User Manual
How to add and remove spot frames
6 Release the mouse button to place the new spot frame on the sample. The
frame will be drawn as the largest circle possible within the bounding
rectangle. It will be drawn in the color for selected spot frames (you can use
Configuration in the Extras menu to set the color – see page 8-143) and
labeled with a number showing the order in which the frame was added.
Rectangular frames
(See also Adding a copy of a spot frame, page 4-20.)
To place a rectangular spot frame on a Spot blot sample:
1 If it isn’t already selected, choose Position any spot from the Spots menu to
unlock the sample for placing and moving spot frames.
2 If All spots same size is selected in the Spots menu, choose the command
again to deselect it.
3 If it isn’t already selected, choose Rectangle from the Spots menu.
4 Move the pointer to where you want to place the top left-hand corner of the
rectangle:
GeneTools User Manual
4-19
Using GeneTools for Spot blot analysis
5 Press the mouse button and drag to the bottom right-hand corner of the
rectangle:
6 Release the mouse button to place the new spot frame on the sample. The
frame will be drawn in the color for selected spot frames (you can use
Configuration in the Extras menu (see page 8-143) to set the color) and
labeled with a number showing the order in which the frame was added. It
will have drag handles at its corners and at the middle of its sides so that you
can adjust its shape – see Adjusting the size and shape of rectangular spot
frames, page 4-24.
Adding a copy of a spot frame
To add another frame of the same size as another frame (a default size if it is the first
frame) to a non-gridded sample:
1 If it isn’t already selected, choose Position any spot from the Spots menu to
unlock the sample for changing spot frames.
2 Click in the spot frame that you want to copy to select it.
3 Double-click at the point you want to place the center of the new frame.
4-20
GeneTools User Manual
How to adjust the size and shape of spot frames
A new frame with the same size and shape as the selected frame will be added at the
point you double-clicked.
See How to adjust the spot frame positions, page 4-26, and How to adjust the size and
shape of spot frames, page 4-21, for making further adjustments to the spot frames.
Removing spot frames
To remove a spot frame from a sample:
1 If it isn’t already selected, choose Position any spot from the Spots menu to
unlock the sample for changing spot frames.
2 Click in the spot frame to select it.
3 Either:
Choose Delete from the Spots menu.
or
Press c.
After the spot frame has been removed, the numbers or letter/number pairs labeling the
remaining frames will be changed so that they are still consecutive.
To remove all the spot frames from a sample:
1 If it isn’t already selected, choose Position any spot from the Spots menu to
unlock the sample for changing spot frames.
2 Choose Delete all from the Spots menu.
How to adjust the size and shape of spot frames
Setting the size of all spot frames to the same size and shape
To set all the spot frames to the same size and shape as the selected spot frame:
Choose All spots same size from the Spots menu.
GeneTools User Manual
4-21
Using GeneTools for Spot blot analysis
The shape and size of all the spot frames will be adjusted to match the selected spot
frame.
While All spots same size is set, if you adjust the size or shape of an individual spot
frame, all the spot frames will be adjusted to match them. If All spots same size is set
when you locate spots automatically, the spot frames placed on the detected spots will
all have the same size (see Adding spot frames automatically on page 4-16).
Changing between circular and rectangular spot frames
To make the selected circular frame rectangular or all frames rectangular if All spots
same size is set:
Choose Rectangle from the Spots menu to make a circular frame rectangular.
To make the selected rectangular frame circular or all frames circular if All spots same
size is set:
Choose Circle from the Spots menu to make a rectangular frame circular.
Adjusting the size of circular spot frames
You can adjust the size of circular spot frames using the mouse or a dialog box (apart
from changing them to rectangular spot frames, you cannot change their shape).
Using the mouse
To adjust the size of one or all of the circular frames:
1 If it isn’t already selected, choose Position any spot from the Spots menu to
unlock the sample for resizing spot frames.
Note
4-22
You could also use Position control points to unlock the sample, but that would only
allow you to change the size of the spots at the control points – see Adjusting the
positions of all the spot frames in a grid, page 4-26, to find out about control points.
GeneTools User Manual
How to adjust the size and shape of spot frames
2 If required, set or unset All spots same size by choosing the command from
the Spots menu – when All spots same size is set all the frames will be
adjusted to the same size and shape; when it is unset, only the selected frame
will be adjusted.
3 Click in the frame to select it – if All spots same size is set, you can select
any frame.
Drag handles will appear at the corners and in the middle of the sides of the
square bounding the frame:
4 Move the pointer over a drag handle – it doesn’t matter which. The pointer
will change to a two-headed arrow showing the direction you can drag the
handle:
5 Drag the handle:
and drop it in its new position.
GeneTools User Manual
4-23
Using GeneTools for Spot blot analysis
Using a dialog box
To change the size of one or all the circular frames on a sample:
1 If the sample is locked, choose Lock position from the Spots menu to unlock
the sample.
2 Click on the spot frame that you want to adjust to select it – click on any
circular frame if you want to adjust them all.
3 Right-click in the image pane and choose Set radius from the context menu
displayed to display the Set spot radius dialog box:
4 Check Set all spots if you want to change the radius of all the (circular) spot
frames; uncheck it if you just want to change the radius of the selected spot
frame.
Note
The initial Set all spots setting is fixed by the setting of the All spots same size
command in the Spots menu. If you change the setting of Set all spots in the dialog
box, All spots same size will be set or unset accordingly when you close it.
5 Use the arrow buttons to set the new radius.
6 Press OK to close the dialog box and set the new radius.
Adjusting the size and shape of rectangular spot frames
To adjust the size and shape of one or all of the rectangular frames:
1 If the sample is locked, choose Lock position from the Spots menu to unlock
the sample.
2 If required, set or unset All spots same size by choosing the command from
the Spots menu – when All spots same size is set all the frames will be
adjusted to the same size and shape; when it is unset, only the selected frame
will be adjusted.
4-24
GeneTools User Manual
How to adjust the size and shape of spot frames
3 Click in the frame to select it – if All spots same size is set, you can select
any frame.
Drag handles will appear at the corners and in the middle of the sides of the
frame:
4 Move the pointer over the drag handle that you want to adjust. The pointer
will change to a two-headed arrow showing the direction you can drag the
handle:
5 Drag the handle:
and drop it in its new position.
GeneTools User Manual
4-25
Using GeneTools for Spot blot analysis
6 Repeat Steps 4 and 5 for any of the other handles you want to adjust.
How to adjust the spot frame positions
You can adjust the position of one frame at a time on any sample, but if the sample is
gridded, you can also adjust the position of all the frames together.
Adjusting the position of a single spot frame
To adjust the position of a single spot frame:
1 If Position any spot is not selected already, choose Position any spot from
the Spots menu to unlock the sample and allow individual spot movement.
2 Click in the frame that you want to move to select it.
3 Drag the frame to its new position (avoid dragging the drag handles).
Adjusting the positions of all the spot frames in a grid
When a sample is gridded (see Step 3 on page 4-4), you can adjust the position of all
the spot frames together.
There are several ways of doing this to achieve different results, but for all of them you
will need to set Position control points.
To unlock the grid for positioning all spot frames together:
If it isn’t already selected, choose Position control points from the Spots
menu.
To move all of the spot frames in the grid together, you make one or more of the
frames a ‘positioning point’.
To make a frame a positioning point:
Double-click in the frame.
4-26
GeneTools User Manual
How to adjust the spot frame positions
The positioning point will be identified by color (you can use Configuration in the
Extras menu to set the color – see page 8-143).
Repeat the process to change the frame back to being a normal frame.
You can define up to three positioning points. If there are already three positioning
points, you will need to remove one before adding another one. The following sections
describe the effect of using one, two or three positioning points.
Moving the grid of spot frames without changing its shape or orientation
To move the grid of spot frames without changing its shape or orientation:
1 Define a single positioning point by double-clicking in a frame as above (if
there is more than one positioning point, remove one or two until there is
only one left).
2 Drag the grid by the positioning point.
The whole grid of spot frames will move with the positioning point.
Note
If you have moved any individual spot frames, they will be snapped back to their grid
positions as you move the positioning point.
Scaling and rotating the grid of spot frames without changing its shape
For this operation you define one positioning point to act as a fixed point in the grid
and then define a second positioning point to drag the frame around the fixed point.
To adjust the pitch and orientation of the grid of spot frames without changing the
shape:
1 Remove any existing positioning points by double-clicking on them.
GeneTools User Manual
4-27
Using GeneTools for Spot blot analysis
2 Define the first positioning point by double-clicking on the frame that you
want to act as a fixed point:
(The pointer is over the first positioning point in this example.)
3 Define the second positioning point by double-clicking on the frame that you
want to drag:
4 Drag the second positioning point to the required position.
4-28
GeneTools User Manual
How to adjust the spot frame positions
The grid will be scaled and rotated about the fixed positioning point:
Note that the shape of the grid has not changed – the rows are still at right
angles to the columns.
5 Drop the grid in its new position.
Note
If you have moved any individual spot frames, they will be snapped back to their grid
positions as you move the positioning point.
Changing the shape of the grid of spot frames
For this operation you define two fixed positioning points in the grid and then define a
third positioning point to drag the frame relative to the fixed points.
To adjust the shape of the grid of spot frames:
1 Remove any existing positioning points by double-clicking on them.
GeneTools User Manual
4-29
Using GeneTools for Spot blot analysis
2 Define the first positioning point by double-clicking on the first frame that you
want to act as a fixed point:
3 Define the second positioning point by double-clicking on the second frame
that you want to act as a fixed point:
4-30
GeneTools User Manual
How to adjust the spot frame positions
4 Define the third positioning point by double-clicking on the frame that you
want to drag:
5 Drag the third positioning point to the required position.
The grid will be reshaped about the fixed positioning points:
Note
If you have moved any individual spot frames, they will be snapped back to their grid
positions as you move the positioning point.
GeneTools User Manual
4-31
Using GeneTools for Spot blot analysis
How to lock the spot frames on a sample
To lock the spot frames on a sample:
Choose Lock position from the Spots menu.
Lock position is checked in the Spots menu and the button is shown as depressed in
the toolbar when the frames are locked.
When the spot frames are locked, you cannot adjust their size, shape or position using
the mouse or, in the case of non-gridded samples, delete them. However, you can
change them between circular and rectangular shapes, set all to the same size as the
selected spot frame using All spots same size, and use automatic spot location.
To unlock the spot frames:
Choose Lock position from the Spots menu.
If the sample is gridded, either Position control points or Position any spot will
become selected, depending on which was selected before the spot frames were
locked. For non-gridded samples, Position any spot will become selected.
The Spot frames are also unlocked if you choose Position control points or Position
any spot from the Spots menu.
How to show or hide identification labels on the spot frames
To show/hide identification labels on the spot frames:
Choose Spot numbers from the View menu.
Spot numbers is checked in the View menu when the labels are shown.
4-32
GeneTools User Manual
How to set the quantity calibration method
How to set the quantity calibration method
To set or view the calibration method and units for quantity determination:
1 Choose Quantity calibration from the Edit menu to display the Quantity
calibration dialog box:
2 Choose the shape of calibration curve(s) from the drop-down list box. You can
choose from:
●
Linear through origin (single standard value)
●
Linear (multiple standard values)
●
Linear through origin (multiple standard values)
●
Quadratic, or
●
Quadratic through origin.
3 Enter your own quantity units in the Units box.
4 Press OK to save the new settings and close the dialog box.
Note
If you select Linear through origin (single standard value), the calibration curve is
drawn through the origin and the last calibration point you have added – in other
words, adding a new calibration point replaces the previous one. For the other types of
curve, the calibration curve is drawn as the best fit for all the (relevant) calibration
points – adding a new calibration point contributes to (and does not replace) the
calibration from any previous points.
GeneTools User Manual
4-33
Using GeneTools for Spot blot analysis
How to assign quantities to spot frames
To assign a quantity to a spot to calibrate quantity measurements from other spots:
1 Click on the spot frame for the spot to which you want to assign a quantity.
2 Choose Assign quantity from the Spots menu to display the Assign
calibrated quantity dialog box:
3 Enter the known quantity for the spot in the Calibrated quantity box.
4 Press OK to close the dialog box and set the calibration.
After you have assigned a quantity to a spot:
4-34
●
The calibrated spot will be marked with a cross:
●
The table on the Spot blot results page in the Spot blot/Manual band quantification
window’s Results/Quantity calibration pane will be automatically updated to include
the calibrated quantities (the quantity you assigned will be shown in red).
●
The Quantity calibration page in the Spot blot/Manual band quantification
window’s Results/Quantity calibration pane will show the calibration points and the
selected calibration curve joining them (see page 4-33 for how to select the units
GeneTools User Manual
How to apply background correction to results
and shape of calibration curve: the example shows a quadratic calibration curve –
the equation of the curve is given in the Raw volume axis label):
How to apply background correction to results
To apply or remove background correction to the raw volume measurements from the
image:
1 Choose Background correction from the Spots menu to display the
Background correction dialog box:
2 Choose None, for no background correction, or Automatic or Manual
background correction.
3 If you have selected None or Automatic, go to Step 7.
For Manual background correction, you need to specify areas in the image
from which the background readings should be taken – each spot result is
then corrected by the reading from the background area nearest to it.
Steps 4–6 show you how to define the background areas.
GeneTools User Manual
4-35
Using GeneTools for Spot blot analysis
4 With the Background correction dialog box still open, drag out a rectangle
on the image in the first background area you want to define:
When you release the mouse button, the background area will be drawn with
drag handles to show that it is selected:
5 If required, you can reshape and resize the background area by dragging the
drag handles, move it by dragging the area or remove it by pressing c.
Note
4-36
These editing operations can be applied to any existing background areas if you click in
them while the Background correction dialog box is open.
GeneTools User Manual
How to view Spot blot results
6 Repeat Steps 4 and 5 to define any other background areas you require:
Note
GeneTools highlights the spots that will be corrected by the selected background area.
In particular, if you move a background area, the highlighting will change accordingly as
you move the area.
7 Press OK to close the dialog box and set the background correction method.
How to view Spot blot results
The Spot blot results are shown in the Spot blot results page in the bottom pane of the
Spot blot/Manual band quantification window:
GeneTools User Manual
4-37
Using GeneTools for Spot blot analysis
To choose what parameters to show in the Results table:
1 Right-click on the table to display the Spot blot results context menu:
2 Click on the required parameter in the list at the top of the menu to add it to
or remove it from the Results table.
If the sample is gridded (see page 4-4), you can choose whether to display the results in
a one- or two-dimensional table.
To choose whether to display Spot blot results in a one- or two-dimensional table:
1 Click on the Spot blot results tab.
2 Right-click in the table to display the Spot blot/Manual band quantification
window Results pane context menu.
3 Choose Table 1D or Table 2D.
The selected command will become checked in the menu.
4-38
GeneTools User Manual
How to define an incidence condition
In a one-dimensional table, the results for the first row of spots are given first, then the
second row and so on as in the example above. In a two-dimensional table, there is a
separate row for each row in the grid and a group of columns for each column:
How to define an incidence condition
To define an incidence condition for a Spot blot:
1 Choose Spot incidence parameters to display the Spot incidence
parameters dialog box:
2 Choose the parameter for which you want to set the incidence condition from
the Incidence type drop-down list box – you can choose Raw vol, % Total
raw vol, Pixel area or Quantity.
3 Choose the comparison operation to be used from the Incidence value range
drop-down list box – you can choose Greater than, Less than or Two-value
range.
GeneTools User Manual
4-39
Using GeneTools for Spot blot analysis
If you choose Two-value range, an additional box will appear in the dialog
box so that you can enter two values:
4 Enter the value(s) to be used for the comparison in the Incidence value
(Upper Incidence value and Lower Incidence value) box(es).
Or:
a Click in a spot on the image to select it.
b Press Get spot value to transfer the Incidence type value for the selected
spot to the incidence value box.
5 Press Apply to set the incidence condition without closing the Spot incidence
parameters dialog box (you will be able to view the effect if the Incidence
page is shown in the Results/Incidence/Calibration Graph pane).
Press OK to set the incidence condition and close the Spot incidence
parameters dialog box.
You can view the incidence matrix in the Incidence page in the Results/Incidence/
Calibration Graph pane at the bottom of the Spot blot/Manual band quantification
window – see page 6-32.
4-40
GeneTools User Manual
How to print and export Spot blot results
How to print and export Spot blot results
Printing Spot blot results
To choose what data to include in a Spot blot sample report:
1 With the Spot blot/Manual band quantification window selected, choose
Report setup from the File menu to display the Report setup dialog box:
Note
If the paper selected for the currently selected printer is less than 150 mm in either
dimension (for example if you are using a video printer), a simplified report containing
the image and some brief identification and image information will be printed. The
settings in the Report setup dialog box have no effect on the content of this simplified
report.
2 Check the boxes for the items you want to include in the report – see the
entry for Report setup in the Menus chapter, page 8-20, for details of the
options.
3 If you are going to include the Results table, choose what columns to include
and whether it should be one- or two-dimensional – see page 4-37 for how
to do this.
4 Choose Print Preview from the File menu to preview the report before it is
printed – see the entry for Print preview in the Menus chapter, page 8-26, for
details.
GeneTools User Manual
4-41
Using GeneTools for Spot blot analysis
5 Choose Print from the File menu (or press Print in the Preview window if it is
displayed) to display the Print dialog box so that you can select print options
before printing the report – this is a standard Windows dialog box.
6 After selecting any required options, press OK to close the dialog box and
print the report.
Exporting Spot blot results to Excel
To export Spot blot results to Excel:
1 Select the Spot blot results tab in the Spot blot/Manual band quantification
window’s lower pane.
2 If you want to change the columns shown in the table, right-click on the table
to display the Results context menu and choose the required parameter to
add to or remove from the table.
3 Repeat Step 2 until the required columns are displayed.
4 Choose Export table to Excel from the File menu.
Unless you have already exported a table to Excel in the current session, Excel will be
opened and a new workbook created.
The first sheet in the workbook will be named Image document data and will contain
the secure sample’s file name, and data taken from the Information page of the
Sample properties dialog box.
The Spot blot results will be shown on a separate sheet.
If you have already exported a table to Excel in the current session:
●
if the results table selected in the Results pane already exists in the workbook, the
results will be updated
●
otherwise, a new sheet will be added for the new table and named accordingly.
Note 1
GeneTools identifies sheets in the workbook by their names. If you rename a sheet and
export the table again, a new sheet will be added for the table and the original sheet
will not be updated.
4-42
GeneTools User Manual
How to print and export Spot blot results
Note 2
After you have exported a table to Excel in a session, GeneTools maintains a link to the
workbook it created but does not use the name of the workbook to identify it. This
means that you can save the workbook with another name if you wish. However, it also
means that once you have exported a table to Excel, you should leave the workbook
open in Excel until after you have closed GeneTools.
Saving results in a comma separated values format file
To save results to a comma separated values text file:
1 Select the Spot blot results tab.
2 If you want to change the columns shown in the table, right-click on the table
to display the Results context menu and choose the required parameter to
add to or remove from the table.
3 Repeat Step 2 until the required columns are displayed.
4 Choose Save table to CSV file to display the Save as CSV File dialog box:
This is a standard Windows Save As dialog box.
5 Use the dialog box to select a folder in which to save the CSV file.
6 Enter a File name for the CSV file.
GeneTools User Manual
4-43
Using GeneTools for Spot blot analysis
7 Press Save to save the results in the file.
Copying a picture of an image to the clipboard
To copy a picture of the image in the Image pane in the current window to the
clipboard:
Choose Save to clipboard from the File menu.
4-44
GeneTools User Manual
Using GeneTools to count colonies
See Getting started with Colony counting section in the GeneTools Getting Started
manual for full instructions on Using GeneTools to count colonies.
GeneTools User Manual
5-1
Using GeneTools to count colonies
5-2
GeneTools User Manual
Windows
You can display the following document windows in the main GeneTools application
window:
●
Sample windows:
●
Gel window
●
Colony counting window
●
Spot blot/Manual band quantification window
●
Molecular weight library window
●
Profile comparison window.
This chapter describes how you use each of these.
The final sections in the chapter then describe how to use the image controls and the
Histogram, which can be used with Gel, Colony counting and Spot blot/Manual band
quantification windows – see page 6-33.
GeneTools User Manual
6-1
Windows
Gel windows
When you open a Gel or High Throughput Gel sample it is displayed in a Gel window:
Image pane
Track label
pane
Profile
pane
Description
pane
Peak value
pane
Reset brightness
Image brightness
adjustment
Reset
contrast
Image contrast
adjustment
Reset
gamma
Gamma correction
adjustment
Graphics pane
Results pane
Note
The layout of the Gel window depends on the electrophoresis direction. If the direction
is horizontal, the Track label pane is to the left of the Image pane and the Profile and
Results panes are below the Image pane.
6-2
GeneTools User Manual
Gel windows
Adjusting the panes in a Gel window
To change the size of individual panes in the window:
1 Move the pointer over the pane border: the pointer will change to a
double-headed arrow:
2 Press and drag the border to a new position.
To maximize the Graphics or Results pane so that it fills the Gel window:
1 Click in the pane to select it.
2 Choose Maximize pane from the View menu or the menu displayed when
you right-click in the pane.
To return the pane to its normal size:
Choose Maximize pane again.
Or
Adjust the size of the Gel window.
Track label pane
The Track label pane shows:
●
A number identifying each track
●
Whether the track is enabled (black label) or disabled (gray label) – see the entries
for Enable and Disable on the Track menu in the Menus chapter (page 8-100)
●
The label MwS, QuS or MQS if the track is defined as a molecular weight, quantity
or molecular weight and quantity standard – see the entry for MW/quantity
standard on the Track menu in the Menus chapter (page 8-94)
●
The label MS if the track is defined as a matching (but inactive) standard – see the
entry for Matching standard on the Track menu in the Menus chapter (page 8-95).
GeneTools User Manual
6-3
Windows
●
Note
The label MS* if the track is defined as the active matching standard – see the entry
for Active matching standard on the Track label context menu in the Menus
chapter (page 8-149).
If there is more than one area of interest, the Track label pane shows these details for
the selected area of interest.
You can right-click in the Track label pane to pop up a menu of commands for working
with the selected track. All the commands on this menu can also be chosen from the
Track menu apart from the additional Active matching standard command.
Description pane
The Description pane shows a description of the selected track – use Description in the
Tracks menu to enter or edit the description (see page 8-100).
Image pane
The Image pane shows the gel or High Throughput Gel image. See Image Controls,
page 6-33, for how to adjust the brightness and contrast for monochrome images.
View modes
When the tracks are locked in all areas of interest, you can choose whether the Image
pane should display the original gel image with tracks marked on the image or display
the tracks in aligned banks (see below for an explanation).
To switch aligned banks of tracks view on or off:
Choose Align banks of tracks from the View menu.
The command is checked in the menu when the Image pane shows banks of tracks.
When the Image pane shows banks of tracks, the image area within each track is cut
out and, if it is skewed, transformed so that it is rectangular (see the note following the
example pictures). The cut out tracks within each area of interest are then arranged in a
horizontal bank of tracks with the tops aligned. The banks corresponding to the different
areas of interest are then arranged one above the other.
6-4
GeneTools User Manual
Gel windows
For example:
Align banks of tracks off
Note
Align banks of tracks on
The transformation of the track image to a rectangle is for display purposes only; all
analysis is performed using the original image.
Viewing the tracks in aligned banks is particularly useful for High Throughput Gel
samples and is automatically selected when you lock a High Throughput Gel sample,
though you can deselect it if required.
When aligned banks of tracks view is on, the only way to unlock the tracks is using
Position all in the Track menu or the Position all button. Unlocking the tracks in any
area of interest switches aligned banks of tracks view off.
Working in the Image pane
You can change the magnification of the image by choosing Zoom in, Zoom out or
Zoom reset from the View menu or by clicking on the equivalent tools in the Zoom
toolbar.
GeneTools User Manual
6-5
Windows
For most gels, you can allow GeneTools to locate the tracks and peaks on the image
completely automatically (see the entry for Configuration in the Menus chapter,
page 8-139, for how to set GeneTools automatic modes), but you can also edit the
results or carry out these operations manually, or semi-automatically (see the entries for
the commands in the Track and Peak menus in the Menus chapter, pages 8-72 and
8-104, for details).
Note
You can use automatic peak location but not automatic track location with High
Throughput Gel samples.
You can also choose what information to superimpose on the image (see the entries for
the commands in the View menu in the Menus chapter (page 8-63) for details).
If you right-click near a peak in the Image pane, a menu will pop up with commands
for working with the selected peak – all the commands can also be chosen from the
Peak menu, except for the Edit manual baseline and Delete manual baseline
commands, which can be chosen from the Track menu.
Profile pane
The Profile pane shows the profile measured from the track selected in the Image pane.
Once peaks have been located, it also shows the position of the peaks and peak
bounds – see How to locate and edit peaks on a track in the Using GeneTools for Gel
analysis chapter (page 1-59) for more information on working with peaks.
You can right-click on a peak in the Profile pane to pop up a menu of commands for
working with the selected peak – all the commands can also be chosen from the Peak
menu except for the Edit manual baseline and Delete manual baseline commands,
which can be chosen from the Track menu.
Peak value pane
The Peak value pane shows:
6-6
●
Quantities for the peaks in the selected track if Quantities is selected in the View
menu.
●
Molecular weights for the peaks in the selected track if Molecular weight is selected
in the View menu.
●
Peak positions for the active matching standard if Peak matching is selected in the
View menu.
GeneTools User Manual
Gel windows
If a molecular weight standard track is selected when the Peak value pane is showing
molecular weights, only the assigned molecular weights are shown. You can unassign or
reassign these molecular weights in the Peak value pane.
Graphics pane
The Graphics pane can show:
●
The molecular weight calibration
●
The quantity calibration
●
The dendrogram.
Each of these is described in more detail later in this section.
Note
If there is more than one area of interest, the Graphics pane shows these details for the
selected area of interest.
To select the required graphical display:
Click on the tab for the graph (you may have to use the scroll bar if the tab
you want is not visible).
Or
Choose Molecular weight, Quantities or Peak matching from the View
menu.
The Graphics pane is linked to some of the other panes in the Gel window:
●
Displaying the molecular weight calibration graph displays molecular weights in the
Peak value pane. The Image pane will show peaks in molecular weight standard
tracks with a short line across the peak marker if they have been assigned a
molecular weight.
●
Displaying the quantity calibration graph displays quantities in the Peak value pane
and in the Image pane shows peaks that have been assigned a volume with a short
line across the peak marker.
●
Displaying the dendrogram displays matching comparisons in the Results pane and
the peak values of the active matching standard in the Peak value pane. Provided
Match lines is selected in the View menu, the Image pane will show matching lines
between matching peaks.
GeneTools User Manual
6-7
Windows
Note
If profile matching is selected in the Matching parameters dialog box (see Setting the
method and parameters used for matching, page 1-107), the matching comparisons
pane will be blank and there will be no matching lines between peaks in the Image
pane.
Similarly, displaying matching comparisons or the matching matrix in the Results pane
displays the dendrogram in the Graphics pane.
See Adjusting the panes in a Gel window, page 6-3, for how to maximize the Graphics
pane.
The molecular weight calibration graph
The molecular weight calibration graph is displayed in the Gel window’s Graphics pane:
When a molecular weight standard track is selected in the Image pane, the calibration
points are shown on the graph.
You can choose the shape of the calibration curve and how the calibration should be
propagated to other tracks – see the entry for Molecular weight calibration in the
Menus chapter, page 8-50.
You create the calibration graph by assigning molecular weights to peaks in one or more
tracks that you have defined as molecular weight standards – see the entries for
MW/quantity standard, page 8-94, and Assign molecular weight in the Menus
chapter, page 8-104.
6-8
GeneTools User Manual
Gel windows
The quantity calibration graph
The quantity calibration graph is displayed in the Gel window’s Graphics pane:
You can choose the shape of the calibration curve, how the calibration should be
propagated to other tracks and the quantity units to use – see the entry for Quantity
calibration in the Menus chapter, page 8-52.
The equation of the line or curve is shown in the Raw volume axis label along with the
correlation coefficient (R), which is a measure of how well the calibration points can be
fitted by a line or quadratic curve, depending on the selected calibration method (a
value of 1 means a perfect fit).
The example shows a quadratic calibration; the calibration points don’t quite lie on the
curve so the R value is slightly less than 1.
The graph shows data points for all the calibration peaks (in the selected region of
interest), not just the calibration peaks on the selected track. The graph also shows any
non-calibration peaks in the selected track. Calibration data points are marked by ;
non-calibration points by . Non-calibration points always lie on the calibration curve;
calibration points may not lie exactly on the calibration curve.
When you display the quantity calibration graph, the Peak value pane displays
quantities for the peaks on the track selected in the Image pane.
GeneTools User Manual
6-9
Windows
You create the calibration graph by assigning quantities to one or more peaks in one or
more tracks – see the entries for MW/quantity standard, page 8-94, and Assign
quantity in the Menus chapter, page 8-110.
The dendrogram
Dendrograms are a graphical technique for displaying track similarity based on matching
information. They represent hierarchical relationships using a tree-like structure, where
the branch lengths represent the similarity between tracks. The shorter the branch
lengths, the more similarly matched are the tracks.
Tracks are compared in pairs, starting with the two most similar. These two are then
treated as one and compared to the other tracks. This process is then continued for all
the tracks in the series. There are a number of different ways to calculate dendrograms
depending on the linkage rule used. In GeneTools you can use the Matching
parameters dialog box (see Setting the method and parameters used for matching,
page 1-107) to choose between using either:
●
UPGMA
In the Unweighted Pair-Group Method Average the distance between two clusters is
calculated as the arithmetic mean of the distances between all items in the two
clusters.
●
Neighbor joining
The ‘neighbor-joining method’ was devised by Saitou and Nei (see The
Neighbor-joining Method: A New Method for Reconstructing Phylogenetic Trees by
Naruya Saitou and Masatoshi Nei, in Mol. Biol. Evol. 4 (4) 406-425). Quoting from
the abstract to this paper:
A new method called the neighbor-joining methods is proposed for reconstructing
phylogenetic trees from evolutionary distance data. The principle of this method is
to find pairs of operational taxonomic units (OTU’s [=neighbors]) that minimize
the total branch length at each stage of clustering of OTU’s starting with a starlike
tree. The branch lengths as well as the topology of a parsimonious tree can
quickly be obtained using the method.
(See also Molecular phylogenetic analysis by Georg F. Weiller, Marcella A. McClure
and Adrian Gibbs in: Molecular Basis of Virus Evolution Eds. A. Gibbs, C. H. Calisher
and F. Garcia-Arenal, Cambridge University Press.)
The neighbor-joining method can be used when evolution across the tree is
expected to be non-constant. At each stage of clustering the total branch length is
6-10
GeneTools User Manual
Gel windows
minimized. The distance between two items is approximately the sum of the branch
lengths between them. The trees are not right-aligned and branches can have
negative values.
Dendrogram display
When you match tracks on a Gel sample, GeneTools automatically creates a
dendrogram and displays it in the Gel window’s Graphics pane (a dendrogram is also
displayed in the Profile comparison window if you use it to carry out a matching – see
Profile comparison window, page 6-18). The choice of linkage rule affects the way the
dendrogram is displayed (as well as the values calculated). For example:
●
UPGMA
The UPGMA dendrogram is right-aligned and drawn against a scale, which is shown
along the top of the pane.
GeneTools User Manual
6-11
Windows
●
Neighbor joining
The Neighbor-joining dendrogram is not right-aligned and the lengths of the
individual branches are shown on the lines themselves.
If required, you can change the colors used for the Neighbor-joining dendrogram nodes
and leaves – see page 8-143 for details.
If the dendrogram is larger than the Graphics pane, you can increase the size of the
pane, scroll the dendrogram to view hidden parts or scale the dendrogram to fit the
Graphics pane.
To scale the dendrogram to fit the Graphics pane:
1 Right-click in the dendrogram to display the dendrogram context menu.
2 Choose Scale to fit.
The dendrogram will be scaled to fit the Graphics pane:
6-12
●
Scale to fit is checked in the dendrogram context menu when autoscaling is
selected; choose the command again to switch autoscaling off.
●
When Scale to fit is selected, if you resize the Graphics pane, the dendrogram will
be rescaled so that it still fills the pane.
GeneTools User Manual
Gel windows
For the Neighbor-joining dendrogram you can choose which node in the tree to display
at the root of the dendrogram.
To choose a different node to be the root of a Neighbor-joining dendrogram:
Click on the node in the dendrogram:
The dendrogram will be redisplayed with the selected node at the root:
Note that this only affects the way the tree is displayed – the correlation values and
connectivity of the tree are unaffected.
GeneTools User Manual
6-13
Windows
Results pane
See Adjusting the panes in a Gel window, page 6-3, for how to maximize the Results
pane.
The Results pane can show:
●
the results for the track selected in the Image pane:
See the next section for how to choose what information to include in the table.
●
the results for all tracks (in the selected area of interest):
See the next section for how to choose what information to include in the table.
●
6-14
a table of matching comparisons (for the selected area of interest):
GeneTools User Manual
Gel windows
See the next section for how to choose what information to include in the table.
Note
The matching comparisons table is blank if there is no active matching standard track. In
particular, it is always blank if Profile is selected as the matching type in the Matching
parameters dialog box (see Setting the method and parameters used for matching,
page 1-107).
●
Note
a matching matrix showing which peaks on the matching standard are matched on
each of the matched tracks (for the selected area of interest):
The matching matrix table is blank if there is no active matching standard track. In
particular, it is always blank if Profile is selected as the matching type in the Matching
parameters dialog box (see Setting the method and parameters used for matching,
page 1-107).
●
a similarity matrix of matching coefficients showing the correlation between matching
peaks on different tracks (for the selected area of interest):
See Similarity matrix, page 1-114, for information about how the matching coefficients
are calculated.
GeneTools User Manual
6-15
Windows
●
for High Throughput Gels (Madge or E-Gel), a manual matching table allowing you
to assign a matching result manually to each of the tracks:
To change the matching result for a track:
1 Click in the track frame to select it.
Note
You can change the matching results at any time: the sample can be locked or
unlocked, and if unlocked, it can be in any track editing mode.
2 In the numeric keypad, press:
+
to assign a matching result of +1 to the track
-
to assign a matching result of 0 to the track
*
to assign a matching result of -1 to the track (this is the default).
3 If required, press
vto tab to the next track to set its matching result.
Choosing what information to show in results tables
To choose what information to include in the Results for selected track, Results for all
tracks and Matching comparisons tables:
1 Click on the tab for the table you want to change.
2 Right-click on the table to pop up a menu.
3 Choose the parameter to add to or remove from the table.
4 Repeat for any other parameters you want to add or remove.
The commands for the parameters included in the table are checked in the menu.
6-16
GeneTools User Manual
Molecular weight library window
Molecular weight library window
A molecular weight library is a collection of molecular weight/quantity standards. Each
standard lists the molecular weights and/or quantities for a set of peaks. You use the
library to calibrate a gel by assigning one of the standards contained in the library to
one or more standard tracks in the gel. If you use the same standard solution for
different gels, using a molecular weight library saves you entering the molecular
weights/quantities individually for each peak in the standard tracks.
Note
You can create as many other molecular weight libraries as you wish (see the entry for
New library in the File menu in the Menus chapter – page 8-13), but you can only
have one open at a time – see the entry for Open library in the Menus chapter,
page 8-14. When you start up GeneTools, the default molecular weight library is
opened automatically – see Setting the default molecular weight library, page 1-98, for
how to specify the default library.
Molecular weight libraries can be viewed and edited in the Molecular weight library
window:
GeneTools User Manual
6-17
Windows
In this example, the library MwLibrary.mwl contains two standards added by the user
(1 Cal test containing quantities only and 10 Cal test containing quantities and
molecular weights) in addition to the molecular weight standards 100bp ladder, 1kb
ladder, BRL-100bp, BRL-10bp etc, which are supplied with GeneTools.
You can expand or contract the display of each standard in the window to show or hide
its list of peak values. For example, the display of 100bp ladder is expanded in the
picture above, but 1kb ladder is contracted.
To expand the display of a standard:
Click on the + to the left of the standard’s name.
To contract the display of a standard:
Click on the - to the left of the standard’s name.
To close the Molecular weight library window:
1 Click in the window or choose it from the list at the bottom of the Window
menu.
2 Choose Close from the File menu.
Clicking on the close button at the top right-hand corner of the Molecular weight library
window only minimizes the window.
See Working with molecular weight libraries, page 1-92, for further details.
Profile comparison window
The Profile comparison window allows you to compare the profiles on different tracks
(and different gels) by plotting them on the same axes. Additionally, if you have
purchased the GeneTools Match software option, you can use the Profile comparison
window to perform track matching between tracks, which may be in the same or
different areas of interest, or even on different gels.
To display the Profile comparison window:
Choose Profile comparison from the View menu.
6-18
GeneTools User Manual
Profile comparison window
The Profile comparison window will open. The appearance of the window depends on
whether the GeneTools Match software option is installed:
GeneTools Match software option not installed
GeneTools Match software option installed
The Track browser pane (the left-hand pane) shows the path and filenames for all the
open Gel windows and allows you to select which tracks to include in the comparison.
The Profiles pane (the right-hand pane for systems without the GeneTools Match
software option; the center pane for systems with it) is used to plot the intensity profiles
for the selected tracks.
GeneTools User Manual
6-19
Windows
The Match results pane (the right-hand pane for systems with the GeneTools Match
software option; absent for systems without it) contains the similarity matrix and
dendrogram tabs showing the matching results.
Viewing tracks
To view the tracks in the secure sample file(s) in the Track browser pane so that you can
select them for comparison or matching:
Click on the + icon(s) next to the secure sample file(s) (or double-click
anywhere else in the row):
to show the tracks in the file:
(Click on the - icon or double-click again anywhere else in the row to hide
the tracks in the left-hand pane.)
Selecting tracks for a comparison
To choose which tracks to include in a comparison:
1 In the Track browser pane, click on the first track that you want to include in
the comparison.
6-20
GeneTools User Manual
Profile comparison window
2 Choose Show from the Profile menu (or the menu displayed if you right-click
on the track).
Or:
Just double-click on the track.
Or, to include all the tracks in a comparison:
Choose Show all from the Profile menu.
Show will be checked in the menu when a profile is shown, a line showing the color
used for drawing the profile will be shown next to the track in the left-hand pane and
the profile will be drawn in the right-hand pane.
(Choosing Show again for the same track, or double-clicking again, removes the track
from the comparison; choosing Hide all from the Profile menu removes all tracks from
the comparison.)
Viewing profiles
After you have selected Show, the corresponding profile will be displayed in the Profiles
pane:
(In the example all the profiles are for tracks on the same gel, but you can use the same
procedure to include tracks from different files if you wish).
GeneTools User Manual
6-21
Windows
The profiles in the Profiles pane are drawn in the colors shown by the colored lines
next to the tracks in the Track browser pane. You can use Configuration in the Extras
menu to define the color for each of the profile lines – see page 8-143.
The vertical scale shows the image gray level. The default horizontal scale is the Rf value
from 0, the Rf start position, to 1, the Rf end position (see Adjusting the Rf start and end
positions, page 1-43, for how to set these), but if you have assigned molecular weights
to a standard track, you can also use (log) molecular weight for the horizontal scale.
Note
If the Band matching option is installed in your system, the parameter chosen for the
horizontal scale also determines the alignment used when matching tracks in the Profile
comparison window.
To choose whether to use Rf or (log) molecular weight for the horizontal scale for
plotting profiles in the Profile comparison window:
Choose MW or Rf from the View®Plot mode submenu.
Note
If you choose MW and have not yet assigned molecular weights to a standard track, the
profile plot will be blank – see Assigning molecular weights/quantities to a standard
track, page 1-79.
You can change the magnification of the horizontal scale in the Profile comparison
window by choosing Zoom in, Zoom out or Zoom reset from the View menu, or by
clicking on the equivalent tools in the Zoom toolbar. When you have zoomed the
Profile comparison window, only part of the Rf/MW range is visible, but you can
choose which part to view using the horizontal scroll bar.
Setting a reference track
Note
6-22
If the Band matching option is installed in your system, the reference track will also be
used as the Matching standard track for peak matching comparisons – see the following
section for details.
GeneTools User Manual
Profile comparison window
To highlight one of the tracks in the comparison as a reference:
Select the track and choose Reference from the Profile menu (or the menu
displayed if you right-click on the track):
Track 4 in the example is the reference track – it is highlighted in the Track browser
pane and (by default) plotted in red in the profiles pane (you can use Configuration in
the Extras menu to define the color used for the reference line – see page 8-143).
If you repeat this operation, the new track will become the reference – only one track
in a comparison can be defined as the reference track.
If the track you define as the reference is not already included in the comparison, it will
become shown in the comparison automatically. However, you can remove it from the
comparison if required without it losing the status of being the reference – if you show
it again, it will still be the reference, provided you have not chosen another track as the
reference meanwhile.
Matching tracks in the Profile comparison window
If you have purchased the GeneTools Match software option, you can match tracks in
the Profile comparison window as well as in Gel windows (see How to match peaks on
different tracks, page 1-105, for how to match tracks in Gel windows). The two methods
share many features, but one difference between the two techniques is that in a Gel
window, you can only match peaks on tracks that lie within the same area of interest,
while in the Profile Comparison window you can match tracks lying in different areas
of interest, or even on different gels. On the other hand, if you match peaks in a Gel
GeneTools User Manual
6-23
Windows
window, you can get more detailed results in the form of the matching comparisons
table and the similarity matrix, and you can edit matchings manually.
To choose how the matching should be performed:
Choose Parameters from the Matching menu to display the Matching
parameters dialog box – see Parameters, page 8-118, for details.
In particular, you can choose whether to match bands (peaks) or profiles. When you
match peaks, the detected peaks on each track are matched to the detected peaks on a
selected matching reference track, so to carry out band matching, you must detect the
peaks on the tracks and select a reference track (see previous section); neither of these
steps is required for profile matching.
To choose which tracks to include in a match:
1 In the Track browser pane, click on the first track that you want to include in
the match.
2 To add a single track to the matching:
Choose Include selected in matching from the Matching menu (or the
context menu displayed if you right-click on the track).
(Choosing Include selected in matching again for the same track removes
the track from the matching.)
Or, to include all the tracks in a matching:
Choose Include all from the Matching menu.
(To remove all of the tracks from the matching, choose Exclude all from
the Matching menu.)
You must include at least three tracks in the matching – the tracks may be selected from
the same gel or different gels. If you have chosen to carry out band matching in the
Matching parameters dialog box, you must also select a reference track – see previous
section.
6-24
GeneTools User Manual
Profile comparison window
Matching results
When you have included at least three tracks in the matching, and selected a reference
track if you have chosen to carry out band matching in the Matching parameters
dialog box, the matching is carried out automatically and the results displayed in the
Match results pane. The pane has two tabs:
●
Similarity matrix
●
Dendrogram
You can work with these results panes in exactly the same way as in the Gel window –
see The Results pane, page 6-14, and The Dendrogram, page 6-10, for details.
Other Profile comparison window operations
See Printing reports – Profile comparisons, page 1-129, for how to print a report
showing a Profile comparison.
You can display a dialog box showing the properties of a track by selecting the track in
the left-hand pane of the Profile comparison window and choosing Properties from
GeneTools User Manual
6-25
Windows
the Profile menu – see page 8-119 for details; see page 8-102 for pictures of the dialog
box.
You can export the data points (Rf and height values) to Excel for a track by
right-clicking on the track in the left-hand pane of the Profile comparison window to
pop up a menu and choosing Export To Excel – see page 8-150.
Colony counting window
When you open a Colony counting sample it is opened in a Colony counting window:
For a monochrome image you can use the image controls on the right-hand side of the
window and the Histogram viewer to control the display of the image – see pages
6-33–6-35 for instructions.
GeneTools automatically counts the colonies within an elliptical frame on the image.
You can move, reshape and resize the frame as required, and the results will be
updated automatically. You can also define exclude regions on the image where
6-26
GeneTools User Manual
Colony counting window
GeneTools will ignore any colonies. You use the radio buttons in the Define frame box
to select the mode for adjusting the frame or for drawing or adjusting exclude regions.
The controls in the Auto-detection box allow you to set the parameters used by the
colony detection software. You can also choose whether to highlight the areas of the
image detected as colonies using the Show colony shapes check box at the bottom
left-hand corner of the window.
The results are displayed in the results table in the Results box at the left-hand side of
the Colony counting window. When the sample contains light or dark colonies only (but
not both), you can use the Histogram in the Results box to define a boundary between
two classes of colonies (light and lighter or dark and darker). When the sample contains
both light and dark colonies, the Histogram is not displayed but the totals for dark and
light colonies are shown separately as Class 1 and Class 2. The colonies of each class
are marked separately on the image: dark colonies are marked with circles and light
colonies with squares:
If you select Add/remove colonies in the Define frame box you can add or remove
colonies from the count by double-clicking on the image – the Manual Detection radio
buttons will be enabled so that you can choose which class of colonies to add or
remove.
See Getting started with Colony counting in the GeneTools Getting Started manual for
full instructions on using GeneTools to count colonies.
GeneTools User Manual
6-27
Windows
Spot blot/Manual band quantification window
When you open a Spot blot or Manual band quantification sample it is displayed in a
Spot blot/Manual band quantification window:
The picture shows a gridded Spot blot sample (see Step 3 on page 4-4): the window
can also show non-gridded Spot blot samples with circular and/or rectangular spot
frames (for further details, see chapter 4 – Using GeneTools for Spot blot analysis), and
Manual band quantification samples with rectangular measurement boxes (for further
details, see Getting started with Manual band quantification in the GeneTools Getting
Started manual).
6-28
GeneTools User Manual
Spot blot/Manual band quantification window
For a monochrome image you can use the image controls on the right-hand side of the
window and the Histogram viewer to control the display of the image – see pages
6-33–6-35 for instructions.
The Spot blot/Manual band quantification window is split into two parts:
●
The Image pane
●
The Results/Incidence/Calibration graph pane.
You can adjust the position of the split in the same way as for the Gel window (see
page 6-3).
Image pane
The upper part of the Spot blot/Manual band quantification window shows the Spot
blot or Manual band quantification image.
You can change the magnification of the image by choosing Zoom in, Zoom out or
Zoom reset from the View menu or by clicking on the equivalent tools in the Zoom
toolbar.
For a Spot blot sample, you can use GeneTools to locate a grid of circular spot frames
over the spots on the sample, or place individual circular or rectangular frames; for a
Manual band quantification sample, you can place rectangular or free hand boxes over
the bands.
The spot frames and boxes define the area within which GeneTools measures quantities
from the spots or bands. You can move the frames or boxes (see page 4-26) and resize
them (see page 4-21). For Spot blot samples, you can change the shape of the frames
from circular to rectangular and vice versa.
The spot frames or boxes on the image are identified by labels:
●
If a Spot blot sample is gridded, the label consists of a letter identifying the row and
a number identifying the column in the grid.
●
If the sample is a Manual band quantification sample or a non-gridded Spot blot
sample, the label is a number that shows the order in which the spot frames or
boxes were added.
You can select a spot frame or box by clicking on it. The selected frame or box is
identified by color (you can use Configuration in the Extras menu to set the color – see
page 8-143).
GeneTools User Manual
6-29
Windows
For a gridded Spot blot sample, if Position is selected in the Spots menu, you can
double-click on a spot frame to set it as a ‘positioning point’; double-click again to
unset it. Positioning points are identified by color (you can use Configuration in the
Extras menu to set the color – see page 8-143). When you drag a positioning point,
you adjust the position of the other spot frames, not just the selected frames. You can
set more than one positioning point – any other positioning points act as fixed anchors
for the grid when you drag a positioning point. See How to adjust the spot frame
positions, page 4-26, for how to move the spot frames on the image.
When you assign a quantity to a spot frame or box to calibrate quantity measurements,
the frame or box is marked with a cross:
or
6-30
GeneTools User Manual
Spot blot/Manual band quantification window
Results/Incidence/Calibration graph pane
Results page
Click on the Spot blot results (or Manual band quantification results) tab to display
the results page in a Spot blot/Manual band quantification window.
To choose what parameters to show in the Results table:
1 Right-click on the table to display the Spot blot results context menu:
2 Click on the required parameter in the list at the top of the menu to add it to
or remove it from the Results table.
If a Spot blot sample is gridded, you can choose whether to display the results in a oneor two-dimensional table (Manual band quantification results and non-gridded Spot blot
results are always displayed in a one-dimensional table).
To choose whether to display Spot blot results for a gridded Spot blot sample in a oneor two-dimensional table:
1 Click on the Spot blot results tab.
2 Right-click in the table to display the Spot blot/Manual band quantification
window Results pane context menu.
3 Choose Table 1D or Table 2D.
The selected command will become checked in the menu.
In a one-dimensional table, the results for the first row of spots are given first, then the
second row and so on.
GeneTools User Manual
6-31
Windows
Incidence page
Click on the Incidence tab to display the Incidence page in a Spot blot/Manual band
quantification window:
The picture shows the Incidence page for a gridded Spot blot sample (see Step 3 on
page 4-4). For non-gridded Spot blot samples and Manual band quantification samples
the matrix consists of a single column.
The matrix shows whether each spot or box satisfies an incidence condition defined
using Spot incidence parameters in the Spots menu – see How to define an incidence
condition, page 4-39.
Quantity calibration page
Click on the Quantity calibration tab to display the Quantity calibration page in a
Spot blot/Manual band quantification window:
The graph shows the points corresponding to all the spot frames or boxes on the image
(not just the calibration points).
6-32
GeneTools User Manual
Image controls
You can choose the shape of the calibration curve and the units – see How to set the
quantity calibration method, page 4-33.
You create the calibration graph by assigning quantities to one or more spot frames or
boxes on the image – see page 4-34.
Image controls
For a monochrome image the image controls on the right-hand side of Sample windows
allow you to control the way the image is displayed on the screen and the way it is
printed in reports (see the next section for how to use the Histogram viewer as an
alternative for changing the way the image is displayed).
Note 1
The settings of the image controls have no effect on the way GeneTools analyzes the
images (for example when it locates tracks and peaks, or measures quantities) –
GeneTools always uses the original data for analysis.
Note 2
The image controls do not appear if the window contains a full color image.
To adjust the brightness of the image:
Drag the Image brightness slider control.
To restore the original image brightness:
Press the Reset brightness button.
To adjust the contrast of the image:
Drag the Image contrast slider control.
To restore the original contrast brightness:
Press the Reset contrast button.
To adjust the gamma correction of the image:
Drag the Gamma correction slider control.
GeneTools User Manual
6-33
Windows
To restore the original gamma correction for the image:
Press the Reset gamma correction button.
Note
Gamma correction allows you to adjust the midtones in an image without changing the
lightest and darkest tones – it determines the shape of the response curve between the
black and white points, which are fixed by the brightness and contrast settings.
The Histogram viewer
To show or hide the Histogram viewer:
Choose Histogram from the View menu.
The Histogram viewer displays a histogram showing the distribution of intensities in the
image:
The horizontal axis shows the possible intensity values in the image from 0 to the
maximum (the example is taken from an 8-bit image so the maximum intensity is 255;
the maximum for a 16-bit image would be 65535, and so on).
The Histogram viewer displays two vertical red cursor lines on the histogram. These are
the black and white value cursors – pixels in the image with the intensity value at or
outside the black value cursor will be shown as black on the screen; pixels with the
intensity value at or outside the white value cursor will be shown as white on the
screen; pixels with values between the cursors will be shown in tones of gray
intermediate between black and white.
Note
6-34
The exact relationship between the intensity value and the gray tone for pixels with
values lying between the cursors is determined by the gamma correction value.
GeneTools User Manual
Image controls
To adjust the image display using the Histogram viewer:
1 Move the pointer over the black or white value cursor, depending on which
one you want to move. The pointer will change shape to show that you can
move the cursor:
2 Drag the cursor to its new position:
In this example the black value cursor has been dragged to the lowest intensity value
actually appearing in the image, so pixels with this value will now be shown in black
rather than dark gray – the effect is to increase the contrast without losing any
information. In general, you can adjust the position of the cursors to expand the
contrast to show details of interest.
Dragging the black or white value cursor is equivalent to a combination of adjusting the
contrast and brightness sliders – you can see the sliders adjust as you drag a cursor.
Similarly, adjusting the contrast or brightness slider is equivalent to a combination of
dragging the black and white value cursors – again you can see the cursors adjust as you
drag a slider.
To reset the brightness and contrast:
Double-click in the Histogram viewer.
GeneTools User Manual
6-35
Windows
6-36
GeneTools User Manual
Toolbars
GeneTools has a number of toolbars with buttons that provide shortcuts to using menu
commands. GeneTools automatically shows and hides the toolbars depending on what
type of window is selected. However, you can also show or hide toolbars manually.
To show or hide a toolbar:
Choose the toolbar’s name from the View®Toolbars submenu.
The command is checked in the menu when the toolbar is shown.
The rest of this chapter summarizes the function of each button.
The Standard toolbar
The Standard toolbar is always displayed.
Open
Press the Open button to open a secure sample file.
Pressing the Open button is equivalent to choosing Open from the File menu.
Save
Press the Save button to save the secure sample file in the selected Sample
window or molecular weight library in the selected library window.
Pressing the Save button is equivalent to choosing Save from the File menu.
GeneTools User Manual
7-1
Toolbars
Help
Press the context-sensitive Help button to display Help for a menu command,
button or window area.
When you press the context-sensitive Help button, the pointer changes to a question
mark. Use this pointer to select a menu command, or click on a button or window area
to display the help.
Sample properties
Press the sample properties button to view or edit the settings and notes for a
secure sample file.
Pressing the sample properties button is equivalent to choosing Sample properties from
the File menu.
Report toolbar
The Report toolbar is displayed when any Sample window or the Profile Comparison
window is selected.
Report setup
Press the Report setup button to choose what information to print in Sample
reports.
Pressing the Report setup button is equivalent to choosing Report setup from the File
menu.
Preview
Press the Preview button to preview a report on the contents of the selected
window before it is printed.
Pressing the Preview button is equivalent to choosing Preview from the File menu.
7-2
GeneTools User Manual
Report toolbar
Print
Press the Print button to print a report on the contents of the selected window.
Pressing the Print button is equivalent to choosing Print from the File menu.
Export table to Excel
Press the Export table to Excel button to export the contents of the selected
Results pane page to Excel.
Pressing the Export table to Excel button is equivalent to choosing Export table to Excel
from the File menu.
Save table to CSV file
Press the Save table to CSV file button to export the contents of the selected
Results pane page to a comma separated values format file.
Pressing the Save table to CSV file button is equivalent to choosing Save table to CSV
file from the File menu.
Export to Word
Press the Export to Word button to create a report in a Word document.
Pressing the Export to Word button is equivalent to choosing Export to Word from the
File menu.
Save to clipboard
Press the Save to clipboard button to copy a picture of the image in the Image
pane in the current window to the clipboard.
Pressing the Save to clipboard button is equivalent to choosing Save to clipboard from
the File menu.
GeneTools User Manual
7-3
Toolbars
Track toolbar
The Track toolbar is displayed when a Gel window is selected (some tools are disabled
when the window contains a High Throughput Gel sample).
Locate tracks
Press the Locate tracks button to locate the tracks automatically in the selected
area of interest on the image in the selected Gel window.
Pressing the Locate tracks button is equivalent to choosing Locate tracks from the Track
menu.
Lock all
Press the Lock all button to lock the tracks on the image (in the selected area of
interest) in the selected Gel window.
When the tracks are locked, Lock all is checked in the menu and the button is shown
as depressed in the toolbar.
You need to lock the tracks before you can perform any of the functions that require
the program to analyze the image along the tracks, such as locating the peaks, and
assigning and calculating molecular weights and quantities
Tracks are unlocked when you choose any of the following tools for editing the tracks:
Position All, Splay All, Move/tilt, Width, Rf start and Rf end.
Pressing the Lock all button is equivalent to choosing Lock all from the Track menu.
Position all
Press the Position all button to adjust the horizontal and vertical position of all
the tracks (in the selected area of interest) on the image in the selected Gel
window.
Pressing the Position all button is equivalent to choosing Position all from the Track
menu.
7-4
GeneTools User Manual
Track toolbar
Splay all
Press the Splay all button to adjust the amount by which the tracks are splayed
and the overall position of all the tracks (in the selected area of interest) on the
image in the selected Gel window.
Pressing the Splay all button is equivalent to choosing Splay all from the Track menu.
Move/tilt
Press the Move/tilt button to adjust the position of a single track on the image (in
the selected area of interest) in the selected Gel window.
Pressing the Move/tilt button is equivalent to choosing Move/tilt from the Track menu.
Width
Press the Width button to adjust the width of individual tracks, if Width
individual is selected in the Track menu, or all tracks (in the selected area of
interest), if Width individual is not selected, on the image in the selected Gel
window.
Pressing the Width button is equivalent to choosing Width from the Track menu.
Rf start position
Press the Rf start position button to adjust the position of the Rf start line (in the
selected area of interest) on the image in the selected Gel window.
Pressing the Rf start position button is equivalent to choosing Rf start position from the
Track menu.
Rf end position
Press the Rf end position button to adjust the position of the Rf end line (in the
selected area of interest) on the image in the selected Gel window.
Pressing the Rf end position button is equivalent to choosing Rf end position from the
Track menu.
GeneTools User Manual
7-5
Toolbars
Zoom toolbar
The Zoom toolbar is displayed when any Sample window or the Profile Comparison
window is selected.
Zoom in
Press the Zoom in button to increase the magnification of the image in the
selected Sample window, or the horizontal scale in the Profile comparison
window, whichever is selected.
Pressing the Zoom in button is equivalent to choosing Zoom in from the View menu.
Zoom out
Press the Zoom out button to decrease the magnification of the image in the
selected Sample window, or the horizontal scale in the Profile comparison
window, whichever is selected.
Pressing the Zoom out button is equivalent to choosing Zoom out from the View menu.
Zoom reset
Press the Zoom reset button to reset the size of the image in the selected Sample
window, or the horizontal scale in the Profile comparison window, whichever is
selected, to the default.
Pressing the Zoom reset button is equivalent to choosing Zoom reset from the View
menu.
7-6
GeneTools User Manual
Calibrations toolbar
Calibrations toolbar
The Calibrations toolbar is displayed when a Gel window is selected.
Integration parameters
Press the Integration parameters button to set, view or change the parameters
used for analyzing the image.
Pressing the Integration parameters button is equivalent to choosing Integration
parameters from the Edit menu.
Quantity calibration
Press the Quantity calibration button to set, view or change the calibration
method and units for quantity determinations (in the selected area of interest).
Pressing the Quantity calibration button is equivalent to choosing Quantity calibration
from the Edit menu.
Assign quantity
Press the Assign quantity button to assign a quantity to the selected peak.
Pressing the Assign quantity button is equivalent to choosing Assign quantity from the
Peak menu.
Molecular weight calibration
Press the Molecular weight calibration button to specify how molecular weights
should be calculated from assigned molecular weights on molecular weight
standard tracks (in the selected area of interest).
Pressing the Molecular weight calibration button is equivalent to choosing Molecular
weight calibration from the Edit menu.
GeneTools User Manual
7-7
Toolbars
MW/quantity standard
Press the MW/quantity standard button to define the selected track as a
molecular weight standard (for the selected area of interest) if it isn’t one already,
and to assign molecular weights to peaks in the track. If the track is already a
molecular weight standard, pressing the MW/quantity standard button removes its status
as a molecular weight standard.
Pressing the MW/quantity standard button is equivalent to choosing MW/quantity
standard from the Track menu.
Profile comparison window
Press the Profile comparison window button to open the Profile comparison
window.
Pressing the Profile comparison window button is equivalent to choosing Profile
comparison from the View menu when a Gel window is selected.
Database toolbar
Note
The Database toolbar is only available if you have purchased the GeneDirectory option.
The Database toolbar is displayed when a Gel window is selected.
Archive gel to database
Press the Archive gel to database button to archive gel data in GeneTools to the
connected GeneDirectory database.
Pressing the Archive gel to database button is equivalent to choosing Archive gel to
database from the Database menu.
7-8
GeneTools User Manual
Peak matching toolbar
Open GeneDirectory
Press the Open GeneDirectory button to open the connected database in
GeneDirectory.
Pressing the Open GeneDirectory button is equivalent to choosing Open
GeneDirectory from the Database menu.
Connect to database
Press the Connect to database button to select and connect GeneTools to a
GeneDirectory database so that you can archive gene data.
Pressing the Connect to database button is equivalent to choosing Connect to database
from the Database menu.
Peak matching toolbar
Note
This is only available if you have purchased the GeneTools Match software option.
The Peak Matching toolbar is displayed when a Gel window is selected.
Band matching
Press the Band matching button to specify how peaks should be matched
between tracks (in the selected area of interest).
Pressing the Band matching button is equivalent to choosing Band matching from the
Edit menu.
GeneTools User Manual
7-9
Toolbars
Matching standard
Press the Matching standard button to define the selected track as a matching
standard (for the selected area of interest) if it isn’t one already. If the track is
already a matching standard, pressing the Matching standard button removes its
status as a matching standard.
Pressing the Matching standard button is equivalent to choosing Matching standard
from the Track menu.
Spot blot toolbar
The Spot blot toolbar is displayed when a Spot blot/Manual band quantification window
is selected (some tools are disabled when the window contains a Manual band
quantification sample).
All spots same size
Press the All spots same size button to force all spots or boxes to be the same
size as the selected spot or box.
Pressing the All spots same size button is equivalent to choosing All spots same size
from the Spots menu.
Position control points
Press the Position control points button to unlock the spot frames on a gridded
Spot blot image so that you can move or reshape the grid using control points.
The spot frames are also unlocked so that you can change their size and, in the
case of rectangular spot frames, their shape using the mouse. The button is shown as
depressed when the spot frames are unlocked; press the button again to lock them.
Pressing the Position control points button is equivalent to choosing Position control
points from the Spots menu.
7-10
GeneTools User Manual
Spot blot toolbar
Locate
Press the Locate button to display the Spot Location Tool dialog box so that you
can set the spot location parameters and locate the positions of the spots on a
Spot blot image automatically.
Pressing the Locate button is equivalent to choosing Locate from the Spots menu.
Position any spot
Press the Position any spot button so that you can adjust the position of
individual spots on a Spot blot or Manual band quantification image.
Pressing the Position any spot button is equivalent to choosing Position any spot from
the Spots menu.
Background correction
Press the Background correction button to display the Background correction
dialog box so that you can apply or remove background correction to the raw
volume measurements from the image.
Pressing the Background correction button is equivalent to choosing Background
correction from the Spots menu.
Lock position
Press the Lock position button to lock the sizes and positions of the spot frames
on a Spot blot or Manual band quantification image so that they cannot be
adjusted with the mouse or deleted. The button is shown as depressed when the
spot frames are locked; press the button again to unlock them.
Pressing the Lock position control points button is equivalent to choosing Lock position
from the Spots menu.
Spot incidence parameters
Press the Spot incidence parameters button to display the Spot incidence
parameters dialog box so that you can set the conditions used to define the
Incidence matrix.
Pressing the Spot incidence parameters button is equivalent to choosing Spot incidence
parameters from the Spots menu.
GeneTools User Manual
7-11
Toolbars
Circle
Press the Circle button to change the selected rectangular spot frame to be
circular.
Pressing the Circle button is equivalent to choosing Circle from the Spots menu.
Rectangle
Press the Rectangle button to change the selected circular spot frame to be
rectangular.
Pressing the Rectangle button is equivalent to choosing Rectangle from the Spots menu.
Free hand
Press the Free hand button to draw a free hand box over a band on a Manual
band quantification sample
Note
This command only applies to Manual band quantification samples.
Pressing the Free hand button is equivalent to choosing Free hand from the Spots
menu.
Quantity calibration parameters
Press the Quantity calibration parameters button to set or view the calibration
method and units for quantity determination.
Pressing the Quantity calibration parameters button is equivalent to choosing Quantity
calibration from the Edit menu.
Assign quantity
Press the Assign quantity button to assign a quantity to the selected spot frame.
Pressing the Assign quantity button is equivalent to choosing Assign quantity from the
Spots menu.
7-12
GeneTools User Manual
Menus
File (Sample and Profile comparison windows)
GeneTools User Manual
8-1
Menus
This section describes all of the commands appearing on the File menu when a Sample
window or the Profile comparison window is selected; the following section describes
the File menu when a Molecular weight library window is selected (see the Windows
chapter (chapter 6) for information about the different types of window).
The picture shows the File menu when a Gel window is selected. Some commands are
hidden and some are disabled when other types of Sample window or the Profile
comparison window are selected – the entry for each command says if it is not
available for all types.
New (Import)
Note
This command is disabled when the Profile comparison window is selected.
To create a new secure sample file (for example, from a non-secure .tif or .bmp image
file):
1 Choose New (Import) from the File menu to display a standard Windows
Open dialog box:
2 Choose the type of image file from the Files of type drop-down list box.
3 Use the Look in drop-down list box to select the folder containing the image
file.
4 Click on the file in the list box to select it – the name of the file will appear in
the File name box.
8-2
GeneTools User Manual
File (Sample and Profile comparison windows)
5 Press Open to close the dialog box and go on to the next step in the
procedure.
What happens next depends on whether you have set Auto import methods
and you have selected a secure sample file as the source for the settings to
import:
●
If you have, the Import method dialog box will open so that you can
choose which settings to import. For further details, see, for example,
Opening or creating a secure sample file with automatic import, page 1-16.
●
Otherwise, go to Step 6.
6 The Sample properties dialog box will open so that you can set the type of
image and make other settings:
7 Choose the type of image from the Analysis type box – see Configuration in
the Extras menu (page 8-139) for how to set the default Analysis type.
GeneTools User Manual
8-3
Menus
8 For a Gel sample:
a The Image type is detected automatically, but you can change it if you
want to.
b Click on a radio button to specify the Electrophoresis direction.
c If you just want to work with a single area of interest on the image, leave
the numbers of Columns and Rows set to 1.
If you want to define a grid of several areas of interest on the image, enter
the numbers of Columns and Rows in the grid.
d For each of the areas of interest, click in it on the image to select it (drag
handles appear at the corners and on the sides of the rectangle defining
the area when it is selected):
i
To move the area of interest, drag it on the preview, avoiding the drag
handles.
ii To define the size and shape of the area of interest, drag the handles.
iii To choose automatic track detection for the area, press Locate tracks
automatically.
Note
In nearly all cases the GeneTools automatic track location will be able to locate the
tracks on the gel correctly and position track markers over them accurately without
further assistance, and this is the recommended way of working with GeneTools.
However, very occasionally you may have a gel that causes problems, and if automatic
track location fails to identify the tracks correctly, you can redisplay the Sample
properties dialog box (by repeating this complete procedure or by choosing Sample
properties from the File menu), and then check Hint and enter the approximate
number of tracks in the area of interest.
To choose manually how many tracks you want to place in the area of
interest, press the Create radio button to enable the tracks for manual
positioning spin box and enter the number of tracks you want to place
in that area of interest. The tracks will be placed at default positions
and you will need to position them manually later.
8-4
GeneTools User Manual
File (Sample and Profile comparison windows)
Note
The Leave the tracks unchanged radio button is only enabled when the Sample
properties dialog box is displayed for an existing analyzed sample (see the entry for
Sample properties in the File (Gel) section in the Menus chapter (page 8-28)).
For a Colony (pour plate) sample:
The Image type is detected automatically, but you can change it if you
want to – in particular, you will need to set
Light and dark colonies manually if required.
For a Spot blot sample:
a The Image type is detected automatically, but you can change it if you
want to.
b Choose the shape of spot frames to apply from the Spot type box.
c Do one of:
●
●
Press Locate spots automatically if you want GeneTools to detect the
positions of the spots automatically:
●
Check Gridded if you want GeneTools to place a grid of spot
frames over the spots it detects.
●
Uncheck Gridded if you want GeneTools to detect the spots
automatically and place an individual spot frame over each one.
●
Press Create spots for manual positioning to place a rectangular grid
of spot frames in a default position on the image:
●
Enter the number of Columns and Rows you want to appear in the
grid.
Press Leave the spots unchanged if you do not want to put any spot
frames on the image yet – you will be able to add spots manually later.
For a Manual Band Quantification sample:
The Image type is detected automatically, but you can change it if you
want to.
GeneTools User Manual
8-5
Menus
For a High Throughput Gel sample:
a Select the type of High Throughput Gel analysis you are using from the
Gel type drop-down list box. You can choose:
●
Madge 71.6 degree rotation
●
Madge 78.7 degree rotation
●
E-Gel 96
b The Image type is detected automatically, but you can change it if you
want to.
c Click on a radio button to specify the Electrophoresis direction.
d If you are opening a 96-well sample, leave the Number of columns and
Number of rows set to 1.
If you are working with a 192-well sample, set the Number of columns to
2 and the Number of rows to 1 if the two sets of tracks are side-by-side;
set the Number of rows to 2 and the Number of columns to 1 if the two
sets of tracks are one above the other.
Note
Areas of interest can overlap with each other.
e For each of the areas of interest (shown by a red box on the image), click
in it on the image to select it (drag handles appear at the corners and on
the sides of the rectangle defining the area when it is selected):
i
To move the area of interest, drag it on the preview avoiding the drag
handles.
ii To define the size and shape of the area of interest, drag the handles.
Note
Each area of interest determines the initial position of a grid of 96 track frames, which
should be positioned over the corresponding tracks in the gel. However, you will be
able to adjust the postion of the track frame grids and individual track frames later in
the Gel window, so it is not essential to adjust the areas of interest with great accuracy.
9 Click on the Analysis notes tab and enter any notes you want to save with
the secure sample file.
8-6
GeneTools User Manual
File (Sample and Profile comparison windows)
See Sample properties in the File menu (page 8-28) for more information on
how to use the Sample properties dialog box.
10 Press OK to close the Sample properties dialog box.
For a Gel or High Throughput Gel, a Gel window will open containing the sample. If
you have set automatic track location (the recommended way of working with
GeneTools), the tracks will be locked; otherwise they will be unlocked ready for you to
position them accurately on the image.
For a colony (pour plate) sample, a Colony counting window will open containing the
sample.
For a Spot blot sample, a Spot blot/Manual band quantification window will open
containing the sample:
●
If you chose Gridded and left the Number of columns and Number of Rows set to
0, the spot frames will be placed automatically on the image and the Results
calculated from them will be shown in the Results pane.
●
If you chose Gridded and entered figures for the Number of columns and Number
of Rows, the specified grid will appear on the image, but you will need to position
the rows and columns accurately by hand.
●
If you left Gridded unchecked, the individual spots will be located on the image
and spot frames placed on them.
For a Manual band quantification sample, a Spot blot/Manual band quantification
window will open containing the sample. There will be no boxes on the image and you
will have to place them by hand.
For a High Throughput Gel sample, a Gel window will open containing the sample.
There will be a grid of frames in each area of interest. These frames will be unlocked so
that you can position them over the tracks on the image.
Note
Choose Save as from the File menu to save the new sample as an analyzed secure
sample file.
GeneTools User Manual
8-7
Menus
Open
You can open the following types of secure sample files:
●
analyzed files that have been previously saved in GeneTools – for a Gel, for
example, these will contain information about: track positions; peaks; assigned
standards; molecular weight, quantity and peak matching results; and so on.
●
unanalyzed .sgd files that have been saved in the acquisition program, but have not
yet been loaded into and saved in GeneTools.
To open a secure sample file:
1 Choose Open from the File menu to display a standard Windows Open
dialog box:
2 Use the dialog box to select the required secure sample file.
3 Press Open.
What happens next depends on whether you are opening an analyzed or unanalyzed
secure sample, and in the latter case on whether you have set Auto import methods:
●
If you are opening an analyzed secure sample file:
●
8-8
Depending on the type of sample, the sample will be opened with settings as
they were when the file was last saved, including: for a Gel or High Throughput
Gel sample, all track and peak settings and previously analyzed results; for a
GeneTools User Manual
File (Sample and Profile comparison windows)
Colony counting sample, the frame and other settings; for a Spot blot/Manual
band quantification window, all spot frames or boxes and results.
●
If you are opening an unanalyzed secure sample file and you have set Auto import
methods and you have selected a secure sample file as the source for the settings to
import:
●
●
The Import method dialog box will open so that you can choose which settings
to import. For further details, see, for example, Opening or creating a secure
sample file with automatic import, page 1-16.
If you are opening an unanalyzed secure sample file and you have not set Auto
import methods:
●
The Sample properties dialog box will open so that you can set the type of
image and make other settings – see Steps 6–10 in the entry for New (Import) in
the File menu (on pages 8-3–8-7) for details.
Browse
To open the Browser, or if it is already open, to select and maximize it:
Choose Browse from the File menu:
GeneTools User Manual
8-9
Menus
Note
The picture shows the Browser in a non-maximized window; it is maximized after
selecting Browse.
The Browser allows you to locate, preview and open image files.
You use the Browser’s left-hand pane in exactly the same way as you use the left-hand
pane in Windows Explorer to select the folder containing the required images.
To open an image from the Browser:
Double-click on the image.
What happens next depends on whether you are opening an analyzed or unanalyzed
secure sample, and in the latter case on whether you have set Auto import methods:
●
If you are opening an analyzed secure sample file:
●
●
If you are opening an unanalyzed secure sample file and you have set Auto import
methods and you have selected a secure sample file as the source for the settings to
import:
●
●
The Import method dialog box will open so that you can choose which settings
to import. For further details, see, for example, Opening or creating a secure
sample file with automatic import, page 1-16.
If you are opening an unanalyzed secure sample file and you have not set Auto
import methods:
●
8-10
Depending on the type of sample, the sample will be opened with settings as
they were when the file was last saved, including: for a Gel or High Throughput
Gel sample, all track and peak settings and previously analyzed results; for a
Colony counting sample, the frame and other settings; for a Spot blot/Manual
band quantification window, all spot frames or boxes and results.
The Sample properties dialog box will open so that you can set the type of
image and make other settings – see Steps 6–10 in the entry for New (Import) in
the File menu (on pages 8-3–8-7) for details.
GeneTools User Manual
File (Sample and Profile comparison windows)
Close
To close a secure sample file, the Profile comparison window or a molecular weight
library:
Choose Close from the File menu.
If the sample or molecular weight library has any unsaved changes, you will be asked if
you want to save the file. If you have used New window in the Window menu to open
more than one window for a molecular weight library, all of the windows will be closed.
Save
Note
This command is disabled when the Profile comparison window is selected.
To save a secure sample file or molecular weight library:
1 Select the Sample window showing the sample or the Molecular weight
library window containing the molecular weight library.
2 Choose Save from the File menu.
If the file has been saved before, it will be saved with the same name, otherwise a
standard Windows Save as dialog box will be displayed so that you can give the file a
name and select a folder to save it in – see Steps 3–5 in the entry for Save as for
details.
Save as
Note
This command is disabled when the Profile comparison window is selected.
To save a secure sample file or molecular weight library with a new name:
1 Select the Gel, Colony counting or Spot blot/Manual band quantification
window showing the sample or the Molecular weight library window
containing the molecular weight library.
GeneTools User Manual
8-11
Menus
2 Choose Save as from the File menu to display a standard Windows Save as
dialog box:
Note
The Save as type box will show MW Standard Libraries (*.mwl) if you selected a
Molecular weight library window.
3 Use the dialog box to select a folder in which to save the file.
4 Enter a File name for the file.
5 Press Save to save the file.
Select Source (Twain)
To select a Twain source so that you can acquire (see next section) an image from it:
1 Choose Select Source (Twain) from the File menu to display the Select
Source dialog box:
8-12
GeneTools User Manual
File (Sample and Profile comparison windows)
2 Click on the required source to select it.
3 Press Select to confirm the selection and close the dialog box.
Acquire (Twain)
To acquire an image from the selected Twain source (see previous section) and create a
secure sample file:
1 Choose Acquire (Twain) from the File menu.
A dialog box will be displayed for the selected source so that you can select
acquisition options and acquire the image.
2 Use the dialog box to acquire the image.
What happens next depends on whether you have set Auto import methods:
If you have set Auto import methods:
●
The Import method dialog box will open so that you can choose which settings to
import. For further details, see, for example, Opening or creating a secure sample file
with automatic import, page 1-16.
If you have not set Auto import methods:
●
The Sample properties dialog box will open so that you can set the type of image
and make other settings – see Steps 6–10 in the entry for New (Import) in the File
menu (on pages 8-3–8-7) for details.
New library
The New Library command only appears on the File menu for Gel and High
Throughput Gel sample windows.
To create a new molecular weight library:
Choose New library from the File menu.
If the Molecular weight library window is open and you have any unsaved changes, you
will be asked if you want to save them before the library is closed. The Molecular
weight library window will then be reopened with a new empty library for you to create
new molecular weight/quantity standards – see the entry for New standard in the Edit
menu, page 8-57.
GeneTools User Manual
8-13
Menus
You can enter some text to document the molecular weight library using Properties in
the File menu.
Once you have created the new standards, you can save the new molecular weight
library using Save as in the File menu.
Note
You can create as many different molecular weight libraries as you wish, but you can
only have one open at a time.
Open library
The Open Library command only appears on the File menu for Gel and High
Throughput Gel sample windows.
To open a molecular weight library for editing:
1 Choose Open library from the File menu to display a standard Windows
Open dialog box:
2 Use the dialog box to select the required molecular weight library file.
3 Press Open.
If the Molecular weight library window is already open showing another library, that
library will be closed – if it contains any unsaved changes, you will be asked if you want
to save them before the library is closed.
The selected library will be opened in the Molecular weight library window.
8-14
GeneTools User Manual
File (Sample and Profile comparison windows)
Import method
The Import method command does not appear on the File menu for Colony sample
windows or the Profile comparison window.
To apply:
●
molecular weight standards (for Gel and High Throughput Gel samples),
●
Sample and track settings (for Gel and High Throughput Gel samples),
●
Spot blot sample settings (for Spot blot samples),
●
Manual band quantification sample settings (for Manual band quantification
samples),
and/or
●
report settings (for all sample types samples)
from a saved secure sample file to the sample in the selected window:
1 Choose Import method from the File menu to display the Import method
dialog box:
2 Press Browse to display a standard Windows Open dialog box so that you
can select a file from which to import settings.
GeneTools User Manual
8-15
Menus
3 Check the boxes for the settings that you want to import.
4 Press Import to import the settings.
Note
This dialog box (with an additional page showing the image) is also displayed if you
create a new sample from an image with automatic import set (see Configuration in the
Extras menu, page 8-139, for how to set automatic import). You can also set the import
methods in the Import page of the Configuration dialog box. The program displays the
same import methods in all these places: changing the settings in any one of them
changes the settings in all of them.
Export table to Excel
The Export table to Excel command does not appear on the File menu for Colony
counting sample windows or the Profile comparison window.
Note
This command is disabled when the Profile comparison window is selected.
To export results to Excel:
1 For a Gel window, select the results table that you want to export by clicking
on its tab in the Results pane (see The Results pane, page 6-14, for
information about the tables that can be displayed in the Results pane).
For a Spot blot/Manual band quantification window, select the Results or
Incidence table that you want to export by clicking on its tab in the
Results/Incidence/Calibration graph pane (see The Results page, page 6-31, or
The Incidence page, page 6-32).
2 If you want to change the columns shown in the table, right-click on the table
to display the Results context menu and choose the required parameter to
add to or remove from the table.
3 Repeat Step 2 until the required columns are displayed.
4 Choose Export table to Excel.
Unless you have already exported a table to Excel in the current session, Excel will be
opened and a new workbook created.
8-16
GeneTools User Manual
File (Sample and Profile comparison windows)
The first sheet in the workbook will be named Image document data and will contain
the secure sample’s file name, and data taken from the Information page of the
Sample properties dialog box.
The second sheet in the workbook will contain the exported table and will be named
appropriately.
If you have already exported a table to Excel in the current session:
●
If the results table selected in the Results pane already exists in the workbook, the
results will be updated.
●
Otherwise, a new sheet will be added for the new table and named accordingly.
Note 1
GeneTools identifies sheets in the workbook by their names. If you rename a sheet and
export the table again, a new sheet will be added for the table and the original sheet
will not be updated.
Note 2
After you have exported a table to Excel in a session, GeneTools maintains a link to the
workbook it created but does not use the name of the workbook to identify it. This
means that you can save the workbook with another name if you wish. However, it also
means that once you have exported a table to Excel, you should leave the workbook
open in Excel until after you have closed GeneTools.
Save table to CSV file
The Save table to CSV file command does not appear on the File menu for Colony
counting sample windows or the Profile comparison window.
To save results to a comma separated values text file:
1 For a Gel window, select the results table that you want to export by clicking
on its tab in the Results pane (see The Results pane, page 6-14, for
information about the tables that can be displayed in the Results pane).
For a Spot blot/Manual band quantification window, select the Results or
Incidence table that you want to export by clicking on its tab in the
Results/Incidence/Calibration graph pane (see The Results page, page 6-31, or
The Incidence page, page 6-32).
GeneTools User Manual
8-17
Menus
2 If you want to change the columns shown in the table, right-click on the table
to display the Results context menu and choose the required parameter to
add to or remove from the table.
3 Repeat Step 2 until the required columns are displayed.
4 Choose Save table to CSV file to display the Save as CSV File dialog box:
This is a standard Windows Save As dialog box.
5 Use the dialog box to select a folder in which to save the CSV file.
6 Enter a File name for the CSV file.
7 Press Save to save the results in the file.
Export to Word
To create a Word document containing a report showing analysis results:
Choose Export to Word from the File menu.
A new Word document will be created and the report created within it.
See the entry for Report setup in the File menu, page 8-20, for how to choose what to
include in the report.
8-18
GeneTools User Manual
File (Sample and Profile comparison windows)
Save to clipboard
To copy a picture of the image in the Image pane in the current Sample window or the
profiles in the Profiles pane in the Profile comparison window to the clipboard:
Choose Save to clipboard from the File menu.
Printer setup
To choose a new printer or change the settings for the existing one:
1 Choose Printer setup from the File menu to display the Print Setup dialog
box:
2 To select a different printer, choose it from the Name drop-down list box. The
fields below the Name box show properties of the selected printer.
3 Press Properties to display a dialog box allowing you to choose options for
the selected printer.
The options available depend on the printer – see your printer documentation
for details.
4 Choose the paper Size and Source to use from the drop-down list boxes.
The options available depend on the printer – see your printer documentation
for details.
GeneTools User Manual
8-19
Menus
5 Click on the Landscape or Portrait radio button to choose the paper
orientation – the graphic in the Orientation box illustrates the selected
orientation.
6 Press OK to save the settings and close the dialog box.
Report setup
Note
This command is disabled when the Profile comparison window is selected.
You can choose what information to include in reports.
Note
If the paper selected for the currently selected printer is less than 150 mm in either
dimension (for example if you are using a video printer), a simplified report containing
the image and some brief identification and image information will be printed. The
settings in the Report setup dialog box have no effect on the content of this simplified
report.
To choose what data to include in a Gel or High Throughput Gel sample report:
1 With the Gel window selected, choose Report setup from the File menu to
display the Report setup dialog box:
8-20
GeneTools User Manual
File (Sample and Profile comparison windows)
2 In the File details box, check:
●
Image to include a picture of the image in the report. The track positions
and peak markers will be shown on the image, whether or not they are
chosen for display in the Image pane. The match lines and Rf start and
finish lines will not be shown.
●
Capture settings to include in the report the settings used in the camera
when the image was captured.
●
Acquisition notes to include in the report any notes added by the user in
the acquisition program in the camera when the image was captured – see
the entry for Sample properties in the File menu, page 8-28, for how to
view Acquisition notes.
●
Analysis notes to include in the report any notes added by the user in
GeneTools – see the entry for Sample properties in the File menu,
page 8-28, for how to view and edit Analysis notes.
●
Document history to include in the report a record of who has made
changes to the sample file and when.
●
Integration settings to include in the report the integration parameters
used for profile generation and automatic peak location – see the entry for
Integration parameters in the File menu, page 8-45, for details.
3 In the Molecular weight calibrations box, check:
●
●
MW standards to include in the report details of:
●
the molecular weight calibration details – see the entry for Molecular
weight calibration in the Edit menu, page 8-50, for details.
●
the assignment of molecular weights/quantities to peaks in the
molecular weight standard tracks – see the entry for MW/quantity
standard in the Track menu, page 8-94, and Assign molecular weight
in the Peak menu, page 8-104, for details.
MW calibration graphs to include in the report the molecular weight
calibration graphs for the molecular weight standard tracks. The molecular
weight calibration graph for a track is shown in the MW calibration page
of the Graphics pane when the track is selected – see page 6-7 for details.
GeneTools User Manual
8-21
Menus
4 In the Results per track box, check:
●
Raw profiles to include in the report the uncorrected profile for each of
the enabled tracks. The raw profile shows the base line used to create the
corrected profile as a red line – see the entry for Integration parameters
in the File menu, page 8-45, for information about setting baseline
correction.
●
Corrected profiles to include in the report the corrected profile for each
of the enabled tracks. The corrected profile shows the peak positions (by
the peak number) and boundaries. You can also view the corrected profile
for the selected track in the Profile pane in the Gel window.
●
Peak results table to include in the report a separate table of results for
each of the enabled tracks. You can view the individual table of results for
the selected track on the Results for selected track tab in the Results
pane in the Gel window – see The Results pane, page 6-14, for details.
5 In the Results for all tracks box, check:
●
Peak results table to include in the report a table of results for all of the
enabled tracks. You can view the combined table of results for all the
tracks on the Results for all tracks tab in the Results pane in the Gel
window – see The Results pane, page 6-14, for details.
6 In the Quantity calibrations box, check:
8-22
●
Quantity standards to include in the report details of the quantity
calibration method – see the entry for Quantity calibration in the Edit
menu, page 8-52, for details.
●
Quantity calibration graphs to include quantity calibration graphs in the
report. If you have chosen to calibrate All graphs to a single curve, only
the single calibration curve will be shown. Otherwise calibration curves
will be shown for all enabled tracks with a defined quantity calibration.
The quantity calibration graph for a track is shown on the Quantity
calibration page of the Graphics pane when the track is selected – see
page 6-9 for details.
GeneTools User Manual
File (Sample and Profile comparison windows)
7 Click on the Matching tab to choose what peak matching data to include in
the report. The Matching page will be displayed:
Check:
●
Matching comparison table to include a table showing the results for
those peaks in track order that match the peaks on the active matching
standard. The table will exclude results for disabled tracks. You can view
the Matching comparison table on the Matching comparisons page in the
Results pane in the Gel window – see The Results pane, page 6-14, for
details.
●
Matching matrix (presence/absence table) to include a table showing the
presence or absence of peaks matching the peaks on the active matching
standard. The table will exclude results for disabled tracks. You can view
the Matching presence/absence table on the Matching matrix page in the
Results pane in the Gel window – see The Results pane, page 6-14, for
details.
●
Matching coefficients table to include a table showing how well pairs of
tracks are matched. You can view the Matching coefficients table on the
Similarity matrix page in the Results pane in the Gel window – see The
Results pane, page 6-14, for details.
●
Check Dendrogram to include the dendrogram giving a hierarchical
representation of the matching between tracks. The dendrogram is shown
GeneTools User Manual
8-23
Menus
in the Dendrogram page of the Graphics pane – see The dendrogram,
page 6-10, for details.
To choose what data to include in a Spot blot or Manual band quantification sample
report:
1 With the Spot blot/Manual band quantification window selected, choose
Report setup from the File menu to display the Report setup dialog box:
2 In the File details box, check:
8-24
●
Image to include a picture of the image in the report. The spot frames will
be shown on the image.
●
Capture settings to include in the report the settings used in the camera
when the image was captured.
●
Acquisition notes to include in the report any notes added by the user in
the acquisition program in the camera when the image was captured – see
the entry for Sample properties in the File menu, page 8-28, for how to
view Acquisition notes.
●
Analysis notes to include in the report any notes added by the user in
GeneTools – see the entry for Sample properties in the File menu,
page 8-28, for how to view and edit Analysis notes.
●
Document history to include in the report a record of who has made
changes to the sample file and when.
GeneTools User Manual
File (Sample and Profile comparison windows)
3 In the Results box, check:
●
Results table to include the Spot blot results table in the report. The table
will include the columns selected for display on the Spot blot results page
in the Spot blot/Manual band quantification window.
●
Incidence table to include the incidence matrix in the report.
4 In the Quantity calibrations box, check:
●
Quantity standards to include in the report details of the quantity
calibration method – see the entry for Quantity calibration in the Edit
menu, page 8-52, for details.
●
Quantity calibration graphs to include the quantity calibration graph in
the report. The quantity calibration graph is shown on the Quantity
calibration page in the Spot blot/Manual band quantification window.
To choose what data to include in a Colony counting report:
1 With the Colony counting window selected, choose Report setup from the
File menu to display the Report setup dialog box:
2 In the File details box, check:
●
Image to include a picture of the image in the report. The frame, detected
colonies, colony shapes (if displayed) and any exclude regions will be
shown on the image.
●
Capture settings to include in the report the settings used in the camera
when the image was captured.
GeneTools User Manual
8-25
Menus
●
Acquisition notes to include in the report any notes added by the user in
the acquisition program in the camera when the image was captured – see
the entry for Sample properties in the File menu, page 8-28, for how to
view Acquisition notes.
●
Analysis notes to include in the report any notes added by the user in
GeneTools – see the entry for Sample properties in the File menu,
page 8-28, for how to view and edit Analysis notes.
●
Document history to include in the report a record of who has made
changes to the sample file and when.
3 In the Results box, check:
●
Measurement settings to include the sensitivity and whether colony
separation was used.
●
Results table to include the colony counting results table in the report.
The table will show the colony count and percentage area for each class of
colony.
Print preview
To preview a sample results or Profile comparison report before it is printed:
Choose Print preview from the File menu to display the Sample or Profile
comparison window in print preview mode.
A row of buttons at the top of the window allows you to control the way the window
displays the preview:
8-26
●
Press Print to print the report shown in the preview and return the Sample or
Profile comparison window to its normal mode.
●
Press Next Page if the printout covers more than one page and you want to see the
next page. The button will be grayed if you are viewing the final page.
●
Press Prev Page if the printout covers more than one page and you want to go back
to an earlier page. The button will be grayed if you are viewing the first page.
GeneTools User Manual
File (Sample and Profile comparison windows)
●
Press Two Page if the printout covers more than one page and you want to view two
pages side-by-side at the same time. The button changes to One Page when you are
in two page mode so that you can change back to viewing one page at a time.
●
Press Zoom In for a magnified view of the previewed page. When you move the
pointer over the page in the preview window, it changes to a magnifier and clicking
on the page has the same effect as pressing Zoom In, unless the page is already at
maximum magnification, when it displays the page at minimum magnification.
●
Press Zoom Out to return to a less magnified view of the previewed page.
●
Press Close to return the Sample or Profile comparison window to its normal mode
without doing any printing.
Print
To print a report showing results from a Sample window or the contents of the Profile
comparison window:
1 Select the Sample window or Profile comparison window, as required.
2 Choose Print from the File menu to display the Print dialog box so that you
can select print options. This is a standard Windows dialog box.
3 After selecting any required options, press OK to close the dialog box and
print the report.
See the entry for Report setup in the File menu, page 8-20, for how to choose what to
print in the report.
Note
If the paper selected for the currently selected printer is less than 150 mm in either
dimension (for example if you are using a video printer), a simplified report containing
the image and some brief identification and image information will be printed. The
settings in the Report setup dialog box have no effect on the content of this simplified
report.
GeneTools User Manual
8-27
Menus
Recently opened files
The File menu lists the names of the most recently used files.
To reopen one of these files (secure sample file or molecular weight library file):
Choose the file’s name from the File menu.
See the entry for Configuration in the Extras menu, page 8-139, for how to choose
how many files to list.
Sample properties
Note
This command does not appear on the menu when the Profile comparison window is
selected.
To view or edit the settings and notes for a sample:
1 Click in the window containing the sample to select it.
8-28
GeneTools User Manual
File (Sample and Profile comparison windows)
2 Choose Sample properties from the File menu to display the General page
of the Sample properties dialog box:
The controls shown on the General page depend on the type of sample (in
the picture shown above, the sample is an ethidium bromide DNA gel).
3 If required, select a different Analysis type from the drop-down list box – you
may need to do this when the dialog box is displayed when you create a new
secure sample file, but it is unlikely that you would need to do this at any
other time.
The controls displayed depend on the selected Analysis type – the following
subsections of Step 3 describe how to work with each of the different analysis
types.
GeneTools User Manual
8-29
Menus
Gel analysis (see picture in Step 2):
a Click on the Fluorescence radio button for a fluorescence image (bright
bands on a dark background); click on the Absorption radio button for an
absorption image (dark bands on a bright background). GeneTools detects
the Image type automatically, so you shouldn’t need to change this setting.
b Click on one of the direction radio buttons to set the Electrophoresis
direction.
c If you just want to work with a single area of interest on the image, leave
the numbers of Columns and Rows set to 1.
If you want to define a grid of several areas of interest on the image, enter
the numbers of Columns and Rows in the grid.
d For each of the areas of interest, click in it on the image to select it (drag
handles appear at the corners and on the sides of the rectangle defining
the area when it is selected):
i
To move the area of interest, drag it on the preview avoiding the drag
handles.
ii To define the size and shape of the area of interest, drag the handles.
iii Do one of:
●
Note
In nearly all cases the GeneTools automatic track location will be able to locate the
tracks on the gel correctly and position track markers over them accurately without
further assistance, and this is the recommended way of working with GeneTools.
However, very occasionally you may have a gel that causes problems, so if automatic
track location fails to identify the tracks correctly, you can give it some help by checking
Hint and entering the approximate number of tracks in the area of interest.
●
8-30
To choose automatic track detection for the area, press Locate
tracks automatically.
To choose manually how many tracks you want to place in the area
of interest, press the Create radio button to enable the tracks for
manual positioning spin box and enter the number of tracks you
want to place in that area of interest. The tracks will be placed at
default positions and you will need to position them manually later.
GeneTools User Manual
File (Sample and Profile comparison windows)
●
Note
Leave the Leave the tracks unchanged radio button selected if you
do not want to change the tracks on the gel either manually or
automatically.
Changing other options in the Sample properties dialog box can cause the Leave the
tracks unchanged radio button to be deselected and disabled. If this happens, and you
really do want to leave the tracks unchanged, press Cancel to close the dialog box
without making any changes.
e Go to Step 4 (page 8-37).
Colony (pour plate) analysis
a Click on the Light colonies radio button for an image showing light
colonies on a dark background; click on the Dark colonies radio button
for an image showing dark colonies on a light background; click on Light
GeneTools User Manual
8-31
Menus
and dark colonies for an image showing colonies lighter and darker than
the background.
The Image type is detected automatically, but you can change it if you
want to – in particular, you will need to set Light and dark colonies
manually if required.
b Go to Step 4 (page 8-37).
Spot blot analysis
a Choose the shape of spot frame (Circle or Rectangle) that you want to use
from the Spot type drop-down list box.
b Click on the Fluorescence radio button for a fluorescence image (bright
spots on a dark background); click on the Absorption radio button for an
8-32
GeneTools User Manual
File (Sample and Profile comparison windows)
absorption image (dark spots on a bright background). GeneTools detects
the Image type automatically, so you shouldn’t need to change this setting.
c Do one of:
●
●
Press Locate spots automatically if you want GeneTools to detect the
positions of the spots automatically:
●
Check Gridded if you want GeneTools to place a rectangular grid of
spot frames over the spots it detects.
●
Uncheck Gridded if you want GeneTools to place spot frames only
where it actually found spots.
Press Create spots for manual positioning to place a rectangular grid
of spot frames in a default position on the image:
●
●
Enter the number of Columns and Rows you want to appear in the
grid.
Press Leave the spots unchanged if you do not want to change the
arrangement of spot frames on the image.
d Go to Step 4 (page 8-37).
GeneTools User Manual
8-33
Menus
Manual Band Quantification analysis
a Click on the Fluorescence radio button for a fluorescence image (bright
spots on a dark background); click on the Absorption radio button for an
absorption image (dark spots on a bright background). GeneTools detects
the Image type automatically, so you shouldn’t need to change this setting.
b Go to Step 4.
8-34
GeneTools User Manual
File (Sample and Profile comparison windows)
High Throughput Gel
The controls on the General page are different if the Analysis type is High
Throughput Gel:
a Select the type of High Throughput Gel analysis you are using from the
Gel type drop-down list box. You can choose:
●
Madge 71.6 degree rotation
●
Madge 78.7 degree rotation
●
E-Gel 96
GeneTools User Manual
8-35
Menus
b The Image type is detected automatically, but you can change it if you
want to:
Click on the Fluorescence radio button for a fluorescence image (bright
bands on a dark background); click on the Absorption radio button for an
absorption image (dark bands on a bright background)
c Click on a radio button to specify the Electrophoresis direction.
d If you are opening a 96-well sample, leave the Number of columns and
Number of rows set to 1.
If you are working with a 192-well sample, set the Number of columns to
2 and the Number of rows to 1 if the two sets of tracks are side-by-side;
set the Number of rows to 2 and the Number of columns to 1 if the two
sets of tracks are one above the other.
Note
Areas of interest can overlap with each other.
e For each of the areas of interest (shown by a red box on the image), click
in it on the image to select it (drag handles appear at the corners and on
the sides of the rectangle defining the area when it is selected):
i
To move the area of interest, drag it on the preview avoiding the drag
handles.
ii To define the size and shape of the area of interest, drag the handles.
Note
Each area of interest determines the initial position of a grid of 96 track frames, which
should be positioned over the corresponding tracks in the gel. However, you will be
able to adjust the postion of the track frame grids and individual track frames later in
the Gel window, so it is not essential to adjust the areas of interest with great accuracy.
f
8-36
Go to Step 4.
GeneTools User Manual
File (Sample and Profile comparison windows)
4 Click on the Information tab to view data saved with the image when the
secure sample file was created (either by the acquisition program or by using
the New (Import) command):
You cannot edit any of the information.
GeneTools User Manual
8-37
Menus
5 Click on the Acquisition notes tab to display notes saved with the image file
in the image acquisition program:
You cannot edit the notes.
8-38
GeneTools User Manual
File (Sample and Profile comparison windows)
6 Click on the Analysis notes tab to view or edit notes saved with the secure
sample file in GeneTools:
7 Press OK to close the dialog box and save any of the changes you have made
to the settings.
For a Gel, if you have set automatic track location (the recommended way of working
with GeneTools), the tracks will be locked; otherwise they will be unlocked ready for
you to position them accurately on the image (see How to place, position and work
with tracks – Overview, page 1-22, for details).
GeneTools User Manual
8-39
Menus
Exit
To exit the program:
Choose Exit from the File menu.
You will be asked if you want to save any open files that have unsaved changes.
File (Molecular weight library window)
Many of the commands appearing on the File menu when a Molecular weight library
window is selected also appear on the menu when a Gel window is selected – see the
relevant entries in the File (Sample window) section, page 8-1, for details of these
commands. This section describes the commands that only appear on the File menu
when a Molecular weight library window is selected.
8-40
GeneTools User Manual
File (Molecular weight library window)
Unlock
To unlock a molecular weight library (see the next command for locking libraries):
1 If the library is already open, click in the Molecular weight library window or
choose it from the Window menu to select it. Otherwise, choose Open
library from the File menu to open the library.
2 Choose Unlock from the File menu to display the Enter password dialog
box:
3 Enter the Password and press OK (just press OK if no password is set).
You will be told if the password is incorrect – see the entry for Change
password in the File menu, page 8-42, for how to set a password.
When the library is unlocked, Unlock will become disabled in the menu and Lock will
become enabled.
Lock
To lock a molecular weight library:
1 If the library is already open, click in the Molecular weight library window or
choose it from the Window menu to select it. Otherwise, choose Open
library from the File menu to open the library.
2 Choose Lock from the File menu.
(The command will become disabled in the menu and Unlock will become
enabled.)
3 Choose Save from the File menu to save the locked status of the file.
GeneTools User Manual
8-41
Menus
While the library is locked, the commands for editing it in the Edit menu and the
pop-up menu displayed when you right-click in the Molecular weight library window
are disabled.
You can protect the library further by setting a password, which you will have to enter
in order to unlock the library – see the next command for details.
Change password
To set or change the password for a molecular weight library (see the entry for Unlock
in the File menu, page 8-41, for when you will need to enter the password):
1 If the library is already open, click in the Molecular weight library window to
select it.
Otherwise, choose Open library from the File menu to open the library.
2 Choose Change password from the File menu to display the Change
password dialog box:
3 Enter the Old password – the characters will be shown as * for security.
4 Enter the New password – the characters will be shown as * for security.
5 Enter the new password again in the Confirm new box to check that you
typed it correctly.
6 Press OK to set the new password and close the dialog box.
8-42
GeneTools User Manual
File (Molecular weight library window)
Properties
To set or view properties associated with a molecular weight library:
1 If the library is already open, click in the Molecular weight library window to
select it or choose it from the list at the bottom of the Window menu.
Otherwise, choose Open library from the File menu to open the library.
2 Choose Properties from the File menu to display the Library properties
dialog box:
The Date created and Date modified boxes are read-only and show the
dates on which the library was created and last modified.
The Author and Name boxes can be edited provided the molecular weight
library is unlocked.
3 Enter text in the Author and Name boxes to document the molecular weight
library.
4 Press OK to close the dialog box.
5 Choose Save from the File menu to save the properties.
GeneTools User Manual
8-43
Menus
Edit (Gel window)
This section describes all of the commands appearing on the Edit menu when a Gel
window is selected; the following sections describe the Edit menu when other types of
window are selected (see the Windows chapter, chapter 6, for information about the
different types of window).
Undo, Cut, Copy and Paste are disabled for all types of window.
8-44
GeneTools User Manual
Edit (Gel window)
Integration parameters
Note
If you have defined more than one area of interest on the sample, the same integration
parameters will be used for all areas.
To set the parameters used for profile generation and automatic peak location:
1 Choose Integration parameters from the Edit menu to display the
Integration parameters dialog box:
2 Choose how to draw the baseline from which the signal is measured to give
the profile. The signal is the sum of the (spatially filtered) pixel values across
the width of the track. You can use:
●
None – no baseline correction
●
Track borders
●
Lowest slope
GeneTools User Manual
8-45
Menus
●
Track borders & slope – a combination of the last two: the signal is
corrected for the track borders and then the lowest slope correction is
used
●
Rolling disk.
(See the Baseline correction subsections after these instructions for details, and
the entry for Edit manual baseline in the Track menu, page 8-90, for how to
set a manual baseline.)
3 If you have chosen to use Rolling disk background correction, enter or edit
the radius of the disk to be used. Some experimentation may be required to
find the best size of disk to use for each image – press Apply to see the effect
of the correction without closing the dialog box.
4 Choose whether to use a baseline offset or not. See Baseline correction after
these instructions for details.
5 Specify the Minimum peak width (in image pixels) for a peak to be detected.
6 Specify the Minimum peak height (in image pixels) for a peak to be
detected.
7 Specify the Minimum peak volume (as a percentage of the total quantity) on
the track for a peak to be detected.
8 Check All peaks same width to make the detected peaks all have the same
width, and enter the required width in the associated edit box.
9 Specify the width of the Savitsky-Golay filter used in integrating the image –
the greater the width, the greater the smoothing effect of the filter. See
Savitsky-Golay filter, page 8-50, for examples.
8-46
GeneTools User Manual
Edit (Gel window)
10 Click on the Detection filter tab to display the Detection filter page so that
you can choose a filter for filtering color images:
11 Choose the required Filter color from the drop-down list box.
12 Press Apply to see the effects of any changes you have made without closing
the dialog box; press OK to save the new settings and close the dialog box.
Baseline correction – track borders
For track borders baseline correction, the signal is calculated relative to the signal at the
borders.
GeneTools User Manual
8-47
Menus
Baseline correction – lowest slope
To understand how this method works, consider the following example, which goes
through the process as if you had to do it by hand – naturally all this is done
automatically by the program and all you would see is the profile in the first picture
change into the profile in the last picture:
To find the first segment of the baseline, the program starts at one end of the profile
and draws imaginary lines from the start point to all other points on the profile. The
following example just shows three of these lines:
The program then chooses the line of lowest slope. This is the shortest line in this
example as the other lines have larger (less negative) slopes (lines to all other points on
the profile have even larger slopes).
To find the second segment of the baseline, the program moves to the end of the first
segment and again draws imaginary lines from there to the remaining points on the
profile. Again the following example only draws three of these lines:
8-48
GeneTools User Manual
Edit (Gel window)
The program again chooses the line of lowest slope (the shortest line again in this
example) and repeats this process until it gets to the other end of the profile:
The corrected signal is then measured as the height above this baseline:
Baseline correction – rolling disk
For this method the program first calculates the position of the line formed by the
center of a disk with the set radius rolled along below the profile. The baseline is then
one radius length above this line, and the corrected signal is measured as the height
above this baseline.
Baseline correction – offset
Choose whether to use a baseline offset or not. The baseline offset moves the baseline
up to the lowest point in the profile.
For example:
with baseline offset becomes
GeneTools User Manual
8-49
Menus
Savitsky-Golay filter
The pictures below are examples of the effects of different degrees of spatial filtering.
No filter
Filter width = 11
Filter width = 17
Molecular weight calibration
Note
If you have defined more than one area of interest on the sample, you can choose
different molecular weight calibration settings for each area.
To specify how molecular weights are calculated from standard tracks:
1 If there is more than one area of interest on the sample, click in the area on
the sample for which you want to set the molecular weight calibration
settings.
8-50
GeneTools User Manual
Edit (Gel window)
2 Choose Molecular weight calibration from the Edit menu to display the
Molecular weight calibration dialog box:
(You can also display this dialog box by pressing Edit calibration in the Assign
molecular weight/quantity dialog box.)
3 Click on a radio button to choose the type of calibration curve to use for
calculating molecular weights for points between peaks on the standard tracks.
●
Log-linear fit means the best logarithmic curve fit for all points – the curve
may not pass through all the calibration points.
●
Log piecewise linear means a logarithmic curve is drawn between
adjacent points – the curve will pass through all the calibration points but
may not be smooth at those points.
The selected curve will be shown in the MW Calibration tab in the Gel
window’s Graphics pane – see page 6-8 for details.
4 Click on a radio button to choose whether distance along the track should be
measured From start of Track or From Rf baseline.
5 Choose how to calculate molecular weights if there is more than one standard
track.
You can choose:
●
Use nearest standard to use the nearest standard track
●
Combine all standards to calculate a molecular weight from all the
standards and then take the average
GeneTools User Manual
8-51
Menus
●
Interpolate between standards to interpolate results from the two
adjacent tracks.
6 Press OK to save the new settings and close the dialog box.
7 Repeat Steps 1–6 for the other areas of interest.
Quantity calibration
Note
If you have defined more than one area of interest on the sample, you can choose
different quantity calibration settings for each area, or choose to use the quantity
calibration in another area of interest.
To set or view the calibration method and units for quantity determinations:
1 If there is more than one area of interest on the sample, click in the area on
the sample for which you want to set the quantity calibration settings.
2 Choose Quantity calibration from the Edit menu to display the Quantity
calibration dialog box:
(You can also display this dialog box by pressing Edit quantity calibration in
the Assign molecular weight/quantity dialog box.)
3 For a sample with more than one area of interest, you can choose to use the
quantity calibration defined in another area of interest. If you wish to do so:
a Check Use another track set as standard.
b Select the required Track set from the drop-down list box.
8-52
GeneTools User Manual
Edit (Gel window)
c Go to Step 7.
Otherwise, go to Step 4.
4 Click on a radio button to decide whether:
●
the same calibration curve should be used for All tracks
●
Each track should have its own calibration curve.
5 Choose the shape of calibration curve(s) from the drop-down list box from
●
Linear through origin (single standard value)
●
Linear (multiple standard values)
●
Linear through origin (multiple standard values)
●
Quadratic
●
Quadratic through origin.
6 Enter your own quantity units in the Units box.
7 Press OK to save the new settings and close the dialog box.
8 Repeat Steps 1–7 for the other areas of interest.
Note
If you select Linear through origin (single standard value) the calibration curve is
drawn through the origin and the last calibration point you have added – in other
words, adding a new calibration point replaces the previous one. For the other types of
curve, the calibration curve is drawn as the best fit for all the (relevant) calibration
points – adding a new calibration point contributes to (and does not replace) the
calibration from any previous points.
Band matching
Note
If you have defined more than one area of interest on the sample, you can choose
different matching settings for each area.
To set or view the tolerance and method used for matching:
1 If there is more than one area of interest on the sample, click in the area on
the sample for which you want to set the peak matching settings.
GeneTools User Manual
8-53
Menus
2 Choose Band matching from the Edit menu to display the Matching
parameters dialog box:
Note
This dialog box is also displayed when you choose Parameters from the Matching
menu when the Profile comparison window is selected – the settings you make here for
the selected area of interest are independent of any settings you may make for the
Profile comparison window or for any other areas of interest.
3 In the Matching box:
a In the Type box, select Band or Profile to decide whether to match tracks
using the detected bands (peaks) or the intensity profiles.
Note
8-54
When Profile is selected:
●
There is no need to detect the peaks on the tracks (unless you choose to match on
the basis of molecular weights – see Step c).
●
There is no need to define a matching standard.
●
The Similarity Coefficient controls in the Matching parameters dialog box are
disabled.
●
The Matching comparisons and Matching matrix pages in the Results pane are
blank.
GeneTools User Manual
Edit (Gel window)
b If you selected Band in the Type box, select Dice or Jaccard from the
Similarity Coefficient box to choose how the similarity coefficients should
be calculated – see Similarity matrix, page 1-114, for how the similarity
coefficients are defined.
c In the Alignment box, click on a radio button to choose whether matching
should be carried out on the basis of:
●
Position – distance from start of track
●
Rf – relative position between Rf start and end lines on the tracks
●
MW – molecular weight calculated using the molecular weight
calibration curve(s) for the tracks.
4 Enter a Tolerance figure to set a limit to the accuracy required when
matching peaks (this does not have to be a whole number).
Note
For Profile matching, the Tolerance must be set to a number less than or equal to 1.
5 In the Dendrogram Drawing box:
a Choose whether to use UPGMA or Neighbor Joining as the linkage rule
for the dendrogram – see The dendrogram, page 6-10, for a description of
these linkage rules.
b Check or uncheck Include MW standard(s) to choose whether molecular
weight standard tracks should be included in the dendrogram.
6 Press Apply to see the effect of the settings without closing the dialog box;
press OK to save the new settings and close the dialog box.
7 If required, repeat Steps 1–6 for the other areas of interest.
GeneTools User Manual
8-55
Menus
Edit (Spot blot/Manual band quantification window)
This section describes the commands appearing on the Edit menu when a Spot
blot/Manual band quantification window is selected.
Undo, Cut, Copy and Paste are disabled for all types of window.
Quantity calibration
To set or view the calibration method and units for quantity determination:
1 Choose Quantity calibration from the Edit menu to display the Quantity
calibration dialog box:
2 Choose the shape of calibration curve(s) from the drop-down list box. You can
choose:
●
Linear through origin (single standard value)
●
Linear (multiple standard values)
●
Linear through origin (multiple standard values)
●
Quadratic, or
●
Quadratic through origin.
3 Enter your own quantity units in the Units box.
4 Press OK to save the new settings and close the dialog box.
8-56
GeneTools User Manual
Edit (Molecular weight library window)
Note
If you select Linear through origin (single standard value) the calibration curve is
drawn through the origin and the last calibration point you have added – in other
words, adding a new calibration point replaces the previous one. For the other types of
curve, the calibration curve is drawn as the best fit for all the (relevant) calibration
points – adding a new calibration point contributes to (and does not replace) the
calibration from any previous points.
Edit (Colony counting window)
Undo, Cut, Copy and Paste are the only commands appearing on the Edit menu when
a Colony counting window is selected. These commands are disabled for all types of
window, including the Colony counting window.
Edit (Molecular weight library window)
Undo, Cut, Copy and Paste are disabled for all types of window.
New standard
You can only edit a molecular weight/quantity standard if the library is unlocked – see
the entry for Unlock in the File menu, page 8-41.
To create a new molecular weight/quantity standard in a library:
1 If the library is already open, click in its Molecular weight library window to
select it.
GeneTools User Manual
8-57
Menus
Otherwise, choose Open library from the File menu to open the library.
2 Click in the Molecular weight library window for the required library to select
it.
3 Choose New standard from the Edit menu (or right-click in the window to
display a pop-up menu and choose New) to display the New standard dialog
box:
Note
You can also display this dialog box by pressing New standard on the Edit standard
page of the Assign molecular weight/quantity dialog box – see the entry for Assign
molecular weight in the Peak menu, page 8-104.
4 Enter a name for the Standard.
5 Press OK to display the Edit molecular weight standard dialog box:
6 Enter the first Peak number (ie, 1).
8-58
GeneTools User Manual
Edit (Molecular weight library window)
7 Enter its Molecular weight (molecular weights must decrease as peak number
increases) and/or Quantity.
8 Press Insert. The peak number and associated molecular weight will appear
in the list box at the top of the dialog box.
The Peak number will be increased by one automatically, ready for you to
add the next peak.
9 Repeat Steps 7–8 for the remaining peaks.
10 Press OK to close the dialog box. The new standard will appear in the
Molecular weight library window.
Edit standard
You can only edit a molecular weight/quantity standard if the library is unlocked – see
the entry for Unlock in the File menu (page 8-41).
To edit a molecular weight/quantity standard in a library:
1 If the library is already open, click in its Molecular weight library window to
select it.
Otherwise, choose Open library from the File menu to open the library.
2 Select the standard in the Molecular weight library window by clicking on the
standard’s name or any of the peaks in its list.
GeneTools User Manual
8-59
Menus
3 Choose Edit standard from the Edit menu (or right-click on the standard’s
name or any of the peaks in its list to display a pop-up menu and choose
Edit) to display the Edit molecular weight standard dialog box:
The list in the dialog box shows the peaks and the molecular weights assigned
to them in the standard.
To add a new peak to the standard:
1 Enter the Peak number (it must be different from any existing peak numbers).
2 Enter the Molecular weight (molecular weights must decrease as peak
number increases) and/or Quantity.
3 Press Insert.
To change a peak in the standard:
1 Select the peak you want to change by clicking on it in the list of peaks. The
peak number and molecular weight will be shown in the Peak number and
Molecular weight boxes.
2 Change the Peak number and/or Molecular weight and/or Quantity as
required.
3 Press Change.
8-60
GeneTools User Manual
Edit (Molecular weight library window)
To delete a peak from the standard:
1 Select the peak you want to delete by clicking on it in the list of peaks. The
peak number, molecular weight and quantity will be shown in the Peak
number, Molecular weight and Quantity boxes.
2 Press Delete.
Delete standard
You can only delete a molecular weight/quantity standard from a library if the library is
unlocked – see the entry for Unlock in the File menu (page 8-41).
To delete a molecular weight/quantity standard from a library:
1 If the library is already open, click in its Molecular weight library window to
select it.
Otherwise, choose Open library from the File menu to open the library.
2 Select the standard in the Molecular weight library window by clicking on the
standard’s name.
3 Choose Delete standard from the Edit menu (or right-click on the standard’s
name to display a pop-up menu, and choose Delete).
Rename standard
You can only rename a molecular weight/quantity standard if the library is unlocked –
see the entry for Unlock in the File menu (page 8-41).
To rename a molecular weight/quantity standard from a library:
1 If the library is already open, click in its Molecular weight library window to
select it.
Otherwise, choose Open library from the File menu to open the library.
2 Select the standard in the Molecular weight library window by clicking on the
standard’s name.
GeneTools User Manual
8-61
Menus
3 Choose Rename standard from the Edit menu (or right-click on the
standard’s name to display a pop-up menu, and choose Rename) to display
the Rename dialog box:
4 Edit the name in the New name box.
5 Press OK to close the dialog box.
The standard will appear with the new name in the Molecular weight library window.
Edit (Profile comparison window)
Undo, Cut, Copy and Paste are the only commands appearing on the Edit menu when
the Profile comparison window is selected. These commands are disabled for all types
of window, including the Profile comparison window.
8-62
GeneTools User Manual
View (Gel window)
View (Gel window)
The picture shows the View menu when a Gel window is selected. Some of these
commands do not appear on the menu when other types of window are selected – see
pages 8-69–8-71 for pictures. The only command that can appear on the View menu
that does not appear when a Gel window is selected is Spot numbers, which appears
when a Spot blot/Manual band quantification window is selected – see page 8-70 for
details.
Profile comparison
To open the Profile comparison window if it is not already open, or to select it if it is:
Choose Profile comparison from the View menu.
The Profile comparison window can be used to compare the profiles for different
tracks (which may be on different samples) by plotting them on the same axes.
GeneTools User Manual
8-63
Menus
See The Profile comparison window in the Windows chapter (page 6-18) for how to use
the Profile comparison window.
Histogram
To show or hide the Histogram viewer:
Choose Histogram from the View menu.
You can use the Histogram to view the distribution of intensities in the image and to
adjust the image display – see The Histogram viewer in the Windows chapter (page
6-34) for how to use the Histogram viewer.
Zoom in
To increase the magnification of the display of the Image pane in a Sample window, or
to increase the horizontal scale of the profiles in the Profile comparison window:
Choose Zoom in from the View menu.
Zoom out
To reduce the magnification of the display of the Image pane in a Sample window, or to
decrease the horizontal scale of the profiles in the Profile comparison window:
Choose Zoom out from the View menu.
Zoom reset
To remove any magnification from the display of the Image pane in a Sample window,
or the horizontal scale of the profiles in the Profile comparison window:
Choose Zoom reset from the View menu.
8-64
GeneTools User Manual
View (Gel window)
Align banks of tracks
When the tracks are locked in all areas of interest, you can choose whether the Image
pane should display the original gel image with tracks marked on the image or display
the tracks in aligned banks (see View modes, page 6-4, in the Windows chapter for a
description of the different modes).
To switch aligned banks of tracks view on or off:
Choose Align banks of tracks from the View menu.
The command is checked in the menu when the Image pane shows banks of tracks.
Viewing the tracks in aligned banks is particularly useful for High Throughput Gel
samples and is automatically selected when you lock a High Throughput Gel sample,
though you can deselect it if required.
When aligned banks of tracks view is on, the only way to unlock the tracks is using
Position all in the Track menu or the Position all button. Unlocking the tracks in any
area of interest switches aligned banks of tracks view off.
Display corrected profiles
To choose whether to display corrected profiles (profiles with the background
subtracted) or uncorrected profiles in the Profile pane:
Choose Display corrected profiles from the View menu.
The command is checked in the menu when the display of corrected profiles is
switched on.
Peak markers
To switch the display of peak markers on the tracks in the Image pane on or off:
Choose Peak markers from the View menu.
The command is checked in the menu when the display of peak markers is switched
on.
You can use Configuration in the Extras menu to change the color of the peak markers
– see page 8-143.
GeneTools User Manual
8-65
Menus
Peak bounds
To switch the display of peak bounds on the tracks in the Image pane on or off:
Choose Peak bounds from the View menu.
The command is checked in the menu when the display of peak bounds is switched on.
You can use Configuration in the Extras menu to change the color of the peak bounds
– see page 8-143.
Tracks
To switch the display of track markers in the Image pane on or off:
Choose Tracks from the View menu.
The command is checked in the menu when the display of track markers is switched
on.
You can use Configuration in the Extras menu to change the color of the track markers
– see page 8-143.
Match lines
To switch the display of match lines on or off:
Choose Match lines from the View menu.
Note
Match lines are only displayed if Matching is selected in the View menu.
No match lines are displayed if Profile is selected as the matching Type in the
Matching Parameters dialog box – see Band Matching, page 8-53.
The match lines join peaks that have been matched on different tracks in the Image
pane.
The command is checked in the menu when the display of match lines is switched on.
You can use Configuration in the Extras menu to change the color of the match lines –
see page 8-143.
8-66
GeneTools User Manual
View (Gel window)
Peak numbers only
To display just the peak numbers in the Peak value pane (the Graphics pane will be
unaffected):
Choose Peak numbers only from the View menu.
Molecular weight
To display:
●
the molecular weight calibration graph in the Graphics pane, and
●
molecular weights in the Peak value pane:
Choose Molecular weight from the View menu.
Quantities
To display:
●
the quantity calibration graph in the Graphics pane, and
●
quantities in the Peak value pane:
Choose Quantities from the View menu.
Matching
To display track matching details:
Choose Matching from the View menu.
The effect is to display:
●
the dendrogram in the Graphics pane; and
●
when Band is selected as the matching Type in the Matching parameters dialog
box (see Band matching, page 8-53):
●
the matching standard track profile overlaid on the selected track profile in the
Profile pane
●
the peak number and position of the peaks in the matching standard track in the
Peak value pane
GeneTools User Manual
8-67
Menus
●
Matching comparisons in the Results pane (if Profile is selected as the matching
Type, the Matching comparisons tab is displayed but the table is always blank).
Maximize pane
To maximize the Graph or Results pane so that it fills the Gel window:
1 Click in the pane to select it.
2 Choose Maximize pane from the View menu.
To return the pane to its normal size:
Choose Maximize pane from the View menu again.
Or
Adjust the size of the Gel window.
Toolbars submenu
The contents of the Toolbars submenu depend on the type of window selected. The
picture shows the submenu when a Gel window is selected – the only toolbar not
included when a Gel window is selected is the Spot blot toolbar, which is displayed
when a Spot blot/Manual band quantification window is selected.
To show or hide one of the GeneTools toolbars:
Choose the toolbar from the View®Toolbars submenu.
The toolbar will be checked in the submenu when it is displayed.
See the Toolbars chapter (chapter 7) for more information about working with toolbars.
8-68
GeneTools User Manual
View (Spot blot/Manual band quantification window)
Toolbar buttons on menus
To show or hide pictures of toolbar buttons next to the equivalent commands in menus:
Choose Toolbar buttons on menus from the View menu.
Status bar
To show or hide the Status bar at the bottom of the main window:
Choose Status bar from the View menu.
The status bar shows hints for using the tool or command under the pointer and a
variety of other pieces of information depending on what type of window is selected,
and what is selected in the window. For example:
●
if you click in the Profile pane in a Gel window, the status bar shows the height of
the profile at the pointer,
●
if you select a spot frame in a Spot blot/Manual band quantification window, the
status bar shows the spot number.
View (Spot blot/Manual band quantification window)
All of these commands except Spot numbers also appear on the menu when a Gel
window is selected – see the relevant entries in the View (Gel window) section,
page 8-63, for details.
GeneTools User Manual
8-69
Menus
Spot numbers
To show/hide identification labels on the spot frames:
Choose Spot numbers from the View menu.
Spot numbers is checked in the View menu when the labels are shown.
View (Colony counting window)
All of these commands also appear on the menu when a Gel window is selected – see
the relevant entries in the View (Gel window) section (page 8-63) for details.
View (Profile comparison window)
All of these commands except those on the Plot mode submenu also appear on the
menu when a Gel window is selected – see the relevant entries in the View (Gel
window) section, page 8-63, for details.
8-70
GeneTools User Manual
View (Molecular weight library window)
Plot mode submenu
The Plot mode submenu appears in the View menu when a Profile window is selected.
To use Rf as the horizontal axis for track profiles in the Profile comparison window:
Choose Rf from the View®Plot mode submenu.
To use (log) molecular weight as the horizontal axis for track profiles:
Choose MW from the View®Plot mode submenu.
Note
If the Match software option is installed in your system, the parameter chosen for the
horizontal scale (Rf or MW) also determines the alignment used when matching tracks
in the Profile comparison window.
View (Molecular weight library window)
All of these commands also appear on the menu when a Gel window is selected – see
the relevant entries in the View (Gel window) section (page 8-63) for details.
GeneTools User Manual
8-71
Menus
Track
The Track menu is displayed when a Gel window is selected.
Note
8-72
Some Track menu commands are always disabled when the Gel window contains a
High Throughput Gel sample; Height individual is always disabled when it contains a
Gel sample.
GeneTools User Manual
Track
Locate tracks
Note
The Locate tracks command is permanently disabled for High Throughput Gel samples.
To locate the tracks in the selected area of interest on the image in an existing secure
sample file automatically:
Choose Locate tracks from the Track menu.
Width individual
To choose whether to adjust the width of all tracks (in the selected area of interest) or
just the selected track when you use Width in the Track menu to adjust track width:
Choose Width individual from the Track menu.
When Width individual is checked in the Track menu, you can use Width in the Track
menu to adjust the width of the selected track only; when Width individual is
unchecked you can use Width in the Track menu to adjust the width of all tracks (in
the selected area of interest) at the same time.
Height individual
Note
The Height individual command is selected and permanently disabled for Gel samples.
To choose whether to adjust the height and tilt of all tracks (in the selected area of
interest) or just the selected track on a High Throughput Gel sample when you use
Move/tilt in the Track menu to adjust track height and tilt:
1 Click in the Gel window containing the sample to select it.
2 Choose Height individual from the Track menu.
When Height individual is checked in the Track menu, you can use Move/tilt in the
Track menu to adjust the height and tilt of the selected track only; when Height
individual is unchecked you can use Move/tilt in the Track menu to adjust the height
and tilt of all tracks (in the selected area of interest) at the same time.
GeneTools User Manual
8-73
Menus
Lock all
The tracks shown on the sample in the Image pane in the Gel window can be either
locked or unlocked.
You need to lock the tracks before you can perform any of the functions that require
the program to analyze the image along the tracks, such as locating the peaks, and
assigning and calculating molecular weights and quantities.
To lock the tracks (in the selected area of interest) on a sample in the selected Gel
window:
Choose Lock all from the Tracks menu.
When the tracks (in the selected area of interest) are locked, Lock all is checked in the
menu and the button is shown as depressed in the toolbar.
To unlock the tracks (in the selected area of interest) on a sample in the selected Gel
window:
Choose any of the tools for editing the tracks. These are:
●
Position all
●
Splay all (not for High Throughput Gels)
●
Move/tilt
●
Width
●
Rf start (not for High Throughput Gels)
●
Rf end (not for High Throughput Gels).
Position all
To adjust the overall positioning of all the tracks (in the selected area of interest) on a
sample together (see Splay all, page 8-76, for adjusting both the overall position and
the amount of track splay):
1 Click in the Gel window containing the sample to select it.
If there is more than one area of interest, click in the one you want to
change.
8-74
GeneTools User Manual
Track
2 Choose Position all from the Track menu.
The tracks will be unlocked and drag boxes will appear at the outer corners of
the two outside tracks.
3 Move the pointer over the drag box at the first corner that you want to move.
The pointer will change to a four-way arrow.
4 Press and drag the corner box to its new position.
The outlines of the tracks’ new positions will be shown as you drag.
GeneTools User Manual
8-75
Menus
5 Drop the corner box in its new position:
6 Repeat Steps 3–5 for the diagonally opposite corner if required.
Splay all
Note
The Splay all command is permanently disabled for High Throughput Gel samples.
This topic describes how to adjust the amount by which the tracks on a sample are
splayed apart.
To adjust the amount by which the tracks (in the selected area of interest) on a sample
are splayed apart (see Position all, page 8-74, for adjusting the overall positioning,
without changing the amount of track splay):
1 Click in the Gel window containing the sample to select it.
If there is more than one area of interest, click in the required you want to
change.
2 Choose Splay all from the Track menu.
8-76
GeneTools User Manual
Track
The tracks will be unlocked and drag boxes will appear at the outer corners of
the two outside tracks:
3 Move the pointer over the drag box at the first corner that you want to move.
The pointer will change to a four-way arrow:
GeneTools User Manual
8-77
Menus
4 Press and drag the corner box to its new position.
The outlines of the tracks’ new positions will be shown as you drag:
5 Drop the corner box in its new position:
6 Repeat Steps 3–5 for the other corners if required.
Move/tilt
The first three steps in moving, tilting or bending a track are the same.
To move, tilt or bend a track, first:
1 Click (in the selected area of interest) in the Gel window containing the
sample to select it.
8-78
GeneTools User Manual
Track
2 Choose Move/tilt from the Track menu. The tracks will be unlocked.
3 Click in the track that you want to adjust to select it. The track will be
highlighted and will have a drag box at each end.
You can now move, tilt or bend the track.
To move an individual track on a sample:
4 Perform Steps 1-3 as above.
5 Move the pointer to a point anywhere within the track (not on the drag
boxes):
6 Press and drag the track to its new position:
GeneTools User Manual
8-79
Menus
7 Drop the track in its new position:
To tilt an individual track on a sample:
4 Perform Steps 1–3 as above.
5 Move the pointer over the drag box at the first end that you want to move.
The pointer will change to a four-way arrow:
6 Press and drag the box to its new position. You can drag to any position
provided you do not overlap other tracks or invert the electrophoresis
direction.
8-80
GeneTools User Manual
Track
The outline of the track’s new position will be shown as you drag:
7 Drop the track in its new position:
8 Repeat Steps 5–7 for the other end of the track if required.
To bend an individual track on a sample:
4 Perform Steps 1–3 as above.
GeneTools User Manual
8-81
Menus
5 Double-click at the point on the track that you want to bend it. A new drag
box will appear at that point:
When you place the pointer over the drag box, it turns into a four-way arrow:
8-82
GeneTools User Manual
Track
6 Press and drag the box to its new position. You can drag to any position
provided you do not overlap other tracks or invert the electrophoresis
direction.
The outline of the track’s new shape will be shown as you drag.
7 Drop the drag box in its new position.
GeneTools User Manual
8-83
Menus
8 Repeat Steps 5–7 if you want to put any other bends in the track.
To remove a bend in an individual track on a sample:
4 Perform Steps 1–3 as above. Drag boxes will appear at the ends of the track
and at any bend points.
5 Double-click on the drag box at the apex of the bend that you want to
remove.
Width
Note
You can use Width individual in the Track menu to choose whether to change the
width of the selected track only or of all tracks (in the selected area of interest) together:
the following instructions apply in either case. When you adjust the widths of all tracks
at the same time, all tracks are set to the width of the track that you are using to adjust
the track width.
To adjust track width on a sample:
1 Click (in the area of interest) in the Gel window containing the sample to
select it.
2 Choose Width from the Track menu. The tracks will be unlocked.
3 Click in the track that you want to adjust to select it. The track will be
highlighted and will have a drag box on each corner:
8-84
GeneTools User Manual
Track
4 Move the pointer over one of the drag boxes (it doesn’t matter which):
5 Press and drag at right angles to the electrophoresis direction (for example,
sideways if the electrophoresis direction is up or down). As you are dragging,
the new outline of the track will be shown:
6 Release to set the new track width:
GeneTools User Manual
8-85
Menus
Rf start position
and
Rf end position
Note
The Rf start position and Rf end position commands are permanently disabled for
High Throughput Gel samples.
When you compare profiles, the profiles (which may be taken from different secure
sample files) are plotted on an Rf scale from 0 to 1 taken between the Rf start and end
lines.
You can adjust the position of the Rf lines in the electrophoresis direction, the angle of
the lines across the electrophoresis direction, or add bends to the lines.
The first two steps in all these procedures are the same.
Note
Adjusting the overall position or splay of the tracks on the sample also adjusts the
position of the Rf lines, so you should make any adjustments to the track position and
splay before adjusting the Rf lines.
To adjust the Rf start or end position (in an area of interest) on a sample:
1 Click (in the area of interest) in the Gel window containing the sample to
select it.
2 Choose Rf start position from the Track menu
or
Choose Rf end position from the Track menu.
8-86
GeneTools User Manual
Track
The tracks will be unlocked and two drag boxes will appear on the appropriate Rf line
(the examples show the Rf end line, but the procedures are identical for both):
You can now either just move the whole line along the electrophoresis direction, adjust
the angle of the line or add bends to the line.
To move an Rf line without changing its angle:
3 Follow Steps 1–2 above.
4 Move the pointer over the line, but not over either of the drag boxes. The
pointer will change to a two-way arrow.
5 Press and drag the line to its new position.
The line’s new position will be shown as you drag.
GeneTools User Manual
8-87
Menus
6 Drop the line in its new position.
To adjust the angle of an Rf line:
3 Follow Steps 1-2 above.
4 Move the pointer over one of the drag boxes. The pointer will change to a
four-way arrow:
5 Press and drag the box to change the angle of the line.
As you drag the box, the new position of the line will be shown on the
sample (the line pivots about the other drag box):
8-88
GeneTools User Manual
Track
6 Drop the line in its new position:
To add a bend to an Rf line:
3 Follow Steps 1–2 above.
4 Move the pointer to the point on the sample where you want the apex of the
bend:
5 Double-click. The bend will be added to the line with a new drag box at its
apex:
6 If you want to adjust the position of the bend, place the pointer over the drag
box. The pointer will change to a four-way arrow and you can drag the box
to a new position.
7 Repeat Steps 4–6 for any other bends you want to add.
GeneTools User Manual
8-89
Menus
To remove a bend from an Rf line:
3 Follow Steps 1–2 above.
4 Double-click on the drag box at the apex of the bend.
Invert profile
To invert the peak profile for a track (you would use this for a Zymer gel or a gel that
has tracks with light bands and tracks with dark bands):
1 Click in the track to select it.
2 Choose Invert profile from the Track menu.
Edit manual baseline
To set a manual baseline for a track’s profile:
1 Click on the track in the Image pane to select it.
2 Right-click in the Image pane (or Profile pane) to display a context menu.
8-90
GeneTools User Manual
Track
3 Choose Edit manual baseline.
The baseline will be displayed with circular drag handles at its ends and in the
color selected for the manual baseline (you can use Configuration in the
Extras menu to change the color of the manual baseline – see page 8-143).
4 If required, double-click on the baseline to add additional drag handles so
that you can bend the line.
Any peak markers and boundaries will be removed from the profile.
GeneTools User Manual
8-91
Menus
5 To reshape the baseline:
a Position the pointer over the drag handle you want to move. The pointer
will change to a four-way arrow.
b Drag the handle to reshape the baseline.
8-92
GeneTools User Manual
Track
c Drop the handle in its new position.
Note
You cannot drag a handle above the profile line. While you are dragging a handle, the
new baseline may be drawn above the profile, but when you release the mouse button
it will be reshaped so that it always lies below it.
For example, when you release the mouse button,
will become
GeneTools User Manual
8-93
Menus
Delete manual baseline
To delete a manual baseline for a track:
1 Click on the track in the Image pane to select it.
2 Right-click in the Image pane (or Profile pane) to display a context menu.
3 Choose Delete manual baseline.
MW/quantity standard
To define a track as a molecular weight and/or quantity standard (for its area of interest)
if it is not already defined as a standard, and to assign molecular weights and/or
quantities to the peaks:
1 Click in the required track to select it.
2 Locate the peaks on the track if they haven’t already been located.
3 If necessary, edit the peaks.
(In particular, if you want to assign a set of molecular weights from a standard,
you should remove any spurious peaks to avoid any standards being assigned
to them.)
4 Choose MW/quantity standard from the Track menu (or the pop-up menu
displayed by right-clicking in the track label) to define the track as a molecular
weight/quantity standard.
The track will be labeled MwS and the command will be checked in the
menus when the track is selected.
5 The Assign molecular weight/quantity dialog box will be displayed open at
the From standard page so that you can assign molecular weights and/or
quantities to the peaks in the track.
This dialog box is also displayed when you choose Assign molecular weight
from the Peak menu – see page 8-104 for details.
To remove the molecular weight/quantity standard track status from a track:
1 Click in the required track to select it.
8-94
GeneTools User Manual
Track
2 Choose MW/quantity standard from the Track menu (or the pop-up menu
displayed by right-clicking in the track label).
The MwS, QuS or MQS label will be removed from the track and the
command will be unchecked in the menus when the track is selected.
Matching standard
This operation is only available if you have purchased the GeneTools Match software
option.
Note
This command is only relevant when the matching Type selected in the Matching
parameters dialog box (See Band matching, page 8-53) is Band; you do not need to
define a matching standard for Profile matching.
When you match peaks on the tracks in an area of interest, they are matched to the
active matching standard track for that area of interest.
To make a track a matching standard (and in the process make it the active matching
standard for its area of interest):
1 Click on the track in the Image pane to select it.
2 Choose Matching standard from the Track menu.
(Alternatively, right-click on the track’s label in the Track label pane to select it and pop
up a menu, then choose Matching standard from the menu.)
The track label will show MS* – the MS means it is a matching standard, the * means it
is the active matching standard (if there was a previous active matching standard, it will
now show MS to show that it is still a matching standard but no longer the active
matching standard).
See the entry for Active matching standard in the Track label context menu,
page 8-149, for how to make an existing matching standard the active matching
standard.
To remove matching standard status from a track:
1 Click on the track in the Image pane to select it.
GeneTools User Manual
8-95
Menus
2 Choose Matching standard from the Track menu again.
(You can use the track context menu instead if you wish.)
If the track was the active matching standard, the other matching standard (if any) with
the highest track number will become the active matching standard.
Insert
Before carrying out any of the procedures described in this topic for inserting tracks,
you must:
1 Click in the Gel window containing the sample to select it; if there is more
than one area of interest, click in the relevant one.
2 Unlock the tracks if they are locked (choose any of the track editing
commands such as Position all, Move/tilt and so on).
Note
In order to place a track on a sample by double-clicking, you must choose Move/Tilt or
Width from the Track menu to unlock the tracks.
You can now place a new tracks on a sample by:
8-96
●
selecting a menu command
●
double-clicking
●
dragging out the track.
GeneTools User Manual
Track
Using a menu command
To place a new track on a sample using a menu command after following Steps 1
and 2:
3 Click in the track to the right of the space into which you want to insert the
new track:
4 Choose Insert from the Track menu.
Provided there is enough space for the track (including inter-track space) the new track
will be inserted. The new track will have the same size and shape as the selected track.
You may need to adjust the position or the width of the track after it has been inserted.
GeneTools User Manual
8-97
Menus
Double-clicking
To place a track on a sample by double-clicking after following Steps 1 and 2:
Note
In order to place a track on a sample by double-clicking, you must choose Move/Tilt or
Width from the Track menu to unlock the tracks at Step 2.
3 Click on a track with the size and shape required for the new track (you can
always change these later).
Note
You cannot use a track from a different area of interest as the model for the new track –
you must select a track in the same area of interest.
4 Double-click at the point where you want the track to be.
The track will be inserted centered horizontally at the point you clicked provided this
would not cause the new track to overlap existing tracks. If there would be an overlap,
the track is not inserted.
Dragging
To place a track on a sample by dragging out the track after following Steps 1 and 2:
3 If Width individual is unchecked in the Track menu, choose it to set
individual width mode.
4 Move the pointer to the position where you want to place one of the corners
of the track (it doesn’t matter which corner):
8-98
GeneTools User Manual
Track
5 Press and drag out to the opposite corner (a rectangle will be drawn on the
image as you are dragging, to show the position of the track):
6 Release to place the track on the sample.
Delete
To delete a track from a sample:
1 Click in the track in the Image or Track label pane to select it.
2 Unlock the tracks if they are locked.
3 Choose Delete from the Track menu or press con the keyboard.
GeneTools User Manual
8-99
Menus
Enable
To enable a disabled track:
1 Lock the tracks in all the areas of interest in the Gel window.
2 Click on the track in the Image or Track label pane to select it.
3 Choose Enable from the Track menu or the pop-up menu displayed when
you right-click in the Track label pane.
Disable
To disable a track:
1 Lock the tracks in all the areas of interest in the Gel window.
2 Click on the track in the Image or Track label pane to select it.
3 Choose Disable from the Track menu or the pop-up menu displayed when
you right-click in the Track label pane.
When a track is disabled, the label in the Track label pane, the profile in the Profile
pane and values in the Peak value pane are grayed. Results for disabled tracks do not
appear in the Results pane or in printed reports.
Copy to clipboard
To copy a picture of the image lying within the borders of the selected track to the
clipboard:
Choose Copy to clipboard from the Track menu or the context menu
displayed when you right click in the Track label pane.
Description
To add a description for a track:
1 Lock the tracks in all the areas of interest in the Gel window.
2 Click on the track in the Image or Track label pane to select it.
8-100
GeneTools User Manual
Track
3 Choose Description from the Track menu or the pop-up menu displayed
when you right-click in the Track label pane, to display the Track description
dialog box:
4 Type the description in the edit box.
5 Press OK to confirm the description and close the dialog box.
The description will be shown in the track Description pane in the Gel window –
“Solution XF9” in the following example:
The description will also be shown with the results for individual tracks if they are
included in Gel reports.
GeneTools User Manual
8-101
Menus
Properties
To display information about a track selected in the Image pane:
1 Click in the Gel window containing the sample to select it.
2 Click in the track in the Image or Track label pane to select it.
3 Choose Properties from the Track menu to display the Track properties
dialog box:
8-102
GeneTools User Manual
Track
4 Click on the Peaks tab to display a table of information about the peaks in
the track:
The Track properties dialog box can also be displayed for the track selected in the
Profile comparison window by choosing Properties from the Profile menu.
GeneTools User Manual
8-103
Menus
Peak
Assign molecular weight
Notes
You can only assign molecular weights/quantities when the tracks are locked – see the
entry for Lock all in the Track menu (page 8-74).
You will need to define molecular weight/quantity standard tracks and assign molecular
weights to them in each area of interest for which you want molecular weight results –
the molecular weight calibrations in each area of interest are independent of all the
others (but for quantities, you can use the quantity calibration from a different area of
interest).
To assign molecular weights and/or quantities to a molecular weight/quantity standard
track (see the entry for MW/quantity standard in the Track menu (page 8-94) for how
to make a track a molecular weight/quantity standard track):
1 If you want to assign a molecular weight/quantity to a single peak, select it in
the Image pane or Profile pane; if you want to assign a series of molecular
weights/quantities, select the first (highest molecular weight) peak to which
you want to assign a molecular weight/quantity. In fact this step is not essential
as you can change the selected peak later.
Note
8-104
When you assign molecular weights/quantities from a molecular weight standard library,
the molecular weights/quantities in the standard are assigned to each peak in turn,
starting from the selected peak. You should check that each peak in the track
corresponds to a molecular weight/quantity in the standard, and vice versa – delete any
spurious peaks (see Delete®Selected peak(s) – page 8-113) and add any missing ones
(double-click in the profile pane).
GeneTools User Manual
Peak
2 Choose Assign molecular weight from the Peak menu.
The Assign molecular weight/quantity dialog box will be displayed open at
the From standard page:
Arrow buttons to select
the track peak
Standards drop-down list
Details of selected standard
The Selected peak box shows the number of the selected peak; you can change it
using the arrow buttons, but not by typing into the box. The Calculated MW box is also
read-only and will show the molecular weight of the selected peak calculated using any
other molecular weights you have entered and the peak position – it will show 0 if you
have not entered enough data to calculate a molecular weight.
This dialog box allows you to assign molecular weights and/or quantities from a standard
or assign molecular weights and/or quantities to individual peaks manually. It also allows
you to edit a molecular weight/quantity standard in a library and change the way
molecular weights and quantities are calculated from molecular weight/quantity
standard tracks.
To assign molecular weights and/or quantities from a molecular weight standard library:
1 If the Selected peak box does not show the peak corresponding to the first
molecular weight/quantity in the standard, use the arrow buttons to select that
peak.
GeneTools User Manual
8-105
Menus
2 Choose the required standard from the Standards drop-down list.
The list box below the Standards drop-down list will show the peak/molecular
weights/quantities for the standard.
3 Press Assign from standard.
To assign molecular weights and/or quantities to individual peaks manually:
1 Click on the Manual tab to display the Manual page:
2 If the Selected peak box does not show the peak to which you want to assign
a molecular weight or quantity, use the arrow buttons to select it.
3 To assign a molecular weight:
a Enter the molecular weight that you want to assign in the Assigned MW
box.
b Press Assign value to peak.
The Selected peak box will show the next peak ready for you to assign
the next molecular weight.
8-106
GeneTools User Manual
Peak
To assign a quantity:
a Press Assign quantity to peak to display the Assign calibrated quantities
dialog box.
b This dialog box is also displayed when you choose Assign quantity from
the Peak menu – see page 8-110 for details.
4 Repeat Steps 2 and 3 for any other molecular weights/quantities that you
want to assign (you must assign at least two molecular weights).
When you press Assign from standard on the From standard page or Assign value to
peak or Assign quantity to peak on the Manual page:
●
The assigned molecular weight(s)/quantities will appear in the Peak value pane next
to the relevant peak(s) in the Profile pane when Molecular weight/Quantity is
selected in the View menu:
GeneTools User Manual
8-107
Menus
Note
●
The peak marker on the track in the Image pane will have a short line across it to
show that it has been assigned a molecular weight and/or quantity:
●
The MW calibration tab/Quantity calibration tab in the Gel window’s Graphics
pane will show (for the selected area of interest) the calibration points and the
selected calibration curve joining them (see the next instructions for selecting the
type of calibration curve). For example (see the next command for an example
showing the Quantity calibration tab):
You can define more than one track in an area of interest as a standard, and assign
molecular weights to each of them (see the next step for choosing how multiple
standard tracks are used to calculate the molecular weights on other tracks).
To specify how molecular weights/quantities are calculated from standard tracks:
Press Edit calibration or Edit quantity calibration in the Assign molecular
weight/quantity dialog box to display the Molecular weight calibration or
Quantity calibration dialog box.
8-108
GeneTools User Manual
Peak
These dialog boxes are also displayed when you choose Molecular weight
calibration or Quantity calibration from the Edit menu – see page 8-50 and
page 8-52 for details.
To edit an existing molecular weight/quantity standard or to create a new one:
Click on the Edit standard tab to display the Edit standard page:
To edit a standard:
a Choose the standard from the drop-down list box.
b Press Edit standard to display the Edit molecular weight standard dialog
box.
This dialog box is also displayed when you choose Edit standard from the
Edit menu when a Molecular weight library window is selected – see
page 8-59 for details.
To create a new standard:
Press New standard to display the New standard dialog box.
This dialog box and the Edit molecular weight standard dialog box
following it are also displayed when you choose New standard from the
GeneTools User Manual
8-109
Menus
Edit menu when a Molecular weight library window is selected – see
page 8-57 for details.
Assign quantity
Note
You can only assign quantities to peaks when the tracks are locked – see the entry for
Lock all in the Track menu, page 8-74.
Note
The Assign quantity command will be disabled if you have defined more than one area
of interest and chosen to base the quantity calibration in the selected area of interest on
another area of interest – see the entry for Quantity calibration in the Edit menu,
page 8-52, for how to set the quantity calibration method.
Note
You can also assign quantities using the Assign molecular weight command – see the
previous command.
To assign a quantity to a peak in a track:
1 Click in the required track in the Image pane in the Gel window to select it.
2 Locate the peaks on the track if they haven’t already been located.
3 Select the peak to which you want to assign a quantity.
4 Choose Assign quantity from the Peak menu (or the pop-up menu displayed
when you right-click on the peak) to display the Assign calibrated quantities
dialog box:
8-110
GeneTools User Manual
Peak
The Peak box is read-only: it shows which peak was selected when you
opened the dialog box. The Raw quantity box is also read-only: it shows the
uncalibrated quantity calculated from the area of the peak. The Calibrated
quantity box shows the quantity calculated using the existing calibration if
there is one, and 0 if there isn’t.
The radio buttons are disabled if you have chosen to use a single calibration
curve for all tracks – see the entry for Quantity calibration in the Edit menu,
page 8-52, for how to set the quantity calibration method.
5 Enter a quantity in the Calibrated quantity for the selected peak to add a
new calibration point to the calibration curve.
6 If you have chosen to calibrate Each track to separate curves (see Quantity
calibration in the Edit menu – page 8-52):
Click on No propagation if you do not want this quantity assignment
applied to any other tracks.
or
Click on Propagate by peak number to apply this quantity assignment to
the same peak number on all other tracks.
or
a Click on Propagate by Rf to apply this quantity assignment to peaks with
the same Rf (within the given tolerance) on all other tracks.
b Enter a figure in the Tolerance box specifying how close the Rf of a peak
on another track has to be to the Rf of the selected peak for it to be
assigned the quantity calibration.
After you have assigned a quantity to a peak:
●
The Quantity calibration tab in the Gel window’s Graphics pane will show (for the
selected area of interest) the calibration points and the selected calibration curve
joining them (see Quantity calibration in the Edit menu, page 8-52, for how to
GeneTools User Manual
8-111
Menus
select the type of calibration curve: the example shows a quadratic calibration curve
– the equation of the curve is given in the Raw volume axis label):
The horizontal axis shows the raw quantity measured on the gel; the vertical axis
shows the calibrated quantity.
●
The assigned quantity and the quantities calculated from the calibration curve will
appear in the Peak value pane next to the relevant peak(s) in the Profile pane.
Unassign molecular weight
To remove a molecular weight assignment from a peak:
1 Select the peak by clicking on it in the Profile pane or the Image pane.
2 Choose Unassign molecular weight from the Peak menu.
The command is disabled if the selected peak does not have a molecular weight
assignment.
Unassign quantity
To remove a quantity assignment from a peak:
1 Select the peak by clicking on it in the Profile pane or the Image pane.
2 Choose Unassign quantity from the Peak menu.
8-112
GeneTools User Manual
Peak
The command is disabled if the selected peak does not have a quantity assignment.
Locate submenu
The commands on the Locate submenu are disabled unless the tracks are locked.
To detect the peaks on the selected track automatically:
Choose On selected track from the Peak®Locate submenu.
To detect the peaks on all tracks (in the selected area of interest) automatically:
Choose On all tracks from the Peak®Locate submenu.
Delete submenu
The commands on the Delete submenu are disabled unless the tracks are locked.
To delete one or more adjacent peaks from the selected track:
1 In the profile pane, move the pointer to a point within the first peak.
2 Drag to the final peak.
3 Choose Selected peak(s) from the Peak®Delete submenu.
To delete all the peaks from the selected track:
Choose All peaks on selected track from the Peak®Delete submenu.
To delete all the peaks from all tracks (in the selected area of interest):
Choose All peaks on all tracks from the Peak®Delete submenu.
GeneTools User Manual
8-113
Menus
Properties
To display a read-only dialog box showing properties of the selected peak:
Choose Properties from the Peak menu:
Profile
The Profile menu appears in the menu bar when the Profile comparison window is
selected: see the entry for Profile comparison in the View menu, page 8-63, for how
to display the Profile comparison window and Profile comparison window, page 6-18,
for more information about the Profile comparison window.
8-114
GeneTools User Manual
Profile
Reference
To select a track in a Profile comparison as the reference track (if the GeneTools
matching option is installed, the reference track will also be used as the matching
reference for peak matching – see Matching tracks in the Profile comparison window,
page 1-123):
1 Select the track by clicking on it in the left-hand pane in the Profile
comparison window.
2 Choose Reference from the Profile menu (or the context menu displayed
when you right-click in a profile window).
If the track selected as the reference track is shown (see next command), it will be
plotted in the selected highlight color in the Profiles pane. (The highlight color is red by
default, but you can set another color using the Configuration dialog box – see page
8-143 for details)
If you repeat the procedure for:
●
another track, the new track will become the reference track
●
a track that is already the reference track, it will be deselected and there will be no
reference track.
Show
To include a track in the Profile comparison window in a comparison if it is not
already included (or to remove it if it is):
1 Select the track by clicking on it in the left-hand pane in the Profile
comparison window.
2 Choose Show from the Profile menu (or the pop-up menu displayed when
you right-click on a track in the Profile comparison window).
The command is checked in the menu when the selected track is included in the
comparison.
GeneTools User Manual
8-115
Menus
Show all
To include all the tracks in the Profile comparison window in a comparison:
Choose Show all from the Profile menu.
Hide all
To remove all the tracks from a comparison in the Profile comparison window:
Choose Hide all from the Profile menu.
Export to Excel
To export to Excel the data points (Rf and height values) for a profile displayed in the
Profile comparison window:
1 Select the track by clicking on it in the left-hand pane in the Profile
comparison window.
2 If the track is not already included in the comparison, choose Show from the
Profile menu (or the pop-up menu displayed when you right-click on a track
in the Profile comparison window).
3 Choose Export to Excel from the Profile menu (or the pop-up menu
displayed when you right-click on a track in the Profile comparison window).
Note
Export to Excel is only enabled for tracks that are currently shown in the Profile
comparison window.
The data will be exported to a new worksheet in Excel, which will be opened if it is not
already open. One data point will be exported for each pixel along the track.
8-116
GeneTools User Manual
Matching
Properties
To display information about a track selected in the Profile comparison window:
1 Click on the track in the left-hand pane of the Profile comparison window to
select it.
2 Choose Properties from the Profile menu (or the pop-up menu displayed
when you right-click on a track in the Profile comparison window) to display
the Track properties dialog box.
This dialog box is also displayed when you select Properties from the Track
menu for a track selected in an Image window – see page 8-102 for details of
the information shown in this dialog box.
Matching
Note
The commands in the Matching menu are only available if the GeneTools matching
option is installed.
The menu appears in the menu bar when the Profile comparison window is selected:
see the entry for Profile comparison in the View menu, page 8-63, for how to display
the Profile comparison window; and Profile comparison window, page 6-18, for more
information about the Profile comparison window; and Matching tracks in the Profile
comparison window, page 1-123, for detailed instructions on how to carry out matching
in the Profile comparison window.
GeneTools User Manual
8-117
Menus
Parameters
To set or view the tolerance and method used for matching in the Profile comparison
window:
1 Choose Parameters from the Matching menu to display the Matching
parameters dialog box:
Note
This dialog box is also displayed when you choose Band matching from the Edit menu
when an area of interest is selected in a Gel sample window – the settings you make
here for the Profile comparison window are independent of any settings you may have
made for any areas of interest.
2 In the Matching box:
a In the Type box, select Band or Profile to decide whether to match tracks
using the detected bands (peaks) or the intensity profiles.
8-118
GeneTools User Manual
Matching
Note
When Profile is selected:
●
There is no need to detect the peaks on the tracks (unless you choose to match on
the basis of molecular weights by choosing MW from the View®Plot mode
submenu).
●
There is no need to define a matching reference track.
●
The Similarity Coefficient controls in the Matching parameters dialog box are
disabled.
b If you selected Band in the Type box, select Dice or Jaccard from the
Similarity Coefficient box to choose how the similarity coefficients should
be calculated – see Similarity matrix, page 1-114, for how the similarity
coefficients are defined.
Note
The Alignment radio buttons are permanently disabled when you display the dialog box
for the Profile comparison window – the setting (Rf or MW) is controlled by the
commands in the View®Plot mode submenu, which also set the horizontal axis of the
graphs in the Profiles pane.
3 Enter a Tolerance figure to set a limit to the accuracy required when
matching peaks (this does not have to be a whole number).
Note
For Profile matching, the Tolerance must be set to a number less than or equal to 1.
4 In the Dendrogram Drawing box choose whether to use UPGMA or
Neighbor Joining as the linkage rule for the dendrogram – see The
dendrogram, page 6-10, for a description of these linkage rules.
5 Press Apply to see the effect of the settings without closing the dialog box;
press OK to save the new settings and then close the dialog box.
Include all
To include all the tracks in the Profile comparison window in the matching:
Choose Include all from the Matching menu.
GeneTools User Manual
8-119
Menus
Exclude all
To exclude all the tracks in the Profile comparison window from the matching:
Choose Exclude all from the Matching menu.
Include selected in matching
Note
This command is only available if the GeneTools matching option is installed.
To include a track in the Profile comparison window in a matching if it is not already
included (or to remove it if it is):
1 Select the track by clicking on it in the left-hand pane in the Profile
comparison window.
2 Choose Include selected in matching from the Matching menu (or the
pop-up menu displayed when you right-click on a track in the Profile
comparison window).
The command is checked in the menu when the selected track is included in the
matching.
You must include at least three tracks in the matching to produce matching results.
Note
You can choose Include all from the Matching menu to include all tracks in the
matching or Exclude all from the Matching menu to remove all tracks from the
matching.
See Matching tracks in the Profile comparison window, page 1-123, for detailed
instructions on how to carry out matching in the Profile comparison window.
Database menu
Note
8-120
The Database menu and toolbar are only available if you have purchased the
GeneDirectory option.
GeneTools User Manual
Database menu
Archive gel to database
Note
The Archive gel to database command is disabled unless GeneTools is already
connected to a GeneDirectory database (see the entry for Connect to database,
page 8-126). However, GeneDirectory does not need to be running for the command
to be available, and if it is running, it does not matter which, if any, database is open.
The Archive gel to database command enables you to transfer gel data from GeneTools
to GeneDirectory. GeneDirectory works with the gel analysis data calculated in
GeneTools, so it is important to ensure that this data is as accurate and complete as
possible before transferring it to GeneDirectory. In particular, you should check that the
Rf start and finish lines are correct and that, where relevant, you have assigned any
molecular weight ladders to enable GeneDirectory to carry out any required
normalization.
Note
Because of the difficulty of maintaining consistency across gels, you are recommended
not to use Rf values alone.
To archive gel data to the connected database:
1 Use GeneTools to analyze the gel as required.
GeneTools User Manual
8-121
Menus
2 Choose Archive gel to database from the GeneTools Database menu to
display the Database dialog box:
3 On the Select Tracks page, to select the tracks for which you want to transfer
data to the GeneDirectory database:
a Click on a track to select or deselect it – selected tracks are shown by a
check.
b Check or uncheck Include molecular weight standard tracks if you want
to select or deselect any molecular weight standard tracks.
c Press Select all tracks to select all tracks (except molecular weight
standard tracks unless Include molecular weight standard tracks is
checked).
8-122
GeneTools User Manual
Database menu
4 Click on the Archive to experiment tab to display the Archive to Experiment
page:
The left-hand pane shows the folders and experiments in the database
structure – you can open a folder to display any subfolders and experiments
in a folder by clicking on its + icon or hide them by clicking on its - icon.
When you select an experiment in the left-hand pane, the right-hand pane
shows the gels it contains. You can open a gel in the right-hand pane to
display the tracks it contains by clicking on its + icon or hide them by clicking
on its - icon.
You use the Archive to experiment page to select the experiment to contain
the gel data. You can create a new experiment or export the data to an
existing one. You can also create a new folder to hold the new experiment,
and edit the names of folders and experiments.
5 To create a new folder in a folder:
a Click on the parent folder in the left-hand pane to select it.
GeneTools User Manual
8-123
Menus
b Press New Folder to create the new folder with the default name ‘New
Folder’.
c Click on the ‘New folder’ label to select the folder and click again to select
the name text.
d Edit the folder name.
Note
Folder names must be unique within folders – you will not be able to create a second
new folder in a folder until you have edited the name of the first new folder.
6 To create a new experiment in a folder:
a Click on the folder in the left-hand pane to select it.
b Press New Experiment to create the new experiment with the default
name ‘New experiment’.
c Click on the ‘New experiment’ label to select the experiment and click
again to select the name text.
d Edit the experiment name.
Note
Experiment names must be unique within the database – you will not be able to create
a new experiment if the database already contains an experiment called ‘New
experiment’.
7 To add gel data to an experiment:
a Click on the experiment in the left-hand pane to select it.
b Press Archive to Experiment to add the gel to the experiment – the gel
will appear in the right-hand pane.
8-124
GeneTools User Manual
Database menu
Note
GeneTools assigns a unique identifier to each gel, so it will be able to detect whether
you have previously exported data from the current gel to the database. If you have,
you will be asked if you want to create a copy of the data, and if you do, the gel will
be labeled accordingly. However, since you can reanalyze the data in GeneTools
between exports and select different tracks for each export, the data contained in a
copy may not be the same as the data originally exported, or the same as in other
copies.
8 Press Done to close the Database dialog box.
Open GeneDirectory
Note
The Open GeneDirectory command is disabled unless GeneTools is already connected
to a GeneDirectory database (see the entry for Connect to database, page 8-121).
To open the connected database in GeneDirectory.
Choose Open GeneDirectory from the GeneTools Database menu.
GeneDirectory will be started up if it is not already running. If GeneDirectory is already
running with a database open in it, that database will be closed. The connected
database will then be opened in GeneDirectory.
Notes
If the connected database is already open in GeneDirectory, choosing Open
GeneDirectory will close it and any open View windows.
Choosing Open GeneDirectory will have no effect if GeneDirectory is already running
and is displaying a dialog box.
GeneTools User Manual
8-125
Menus
Connect to database
To connect GeneTools to a GeneDirectory database:
1 Choose Connect to database from the GeneTools Database menu to display
a standard Windows Open dialog box:
2 Select the folder holding the database file from the Look in drop-down list.
3 Click on the database file in the file list box to select it.
4 Press Open to connect GeneTools to the database.
The database connection is saved when you close GeneTools, so it will be reconnected
automatically to the same database when you reopen it.
Note
8-126
You can only use the Archive gel to database (see page 8-121) and Open
GeneDirectory (see page 8-125) commands if GeneTools is connected to a database.
GeneTools User Manual
Spots
Spots
Circle
To make the selected rectangular frame circular or all frames circular if All spots same
size is set:
Choose Circle from the Spots menu.
Rectangle
For a Spot blot sample, to make the selected circular frame rectangular or all frames
rectangular if All spots same size is set:
Choose Rectangle from the Spots menu.
GeneTools User Manual
8-127
Menus
For a Manual band quantification sample, to place a rectangular box over a band on
the sample:
1 If it isn’t already selected, choose Position any spot from the Spots menu to
unlock the sample for changing boxes.
2 If it isn’t already selected, choose Rectangle from the Spots menu
3 Use the mouse to drag out the shape of the box you want to add.
When you release the mouse button the box will be drawn in the color for selected
spot frames (you can use Configuration in the Extras menu to set the color) and
labeled with a number showing the order in which the box was added. The
measurement taken from the box will be shown in the Manual band quantification
results table.
See How to adjust the size and shape of spot frames, page 4-21, for how to change the
shape of rectangular frames/boxes on the image.
Free hand
Note
This command only applies to Manual band quantification samples.
To draw a free hand box over a band on a Manual band quantification sample:
1 If it isn’t already selected, choose Position any spot from the Spots menu to
unlock the sample for changing boxes.
2 If it isn’t already selected, choose Free hand from the Spots menu.
8-128
GeneTools User Manual
Spots
3 Move the pointer to the position where you want to start drawing the free
hand box:
4 Press the left-hand mouse button, and keeping it pressed, move the mouse to
draw the outline of the box:
The outline will be labeled with a number showing the order in which it has
been added.
5 When you have completed the outline, release the mouse button. The outline
will be closed and drag boxes placed where the outline changes direction:
GeneTools User Manual
8-129
Menus
After it has been added, you can adjust the overall position of the box by dragging a
point inside the box, or reshape it by dragging the handles on its outline.
All spots same size
To set all the spot frames to the same size and shape as the selected spot frame:
Choose All spots same size from the Spots menu.
The shape and size of all the spot frames will be adjusted to match the selected spot
frame.
While All spots same size is set, if you adjust the size or shape of an individual spot
frame, all the spot frames will be adjusted to match them.
If All spots same size is set when you locate spots automatically, the spot frames placed
on the detected spots will all have the same size; if it is not set, the spot frames will be
sized individually for each spot detected.
Position control points
To unlock the spot frames on a gridded Spot blot image so that you can move or
reshape the grid using control points:
Choose Position control points from the Spots menu.
The spot frames are also unlocked so that you can change their size and (in the case of
rectangular spot frames) shape using the mouse.
The command is checked in the menu and the button is shown as depressed when the
spot frames are unlocked; choose the command or press the button again to lock them.
See Adjusting the positions of all the spot frames in a grid, page 4-26, for how to use
the control points to adjust the grid.
8-130
GeneTools User Manual
Spots
Locate
To locate spots automatically on a non-gridded Spot blot image or to fine-adjust the size
and position of the spot frames on a gridded sample:
1 Choose Locate from the Spots menu to display the Spot Location Tool dialog
box:
The dialog box allows you to set the criteria used for detecting spots:
●
The Area criteria controls set the minimum and maximum size of spots –
spot frames will appear on areas in the image satisfying both the Binary
threshold and Area criteria.
●
The red vertical lines in the Binary threshold control set the lower and
upper boundaries of the range of intensities corresponding to spots in the
image – areas in the image within this range will be marked in blue while
the Spot Location Tool dialog box is open.
2 Set the minimum and maximum areas for spots in the Min Spot Area and
Max Spot Area boxes.
3 Press Apply to set the area criteria without closing the dialog box – spot
frames will appear on areas in the image satisfying both the Binary threshold
and the new Area criteria.
GeneTools User Manual
8-131
Menus
4 Drag the red boundary markers in the Binary threshold control until the
spots, but not the background, in the image are colored blue – as you adjust
the boundaries, the spot frames on the image will show where the spots are
detected.
5 If necessary, repeat Steps 2–5 until the spot frames are accurately positioned
on the spots in the image.
Notes
If All spots same size is not set, the spot frames will be sized optimally for each spot; if
it is set, they will all be set to the size of the largest spot.
For a gridded sample, this procedure allows fine adjustment of the size and position of
the existing spot frames, which must substantially overlap the actual spots on the image.
Position any spot
To unlock the spot frames on a Spot blot or Manual band quantification image so that
you can adjust their size and position (and the shape of rectangular spots) individually,
or delete them all together or individually:
Choose Position any spot from the Spots menu.
When the spot frames are unlocked, the command is checked in the menu and the
button is shown depressed in the toolbar. To lock the spot frames, choose the command
or press the button again.
See How to adjust the spot frame positions, page 4-26, for how to move the spot
frames on the image.
8-132
GeneTools User Manual
Spots
Background correction
To apply or remove background correction to the raw volume measurements from the
image:
1 Choose Background correction from the Spots menu to display the
Background correction dialog box:
2 Choose None, for no background correction, or Automatic or Manual
background correction.
3 If you have selected None or Automatic, press OK to close the dialog box
and set the background correction method.
For Manual background correction, you need to specify areas in the image
from which the background readings should be taken – each spot result is
then corrected by the reading from the background area nearest to it. See
How to apply background correction to results, page 4-35, for details of how
to apply Manual background correction.
Lock position
To lock the spot frames on a sample so that they cannot be moved or resized with the
mouse or, in the case of non-gridded samples, deleted:
Choose Lock position from the Spots menu.
Lock position is checked in the Spots menu and the button is shown as depressed in
the toolbar when the frames are locked.
When the spot frames are locked, you cannot adjust their size, shape or position using
the mouse. However, you can change them between circular and rectangular shapes,
set all to the same size as the selected spot frame using All spots same size, and use
automatic spot location.
GeneTools User Manual
8-133
Menus
To unlock the spot frames:
Choose Lock position from the Spots menu.
If the sample is gridded, either Position control points or Position any spot will
become selected, depending on which was selected before the spot frames were
locked. For non-gridded samples, Position any spot will become selected.
The Spot frames are also unlocked if you choose Position control points or Position
any spot from the Spots menu.
Spot incidence parameters
To define an incidence condition for a Spot blot or Manual band quantification sample:
1 Choose Spot incidence parameters to display the Spot incidence
parameters dialog box:
2 Choose the parameter for which you want to set the incidence condition from
the Incidence type drop-down list box – you can choose Raw vol, % Total
raw vol, Pixel area or Quantity.
3 Choose the comparison operation to be used from the Incidence value range
drop-down list box – you can choose Greater than, Less than or Two-value
range.
8-134
GeneTools User Manual
Spots
If you choose Two-value range, an additional box will appear in the dialog
box so that you can enter two values:
4 Enter the value(s) to be used for the comparison in the Incidence value
(Upper incidence value and Lower incidence value) box(es).
Or:
a Click in a spot/box on the image to select it.
b Press Get spot value to transfer the Incidence type value for the selected
spot/box to the incidence value box.
5 Press Apply to set the incidence condition without closing the Spot incidence
parameters dialog box (you will be able to view the effect if the Incidence
page is shown in the Results/Incidence/Calibration Graph pane).
Press OK to set the incidence condition and close the Spot incidence
parameters dialog box.
You can view the incidence matrix in the Incidence page in the Results/Incidence/
Calibration Graph pane at the bottom of the Spot blot/Manual band quantification
window – see page 6-32.
GeneTools User Manual
8-135
Menus
Delete
To remove a spot/box from a non-gridded Spot blot or Manual band quantification
sample:
1 If it isn’t already selected, choose Position any spot from the Spots menu to
unlock the sample for changing boxes.
2 Click in the box to select it.
3 Either:
Choose Delete from the Spots menu.
or
Press c.
After the box has been removed, the numbers labeling the remaining spots/boxes will
be changed so that they are still consecutive.
Delete all
To remove all the spots/boxes from a non-gridded Spot blot or Manual band
quantification sample:
1 If it isn’t already selected, choose Position any spot from the Spots menu to
unlock the sample for changing boxes.
2 Choose Delete all from the Spots menu.
8-136
GeneTools User Manual
Spots
Assign quantity
To assign a quantity to a spot or box to calibrate quantity measurements from other
spots or boxes:
1 Click on the spot frame or box for the spot or band to which you want to
assign a quantity.
2 Choose Assign quantity from the Spots menu to display the Assign
calibrated quantity dialog box:
3 Enter the known quantity for the spot or band in the Calibrated quantity
box.
4 Press OK to close the dialog box and set the calibration.
After you have assigned a quantity to a spot frame or box:
●
The calibrated spot or box will be marked with a cross:
GeneTools User Manual
8-137
Menus
or
●
The Quantity calibration page in the Spot blot/Manual band quantification
window’s Graphics pane will show the calibration points and the selected calibration
curve joining them (see the entry for Quantity calibration in the Edit (Spot blot)
menu, page 8-56, for how to select the units and shape of calibration curve: the
example shows a quadratic calibration curve – the equation of the curve is given in
the Raw volume axis label):
Unassign quantity
To remove a quantity calibration from a spot frame or box:
1 Click on the spot frame or box from which you want to remove a quantity
assignment.
2 Choose Unassign quantity from the Spots menu.
8-138
GeneTools User Manual
Extras
Extras
User name
To enter, view or change the program user’s name, or to delete a user’s name from the
list of users:
1 Choose User name from the Extras menu to display the User name dialog
box:
2 Select a user name from the drop-down list box or enter a new name.
3 To remove the selected user’s name from the list of users, press Remove User
and repeat Step 2; otherwise go on to Step 4.
4 Check Show this dialog when program starts to display the program when it
starts up so that you can select the user.
The user name appears in printed reports.
Configuration
To edit or view configuration settings for the program:
Choose Configuration from the Extras menu to display the General page of
the Configuration dialog box.
GeneTools User Manual
8-139
Menus
On the General page:
●
Enter the name of your Laboratory. This will appear at the top of each page in
printed reports.
●
Enter a Heading to appear on the top of each page in printed reports.
●
Enter the Number of recent files that you want to appear listed on the File menu
so that you can open them without using the Open command.
●
Choose whether to set the Default analysis type to be Gel, Colony (pour plate),
Spot blot, Manual Band Quantification or High Throughput Gel (you can always
override the default in the Sample properties dialog box if required). This will be
the type selected in the Sample properties dialog box when you:
●
8-140
●
open an unanalyzed image (a secure sample file that has been saved in the
capture program but has not yet been saved in GeneTools).
●
create a new secure sample file (for example, from a non-secure .tif or .bmp
image file).
The Display font box shows the font currently selected for presenting data in the
Gel window’s Track label and Peak value panes. Press Font to display a standard
Windows Font dialog box to select another font.
GeneTools User Manual
Extras
●
Auto match peaks is permanently selected in this version of GeneTools – if the
GeneTools matching feature is installed, matching is always carried out automatically
when appropriate.
●
Check Auto locate tracks if you want automatic track detection to be selected by
default when unanalyzed images are opened.
●
Check Auto import methods if you want to import the settings selected on the
Import tab from the file selected on the Import tab when you:
●
open an unanalyzed image (a secure sample file that has been saved in the
capture program but has not yet been saved in GeneTools).
●
create a new secure sample file (for example, from a non-secure .tif or .bmp
image file).
See the instructions for the Import page later in this section for how to choose what
settings are imported.
Note
You can also import methods to an existing secure sample file – see the entry for
Import method in the File menu (page 8-15).
●
Check Auto locate peaks if you want to automatically detect the peaks on a track
when its geometry is changed. This happens, for example, when you change the
number of tracks (for example when you first assign a number of tracks to a sample)
or change a track’s position or width. It is recommended that this option is kept
turned on in normal usage.
GeneTools User Manual
8-141
Menus
On the Import page:
When you open an unanalyzed secure sample file or create a new secure sample (for
example, from a non-secure .tif or .bmp image file), you can choose to import settings
automatically from another sample file – this page allows you to choose which settings
to import and the default file from which to import the settings.
●
Note
Press Browse to display a standard Windows Open dialog box so that you can select
a file from which to import settings. The File name box shows the currently selected
file.
The check boxes are disabled if no file is selected.
●
Check Molecular weight stds. to import the molecular weight standard tracks and
molecular weight assignments from a saved sample file.
For example, if tracks 1 and 5 in the saved file are molecular weight standards, any
previous molecular weight assignments will be removed from the selected sample
and tracks 1 and 5 will become molecular weight standards.
If peaks 3, 5 and 7 in track 1 of the saved file have assigned molecular weights,
peaks 3, 5 and 7 in track 1 of the selected sample will be assigned the same
molecular weights.
8-142
GeneTools User Manual
Extras
Note
●
Check Sample and track settings to import the electrophoresis direction, image
type, number of tracks and track positions from a saved sample file.
●
Check Spot blot settings to import the number, shape and positions of the spot
frames from a saved spot blot sample file.
●
Check Report settings to import the report setup from a saved sample file.
The controls on this dialog box are also displayed with their current settings in the
dialog boxes that are displayed (a) when you choose Import method from the File
menu to import settings from a file to the sample in the currently selected Gel window,
and (b) if Auto import methods on the General page is checked, when you open an
unanalyzed file or create a new secure sample file (for example, from a non-secure .tif
or .bmp image file).
Changing the settings in any of these dialog boxes changes them in all of them.
On the Colors page:
1 Select the program component for which you want to change the color or
style from the Line type scroll box.
The current color and style setting of the selected component will be
illustrated in the Sample box.
GeneTools User Manual
8-143
Menus
2 Press Color to display a dialog box allowing you to select a new color for the
selected program component.
3 Choose a new line style for the program component selected in the Line type
scroll box from the Style drop-down list box.
You can set the color of the following components in the program using the Colors
page in the Configuration dialog box:
8-144
Rf start and end lines
in the Image pane
Track pattern (image)
the track boundary lines in the Image pane
Selected track pattern (image)
the selected track’s boundary lines in the
Image pane
Peak assigned as standard
peaks in the Image pane used for molecular
weight or quantity calibration
Track region
area of interest in the Image pane
Select track region
selected area of interest in the Image pane
Peak bounds (profile)
in the Profile pane
Selected peak bounds (profile)
in the Profile pane
Peak markers (image)
in the Image pane
Peak bounds (image)
in the Image pane
Selected peak (image)
in the Image pane
MW graph
in the Graphics pane
MW standard markers
in the Graphics pane when a molecular
weight standard track is selected
Quantity calibration graph
in the Graphics pane
Quantity calibration markers
in the Graphics pane
Selected peak match line
the match line shown in the Image pane for
the match peak selected in the Peak value
pane
Match peak line
in the Image pane
Matching profile
in the Profile pane
Dendrogram leaf
in the Graphics pane
Dendrogram node
in the Graphics pane
GeneTools User Manual
Extras
Spot blot
on the Spot blot image
Selected Spot blot
on the Spot blot image
Spot blot positioning point
on the Spot blot image
Colony frame
in the colony counting window
Colony shapes
in the colony counting window
Colony class 1 markers
in the colony counting window
Colony class 2 markers
in the colony counting window
Colony manual markers
in the colony counting window
Colony exclude outline
in the colony counting window
Colony exclude fill
in the colony counting window
Manual baseline
in the Profile pane
Profile comparison reference
in the Profile comparison window
Profile tracks 1–12
in the Profile comparison window
On the Molecular Weight page:
GeneTools User Manual
8-145
Menus
1 Enter a new path and name in the File name box or press Browse to display
a standard Windows Open dialog box to choose a new default molecular
weight library.
2 Click on the Linear or Logarithmic radio button to choose the type of scale
to be used for the calibration graph shown in the MW calibration tab in the
Graphics pane.
Save sample defaults
To save the settings you have selected for the selected Sample window as the defaults
to be used for new samples of the same type (fluorescence or absorption):
Choose Save sample defaults from the Extras menu.
See the next command for how to apply the sample defaults to the sample in a Sample
window. Separate sample defaults are saved for each user.
Load sample defaults
To load your default settings for the type of sample in the selected Sample window (see
the previous command for how to save sample defaults):
Choose Load sample defaults from the Extras menu.
Window
8-146
GeneTools User Manual
Window
New window
To open a new window with the same contents as the currently selected window:
Choose New window from the Window menu.
You can use New window to create a new Profile comparison window or a new
Molecular weight library window.
Cascade
To resize and arrange the open (non-minimized) windows so that they are overlapping
with their title bars visible:
Choose Cascade from the Window menu.
Tile
To resize the open (non-minimized) windows so that they are non-overlapping and fill
the main window space:
Choose Tile from the Window menu.
Arrange icons
To tidy up the icons representing minimized windows:
Choose Arrange Icons from the Window menu.
Windows open in GeneTools
To select one of the open windows:
Choose the window’s name from the list at the bottom of the Window menu.
GeneTools User Manual
8-147
Menus
Help
Help topics
To open the contents window for the on-line Help system:
Choose Help topics from the Help menu.
About GeneTools
To display information about the version of GeneTools that you are using:
Choose About GeneTools from the Help menu to display the About
GeneTools dialog box.
This dialog box also shows the serial number of your copy of the program.
Image pane and Profile context menus
The commands in the menu displayed when you right-click on a peak in the Image
pane or the Profile pane in a Gel window are equivalent to the similarly named
commands in the Peak menu (Delete is equivalent to Delete®Selected peak(s)) or
Track menu (Properties gives the properties of the selected peak, not the track
properties) – see the entries in the Peak menu (page 8-104) and Track menu (page
8-72) sections for details.
8-148
GeneTools User Manual
Track label context menu
Track label context menu
Apart from Active matching standard, the commands in the menu displayed when you
right-click on a label in the Track label pane are equivalent to the similarly named
commands in the Track menu.
Active matching standard
Notes
Active matching standard has no effect if there is only one matching standard track.
This command is only relevant when the matching Type selected in the Matching
parameters dialog box (See Band matching, page 8-53) is Band; you do not need to
define an active matching standard for Profile matching.
To make a matching standard track the active matching standard for the selected area of
interest:
1 Right-click on the track’s label in the Track label pane to select it and pop up
a menu.
2 Choose Active matching standard from the menu.
The track label will show MS* – the MS means it is a matching standard, the * means it
is the active matching standard (the previous active matching standard will now show
MS to show that it is still a matching standard but no longer the active matching
standard).
If you choose Active matching standard again, the other matching standard with the
highest track number is made the active matching standard.
GeneTools User Manual
8-149
Menus
Peak value pane context menu
Delete
To remove a molecular weight assignment from a peak on a molecular weight standard
track:
1 Choose Molecular weight from the View menu or click on the MW
calibration tab in the Graphics pane.
2 Select the required molecular weight standard track – the molecular weight
assignments will be shown in the Peak value pane.
3 Right-click on the molecular weight assignment in the Peak value pane that
you want to remove to select the peak and display the Peak value pane
context menu.
4 Choose Delete.
Graphics pane context menu
Maximize pane on the menu displayed when you right-click in the Graphics pane is
equivalent to the same command in the View menu if the Graphics pane is selected.
Scale to fit only appears on the menu if the Dendrogram page is selected in the
Graphics pane.
Scale to fit
To scale the dendrogram so that it all fits within the Graphics pane:
1 Right-click on the dendrogram in the Graphics pane to pop up the Graphics
pane context menu.
2 Choose Scale to fit.
8-150
GeneTools User Manual
Gel window Results pane context menu
Save to clipboard
To copy the currently displayed contents of the Graphics pane to the clipboard:
1 Right-click in the Graphics pane to pop up the Graphics pane context menu.
2 Choose Save to clipboard.
The contents of the Graphics pane will be copied as an enhanced metafile.
Gel window Results pane context menu
The Gel window Results pane context menu is displayed when you right-click on the
Results pane if it is showing Results for selected track, Results for all tracks or
Matching comparisons.
Maximize pane on the Gel window Results pane context menu is equivalent to the
same command in the View menu if the Results pane is selected.
Result table commands
To decide whether or not to include a column for a quantity in a results table:
1 Click on the tab for the table to display it.
2 Right-click in the table to display the Gel window Results pane context menu.
3 Choose the command corresponding to the quantity.
GeneTools User Manual
8-151
Menus
4 Repeat for any other quantities.
The commands are checked in the menu when the columns are displayed.
Profile comparison window context menu
The Profile comparison window context menu is displayed when you right-click on a
track in the Track browser pane in the Profile comparison window: all the commands
in the menu are equivalent to the similarly named commands in the Profile or
Matching menus.
See Profile comparison window, page 6-18, for more information about the Profile
comparison window.
Spot blot/Manual band quantification window Image pane
context menu
The Spot blot/Manual band quantification window Image pane context menu is
displayed when you right-click on the image pane in a Spot blot/Manual band
quantification window. Set radius is described below; the other commands in the menu
are equivalent to the similarly named commands in the Spots menu.
Set radius
To change the radius of one or all of the spot frames on a Spot blot image:
1 If the sample is locked, choose Lock position from the Spots menu to unlock
the sample.
8-152
GeneTools User Manual
Spot blot/Manual band quantification window Image pane context menu
2 Click on the spot frame that you want to adjust to select it – click on any
circular frame if you want to adjust them all.
3 Right-click in the image pane and choose Set radius from the context menu
displayed to display the Set spot radius dialog box:
4 Check Set all spots if you want to change the radius of all the (circular) spot
frames; uncheck it if you just want to change the radius of the selected spot
frame.
Note
The initial Set all spots setting is fixed by the setting of the All spots same size
command in the Spots menu. If you change the setting of Set all spots in the dialog
box, All spots same size will be set or unset accordingly when you close it.
5 Use the arrow buttons to set the new radius.
6
Press OK to close the dialog box and set the new radius.
See Adjusting the size of circular spot frames, page 4-22, for how to change the spot
radius using the mouse.
GeneTools User Manual
8-153
Menus
Spot blot/Manual band quantification window Results pane
context menu
The Spot blot/Manual band quantification window Results pane context menu is
displayed when you right-click on the Results pane.
Result table commands
You use the commands at the top of the menu to choose what to display in the results
table.
To decide whether or not to include a column for a quantity in the results table:
1 Click on the Spot blot results tab.
2 Right-click in the table to display the Spot blot/Manual band quantification
window Results pane context menu.
3 Choose the command corresponding to the quantity.
4 Repeat for any other quantities.
The commands are checked in the menu when the columns are displayed.
8-154
GeneTools User Manual
Spot blot/Manual band quantification window Quantity calibration context menu
Table 1D/Table 2D
If the sample is gridded (see Step 3 on page 4-4), you can choose whether to display
the results in a one- or two-dimensional table.
To choose whether to display Spot blot results in a one- or two-dimensional table:
1 Click on the Spot blot results tab.
2 Right-click in the table to display the Spot blot/Manual band quantification
window Results pane context menu.
3 Choose Table 1D or Table 2D.
The selected command will become checked in the menu.
In a one-dimensional table, the results for the first row of spots are given first, then the
second row and so on.
Note
If the sample is non-gridded, the spots are numbered in the order you added the spots
and the results are always displayed in this order in a one-dimensional table – selecting
Table 2D has no effect.
Spot blot/Manual band quantification window Quantity
calibration context menu
The Spot blot/Manual band quantification window Quantity calibration page context
menu is displayed when you right-click on the Quantity calibration page.
Note
Maximize pane is permanently disabled in this menu.
Save to clipboard
To copy a picture of the Spot blot/manual band quantification quantity calibration graph
to the clipboard:
1 Right click in the Quantity calibration page in the Spot blot/Manual band
quantification window to display a context menu.
GeneTools User Manual
8-155
Menus
2 Choose Save to clipboard.
Molecular weight library context menu
The commands in the menu displayed when you right-click on a standard in a
Molecular weight library window are equivalent to the similarly named commands in
the Edit menu (in the Edit menu the command names have ‘Standard’ appended: for
example, New is equivalent to New Standard in the Edit menu).
Colony counting exclude region
The Colony counting exclude region context menu is displayed when you right-click in
an exclude region on a colony counting image when the Adjust exclude region(s) radio
button is selected in the Define frame box at the top left-hand corner of the Colony
counting window.
To delete one or more existing exclude regions on a Colony counting image:
1 Click on the Adjust exclude region(s) radio button in the Define frame box
at the top left-hand corner of the Colony counting window.
2 Click in the first exclude region that you want to delete. Drag handles will
appear on the boundary of the exclude region to show it is selected.
3 SHIFT-click on any other exclude regions that you want to delete.
Note
You can also select several exclude regions by dragging a rectangle on the image – any
exclude regions with areas within the rectangle will be selected.
4 Right-click in any of the selected exclude regions to pop up a menu.
5 Choose Delete selected exclude region.
All the selected exclude regions will be deleted.
8-156
GeneTools User Manual
Index
!
.bmp
.sgd
.tif
1-11, 4-6–4-8, 8-2–8-7
1-1–1-2
1-11, 4-6–4-8, 8-2–8-7
A
About GeneTools
8-148
Absorption
8-30, 8-32, 8-34
Acquire (Twain)
1-13–1-14, 4-8–4-9, 8-13
Acquisition notes
8-38
Active matching standard
1-109, 6-4, 8-149
Adding peaks 1-61–1-64
Adding tracks 1-26–1-30
Align banks of tracks
8-65
All peaks same width 1-52, 8-46
All spots same size
4-21–4-22, 8-127–8-128, 8-130, 8-132
button
7-10
All tracks to a single curve
8-53
Analysis notes 8-39
Analysis type 8-29–8-35
Analyzed files 1-1–1-2, 8-8, 8-10
Archive gel to database 8-121–8-125
button
7-8
Area criteria
8-131
Area of interest 1-5–1-134, 8-4, 8-6, 8-36, 8-52
Arrange Icons 8-147
Assign from standard
1-82, 8-106–8-107
Assign molecular weight
8-104–8-110
Assign quantity 1-77–1-78, 4-34–4-35, 8-110–8-112, 8-137–8-138
button
7-7, 7-12
GeneTools User Manual
Index-1
Index
Assign value to peak
1-82, 8-106–8-107
Assigning molecular weights and quantities
Auto import methods 1-14, 4-9, 8-141
Auto locate peaks
1-60, 8-141
Auto locate tracks
1-24–1-25, 8-141
Auto match peaks
8-141
Automatic import
1-16–1-18, 4-11–4-13
1-79–1-83
B
Background correction (Spots) 4-35–4-37, 8-133
button
7-11
Background correction (tracks) 1-51–1-59, 8-45–8-50, 8-90–8-94
Band matching 1-105–1-106, 1-117, 1-123–1-127, 1-129, 6-23–6-25, 8-53–8-55,
8-95–8-96
button
7-9
editing matches
1-110–1-111
setting method and tolerance
8-53–8-55
viewing results
1-112–1-114, 1-117
Baseline correction
1-51–1-58, 8-45–8-50, 8-90–8-94
Baseline offset 1-55, 8-49
Binary threshold
8-131–8-132
bmp images
1-11–1-13, 4-6–4-8, 8-2–8-7
Box
removing 8-136
Browser
1-12–1-13, 4-7–8-10
C
Calibrations toolbar
7-7–7-8
Cascade
8-147
Change password
1-100, 8-42
Circle 4-18, 4-22, 8-127
button
7-12
Circular spot frames
4-18–4-19
adjusting size
4-22, 4-24
changing to rectangular
4-22
Close 8-11
Colony counting sample file
Index-2
GeneTools User Manual
Index
creating
8-5, 8-7
Sample properties 8-31–8-32
Colony counting window
6-26–6-27
Colors 8-143–8-145
Combine all standards 1-76, 8-51
Configuration 8-139–8-146
Connect to database
8-126
button
7-9
Context-sensitive Help button 7-2
Copy 8-44
Copy to clipboard
8-100
Copying a picture of an image to the clipboard
Cut
8-44
1-133–1-134, 4-44
D
Dark colonies 8-31
Database menu
8-120–8-126
Database toolbar
7-8–7-9
Default analysis type
8-140
Default molecular weight library 1-98–1-104, 8-146
Delete 4-21, 8-136, 8-150
All peaks on all tracks
8-113
All peaks on selected track 8-113
Selected peak(s)
8-113
Delete (track) 1-30, 8-99
Delete all
4-21, 8-136
Delete manual baseline 1-59, 8-94
Delete selected exclude region 8-156–8-157
Delete standard
1-104–1-105, 8-61
Deleting peaks 1-67–1-68
Dendrogram
1-115–1-117, 1-127, 6-10–6-13, 6-25, 8-67–8-68
description 6-10–6-13
references 6-10
Description (track)
1-47–1-48, 8-100–8-101
Description pane
6-4
Detection filter 1-53, 8-47
Dice 1-108, 1-114, 8-55, 8-119
Disable (track) 1-47, 8-100
GeneTools User Manual
Index-3
Index
Display corrected profiles
Display font
8-140
8-65
E
Each track to separate curves
8-53
Edit calibration 8-108
Edit manual baseline
1-56–1-59, 8-90–8-93
Edit molecular weight standard 1-101–1-102, 8-58–8-59, 8-109
Edit standard 1-102–1-103, 8-59–8-61, 8-109
Electrophoresis direction
8-30
Enable (track) 1-47, 8-100
Enter password dialog box
8-41
Excel 1-130–1-131, 4-42–4-43, 8-16–8-17
Exclude all
1-125, 6-24, 8-120
Exit
8-40
Experiment
creating new
8-124
Export table to Excel
1-130, 4-42, 8-16–8-17
button
7-3
Export To Excel 8-116
Export to Word
1-132–1-133, 8-18
button
7-3
Exporting data to a GeneDirectory database
8-121–8-125
F
File formats
1-1–1-2
Fluorescence 8-30, 8-32, 8-34
Folder
creating new
8-124
Free hand
button
7-12
G
Gamma correction
6-33
Gel
archiving 8-121–8-125
Index-4
GeneTools User Manual
Index
Gel analysis
copying a picture of an image to the clipboard
creating a report in Word
1-132–1-133
exporting results to Excel
1-130–1-131
printing results
1-127–1-129
Sample properties 8-30–8-31
saving results to CSV
1-131–1-132
Gel sample file
creating
8-4–8-5, 8-7
import settings
1-14–1-20
opening
1-2–1-10, 1-12–1-13
saving
1-20–1-21
Gel window
6-2–6-16
GeneDirectory
opening
8-125
GeneSnap
1-1
Graphics pane 1-89, 1-115–1-117, 6-7–6-13
Gridded Spot blot sample
4-4, 8-33
changing the shape of the grid
4-29, 4-31
creating
8-7
moving the grid
4-27
positioning point
4-26–4-31
scaling and rotating the grid 4-27–4-29
1-133–1-134
H
Heading
8-140
Height individual
8-73
Help topics
8-148
Hide all (profile)
1-120, 6-21, 8-116
High Throughput Gel Sample file
creating
8-6
High Throughput Gel
Align banks of tracks
6-5, 8-65
automatic track and peak location 6-6
Gel windows
6-2–6-16
manual matching 6-16
Sample properties 8-35–8-39
Histogram
6-34–6-35, 8-64
GeneTools User Manual
Index-5
Index
I
Image brightness
6-33
Image contrast 6-33
Image controls 6-33–6-36
Image pane
6-4–6-6, 6-29–6-30
Import method 1-17–1-20, 4-11–8-16
Incidence
4-39–4-40, 6-32, 8-134–8-135
Include all
1-125, 6-24, 8-119
Include selected in matching
1-125, 6-24, 8-120
Information
8-37
Insert (track)
1-27–1-28, 8-96–8-99
Integration parameters 1-51–1-55, 8-45–8-50
button
7-7
Intensity range 1-49
Interpolate between standards 1-76, 8-52
Invert profile 8-90
J
Jaccard
1-108, 1-114, 8-55, 8-119
L
Laboratory
8-140
Library properties
1-95
Light colonies 8-31
Linear 1-74, 8-53, 8-56
Linear through origin
1-74, 8-53, 8-56
Load Sample defaults 8-146
Locate (peaks)
On all tracks
8-113
On selected track 8-113
Locate (spots) 4-16–4-17, 8-131–8-132
button
7-11
Locate tracks 1-25, 8-73
button
7-4
Locating peaks 1-59–1-64
Locating peaks automatically
1-60–1-61
Index-6
GeneTools User Manual
Index
Lock 1-99, 8-41–8-42
Lock all
1-25–1-26, 8-74
button
7-4
Lock position 4-32, 8-133–8-134
button
7-11
Log piecewise linear
1-75, 8-51
Log-linear fit
1-75, 8-51
Lowest slope 1-53–1-55, 8-48–8-49
M
Madge Sample file
creating
8-7
Manual band quantification
6-28–6-33
Manual band quantification results
6-31–6-33
Manual band quantification sample file
Sample properties dialog box
8-5, 8-7, 8-34
Manual baseline
1-56–1-59, 8-90–8-94
Match lines
1-110, 8-66
Matching matrix
1-113–1-114, 6-14–6-16
Matching comparisons 1-112–1-113, 6-14–6-16
Matching parameters
1-107–1-109, 8-53–8-55
Profile comparison window 1-124
Matching peaks
8-53–8-55
Matching reference track
Profile comparison window 1-126
Matching results
Profile comparison window 1-126–1-127
Matching standard
1-109–1-110, 6-3, 8-95–8-96
button
7-10
Matching tracks
editing matches
1-110–1-111
Gel sample window
1-105–1-106, 1-117, 8-95–8-96
Profile comparison window 1-123–1-127, 6-23–6-25
selecting which tracks to include 1-125
viewing results
1-112–1-114, 1-117
Matching
8-67–8-68
Max Spot Area 8-131
Maximize pane
1-91, 1-112, 6-3, 8-68, 8-150–8-151
GeneTools User Manual
Index-7
Index
Min Spot Area 8-131
Minimum peak height 1-52, 8-46
Minimum peak volume 1-52, 8-46
Minimum peak width 1-52, 8-46
Molecular weight
1-90, 8-67
Molecular weight calibration
1-75–1-76, 8-50–8-52
button
7-7
Molecular weight calibration graph
1-88, 6-8
scale
1-98–1-104, 8-146
Molecular weight configuration settings 1-98–1-104
Molecular weight libraries
1-92–1-97, 1-105
creating
1-94
locking/unlocking 1-99–1-100, 8-41–8-42
opening
1-97
passwords 1-100, 8-42
saving
1-96–1-97
Molecular weight library
default
1-98–1-104
Molecular weight library window
1-93–1-94, 6-17–6-18
closing
1-94
Molecular weight standard tracks
8-122
Molecular weight standards
creating
8-57–8-59
deleting
8-61
editing
8-59–8-61
renaming 8-61–8-62
Molecular weight stds. 8-142
Molecular weight/quantity standard tracks
1-79–1-83
Molecular weight/quantity standards
creating
1-100–1-102
deleting
1-104–1-105
editing
1-102–1-103
renaming 1-104
Molecular weights
assigning 1-79–1-83, 8-94–8-95, 8-104–8-110
calibration 1-72–1-116
propagation
1-76, 8-51–8-52
reassigning molecular weights
1-85–1-87
removing assignments
1-84–1-85, 8-112, 8-150
viewing
1-87–1-92, 8-107–8-108
Index-8
GeneTools User Manual
Index
Move/tilt
1-35–1-39, 8-78–8-84
button
7-5
Moving peak bounds
1-70–1-71
Moving peaks 1-68–1-70
MW 8-71
MW calibration page
8-108–8-109
MW/quantity standard 1-79–1-83, 6-3, 7-8, 8-94–8-95
button
7-8
N
Neighbor Joining
1-108, 1-115–1-117, 6-12, 8-55, 8-119
New (Import) 1-11, 8-2–8-7
New Experiment
8-124
New Folder
8-124
New library
1-94, 8-13–8-14
New standard 1-100–1-102, 8-57–8-59, 8-109–8-142
New window 8-147
No propagation
8-111
Non-secure image
creating secure Sample file from
1-11–1-13, 4-6–4-8
Number of recent files 8-140
O
Offset 1-55, 8-49
Open 1-2–1-10, 4-2–4-5, 8-8–8-9
button
7-1
Open GeneDirectory 8-125
button
7-9
Open library 1-97, 8-14
P
Panes
changing the size of
Parameters
8-118–8-119
Paste 8-44
Peak bounds 8-66
GeneTools User Manual
6-3
Index-9
Index
moving peak bounds
1-70–1-71
Peak markers 8-65
Peak matching toolbar 7-9–7-10
Peak matching 1-105–1-106, 1-117, 1-123–1-127, 6-23–6-25, 8-95–8-96
editing matches
1-110–1-111
setting method and tolerance
1-107–1-109, 8-53–8-55
viewing results
1-112–1-117
Peak numbers only
8-67
Peak properties
1-71–1-72, 8-114
Peak value pane
1-90, 6-6–6-7
Peaks
adding manually
1-63–1-64
adding semi-automatically 1-61–1-62
deleting
1-67–1-68
locating
1-59–1-64
locating automatically
1-60–1-61
moving
1-68–1-70
selecting
1-64–1-67
working with
1-59–1-72
Plot mode
8-71
Position all
1-30–1-32, 8-74–8-76
button
7-4
Position any spot
8-132
button
7-11
Position control points 8-130
button
7-10
Positioning point
4-26–4-31, 6-30
Print 8-27
button
7-3
Print preview 1-129, 8-26–8-27
button
7-2
Printer Setup 8-19–8-20
Printing
1-127–1-130, 4-41–4-42
Profile comparison
1-117–1-127, 1-130, 8-63–8-64
button
7-8
printing
1-129–1-130
Profile comparison window
1-117–1-127, 1-129–1-130, 6-18–6-26
changing scale
1-123
Exclude all 8-120
Export to Excel
1-131, 8-116
Index-10
GeneTools User Manual
Index
Hide all
8-116
Include all 8-119
Include selected in matching
8-120
Matching parameters
8-118–8-119
matching results
6-25
matching tracks
1-123–1-127, 6-23–6-25
MW
8-71
RF 8-71
selecting tracks
6-20–6-21
setting a reference track
6-22–6-23, 8-115
Show
8-115
Show all
8-116
viewing profiles
6-21–6-22
viewing tracks
6-20
Profile matching
1-105–1-106, 1-123–1-127, 6-23–6-25
setting method and tolerance
8-53–8-55
viewing results
1-112–1-114, 1-117
Profile pane
6-6
Propagate by peak number
8-111
Propagate by Rf
8-111
Properties (molecular weight library)
1-95, 8-43
Properties (peaks)
1-50, 1-71–1-72, 8-103
Properties (track)
1-49–1-50, 6-25–6-26, 8-102–8-103, 8-116–8-117
Q
Quadratic
1-74, 8-53, 8-56
Quantities
1-90, 8-67
Quantity calibration
4-33, 8-52–8-53, 8-56–8-57
button
7-7, 7-12
method
1-73–1-74
units
1-73–1-74
Quantity calibration graph
1-89–1-90, 6-9–6-10
Quantity calibration page
4-34, 6-32–6-33, 8-111–8-112, 8-138
Quantity measurements
Gel analysis
1-76–1-83, 8-110–8-112
calibration
1-72–1-116
reassigning assignments 1-85–1-87
removing assignments
1-84–1-85
units
1-73–1-74
GeneTools User Manual
Index-11
Index
viewing results
Spot blot analysis
1-87–1-92
4-33–4-35
R
Reassigning molecular weights 1-85–1-87
Reassigning quantities 1-85–1-87
Recently used files
8-28
Rectangle
4-19, 4-22, 8-127–8-128
button
7-12
Rectangular spot frames 4-19–4-20
adjusting size and shape
4-24–4-26
changing to circular 4-22
Reference (profile)
1-122, 1-126, 6-23, 8-115
Rename standard
1-104, 8-61–8-62
Report settings 1-20, 8-143
Report setup 1-127–1-129, 4-41, 8-20–8-26
button
7-2
Report toolbar 7-2–7-3
Reset brightness
6-33
Reset contrast 6-33
Reset gamma correction
6-34
Result table commands 8-151–8-152, 8-154
Results for all tracks
1-91, 6-14–6-16
Results for selected track
1-92, 6-14–6-16
Results pane
1-91–1-92, 1-112–1-115, 6-14–6-16
Rf
8-71
Rf end position 1-43, 8-86–8-90
button
7-5
Rf start position
1-43, 8-86–8-90
button
7-5
Rolling disk
1-55, 8-49
S
Sample and track settings
1-18, 1-20, 4-12, 8-143
Sample properties
8-3–8-7, 8-28–8-39
button
7-2
Save 1-21, 1-96, 4-15, 8-11
Index-12
GeneTools User Manual
Index
button
7-1
Save as
1-21, 1-96, 4-15–4-16, 8-11–8-12
Save results to CSV file 1-131–1-132, 4-43–4-44, 8-17–8-18
button
7-3
Save sample defaults
8-146
Save to clipboard
1-133–1-134, 4-44, 8-19
button
7-3
Savitsky-Golay filter
1-52, 1-56, 8-46, 8-50
Scale to fit
1-116, 6-12, 8-150
Secure sample file
1-1–1-2
opening
1-2–1-10, 1-12–1-13, 4-2–4-5, 4-7–4-8
saving
1-20–1-21, 4-15–4-16
Select Source (Twain) 1-13–1-14, 4-8–4-9, 8-12–8-13
Selecting peaks 1-64–1-67
Set all spots
4-24, 8-153
Set radius
4-24, 8-152–8-153
Show (profile) 1-120, 6-21, 8-115
Show all (profile)
1-120, 6-21, 8-116
Similarity Coefficient
1-108, 8-54, 8-119
Similarity matrix
1-114–1-115, 1-126, 6-14–6-16, 6-25
Splay all
1-32–1-34, 8-76–8-78
button
7-5
Spot
removing 8-136
Spot blot analysis
4-1–4-22, 4-24–4-44, 6-28–6-33
copying a picture of an image to the clipboard
4-44
Sample properties 8-32–8-33
Spot blot results
6-31–6-33
exporting to Excel 4-42–4-43
printing
4-41–4-42
saving to CSV
4-43–4-44
viewing
4-34, 4-37–4-39
Spot blot Sample file
creating
8-5, 8-7
import settings
4-9–4-14
opening
4-2–4-5, 4-7–4-8
saving
4-15–4-16
Spot blot settings
8-143
Spot blot toolbar
7-10–7-12
Spot blot/Manual Band Quantification window 6-28–6-33
GeneTools User Manual
Index-13
Index
Spot frame labels
6-29
Spot frames
adding
4-18–4-21
adding a copy
4-20–4-21
adjusting positions 4-26–4-31
adjusting size and shape
4-21–4-22, 4-24–4-26
all spots same size 4-21–4-22
removing 4-21
selecting
6-29
Spot incidence parameters
4-39–4-40, 8-134–8-135
button
7-11
Spot numbers 4-32, 8-70
Standard toolbar
7-1–7-2
Status bar
8-69
SynGene Gel document
1-1–1-2
T
Table 1D
4-38, 6-31, 8-155
Table 2D
4-38, 6-31, 8-155
tiff images
1-11–1-13, 4-6–4-8, 8-2–8-7
Tile
8-147
Tolerance
8-55, 8-111, 8-119
Toolbar buttons on menus
8-69
Toolbars
7-1–7-12
hiding
7-1
showing
7-1
Toolbars submenu
8-68
Track borders 1-53, 8-47
Track label pane
6-3–6-4
Track properties
1-49–1-50
Track toolbar 7-4–7-5
Tracks 8-66
adjusting height
8-73
adjusting the Rf start and end lines 1-43–1-47, 8-86–8-90
adjusting track splay
1-32–1-34, 8-76–8-78
adjusting width
1-40–1-42, 8-73, 8-84–8-85
bending an individual track 1-35, 1-38–1-40, 8-78–8-79, 8-81–8-84
deleting
1-30, 8-99
enabling and disabling
1-47
Index-14
GeneTools User Manual
Index
locating automatically
1-24–1-25
locking/unlocking 1-25–1-26, 8-74
moving an individual track 1-35–1-36, 8-78–8-80
overall positioning 1-30–1-32, 8-74–8-76
overview of placing and positioning 1-22–1-23
placing individual tracks on a Sample
1-26–1-30, 8-96–8-99
tilting an individual track
1-35, 1-37–1-38, 8-78–8-81
Twain 1-13–1-14, 4-8–4-9
U
Unanalyzed files
1-1–1-2, 8-9–8-10
Unassign molecular weight
1-84–1-85, 8-112
Unassign quantity
1-84–1-85, 8-112–8-113, 8-138
Undo 8-44
Units 1-73–1-74
Unlock
1-99, 8-41
UPGMA
1-108, 1-115–1-116, 6-11, 8-55, 8-119
Use another track set as standard
1-74, 8-52
Use nearest standard
1-76, 8-51
User name
8-139
W
Width 1-40–1-42, 8-84–8-85
button
7-5
Width individual
1-41, 8-73
Windows open in GeneTools
8-147
Word 1-132–1-133
Z
Zoom in
button
Zoom out
button
Zoom reset
button
Zoom toolbar
1-123, 8-64
7-6
1-123, 8-64
7-6
1-123, 8-64
7-6
7-6
GeneTools User Manual
Index-15
Index
Zymer Gel
Index-16
8-90
GeneTools User Manual